Abstract
Objective:
Hyperhomocysteinemia (HHcy) is a potent risk factor for diabetic cardiovascular diseases (CVD). We have previously reported that HHcy potentiates type 1 diabetes-induced inflammatory monocyte (MC) differentiation, vascular dysfunction, and atherosclerosis. However, the effects of HHcy on vascular inflammation in type 2 diabetes mellitus (T2DM) and the underlying mechanism are unknown.
Approach and Results:
Here, we demonstrate that HHcy was induced by a high methionine diet in control mice (homocysteine (Hcy) 129 μM), which was further worsened in T2DM db/db mice (Hcy 180 μM) with aggravated insulin intolerance. HHcy potentiated T2DM-induced mononuclear cell (MNC), MC, inflammatory MC (CD11b+Ly6C+), and M1 macrophage differentiation in periphery and aorta, which were rescued by folic acid-based Hcy-lowering therapy. Moreover, HHcy exacerbated T2DM-impaired endothelial-dependent aortic relaxation to acetylcholine. Finally, Transfusion of bone marrow cells depleted for Ly6C by lentivirus-Ly6C shRNA transduction improved insulin intolerance and endothelial-dependent aortic relaxation in HHcy+T2DM mice.
Conclusions:
HHcy potentiated systemic and vessel wall inflammation, and vascular dysfunction partially via inflammatory MC subset induction in T2DM. Inflammatory MC may be a novel therapeutic target for insulin resistance, inflammation, and cardiovascular complications in HHcy+T2DM.
Keywords: cardiovascular diseases, type 2 diabetes mellitus, hyperhomocysteinemia, vascular dysfunction, inflammatory monocyte
INTRODUCTION
Hyperhomocysteinemia (HHcy, plasma homocysteine (Hcy)>15 μM) is an independent risk factor for cardiovascular disease (CVD) 1, 2, which increased CVD-related mortality by 1.9-fold in type 2 diabetes mellitus (T2DM) patients 2. This deleterious effect happens in early atherosclerosis, when vascular cells become dysfunctional 3. Vascular dysfunction is characterized by abnormal vascular reactivity and it is featured by an impairment of vasodilatation and/or enhanced vessel constriction that are dependent on endothelial cells (EC) or smooth muscle cells. It has been shown previously that vascular function was impaired by ~20% in HHcy+T2DM patients when compared with T2DM alone4.
Possible mechanisms by which HHcy causes vascular dysfunction include 1) increased oxidative stress 5–8 by inhibiting antioxidant enzyme glutathione peroxidase (GPx-1) in mice 9, thus inactivating vasodilator nitric oxide (NO); 2) promoting inflammation by activating caspase-1 inflammasome and increasing monocyte (MC) adhesion to the aortic endothelium in rodents 10, 11; 3) inactivating endothelial nitric oxide synthase (eNOS) by accumulation of eNOS inhibitor asymmetric dimethylarginine (ADMA) in human, as well as by activating protein kinase C (PKC), negative upstream regulator of eNOS in animals12–14; and 4) reducing methylation by elevating methylation inhibitor s-adenosylhomocysteine in mouse study 15, thus affecting epigenetic regulation of relevant genes.
Meanwhile, multiple interrelated mechanisms have been proposed to explain the exacerbated vascular dysfunction in T2DM 16, 17. T2DM is a long-term metabolic disease that is characterized by hyperglycemia and insulin resistance. Hyperglycemia-stimulated protein acetylation as well as DNA hypomethylation of p66Shc facilitates its phosphorylation on serine 36 and translocation to the mitochondria, where it promotes oxidative stress 18, 19. In addition, insulin resistance specifically impairs phosphatidylinositol 3-kinase (PI3K)/Akt/eNOS signaling, while leaving other distinct nonmetabolic branches, such as insulin/endothelin-1 (vasoconstrictor)-signaling pathways, unaffected, causing NO reduction and vessel restriction, respectively 20, 21. Inflammation seems to be a key player that is involved in all these processes: advanced glycation end products/receptor (AGEs/RAGEs)/oxidative stress increases pro-inflammatory transcription factor (TF) NF-κB 22 and cytokine tumor necrosis factor (TNF) α 23, which activates NADPH oxidase 24 in T2DM db/db mice; TNFα also inhibits insulin-stimulated NO production in human 25. All of these pathophysiological changes could lead to vascular dysfunction, which significantly contributes to morbidity and mortality in T2DM 26, 27. Nevertheless, the molecular mechanisms underlying HHcy+T2DM-exacerbated macrovascular dysfunction remain poorly defined.
In our previous studies, we have demonstrated that aberrant inflammatory response is an underlying mechanism of HHcy+type 1 diabetes mellitus (T1DM)-accelerated atherosclerosis 28. We showed that inflammatory Ly6Chigh MC and TNF-α+ M1 macrophage (MØ) differentiation is increased in bone marrow (BM), peripheral blood, and spleen in HHcy+T1DM mice. Ly6Chigh MC belongs to one of three major MC subsets in mice, which are characterized by their differential expression levels of surface marker Ly6C, a glycosylphosphatidylinositol-anchored glycoprotein with undefined function 29. The Ly6Chigh MC subset is termed as inflammatory classical MC and the Ly6Cmiddle MC subset is termed as inflammatory intermediate MC, which is believed to be differentiated from Ly6Chigh MC 30. Both Ly6Chigh and Ly6Cmiddle MC are jointly described as Ly6C+ MC 31. By contrast, the Ly6Clow MC subset is termed as non-inflammatory nonclassical MC. Ly6Clow MCs patrol blood vessels and accumulate at inflammatory sites to remove debris 32, 33. All MC subsets can infiltrate into the vasculature and further differentiate into different MØ subsets in response to micro-environmental cues 34–36. Importantly, inflammatory MC could release pro-inflammatory cytokines, such as interleukin (IL)-1, IL-6, IL-8, TNFα, and monocyte chemoattractant protein 1 (MCP-1) 37–40, which contribute to vascular dysfunction. Several underlying mechanisms have been proposed in the past: these cytokines could increase the production of ROS 41. The produced ROS could in turn decrease bioavailability of NO, the key endothelium-derived relaxing factor, due to the reaction between NO and O2·− 42. Nevertheless, a causative role of inflammatory MC in mediating HHcy+T2DM-induced vascular dysfunction still remains to be proved 43–45. Thus, we hypothesized that inflammatory MC/cytokine/ROS mediate HHcy+T2DM-exacerbated macrovascular dysfunction.
In this study, we set out to investigate the role of inflammatory MC in mediating HHcy-induced vascular dysfunction in T2DM. We discovered that HHcy worsened vascular dysfunction in T2DM mice partially via promoting inflammatory MC differentiation.
RESEARCH DESIGN AND METHODS
The data that support the findings of this study are available from the corresponding author upon reasonable request.
HHcy and T2DM mouse models and diets —
We designed a basic diet as our control diet (CT) in which folic acid and B vitamins levels are reduced to the sufficient basal level [0.6 mg/kg folic acid, 0.03 mg/kg B12, 8.4 mg/kg B6, 5.6 g/kg (0.37%) methionine, catalog # 07793, Harlan Teklad] to increase Hcy’s response and sensitivity of future vitamin therapy 31. Supplement of methionine in the CT diet (high methionine (HM) diet, 19.56 g/kg (2%) methionine, 07794, Harlan Teklad) was used to induce severe Hcy in db/+ or db/db mice (8-week-old, the Jackson Laboratory) by feeding for 8 weeks. Supplement of folic acid, B6/12 vitamins in the HM diet (HM+HV diet, 6 mg/kg folic acid (10x compared with CT), 0.06 mg/kg B12 (2x), 16.8 mg/kg B6 (2x), 05374, Harlan Teklad) was used to rescue HHcy’s effects.
To increase susceptibility of inflammation response and to recapitulate pathophysiologic hyperlipidemia, a common complication in T2DM, we employed another set of high fat (42% kcal from anhydrous milkfat and cholesterol)-based diet: high fat (HF) diet (08028, Harlan Teklad), HF+HM diet (08029, Harlan Teklad) and HF+HM+HV (high vitamin) diet (08118, Harlan Teklad).
Db/+ mice served as non-T2DM controls. Db/db mice is a well-recognized T2DM model for they contain homozygous mutations of leptin receptor. All animals received humane care in compliance with institutional guideline and the “Guide for the Care and Use of Laboratory Animals” prepared by the “Institute of Laboratory Animal Resources, Commission on Life Sciences, National Research Council”. If not noted specifically, measured parameters were from both age and sex matched mice.
Metabolic parameters assessments —
At the end of experiments, the mice were placed in metabolic cages for 24h acclimation and the 24–48h metabolic parameters were collected, including water and food intake, urine excretion, and body weight changes. At the time of sacrifice, mouse body and major organ weight were recorded.
Plasma Hcy measurement —
At the end of experiment, blood was collected by cardiac puncture. The plasma (50 μL) was batched, frozen, and transported to Institute of Metabolic Disease (Dallas, TX) for Hcy measurements as previously described 46. Briefly, total Hcy levels were analyzed by liquid chromatography-electrospray ionization-tandem mass spectrometry (LC-ESI-MS/MS),
Blood glucose test, glucose tolerance test (GTT) and insulin tolerance test (ITT) —
Ten μl blood was collected from tail vein using HemoCue microcuvettes (HemoCue AB, Angelholm, Sweden) and then blood glucose levels were analyzed using a HemoCue Glucose 201 analyzer. For GTT, mice were fasted overnight with water provided ad libitum before the experimental day. Baseline glucose levels were assessed 2 hours prior to GTT. During GTT, blood glucose levels were monitored at 30, 60, 90, and 120 minutes after glucose injection (i.p. one dose, 2.0 g/kg body weight (BW)). ITT were performed after 4 h’s fasting (9 am to 1 pm) followed by insulin injection (i.p. one dose, 0.75 U/kg, Humalog, Lilly). During ITT, blood glucose levels were monitored at 0, 15, 30, 45, 60, and 120 minutes after insulin injection.
Peripheral immune cell profiling by flow cytometry analysis —
Mice were sacrificed and cells were isolated from peripheral blood, spleen and BM as described previously 31 and lyzed for red blood cells. Then these leukocytes were co-incubated with various antibodies: anti-CD11b-Brilliant Violet (BV) 421 (0.25 μg/100 μl), Ly6C-APC (0.25 μg/100 μl), F4/80-PE (0.125 μg/100 μl), TNFα-eFluor450 (0.125 μg/100 μl), mannose receptor (MR)-Alexa Fluor 647 (0.5 μg/100 μl), CD11c-BV510 (dendritic cell (DC) marker) (0.25 μg/100 μl), Ly6G-APC/Cy7 (granulocyte marker) (0.25 μg/100 μl), CD4-PE/Cy7 (0.125 μg/100 μl), CD8-APC/Cy7 (1 μg/100 μl), NK1.1-BV421 (natural killer (NK) cell marker) (0.25 μg/100 μl), Ter119-BV510 (erythroblast marker) (0.35 μg/100 μl), and/or Foxp3-APC monoclonal antibodies (1 μg/100 μl) (BD Pharmingen™, San Diego, CA), and examined on a LSRII analyzer (BD Biosciences). For every flow cytometry analysis described in this study, cells from wild type (WT) mice were incubated with matched individual Ab isotypes and titrated with different doses of Ab to establish the voltage and compensation. Data were analyzed using FlowJo software (Tree Star Inc., Ashland, OR). First, live cells were identified after excluding red blood cells. Inside the “live” gate, we defined DCs as CD11c+ cells, granulocytes as Ly6G+, T helper cells (Ths) as CD4+, cytotoxic T cell (Tcs) as CD8+, NKs as NK1.1+, erythroblasts as Ter119+, and regulatory T cells (Tregs) as CD4+Foxp+ cells (Fig. 3A). Mononuclear cells (MNCs) were selected by distinguishing MNC from granulocytes and lymphocytes with their lower granular content, as reflected in lower side-scatter light (SSC), and their larger cell size, as reflected in higher forward scatter light (FSC) (FSChighSSClow; Fig. 4A). MC were further defined as CD11b+ MNC, which were then divided into three subgroups based on their Ly6C expression levels (low, middle and high, Fig. 4A). M1 MØs were defined as F4/80+TNF-α+ cells, while M2 MØs were defined as F4/80+MR+ cells (Fig. 7B).
Figure 3. HHcy did not promote other splenic cell populations in spleen of T2DM mice.
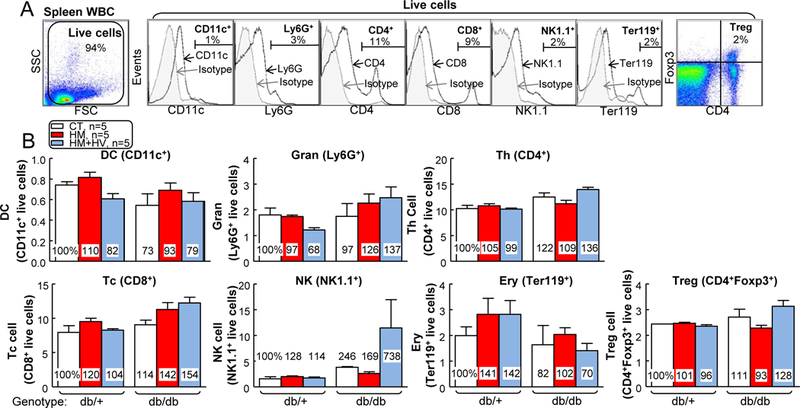
db/+ mice (non-T2DM groups) and db/db mice (T2DM groups) were fed a CT, HM, or HM+HV diet from 8 weeks old to 16 weeks old and euthanized. (A) Schematic gating strategy of seven cellular populations: DC, granulocyte, CD4+ T cell, CD8+ T cell, NK, erythroblast, and Treg. (B) Quantitative analysis of each population are shown in bar graphs. N=5 mice. Ery, erythroblast; Gran, granulocyte; Tc, cytotoxicity T cell; Th, T helper cell; WBC, white blood cell.
Figure 4. HHcy promoted inflammatory MC differentiation in spleen and blood of T2DM male mice.
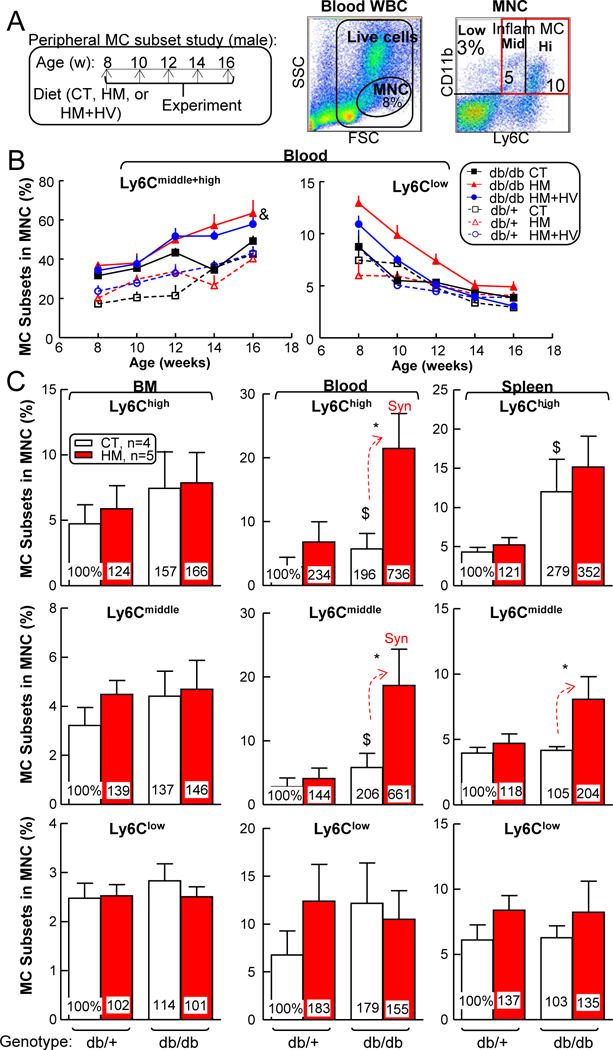
db/+ mice (non-T2DM groups) and db/db mice (T2DM groups) were fed a CT, HM or HM+HV diet from 8 weeks old to 16 weeks old and euthanized. Bone marrow (BM), peripheral blood, and spleen cells were isolated, stained with anti-CD11b, anti-Ly6C mouse antibody, and analyzed by flow cytometry. (A) Schematic gating strategy. Monocytes (MCs) were identified as CD11b+ MNCs and divided into 3 subsets: Ly6Clow, Ly6Cmiddle, and Ly6Chigh. Quantitative analysis of MC subsets in BM, peripheral blood, and spleen are shown in bar graphs. (B) Time course of MC differentiation. (C) Quantitative analysis of each population are shown in bar graphs. Note that CD11b+Ly6Cmiddle+high MC subsets were increased in blood from HHcy+T2DM mice. N=4–5 mice. *P<0.05 vs CT diet mice with the same genotype, $P<0.05 vs db/+ mice on the same diet. Synergy was defined as HHcy and T2DM produced a greater effects in db/db mice on HM diet than the sum of that in HHcy and T2DM alone. WBC, white blood cell.
Figure 7. HHcy promoted vascular wall inflammatory MC subsets and M1 MØ polarization inT2DM mice.
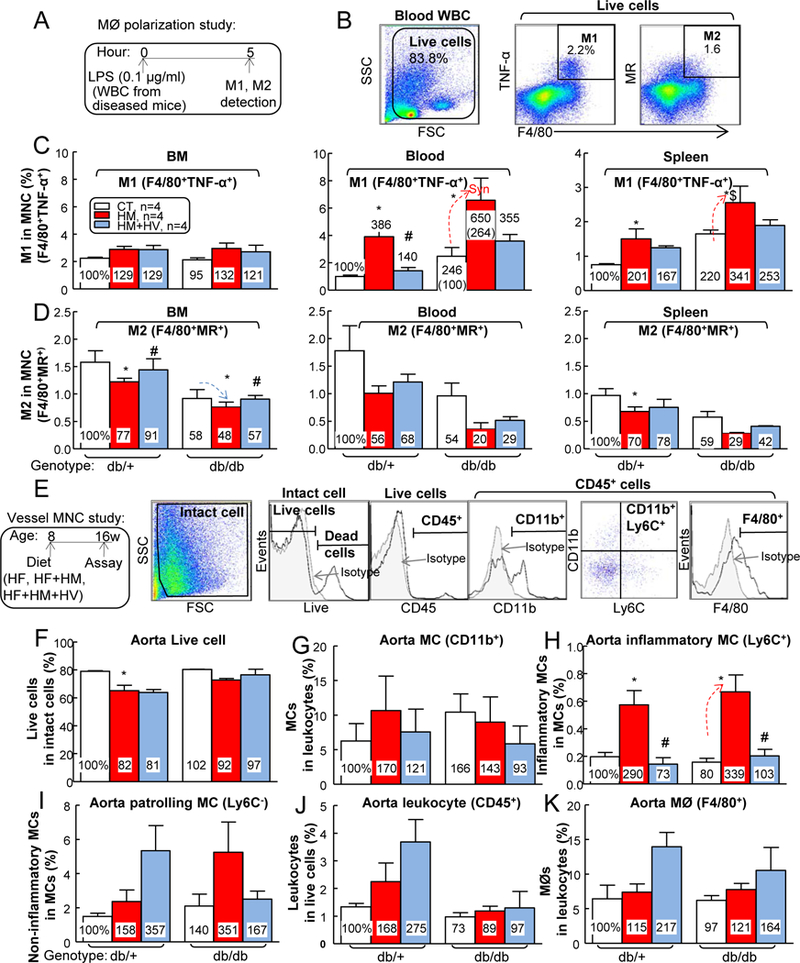
db/+ mice (non-T2DM groups) and db/db mice (T2DM groups) were fed a HF, HF+HM, or HF+HM+HV diet from 8 weeks old to 16 weeks old and euthanized. (A) Schematic illustration of MØ polarization: cells suspended from mouse BM, peripheral blood and spleen were incubated with LPS (0.1 μg/ml) for 5 hours, and then the cells were stained with monoclonal antibodies (mAbs) against F4/80 (MØ marker), TNF-α (proinflammatory M1 MØ marker), MR (or CD206, anti-inflammatory MØ marker), and assayed by flow cytometry. (B) Two cellular populations, M1 MØ (F4/80+TNFα+) and M2 MØ (F4/80+MR+), were analyzed separately. Quantitative analysis of M1 (C) and M2 (D) MØs in BM, peripheral blood and spleen are shown in bar graphs. Note that M1 MØs subsets were increased in HHcy+T2DM mice, while M2 MØs were decreased in HHcy+T2DM mice. Aorta single cell suspension were prepared, stained with live/dead dye, anti-CD45, -CD11b, -F4/80 and –Ly6C mAbs, and analyzed by flow cytometry. (E) Representative dot plots depicting different cell types: live, CD45+ (leukocytes), F4/80+ (macrophages), CD11b+ (MCs) and Ly6C+ (inflammatory MCs). Quantitative analysis of live cell (F), MC (G), inflammatory MC (H), patrolling MC (I), leukocyte (J) and MØ (K), in aorta are shown in bar graphs. Note that CD11b+Ly6C+ inflammatory MC subset was increased in aorta of HHcy+T2DM mice. N=4 mice. *P<0.05 vs HF diet mice with the same genotype, #P<0.05 vs HF+HM diet mice with the same genotype, $P<0.05 vs db/+ mice on the same diet. Synergy was defined as HHcy and T2DM produced a greater effects in HHcy+T2DM mice than the sum of that in HHcy and T2DM alone. WBC, white blood cell.
Vessel wall single cell suspension and immune cell analysis by flow cytometry analysis —
Mice were deep-anesthetized at the end of experiment and their vasculature were perfused by cardiac puncture with PBS containing 20 U/ml heparin to remove blood cells from all vessels. The aortas were collected and digested as previous described 31. Briefly, aortas, free of adipose tissue, were collected and weighed to control the total collected amount. The harvested aortas were minced with scissors and digested with 125 U/ml collagenase type XI, 60 U/ml hyaluronidase type I, 60 U/ml DNase1, and 450 U/ml collagenase type I in PBS containing 20 mM HEPES at 37°C for 45 minutes. Aortic cell suspensions were obtained by mashing the aorta through a 70 μm cell strainer for flow cytometry analysis. Cells were first stained with live/dead-blue dye for 30 minutes at room temperature to exclude dead cells. Then the cells were washed and co-incubated with four monoclonal antibodies: CD11b- BV421, Ly6C-APC, F4/80-PE, and CD45-APC/Cy7 (leukocyte marker) (0.25 μg/100 μl) (BD PharmingenTM, San Diego, CA) for 15 minutes in dark at 4°C. Flow cytometry analysis was performed on a LSRII analyzer (BD Biosciences). Data were analyzed using the FlowJo software (Tree Star Inc., Ashland, OR).
Plasma lipid profile analysis —
Blood was obtained from fasted mice. Plasma was separated (3,000g for 20 min) and collected for lipid profile analysis. Plasma total cholesterol (C), high density lipoprotein-cholesterol (HDL-C), low density lipoprotein-cholesterol (LDL-C), and triglyceride (TG) were analyzed at the National Mouse Metabolic Phenotyping Center at the University of Massachusetts by Cobas Clinical Chemistry Analyzer (Roche) 28.
Measurements of plasma TNF-α, IL-18 and MCP-1 levels —
Commercial assays (TNF-α, IL-18 and MCP-1 ELISA Kits; Invitrogen) were used per the manufacturer’s instructions.
Electron paramagnetic resonance (EPR) measurements of mouse plasma ROS —
Krebs Hepes Buffer (KHB) were prepared freshly (using bi-distilled water) and filtered (0.22 μm). Ten mM stock solution of the CMH spin probe, 1-hydroxy-3-methoxycarbonyl-2,2,5,5-tetramethylpyrrolidine (CMH) (Enzo, Farmingdale, NY), was also freshly made and dissolved in KHB containing 25 μM deferoxamine methanesulfonate salt (DF) (Sigma, St. Louis, MO) and 5 μM sodium diethyldithiocarbamate trihydrate (DETC) (Sigma, St. Louis, MO) under constant bubbling of N2 (gas), to keep an oxygen free atmosphere. Oxidation of CMH leads to the formation of the paramagnetic 3-methoxycarbonyl-proxyl nitroxide (CM•) 47 which could be detected by EPR.
For preparation of mouse plasma with spin probe, 50 μl plasma samples were mixed in 45 μl oxygen free KHB and added to a micro centrifuge tube with cap. Then, 5 μL oxygen-free spin probe (10 mM CMH) was added to have a final concentration of 500 μM CMH. The mixture was measured immediately.
EPR spectra were acquired on a Bruker EMX X-band spectrometer in perpendicular mode at room temperature using glass capillary tubes as sample holders. The spectrometer settings were: 9.642334 GHz microwave frequency, 6.362e-001 mW microwave power, 100.000 kHz Mod. Frequency, and 5.000 G Mod. Amplitude. No EPR signal could be detected for the empty sample tube or from PBS. The recorded EPR spectra were imported into analysis software WinEPR and the EPR signal intensity was determined as peak-to-peak height in the first derivative spectrum.
RNA sequencing in MC subsets —
We sequenced RNA in mouse CD11b+Ly6G−Ly6Chigh and CD11b+Ly6G−Ly6Clow MCs sorted from WT whole blood. Sorted cells (200,000/MC subset) were collected in 1400 μl QIAzol Lysis Reagent (Qiagen, Germantown, MD) and total RNA (50–100 ng) was isolated manually per manufacturer’s protocol. RNA quality check was done on an Agilent Bioanalyzer 2100 by pico RNA chip for RNA integrity number (RIN). Next-Gen Sequencing (NGS) Unit at Fox Chase Cancer Center amplified cDNA from RNA, and constructed cDNA libraries by ribosomal cDNA depletion using takara pico-input kit. Pooled samples were run in duplicate simultaneously on an Illumina HiSeq2500 sequencer and each run generated 50-bp single-end reads. Overall, we obtained around 40 million reads per sample.
RNAseq data analysis was carried out using the statistical computing environment R, the Bioconductor suite of packages for R, and RStudio. Raw FASTQ files were aligned on the murine GRCm38 (mm10) genome, background-subtracted, variance-stabilized, and normalized by robust spline normalization. Differentially expressed genes were identified by linear modeling and Bayesian statistics using the Limma package. Using the Benjamini-Hochberg, probe sets that were differentially regulated (fold change (FC)≥2, p<0.05) were controled for multiple testing method. Clusters of coregulated genes were identified by Pearson correlation using the hclust function of the stats package in R. They were further used for heat map generation in R.
Vascular reactivity/function assessment —
Mice were sacrificed under anesthesia. Aorta was removed and prepared for vascular reactive assessments (vascular dysfunction is the initial events in atherogenesis and a more sensitive function readout) as we previously described 14. Vascular contractile responses were assessed after an equilibration period in Krebs buffer (aerated with O2 and containing 119 mM NaCl, 4.7 mM KCl, 1.0 mM MgSO4·7H2O, 1.2 mM KH2PO4, 25.0 mM NaHCO3, 11.1 mM glucose and 2.5 mM CaCl2). Aortic rings were exposed to potassium chloride (KCl, 120 mM) followed by a second round of washing and equilibration with Krebs. Then, vascular responses to cumulative addition of phenylephrine (10 nM to 33 μM) were determined as vascular contractility 14, 48. Endothelium-dependent vascular relaxation was determined in the aortic ring with intact endothelium in response to cumulative concentrations of acetylcholine (ACh) (10 nM to 33 μM). The aortic ring was pre-contracted with phenylephrine (1 μM) as described previously 14, 48. Endothelium-independent vascular relaxation was determined in the aortic ring in responses to sodium nitroprusside (SNP, 1 nM to 10 μM) pre-contracted with phenylephrine (1 μM) 14, 48.
Ly6C therapy using lentivirus (LV) transduction in BM cell and BM Transplantation (BMT) —
BM was collected from the femurs of WT CD45.1 mice for Ly6C deletion and used as BMT donor cells. Ly6C deletion was achieved by LV-Ly6c-shRNA transduction (LV-shLy6c A/B/C/D, targeting on 4 different regions of Ly6c mRNA: TL513893A-GCAGTTACCTGCCGCGCCTCTGATGGATT, TL513893B-CACTACAAAGTCCTGTGTGCTCATTCTTC, TL513893C-GAGAGGACTTCCTGTTGCAGCGAAGACCT, TL513893D-AGCTCAGTCGTCCTGCAGACCTTGCTCTG, Origene, Rockville, MD). Viral particles were packaged and titrated in Dr. Joseph Rabinowitz’s laboratory. Briefly, BM cells were collected after red blood cell lysis and transduced with LV-shLy6c by a multiplicity of infection (MOI) of 0.2. Viral transductions were performed in modified Eagle medium plus 10% fetal bovine serum in the presence of 5 μg/mL polybrene for 1 h. Then BM cells were washed with PBS and transplanted via retroorbital injection (1×10⁷ cells/mouse) 2–3 hours after irradiation into recipient mice. The recipient mice (female or male; age, 8 weeks; CD45.2 db/db mice) were irradiated with 900 centigray using x-ray irradiation to partially remove endogenous BM cells (56% CD45.2 chimeras) due to vulnerability of irradiation death in db/db mice 49. Ly6C deletion was confirmed in BM cells 48 hours after viral transduction. The recipient mice were fed a HF+HM diet 1 month after BMT for another 8 weeks. BM reconstitution was confirmed at the end of the study for each mouse with flow cytometry analysis for CD45.1-BV786 (0.25 μg/100 μl), CD45.2-BUV395 (0.25 μg/100 μl), CD11b and Ly6C expression in peripheral blood.
Insulin immunohistochemistry staining in mouse pancreas —
For characterization of insulin secretion, mouse pancreases were embedded, sectioned and stained for insulin and hematoxylin in NDBbio, LLC. After mounting, sections were analyzed with a microscope (Axioskop 2 plus, Carl Zeiss) using 20x air objectives.
Oil Red O staining for atherosclerotic lesion analysis —
Mouse aortic sinuses were sectioned, stained with Oil Red O, and quantified the aortic lesion area as previously described 31.
Chemicals —
All chemicals, if not specified above, were purchased from Sigma-Aldrich (St. Louis, MO).
Statistics —
Data were expressed as the mean ± standard error of the mean (SEM) throughout the manuscript. For comparisons between two groups, two-tailed Student t test was used for evaluation of statistical significance or, when the data were not normally distributed, a nonparametric Mann-Whitney U test was used. For comparisons across multiple groups, one-way ANOVA with Bonferroni post-test adjustment was used or, when the data were not normally distributed, the data were analyzed using one-way ANOVA with the Kruskal-Wallis test, followed by pairwise comparison using the Dunn test. A probability value p < 0.05 was significant.
RESULTS
T2DM worsened HHcy, and HHcy aggravated insulin intolerance —
Amino acid Hcy level was dramatically induced by HF+HM diet (plasma total Hcy 129±40 μM) in male db/+ mice and it was further increased to 180±31 μM in male db/db mice (Fig. 1A, p<0.01). Vitamin therapy largely reduced plasma Hcy level from 129±40 to 42±7 μM in male db/+ mice, and from 180±31 to 87±22 μM in male db/db mice, indicating the effectiveness of the treatment. Blood glucose level was significantly higher in male db/db mice (589±26 mg/dl) than that in male non-diabetic db/+ mice (172±2 mg/dl) (Fig. 1B). HHcy did not further increase blood glucose levels in either male db/+ mice (170±3 mg/dl) or female db/db mice (591±20 mg/dl). Similar changes in Hcy and glucose levels were also observed in female mice (Fig. 6A–C). Vitamin therapy reduced blood glucose level from 591±20 to 476±37 mg/dl in male db/db mice. Moreover, HHcy aggravated insulin intolerance in db/db mice (Fig. 1C, p<0.05). However, HHcy did not change insulin intolerance in db/+ mice, and it also had no effect on glucose tolerance in both groups (Fig. 1D).
Figure 1. HHcy and T2DM conditions reciprocally worsened each other, and combination of the two led to splenomegaly in male mice.
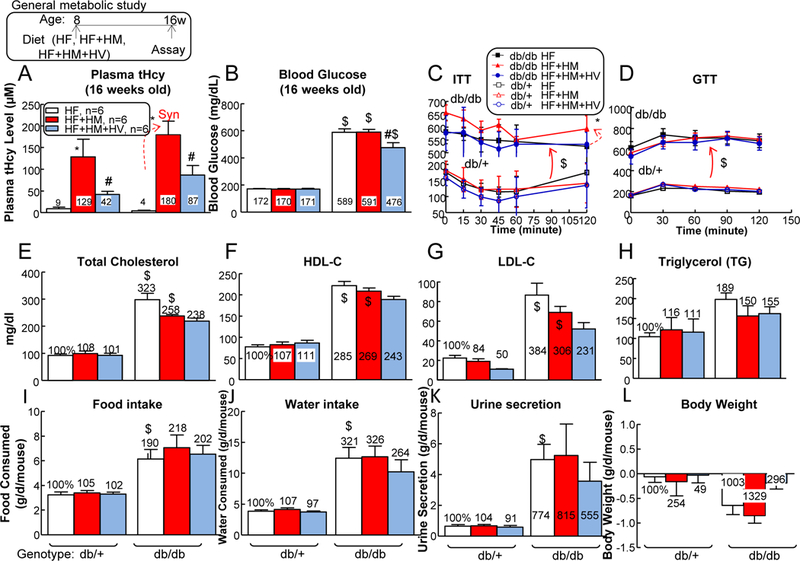
db/+ mice (non-T2DM groups) and db/db mice (T2DM groups) were fed a HF, HF+HM, or HF+HM+HV diet from 8 weeks old to 16 weeks old and then euthanized. Plasma was collected at the time of sacrifice. (A) Total plasma Hcy levels. Note that HF+HM diet increased plasma Hcy levels in db/+ mice, and further increased it in db/db mice. To evaluate mouse metabolism status systemically, all mice were subjected for blood glucose measurement (B), ITT (C), glucose tolerance test (GTT) (D), plasma total cholesterol (C) (E), HDL-C (F), LDL-C (G), and TG (H) measurements. Food intake (I), water intake (J), urine secretion (K), and body weight (L) changes were monitored in 24 hours at 16 weeks old. Each mouse was placed in the metabolic cages (HARVARD APPARATUS, Holliston, MA) for 24 hours prior to the experiment. After 24 hour accommodation, all the metabolism parameters were collected. N=6 mice. *P<0.05 vs HF diet mice with the same genotype, #P<0.05 vs HF+HM diet mice with the same genotype, $P<0.05 vs db/+ mice on the same diet. Synergy was defined as HHcy and T2DM produced a greater effects in HHcy+T2DM mice than the sum of that in HHcy and T2DM alone.
Figure 6. T2DM further increased plasma Hcy level, and HHcy increased inflammatory MC populations in BM, peripheral blood and spleen of T2DM female mice, which could be reversed by Hcy-lowering HV diet.
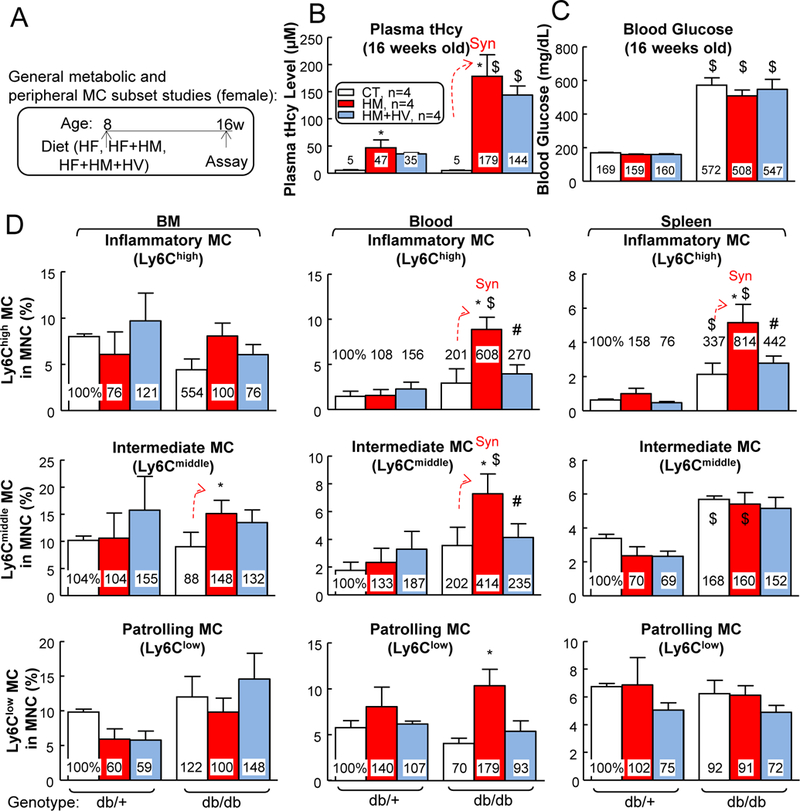
(A) Schematic illustration of metabolic and MC subset studies: db/+ mice (non-T2DM groups) and db/db mice (T2DM groups) were fed a HF, HF+HM, or HF+HM+HV diet from 8 weeks old to 16 weeks old and euthanized. (B) Total plasma Hcy levels. Plasma was collected at the time of sacrifice. Note that HF+HM diet increased plasma Hcy levels in db/+ mice, and further increased it in db/db mice. (C) Blood glucose. (D) Quantitative analysis of MC subsets in BM, peripheral blood, and spleen are shown in bar graphs. Bone marrow (BM), peripheral blood, and spleen cells were isolated, stained with anti-CD11b, anti-Ly6C mouse antibody, and analyzed by flow cytometry. MCs were identified as CD11b+ MNCs and further divided into 3 subsets: Ly6Clow, Ly6Cmiddle, and Ly6Chigh. N=4 mice. *P<0.05 vs HF diet mice with the same genotype, #P<0.05 vs HF+HM diet mice with the same genotype, $P<0.05 vs db/+ mice on the same diet. Synergy was defined as HHcy and T2DM produced a greater effects in HHcy+T2DM mice than the sum of that in HHcy and T2DM alone.
In general, plasma lipid levels, including cholesterol (C), HDL-C, LDL-C, and TG, were elevated in db/db mice and they were not significantly changed by either HHcy or vitamin-based Hcy-lowering therapy (Figs. 1E–H). Other key parameters of diabetes, which include hyperphagia (increased food intake), polydipsia (increased water intake), and polyuria (increased urine excretion) were also evident in db/db mice and they were not further changed by either HF+HM diet-induced HHcy or vitamin therapy (Figs. 1I–K). Notably, HHcy reduced body weight in db/+ (2.5-fold) and db/db mice (1.3-fold), which was normalized by vitamin therapy (Fig. 1L). Taken together, these results indicated that metabolic disorder and HHcy reciprocally aggravate each other during the development of T2DM in mice.
T2DM induced heart, liver, and kidney weights, and severe HHcy increased spleen weight in male T2DM —
Heart, liver, and kidney weights were all increased in male db/db mice on HF diet (134%, 327%, and 169% compared with that in db/+ mice, respectively), and they were not changed by HF+HM or HF+HM+HV diet (Figs. 2A–C). Neither T2DM nor HHcy significantly changed male pancreas weights (Fig. 2D), while T2DM slightly reduced male brain weight by 0.9-fold (Fig. 2E). Importantly, HF+HM diet-induced HHcy drastically increased spleen weight from 0.061±0.007 to 0.134±0.033 (266%) in male db/db mice, indicating an aberrant splenic cell enrichment that was caused by HHcy during T2DM (Fig. 2F).
Figure 2. HHcy and T2DM led to splenomegaly in male mice.
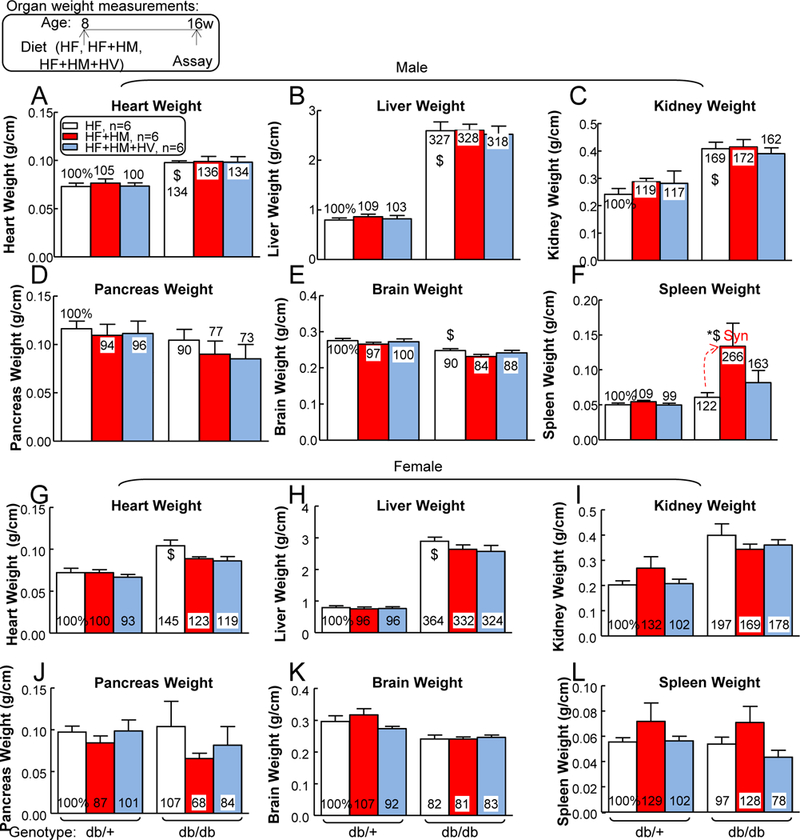
db/+ mice (non-T2DM groups) and db/db mice (T2DM groups) were fed a HF, HF+HM, or HF+HM+HV diet from 8 weeks old to 16 weeks old and then euthanized. To evaluate mouse physiological conditions, all mice were monitored for heart weight (A, male; G, female), liver weight (B, male; H, female), kidney weight (C, male; I, female), pancreas weight (D, male; J, female), brain weight (E, male; K, female); spleen weight (F, male; L, female) (expressed as “organ weights relative to tibia lengths”) at sacrifice. Severe HHcy increased spleen weight in HHcy+T2DM mice. N=6 mice. *P<0.05 vs HF diet mice with the same genotype, $P<0.05 vs db/+ mice on the same diet. Synergy was defined as HHcy and T2DM produced a greater effects in HHcy+T2DM mice than the sum of that in HHcy and T2DM alone.
Similarly, heart and liver weights were increased in female db/db mice on HF diet (145% and 364% compared with that in db/+ mice, respectively), without further changes in HF+HM or HF+HM+HV group (Figs. 2H–I). Other major organ (kidney, pancreas, brain and spleen) weight were not significantly changed by T2DM nor HHcy in female mice (Figs. 2J–L).
Severe HHcy exaggerated T2DM-induced systemic inflammation —
Since we observed heavier spleen (splenomegaly) by HHcy in db/db mice, we profiled major splenic cell populations as illustrated by Fig. 3. HHcy+T2DM did not affect DC, granulocyte, CD4+ T cell (TC), CD8+ TC, NK cell, erythroblast or Treg percentages in mouse spleen.
Therefore, we hypothesized that MC population, which constitutes ~10% of mouse spleen, might be induced by HHcy in T2DM. To test this hypothesis, we examined MC profiles in the BM, peripheral blood, and spleen of db/+ and db/ db mice that were fed with CT, HM, or HM+HV diet. We found that HHcy did not show any effect in regulating different MC populations in BM, as characterized by their surface maker Ly6C. However, severe HHcy increased inflammatory Ly6Chigh MC by 2.34-fold in db/+ mice, and synergistically further increased Ly6Chigh MC by a whopping 7.36-fold in db/db mice in the blood (Figs. 4A–C). Similarly, HHcy increased inflammatory Ly6Cmiddle MC by 1.44-fold in db/+ mice, and synergistically further increased it by 6.61-fold in db/db mice in the same tissue. In the spleen, we observed similar effects of HHcy in exaggerating T2DM-induced inflammatory Ly6Cmiddle and Ly6Chigh MC. By contrast, Ly6Clow population was not significantly affected by HHcy or T2DM in any of the tissues tested.
HHcy are frequently associated with hyperlipidemia in T2DM patients 50. To better recapitulate pathophysiologic hyperlipidemic T2DM and consolidate our findings, we examined MC populations again in db/+ and db/db mice fed with HF, HF+HM or HF+HM+HV diet. We found that severe HHcy increased the mononuclear (MNC) population from 14% to 20% in BM, and 6% to 8% in spleen of live white blood cells of male db/+ mice (Figs. 5A–C). In male db/db T2DM mice, severe HHcy increased the MNC population from 16% to 21% in BM, 1% to 3% in blood, and 6% to 9% in spleen. In addition, vitamin-based Hcy-lowering therapy completely reversed the effects of HHcy on MNC induction in all three tissues. Similar effects were observed on the CD11b+ MC population, which showed that T2DM and HHcy synergistically increased MC populations in blood and spleen, which was rescued by vitamin-based Hcy-lowering therapy (Fig. 5D). Consistent with the previous findings on MC subsets (Fig. 4), we observed increased inflammatory Ly6Cmiddle/ Ly6Chigh MC in all three peripheral tissues when comparing male db/db mice with male db/+ mice (Fig. 5E). All these HHcy-induced phenotypes were normalized by vitamin-based Hcy-lowering therapy in both male db/+ and male db/db mice.
Figure 5. Under hyperlipemia conditions, HHcy increased MNC, MC, and inflammatory MC populations in BM, peripheral blood, and spleen of T2DM male mice, which could be reversed by Hcy-lowering HV diet.
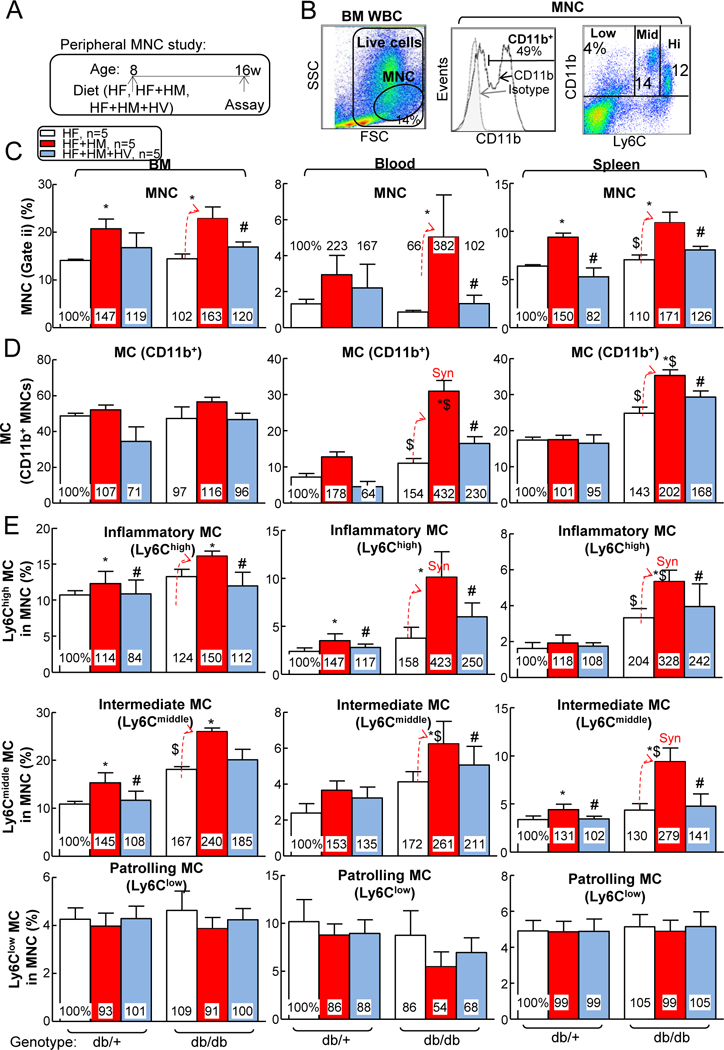
(A) Schematic illustration of peripheral mononuclear cell (MNC) study: db/+ mice (non-T2DM groups) and db/db mice (T2DM groups) were fed a HF, HF+HM, or HF+HM+HV diet from 8 weeks old to 16 weeks old and euthanized. Bone marrow (BM), peripheral blood, and spleen cells were isolated, stained with anti-CD11b, anti-Ly6C mouse antibody, and analyzed by flow cytometry. (B) Representative dot plots depicting living cells (gate i), MNCs (gate ii), MC and MØ subsets. MCs were identified as CD11b+ MNCs and further divided into 3 subsets: Ly6Clow, Ly6Cmiddle, and Ly6Chigh. (C) Quantitative analysis of total MNC in BM, peripheral blood, and spleen are shown in bar graphs. (D) Quantitative analysis of MCs in BM, peripheral blood, and spleen are shown in bar graphs. (E) Quantitative analysis of MC subsets in BM, peripheral blood, and spleen are shown in bar graphs. N=5 mice. *P<0.05 vs HF diet mice with the same genotype, #P<0.05 vs HF+HM diet mice with the same genotype, $P<0.05 vs db/+ mice on the same diet. Synergy was defined as HHcy and T2DM produced a greater effects in HHcy+T2DM mice than the sum of that in HHcy and T2DM alone. WBC, white blood cell.
In female mice, increased inflammatory Ly6Cmiddle+high MC was observed in spleen when comparing db/db mice with db/+ mice (Fig. 6D). Moreover, HHcy+T2DM synergistically increased Ly6C+ MC in BM (Ly6Cmiddle from 18% to 30% of MNC), peripheral blood (Ly6Chigh from 3% to 9%, Ly6Cmiddle from 9% to 18%) and spleen (Ly6Chigh from 5% to 13%). Db/db mice had HV-normalized inflammatory MC phenotypes in blood and spleen.
Since MC can be polarized to MØ, which is a key mediator of tissue inflammation, we assessed MØ polarization potential by priming leukocytes with lipopolysaccharides (Fig. 7A). The results showed that T2DM cells had increased M1 MØ (F4/80+TNF-α+) polarization by 2.46- and 2.20-fold in blood and spleen, respectively (Figs. 7B–C). Severe HHcy increased MC-derived M1 MØ by 3.86-fold in db/+ mice and synergistically elevated it by 2.64-fold in db/db mouse peripheral blood. In the spleen, severe HHcy increased M1 MØ by 2.01-fold in db/+ mice and further elevated it by 1.55-fold in db/db mice. In contrast, T2DM reduced M2 MØ (F4/80+MR+) polarization by 0.58-, 0.54-, and 0.59-fold in BM, blood, and spleen, respectively (Fig. 7D). Severe HHcy decreased MC-derived M2 MØ by 0.77-fold in db/+ mice and further reduced it by 0.83-fold in db/db mouse BM. In the spleen, severe HHcy reduced M2 MØ by 0.70-fold in db/+ mice. Folic acid-based Hcy-lowering therapy largely reversed HHcy-induced M1 polarization and HHcy-suppressed M2 differentiation.
T2DM exacerbated vascular inflammation in HHcy mice —
Next, we hypothesized HHcy-induced systemic inflammatory monocyte differentiation could contribute to vascular inflammation in T2DM mice. To test this hypothesis, we performed single cell suspension of aortic cells and studied their MC and MØ populations (Fig. 7E). The results showed that HHcy decreased aortic live cells from 79 to 65% (Fig. 7F). Moreover, HHcy appeared to slightly increase aorta MC population (Fig. 7G). Importantly, HHcy dramatically induced aortic inflammatory Ly6C+ MC population by 2.90-fold in db/+ mice, and further induced it by 4.24-fold in db/db mice, which were completely normalized by vitamin-based Hcy-lowering therapy in both mouse groups (Fig. 7H). T2DM did not change aorta Ly6C− MCs, total leukocyte and MØ populations (Figs. 7I–K).
HHcy and T2DM synergistically increased TNF-α and ROS in mouse plasma —
Previously, we reported that Ly6C+ MCs secrete large amount of ROS as well as pro-inflammatory cytokines (TNF-α, IL-18 and MCP-1) in the presence of HHcy and hyperglycemia 28. To detect these deleterious factors in the setting of HHcy and T2DM, we collected plasma from 5 mice each group and compared the results. The db/db mice on HM diet had higher TNF-α plasma levels compared with db/db mice on CT diet (Fig. 8A). Neither HHcy nor T2DM changed mouse plasma IL-18 or MCP-1 levels (Figs. 8B–C). EPR measurements showed HHcy and T2DM increased ROS levels in mouse plasma (Figs. 8D–E). Thus, we proposed that inflammatory MC contribute to systemic and vascular inflammation by secreting ROS and TNF-α.
Figure 8. HHcy increased inflammatory cytokines and reactive oxygen stress (ROS) inT2DM mice.
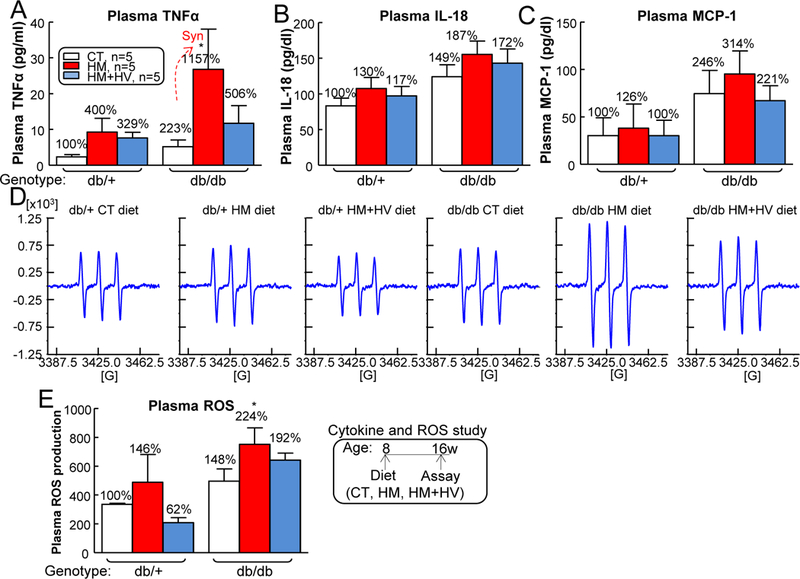
db/+ mice (non-T2DM groups) and db/db mice (T2DM groups) were fed a CT, HM, or HM+HV diet from 8 weeks old to 16 weeks old and euthanized. The level of TNFα (A), IL-18 (B) and MCP-1 (C) in plasma by ELISA. (D) Mouse plasma ROS levels were demonstrated by the EPR spectrums. The spectra are centered at g = 3425.0. The greatest signal amplitude difference in the triplet was quantified as ROS production (E). N=5 mice. *P<0.05 vs CT diet mice with the same genotype. Synergy was defined as HHcy and T2DM produced a greater effects in HHcy+T2DM mice than the sum of that in HHcy and T2DM alone.
Severe HHcy impaired endothelium-dependent vascular relaxation to ACh in T2DM —
T2DM increased aortic vascular contraction to phenylephrine and impaired endothelium-dependent vascular relaxation responses to accumulative concentrations of ACh (Figs. 9A–B). On the contrary, T2DM had no effect on endothelial-independent vascular relaxation to SNP (Fig. 9C). Notably, Severe HHcy increased vessel contraction to phenylephrine by 68% and 90%, and impaired endothelium-dependent vascular relaxation to ACh by 27% and 72%, in db/+ and db/db mice, respectively. Moreover, HHcy had no effect on vascular relaxation to SNP in both mouse groups. Vitamin therapy also did not rescue HHcy’s effects in either mouse groups. This HHcy+T2DM-impaired vascular dysfunction could be attributed by inflammatory MC-secreted TNF-α 51 and ROS 51.
Figure 9. HHcy impaired endothelium-dependent vascular relaxation in aortas of T2DM mice.
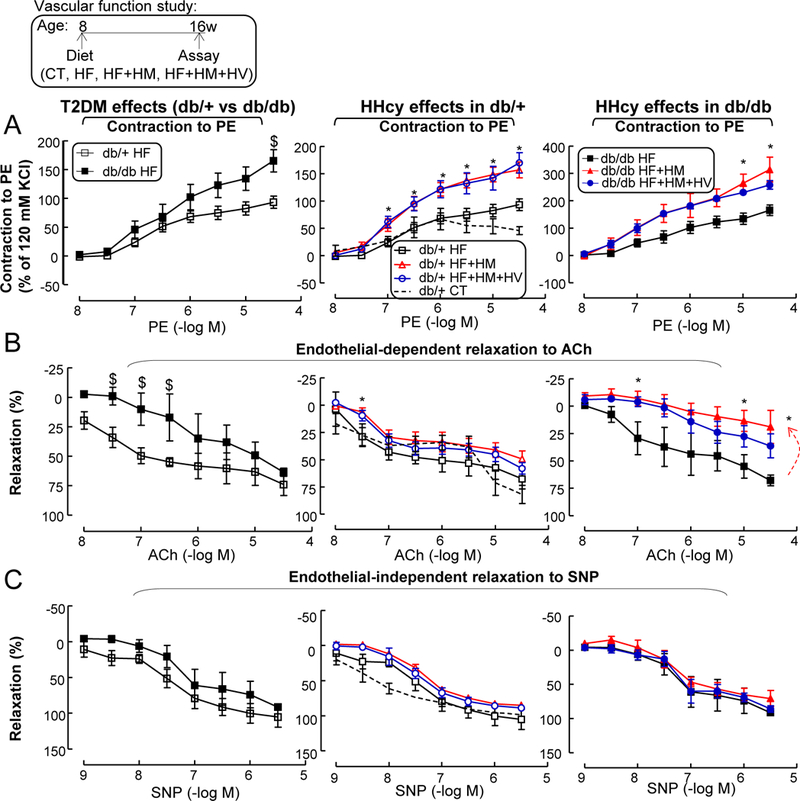
db/+ mice (non-T2DM groups) and db/db mice (T2DM groups) were fed a CT, HF, HF+HM, or HF+HM+HV diet from 8 weeks old to 16 weeks old and euthanized. (A) Vascular contractile responses to cumulative additions of phenylephrine. (B) Endothelium-dependent relaxation. Aortas were precontracted with phenylephrine (1 μM) and examined for relaxation to cumulative additions of ACh. (C) Endothelial-independent relaxation. Aortas were precontracted with phenylephrine (1 μM) and examined for relaxation to cumulative additions of sodium nitroprusside. N=5–8 mice, 2 vessel segments/mouse. *P<0.05 vs HF diet mice with the same genotype, #P<0.05 vs HF+HM diet mice with the same genotype, $P<0.05 vs db/+ mice on the same diet. PE, phenylephrine.
Furthermore, early atherosclerotic lesion formation (8 weeks diet) were absent on aortic sinus cross-sections stained with Oil Red O staining (Supplemental Fig. I). Thus, HHcy exaggerated T2DM-induced impairment of endothelium-dependent vascular relaxation, presumably due to increased inflammatory monocyte differentiation and secreted TNF-α/ROS factors.
HHcy+T2DM might promote Ly6C+ MC via upregulation of TF CEBPα —
To investigate the mechanisms underlying HHcy+T2DM-induced inflammatory MC differentiation, we performed RNA Sequencing experiment from sorted WT mouse blood CD11b+Ly6G−Ly6Chigh and CD11b+Ly6G−Ly6Clow MC (Figs. 10A–B). Comparison of gene expression profiles between Ly6Chigh and Ly6Clow MC showed that Ly6Chigh MC contained 1,776 significantly upregulated genes (FC≥2, p<0.05), 9 of which are TFs (Mitf, Ahr, Fos, Maf, Cebpa, Irf7, Cebpd, Notch1, Zfp358) (Fig. 10C). Furthermore, we identified only CEBPα has 2 potential binding sites (−957/−952, −236/−231) in 2 core promoter regions (−1348/−947, −348/454) on the Ly6c gene promoter region (http://useast.ensembl.org/Mus_musculus/Gene/Regulation?g=ENSMUSG00000079018;r=15:75044018-75048830;redirect=no), one in each promoter (Fig. 10D). This implies that CEBPα is a potential TF responsible for Ly6Chigh MC differentiation. To further confirm this hypothesis, we examined CEBPα expression in blood Ly6C+ MC of HHcy+T2DM mice and observed a 408% and 921% increase in CEBPα+ cell population in Ly6C+ MC of HHcy and HHcy+T2DM, respectively (Figs. 10E–F). Therefore, we hypothesized that CEBPα-mediated Ly6c transactivation is a potential mechanism for Ly6Chigh MC induction in HHcy and HHcy+T2DM mice.
Figure 10. HHcy+T2DM induced Ly6C expression possibly via CEBPα induction.
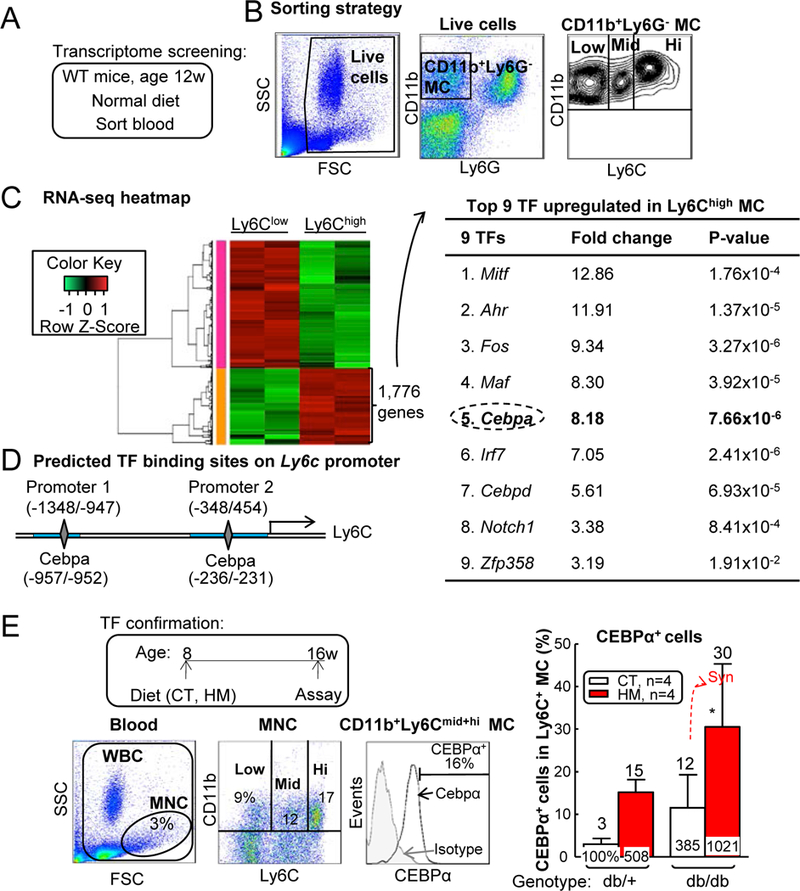
(A) Schematic illustration of transcriptome screening. (B) Sorting strategy for CD11b+Ly6G-Ly6Chigh inflammatory MCs (Ly6Chigh) and CD11b+Ly6G-Ly6Clow resident MCs (Ly6Clow) in WT mouse blood. Each population obtained 200,000 cells and RNA was extracted for RNA sequencing. (C) Upregulated TFs in Ly6Chigh cells. Using HiSeq X Ten system, we obtained 30 million reads from each sample, among which 17,230 genes were recognized. Ly6Chigh population had 1,776 genes upregulated compared with Ly6Clow group. Nine upregulated transcription factors were identified within Ly6Chigh 1,776 gene list. (D) Ly6c promoter analysis. Two core promoter regions (−1348/−947, −348/454, blue rectangle) were predicted by Encode. CEBPα transcription factor binding sites (−957/−952, −236/−231, grey diamond) were identified in mouse Ly6c core promoter regions by PROMO. (E) Frequency of CEBPα+ cells among total Ly6C+ MCs. N=4 mice. *P<0.05 vs CT diet mice with the same genotype. Synergy was defined as HHcy and T2DM produced a greater effects in db/db mice on HM diet than the sum of that in HHcy and T2DM alone. WBC, white blood cell.
Ly6C knockdown partially rescued T2DM+HHcy-induced inflammatory MC differentiation and vascular dysfunction —
Since inflammatory cytokine 52 and ROS 53 play key roles in the pathogenesis of vascular dysfunction, and they are the main products from inflammatory MC (Fig. 8), we hypothesized that enhanced inflammatory monocyte differentiation could contribute HHcy-worsened vascular dysfunction in T2DM mice. To test this hypothesis, we evaluated the effects of depleting Ly6C on MC using four Ly6c-shRNAs (shLy6c-A/B/C/D) on lentiviral vectors (Fig. 11A). We selected LV-shLy6c-D as our depleting vector since it resulted in a 72% of depletion of Ly6C expression in isolated BM cells with 48-hour lentivirus transduction (Figs. 11B–C). Next, we utilized BMT to determine the role of Ly6C knockdown of BM cells on vascular relaxation responses (Figure 11D). Briefly, after irradiation, recipient CD45.2+ db/db B6 mice were injected with CD45.1+ LV-scramble or LV-shLy6c transduced BM cells and they were fed with 8-week HF+HM diet after 4-week post-BMT recovery. Due to the high vulnerability of irradiation death in db/db mice (Fig. 11E), we used a semi-lethal irradiation dose (900 centigray) in the recipient db/db mice with CD45.2 background and achieved 56.7±0.8% chimerism of the donor CD45.1 blood population (Fig. 11F). Interestingly, LV-shLy6C-D transduction had no effects on CD45.1 cell survival (Fig. 11G) and immune cell profile (Figs. 11H–I). However, it drastically reduced donor origin CD45.1 Ly6Chigh DC population from 1.4% to 0.3% (80% reduction), Ly6Chigh granulocyte from 13% to 2% (82% reduction), Ly6Chigh MC from 36% to 4% (81% reduction) and CD45.2 Ly6Chigh DC population from 6% to 1% (79% reduction), Ly6Chigh granulocyte from 18% to 4% (77% reduction) and Ly6Chigh MC from 42% to 5% (88% reduction) in mouse blood (Figs. 11J–K). Ly6C plays a role in promoting DC 54 /MC 55 inflammation as well as granulocyte migration 56. Thus, removing these subsets might explain the protective effects from LV-shLy6c. Most importantly, depletion of Ly6Chigh cells significantly improved insulin intolerance (Fig. 12A) and increased vessel relaxation from 50% to 71% in db/db mice on HF+HM diet (Fig. 12B). Moreover, mouse pancreas sections showed increased insulin+ area from LV-receiving group, indicating improved islet β-cell function (Fig. 12C). This result might explain the ameliorated insulin tolerance.
Figure 11. LV-shLy6c reduced Ly6C expression in HHcy+T2DM mice.
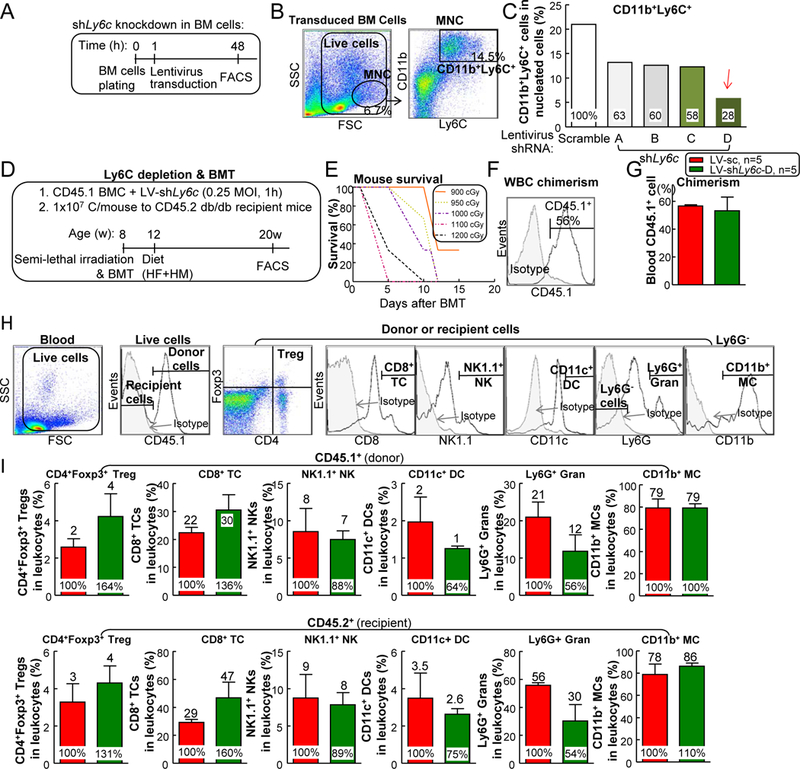
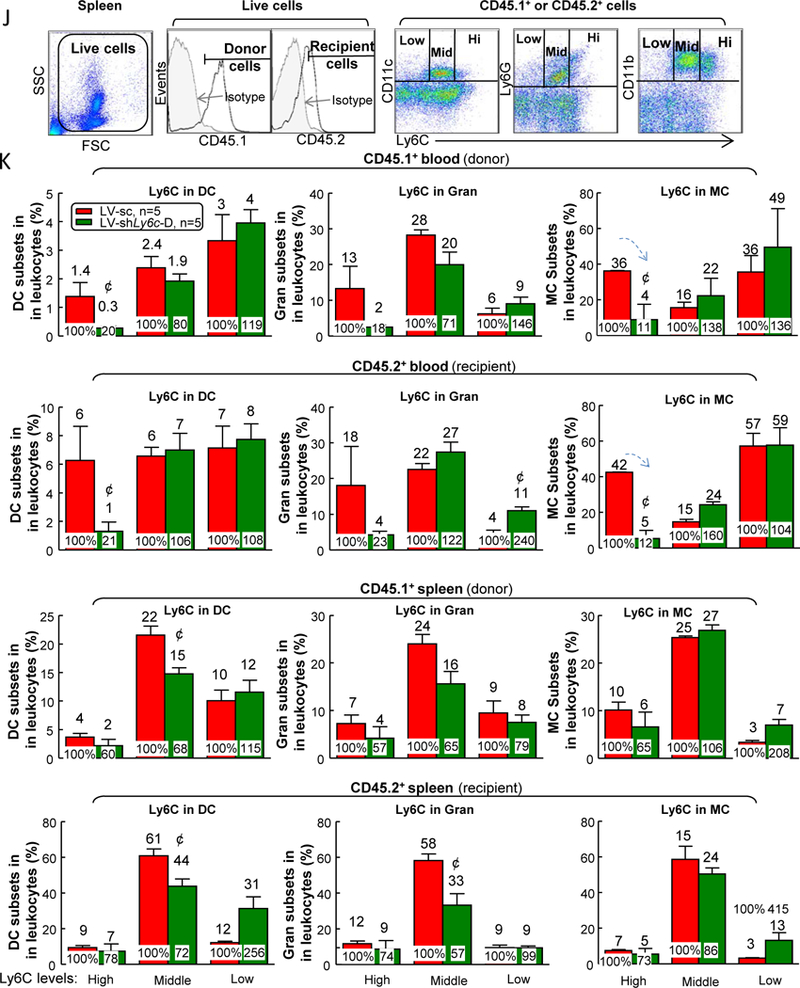
(A) Schematic experimental flow of LV-shLy6c knockdown in bone marrow cell (BMC). (B) Representative dot plots depicting inflammatory MC (CD11b+Ly6C+ cells). Primary wild-type mouse BM cells were transfected with 0.2 MOI LV-shLy6c A, B, C, D or scramble CT for 24 hours. Data were plotted as a percentage of the total MNCs. (C) Quantitative analysis of inflammatory MC. LV-shLy6c transfected BMC are shown in bar graphs. Please note that LV-shLy6c D had maximal inhibition on Ly6C expression. (D) Schematic experimental flow of BMT. (E) Survival curve in db/db mice receiving different doses of BM irradiation without transplantation. (F) Blood chimerism in partial BM cell reconstituted db/db mice. (G) Donor CD45.1 BM cell survival in the recipient db/db mice. (H) Schematic gating strategy of different leukocyte populations in mouse blood. (I) Quantitative analysis of different leukocyte populations. (J) LV-shLy6c decreased Ly6C expression in mononuclear cell populations of HHcy+T2DM mice. (K) Quantitative analysis of Ly6C expression in other mononuclear cell populations. N=5 mice. ¢P<0.05 compared with LV-scramble receiving mice. BMC, bone marrow cell; cGy, centigray; Gran, granulocyte; sc, scramble; WBC, white blood cell.
Figure 12. LV-shLy6c reversed vascular dysfunction in HHcy+T2DM mice.
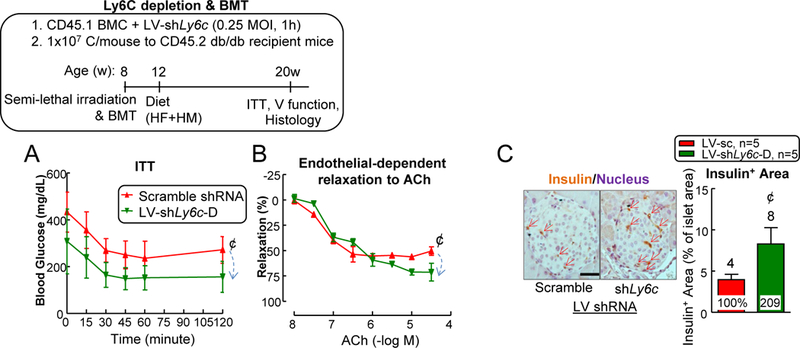
LV-shLy6c D partially reversed insulin intolerance (A) and vascular dysfunction (B) in HHcy+T2DM mice. (C) Histochemical analysis of insulin production in pancreatic islets. Pancreatic sections were stained for insulin (brown) and nuclei (hematoxylin: purple) and measure of insulin-positive area proportion of islet area showing increased insulin secretion in LV-shLy6C receiving mice. Scale bar: 200 μm. N=5 mice, 2 vessel segments/mouse. ¢P<0.05 compared with LV-scramble receiving mice. BMC, bone marrow cell. V, vascular.
DISCUSSION
HHcy and T2DM have a combined accelerating effect on endothelial dysfunction in patients 4, but its underlying mechanism is unclear. Therefore, in this study, we examined the effects of HHcy+T2DM in inflammatory MC/MØ differentiation, lipid/glucose metabolism, and vascular function in a mouse model. We have made the following key findings: (1) Metabolically, T2DM synergistically worsened Hcy metabolism, and HHcy worsened insulin intolerance; (2) Combination of HHcy and T2DM led to splenomegaly; (3) HHcy promoted inflammatory MC differentiation in spleen and blood in T2DM mice; (4) HHcy+T2DM’s effect on inflammatory MC induction was more pronounced under hyperlipidemia condition; (5) HHcy increased MNC, MC, and inflammatory MC populations in BM, blood, and spleen, and promoted inflammatory M1 MØ differentiation in the blood and spleen of T2DM mice, which were reversed by folic acid-based Hcy-lowering therapy; (6) HHcy promoted vascular inflammation and endothelial dysfunction in T2DM mice. HHcy increased inflammatory MC in the aorta and exacerbated impaired endothelium-dependent aortic relaxation in T2DM mice, presumably due to increased TNF-α and ROS production; (7) HHcy and T2DM might promote Ly6C+ MC via upregulation of CEBPα; and (8) Transfusion of BM cells with Ly6Chigh cell depletion by LV-shLy6c improved insulin tolerance and endothelial-dependent aortic relaxation in HHcy T2DM mice.
Our current study provided new information on the pathological crosstalk between HHcy and glucose metabolism. We presented here that T2DM further increased blood Hcy levels in db/db mice fed with a HF+HM diet, and that HHcy reciprocally worsened insulin intolerance. This is consistent with the findings we previously reported from STZ-induced hyperglycemia Cbs−/− mice and in db/db T2DM fed with a HM diet 3, 14, 28. The crosstalk between T2DM and HHcy reveals the pathological connection between these two metabolic disorders and might explain why HHcy elevated mortality in T2DM patients 2. Thus, metabolic normalization on HHcy, such as Hcy-lowering therapy, might benefit both T1DM and T2DM patients.
Similarly, we discovered an aberrant crosstalk between HHcy and lipid metabolism. Eight-weeks of HM diet, increased plasma Hcy levels to 31 μM in db/+ control mice, and to 48 μM in db/db T2DM mice 3. However, with lipid enrichment, 8-weeks of HF+HM diet increased plasma Hcy levels to to 129 μM in db/+ control mice, and 180 μM in db/db T2DM mice. HF+HM diet further promoted inflammatory response in all peripheral tissues in mice. For example, BM inflammatory MC increase was only observed in db/+ and db/db mice on HF+HM diet, but not in mice fed a HM diet. The short period of lipid enrichment (8w) impaired endothelial-dependent vessel relaxation in db/db T2DM mice, but it did not introduce atherosclerotic lesion in the aortic sinus, a phenotype that is usually observed in wild type C57/B6 mice with at least 20 weeks HF diet supplement.
We observed a splenomegaly phenotype in HHcy T2DM mice, but not in mice with single HHcy or T2DM metabolic disorder. This result suggests that spleen-related immune response plays a key pathological role in HHcy+T2DM mice. The splenomegaly phenotype may be explained by synergistically increased MC and inflammatory MC populations in HHcy and T2DM mice since we did not observe other cell population changes (Figs. 3&4). The mechanism underlying this synergistic inflammatory MC response is still under investigation. Three TFs, PU.1, IRF8 and Kruppel-like factor 4 (KLF4), have been implicated in inflammatory MC differentiation in steady state 57. PU.1 is critical for early steps myeloid development 58 and overexpression of PU.1 leads to activation of IRF8 and KLF4 59, 60 and inflammatory MC differentiation. In hyperglycemia condition, it was shown that S100A8/S100A9 and RAGE regulate common myeloid progenitor cells, leading to enhanced proliferation and releasing of inflammatory MCs 61. Furthermore, we have previously demonstrated that HHcy and hyperglycemia could individually and synergistically increase inflammatory MC differentiation via DNA hypomethylation-related mechanisms 28. Here, we demonstrated that CEBPα might be the potential TF responsible for the upregulated inflammatory MC in T2DM+HHcy mice (Fig. 10). Future experiments are needed to further consolidate CEBPα or other regulators in mediating inflammatory MC subset differentiation in physiologic and pathologic responses.
Endothelium-dependent aortic vessel relaxation to ACh was impaired in HHcy+T2DM mice (Fig. 9). In the current study, we observed that HHcy+T2DM induced aortic inflammatory MC differentiation (Figs. 4–6), which correlates with increased plasma levels of TNFα and ROS (Fig. 8). TNF-α can intensify oxidative stress in an NADPH oxidase (Nox)-dependent manner 62. Thus, increased TNFα and ROS might indicate augmented Nox expression and activity 63. Nox leads to oxidation of tetrahydrobiopterin, a critical cofactor for the eNOS, and in tetrahydrobiopterin’s absence eNOS becomes “uncoupled,” producing more ROSs rather than NO 64. This decreased NO production from eNOS potentially mediate impaired endothelium-dependent vasodilation that is observed in the aortas of db/db mice on HF+HM (Fig. 9B).
We used LV-shLy6c transduction in WT donor BM cells to knockdown Ly6C. BMT in recipient CD45.2 db mice resulted in 50–60% of CD45.1 chimerism (Fig. 11F), and effectively depleted donor-origin Ly6Chigh MCs (CD45.1) by ~90% in vivo (Fig. 11K). It is likely that the vanished Ly6Chigh MC population is converted to Ly6Cmiddle and Ly6Clow MC. The partial reduction of recipient-origin Ly6Chigh MCs (CD45.2) may be explained by the viral particles that are released from donor cells, which subsequently transduced nearby recipient Ly6Chigh MCs and hematopoietic progenitor cell, as suggested in previous study 65.
Similar Ly6C reduction was also observed in DC and granulocytes (Fig. 11K). Indeed, expression of Ly6C is not only expressed on MCs, but also found on DCs, granulocytes, CD8+ TCs 66, NK cells 67, and CD4+ TCs including Tregs 68. As is the case for MC, other immune populations can be subdivided into Ly6C+ and Ly6C− subsets with distinct functions and physiological roles. For example, Ly6C+ DC is characterized as inflammatory DC 69. In granulocyte, Ly6C has a potential role in migration and activation as it interacts with relevant protein Fgr, a member of the Src family of tyrosine kinases. In CD8+ cytotoxic TCs, specific Ly6C monoclonal antibody could induce proliferation, activation, homing and migration. Ly6C+ NK cells are in an inert state as evidenced by the production of lower levels of IFN-γ and granzyme B, and they exhibit poorer proliferative potential than Ly6C− NK cells. CD4+Ly6C+ TCs have highly differentiated effector with more cytokine production and effector molecules 70. Ly6C+ Tregs marks for a lower degree of activation, proliferation, and differentiation status as well as functional incompetence. Therefore, the beneficial effects from LV-shLy6c could possibly be resulted from Ly6C deletion in other cell types as well.
We found that insulin intolerance and vascular dysfunction were both partially improved via Ly6C knockdown (Fig. 12), which might be attributable to Ly6C reduction in the immune cells and better responding pancreatic β cells since we observed increased insulin secretion. The un-rescued vascular function could be due to other immune cell differentiation and the non-corrected pathological conditions (insulin resistance, hyperhomocysteinemia, hyperglycemia, hyperinsulinemia, etc.) in the recipient mice. Interestingly, insulin tolerance and endothelial-dependent relaxation to ACh were not only improved in LV-shLy6c BM receiving mice, but also in LV-scramble shRNA BM receiving mice. This better basal vascular relaxation responses might be due to the benefit from healthier WT donor cells, which is in good accordance with previous findings which showed that BMT of WT cells corrected obese and hyperglycemia conditions in db/db mice 71.
Our data further confirmed that folic acid-based Hcy-lowering therapy is beneficial for systemic and vascular inflammation in diet-induced severe HHcy and db/db T2DM mice. We have previously shown that folic acid could also rescue HHcy-induced atherosclerotic lesion, plasma inflammatory cytokine increase, and blood and vessel inflammatory MC accumulation in Ldlr−/−Cbs−/+ mice fed a HM diet 31. In in vitro experimental model, we also found that folic acid treatment reversed Hcy-induced Ly6Chigh differentiation in primary mouse splenocytes 31. Further, folic acid-based Hcy-lowering therapy lowered risk of stroke, myocardial infarction or death in secondary prevention trials, including VITATOPS 72, VISP 73, HOPE2 74, and primary prevention trial CSSPT 75, 76. Mechanistically, folic acid is a key source for Hcy remethylation, which release metabolic pressure from cellular hypomethylation, a critical mechanism for CVD and other degenerative diseases 77, 78. Considering the dramatic benefits of folic acid-based Hcy lowering therapy in the double metabolic disordered mice in this and our previous studies 31, folic acid-based Hcy lowering appears to be an effective therapy for the treatment of inflammatory response and CVD in patients with multiple risk factors.
In conclusion, our study is the first to demonstrate the causative effect of HHcy in promoting systemic/vascular inflammatory Ly6C+ MC differentiation, and Ly6C+ cell-dependent endothelial dysfunction and insulin resistance in T2DM. We propose that inflammatory Ly6C+ MC is a novel therapeutic target and that folic acid-based Hcy lowering could serve as an effective therapy for patients with combined metabolic disorders, including HHcy, hyperlipidemia, hyperglycemia, and hyperinsulinemia.
Supplementary Material
Highlights.
HHcy promotes systemic/vascular inflammatory MC differentiation in T2DM
HHcy worsens inflammatory MC-dependent endothelial dysfunction and insulin resistance in T2DM
Folic acid-based Hcy lowering and LV-shLy6C are effective therapies to reduce inflammatory MCs in HHcy+T2DM
ACKNOWLEDGMENTS
a) Acknowledgments: We thank Dr. Michael J. Zdilla for providing EPR machine in plasma ROS measurement. We also thank Dr. Joseph Rabinowitz for viral particle packaging and titration.
b) Sources of Funding: This work was supported in part by the NIH grants HL67033, HL77288, HL82774, HL-110764, HL130233, HL131460, DK104114 and DK113775 to Hong Wang, HL132399, HL138749 to Xiao-Feng Yang, T32 Hematopoiesis Training Grant 5T32DK007780 to Xinyuan Li, and AHA SDG 17SDG33671051 to Pu Fang.
Abbreviations:
- ACh
acetylcholine
- BM
bone marrow
- BMT
bone marrow transplantation
- C
cholesterol
- CT
control
- CVD
cardiovascular diseases
- DC
dendritic cell
- eNOS
endothelial nitric oxide synthase
- Hcy
homocysteine
- HF
high fat
- HHcy
hyperhomocysteinemia
- HM
high methionine
- HV
high vitamin
- IL
interleukin
- LV
lentivirus
- MØ
macrophage
- MC
monocyte
- MCP-1
monocyte chemoattractant protein-1
- MNC
mononuclear cell
- NK
natural killer cell
- NO
nitric oxide
- ROS
reactive oxygen species
- T2DM
type 2 diabetes mellitus
- TF
transcription factor
- TNF
tumor necrosis factor
- WT
wild type
Footnotes
GUARANTOR STATEMENT
HW is the guarantors of this work and, as such, had full access to all the data in the study and take responsibility for the integrity of the data and the accuracy of the data analysis.
CONFLICT OF INTEREST:
The authors have declared that no conflict of interest exists.
c) Disclosure: None
References
- 1.Clarke R, Daly L, Robinson K, Naughten E, Cahalane S, Fowler B, Graham I. Hyperhomocysteinemia: An independent risk factor for vascular disease. The New England journal of medicine. 1991;324:1149–1155 [DOI] [PubMed] [Google Scholar]
- 2.Soinio M, Marniemi J, Laakso M, Lehto S, Ronnemaa T. Elevated plasma homocysteine level is an independent predictor of coronary heart disease events in patients with type 2 diabetes mellitus. Annals of internal medicine. 2004;140:94–100 [DOI] [PubMed] [Google Scholar]
- 3.Cheng Z, Shen X, Jiang X, Shan H, Cimini M, Fang P, Ji Y, Park JY, Drosatos K, Yang X, Kevil CG, Kishore R, Wang H. Hyperhomocysteinemia potentiates diabetes-impaired edhf-induced vascular relaxation: Role of insufficient hydrogen sulfide. Redox biology. 2018;16:215–225 [DOI] [PMC free article] [PubMed] [Google Scholar]
- 4.Hu Y, Xu Y, Wang G. Homocysteine levels are associated with endothelial function in newly diagnosed type 2 diabetes mellitus patients. Metabolic syndrome and related disorders. 2019 [DOI] [PubMed] [Google Scholar]
- 5.Eberhardt RT, Forgione MA, Cap A, et al. Endothelial dysfunction in a murine model of mild hyperhomocyst(e)inemia. The Journal of clinical investigation. 2000;106:483–491 [DOI] [PMC free article] [PubMed] [Google Scholar]
- 6.Kim CS, Kim YR, Naqvi A, Kumar S, Hoffman TA, Jung SB, Kumar A, Jeon BH, McNamara DM, Irani K. Homocysteine promotes human endothelial cell dysfunction via site-specific epigenetic regulation of p66shc. Cardiovascular research. 2011;92:466–475 [DOI] [PMC free article] [PubMed] [Google Scholar]
- 7.Cheng Z, Jiang X, Kruger WD, Pratico D, Gupta S, Mallilankaraman K, Madesh M, Schafer AI, Durante W, Yang X, Wang H. Hyperhomocysteinemia impairs endothelium-derived hyperpolarizing factor-mediated vasorelaxation in transgenic cystathionine beta synthase-deficient mice. Blood. 2011;118:1998–2006 [DOI] [PMC free article] [PubMed] [Google Scholar]
- 8.Barbato JC, Catanescu O, Murray K, DiBello PM, Jacobsen DW. Targeting of metallothionein by l-homocysteine: A novel mechanism for disruption of zinc and redox homeostasis. Arteriosclerosis, thrombosis, and vascular biology. 2007;27:49–54 [DOI] [PMC free article] [PubMed] [Google Scholar]
- 9.Weiss N, Zhang YY, Heydrick S, Bierl C, Loscalzo J. Overexpression of cellular glutathione peroxidase rescues homocyst(e)ine-induced endothelial dysfunction. Proceedings of the National Academy of Sciences of the United States of America. 2001;98:12503–12508 [DOI] [PMC free article] [PubMed] [Google Scholar]
- 10.Xi H, Zhang Y, Xu Y, Yang WY, Jiang X, Sha X, Cheng X, Wang J, Qin X, Yu J, Ji Y, Yang X, Wang H. Caspase-1 inflammasome activation mediates homocysteine-induced pyrop-apoptosis in endothelial cells. Circulation research. 2016;118:1525–1539 [DOI] [PMC free article] [PubMed] [Google Scholar]
- 11.Dudman NP, Temple SE, Guo XW, Fu W, Perry MA. Homocysteine enhances neutrophil-endothelial interactions in both cultured human cells and rats in vivo. Circulation research. 1999;84:409–416 [DOI] [PubMed] [Google Scholar]
- 12.Stuhlinger MC, Oka RK, Graf EE, Schmolzer I, Upson BM, Kapoor O, Szuba A, Malinow MR, Wascher TC, Pachinger O, Cooke JP. Endothelial dysfunction induced by hyperhomocyst(e)inemia: Role of asymmetric dimethylarginine. Circulation. 2003;108:933–938 [DOI] [PubMed] [Google Scholar]
- 13.Chao CL, Kuo TL, Lee YT. Effects of methionine-induced hyperhomocysteinemia on endothelium-dependent vasodilation and oxidative status in healthy adults. Circulation. 2000;101:485–490 [DOI] [PubMed] [Google Scholar]
- 14.Cheng Z, Jiang X, Pansuria M, Fang P, Mai J, Mallilankaraman K, Gandhirajan RK, Eguchi S, Scalia R, Madesh M, Yang X, Wang H. Hyperhomocysteinemia and hyperglycemia induce and potentiate endothelial dysfunction via mu-calpain activation. Diabetes. 2015;64:947–959 [DOI] [PMC free article] [PubMed] [Google Scholar]
- 15.Dayal S, Bottiglieri T, Arning E, Maeda N, Malinow MR, Sigmund CD, Heistad DD, Faraci FM, Lentz SR. Endothelial dysfunction and elevation of s-adenosylhomocysteine in cystathionine beta-synthase-deficient mice. Circulation research. 2001;88:1203–1209 [DOI] [PubMed] [Google Scholar]
- 16.Caballero AE, Arora S, Saouaf R, Lim SC, Smakowski P, Park JY, King GL, LoGerfo FW, Horton ES, Veves A. Microvascular and macrovascular reactivity is reduced in subjects at risk for type 2 diabetes. Diabetes. 1999;48:1856–1862 [DOI] [PubMed] [Google Scholar]
- 17.de Jager J, Dekker JM, Kooy A, Kostense PJ, Nijpels G, Heine RJ, Bouter LM, Stehouwer CD. Endothelial dysfunction and low-grade inflammation explain much of the excess cardiovascular mortality in individuals with type 2 diabetes: The hoorn study. Arteriosclerosis, thrombosis, and vascular biology. 2006;26:1086–1093 [DOI] [PubMed] [Google Scholar]
- 18.Costantino S, Paneni F, Battista R, Castello L, Capretti G, Chiandotto S, Tanese L, Russo G, Pitocco D, Lanza GA, Volpe M, Luscher TF, Cosentino F. Impact of glycemic variability on chromatin remodeling, oxidative stress, and endothelial dysfunction in patients with type 2 diabetes and with target hba1c levels. Diabetes. 2017;66:2472–2482 [DOI] [PubMed] [Google Scholar]
- 19.Kumar S, Kim YR, Vikram A, Naqvi A, Li Q, Kassan M, Kumar V, Bachschmid MM, Jacobs JS, Kumar A, Irani K. Sirtuin1-regulated lysine acetylation of p66shc governs diabetes-induced vascular oxidative stress and endothelial dysfunction. Proceedings of the National Academy of Sciences of the United States of America. 2017;114:1714–1719 [DOI] [PMC free article] [PubMed] [Google Scholar]
- 20.Kobayashi T, Taguchi K, Yasuhiro T, Matsumoto T, Kamata K. Impairment of pi3-k/akt pathway underlies attenuated endothelial function in aorta of type 2 diabetic mouse model. Hypertension. 2004;44:956–962 [DOI] [PubMed] [Google Scholar]
- 21.Kim JA, Montagnani M, Koh KK, Quon MJ. Reciprocal relationships between insulin resistance and endothelial dysfunction: Molecular and pathophysiological mechanisms. Circulation. 2006;113:1888–1904 [DOI] [PubMed] [Google Scholar]
- 22.Kassan M, Choi SK, Galan M, Bishop A, Umezawa K, Trebak M, Belmadani S, Matrougui K. Enhanced nf-kappab activity impairs vascular function through parp-1-, sp-1-, and cox-2-dependent mechanisms in type 2 diabetes. Diabetes. 2013;62:2078–2087 [DOI] [PMC free article] [PubMed] [Google Scholar]
- 23.Gao X, Belmadani S, Picchi A, Xu X, Potter BJ, Tewari-Singh N, Capobianco S, Chilian WM, Zhang C. Tumor necrosis factor-alpha induces endothelial dysfunction in lepr(db) mice. Circulation. 2007;115:245–254 [DOI] [PubMed] [Google Scholar]
- 24.Zhang H, Zhang J, Ungvari Z, Zhang C. Resveratrol improves endothelial function: Role of tnf{alpha} and vascular oxidative stress. Arteriosclerosis, thrombosis, and vascular biology. 2009;29:1164–1171 [DOI] [PMC free article] [PubMed] [Google Scholar]
- 25.Rask-Madsen C, Dominguez H, Ihlemann N, Hermann T, Kober L, Torp-Pedersen C. Tumor necrosis factor-alpha inhibits insulin’s stimulating effect on glucose uptake and endothelium-dependent vasodilation in humans. Circulation. 2003;108:1815–1821 [DOI] [PubMed] [Google Scholar]
- 26.Laakso M Cardiovascular disease in type 2 diabetes from population to man to mechanisms: The kelly west award lecture 2008. Diabetes care. 2010;33:442–449 [DOI] [PMC free article] [PubMed] [Google Scholar]
- 27.Walcher D, Babiak C, Poletek P, Rosenkranz S, Bach H, Betz S, Durst R, Grub M, Hombach V, Strong J, Marx N. C-peptide induces vascular smooth muscle cell proliferation: Involvement of src-kinase, phosphatidylinositol 3-kinase, and extracellular signal-regulated kinase 1/2. Circulation research. 2006;99:1181–1187 [DOI] [PubMed] [Google Scholar]
- 28.Fang P, Zhang D, Cheng Z, Yan C, Jiang X, Kruger WD, Meng S, Arning E, Bottiglieri T, Choi ET, Han Y, Yang XF, Wang H. Hyperhomocysteinemia potentiates hyperglycemia-induced inflammatory monocyte differentiation and atherosclerosis. Diabetes. 2014;63:4275–4290 [DOI] [PMC free article] [PubMed] [Google Scholar]
- 29.Loughner CL, Bruford EA, McAndrews MS, Delp EE, Swamynathan S, Swamynathan SK. Organization, evolution and functions of the human and mouse ly6/upar family genes. Human genomics. 2016;10:10. [DOI] [PMC free article] [PubMed] [Google Scholar]
- 30.Tacke F, Alvarez D, Kaplan TJ, Jakubzick C, Spanbroek R, Llodra J, Garin A, Liu J, Mack M, van Rooijen N, Lira SA, Habenicht AJ, Randolph GJ. Monocyte subsets differentially employ ccr2, ccr5, and cx3cr1 to accumulate within atherosclerotic plaques. The Journal of clinical investigation. 2007;117:185–194 [DOI] [PMC free article] [PubMed] [Google Scholar]
- 31.Zhang D, Fang P, Jiang X, Nelson J, Moore JK, Kruger WD, Berretta RM, Houser SR, Yang X, Wang H. Severe hyperhomocysteinemia promotes bone marrow-derived and resident inflammatory monocyte differentiation and atherosclerosis in ldlr/cbs-deficient mice. Circulation research. 2012;111:37–49 [DOI] [PMC free article] [PubMed] [Google Scholar]
- 32.Carlin LM, Stamatiades EG, Auffray C, Hanna RN, Glover L, Vizcay-Barrena G, Hedrick CC, Cook HT, Diebold S, Geissmann F. Nr4a1-dependent ly6c(low) monocytes monitor endothelial cells and orchestrate their disposal. Cell. 2013;153:362–375 [DOI] [PMC free article] [PubMed] [Google Scholar]
- 33.Auffray C, Fogg D, Garfa M, Elain G, Join-Lambert O, Kayal S, Sarnacki S, Cumano A, Lauvau G, Geissmann F. Monitoring of blood vessels and tissues by a population of monocytes with patrolling behavior. Science. 2007;317:666–670 [DOI] [PubMed] [Google Scholar]
- 34.Rahman K, Vengrenyuk Y, Ramsey SA, Vila NR, Girgis NM, Liu J, Gusarova V, Gromada J, Weinstock A, Moore KJ, Loke P, Fisher EA. Inflammatory ly6chi monocytes and their conversion to m2 macrophages drive atherosclerosis regression. The Journal of clinical investigation. 2017;127:2904–2915 [DOI] [PMC free article] [PubMed] [Google Scholar]
- 35.Nahrendorf M, Swirski FK, Aikawa E, Stangenberg L, Wurdinger T, Figueiredo JL, Libby P, Weissleder R, Pittet MJ. The healing myocardium sequentially mobilizes two monocyte subsets with divergent and complementary functions. The Journal of experimental medicine. 2007;204:3037–3047 [DOI] [PMC free article] [PubMed] [Google Scholar]
- 36.Yang J, Zhang L, Yu C, Yang XF, Wang H. Monocyte and macrophage differentiation: Circulation inflammatory monocyte as biomarker for inflammatory diseases. Biomarker research. 2014;2:1. [DOI] [PMC free article] [PubMed] [Google Scholar]
- 37.Wenzel P, Knorr M, Kossmann S, et al. Lysozyme m-positive monocytes mediate angiotensin ii-induced arterial hypertension and vascular dysfunction. Circulation. 2011;124:1370–1381 [DOI] [PubMed] [Google Scholar]
- 38.Lee DL, Sturgis LC, Labazi H, Osborne JB, Fleming C, Pollock JS, Manhiani M, Imig JD, Brands MW. Angiotensin ii hypertension is attenuated in interleukin-6 knockout mice. American journal of physiology. Heart and circulatory physiology. 2006;290:H935–940 [DOI] [PubMed] [Google Scholar]
- 39.Kempe S, Kestler H, Lasar A, Wirth T. Nf-kappab controls the global pro-inflammatory response in endothelial cells: Evidence for the regulation of a pro-atherogenic program. Nucleic acids research. 2005;33:5308–5319 [DOI] [PMC free article] [PubMed] [Google Scholar]
- 40.Pober JS, Cotran RS. The role of endothelial cells in inflammation. Transplantation. 1990;50:537–544 [DOI] [PubMed] [Google Scholar]
- 41.Sprague AH, Khalil RA. Inflammatory cytokines in vascular dysfunction and vascular disease. Biochemical pharmacology. 2009;78:539–552 [DOI] [PMC free article] [PubMed] [Google Scholar]
- 42.Szmitko PE, Wang CH, Weisel RD, de Almeida JR, Anderson TJ, Verma S. New markers of inflammation and endothelial cell activation: Part i. Circulation. 2003;108:1917–1923 [DOI] [PubMed] [Google Scholar]
- 43.Karbach S, Croxford AL, Oelze M, et al. Interleukin 17 drives vascular inflammation, endothelial dysfunction, and arterial hypertension in psoriasis-like skin disease. Arteriosclerosis, thrombosis, and vascular biology. 2014;34:2658–2668 [DOI] [PubMed] [Google Scholar]
- 44.Csiszar A, Ungvari Z. Endothelial dysfunction and vascular inflammation in type 2 diabetes: Interaction of age/rage and tnf-alpha signaling. American journal of physiology. Heart and circulatory physiology. 2008;295:H475–476 [DOI] [PMC free article] [PubMed] [Google Scholar]
- 45.Clapp BR, Hirschfield GM, Storry C, Gallimore JR, Stidwill RP, Singer M, Deanfield JE, MacAllister RJ, Pepys MB, Vallance P, Hingorani AD. Inflammation and endothelial function: Direct vascular effects of human c-reactive protein on nitric oxide bioavailability. Circulation. 2005;111:1530–1536 [DOI] [PubMed] [Google Scholar]
- 46.Ducros V, Belva-Besnet H, Casetta B, Favier A. A robust liquid chromatography tandem mass spectrometry method for total plasma homocysteine determination in clinical practice. Clinical chemistry and laboratory medicine. 2006;44:987–990 [DOI] [PubMed] [Google Scholar]
- 47.Kuzkaya N, Weissmann N, Harrison DG, Dikalov S. Interactions of peroxynitrite with uric acid in the presence of ascorbate and thiols: Implications for uncoupling endothelial nitric oxide synthase. Biochemical pharmacology. 2005;70:343–354 [DOI] [PubMed] [Google Scholar]
- 48.Mervaala EM, Teravainen TL, Malmberg L, Laakso J, Vapaatalo H, Karppanen H. Cardiovascular effects of a low-dose combination of ramipril and felodipine in spontaneously hypertensive rats. British journal of pharmacology. 1997;121:503–510 [DOI] [PMC free article] [PubMed] [Google Scholar]
- 49.Palmer G, Aurrand-Lions M, Contassot E, Talabot-Ayer D, Ducrest-Gay D, Vesin C, Chobaz-Peclat V, Busso N, Gabay C. Indirect effects of leptin receptor deficiency on lymphocyte populations and immune response in db/db mice. Journal of immunology. 2006;177:2899–2907 [DOI] [PubMed] [Google Scholar]
- 50.Chan N, Chan JC. Implication of fibrate therapy for homocysteine. Lancet. 1999;354:1208–1209 [DOI] [PubMed] [Google Scholar]
- 51.Rochette L, Lorin J, Zeller M, Guilland JC, Lorgis L, Cottin Y, Vergely C. Nitric oxide synthase inhibition and oxidative stress in cardiovascular diseases: Possible therapeutic targets? Pharmacology & therapeutics. 2013;140:239–257 [DOI] [PubMed] [Google Scholar]
- 52.Ramji DP, Davies TS. Cytokines in atherosclerosis: Key players in all stages of disease and promising therapeutic targets. Cytokine & growth factor reviews. 2015;26:673–685 [DOI] [PMC free article] [PubMed] [Google Scholar]
- 53.Drummond GR, Selemidis S, Griendling KK, Sobey CG. Combating oxidative stress in vascular disease: Nadph oxidases as therapeutic targets. Nature reviews. Drug discovery. 2011;10:453–471 [DOI] [PMC free article] [PubMed] [Google Scholar]
- 54.Mesnil C, Sabatel CM, Marichal T, Toussaint M, Cataldo D, Drion PV, Lekeux P, Bureau F, Desmet CJ. Resident cd11b(+)ly6c(−) lung dendritic cells are responsible for allergic airway sensitization to house dust mite in mice. PloS one. 2012;7:e53242 [DOI] [PMC free article] [PubMed] [Google Scholar]
- 55.Narasimhan PB, Marcovecchio P, Hamers AAJ, Hedrick CC. Nonclassical monocytes in health and disease. Annual review of immunology. 2019;37:439–456 [DOI] [PubMed] [Google Scholar]
- 56.Kowanetz M, Wu X, Lee J, et al. Granulocyte-colony stimulating factor promotes lung metastasis through mobilization of ly6g+ly6c+ granulocytes. Proceedings of the National Academy of Sciences of the United States of America. 2010;107:21248–21255 [DOI] [PMC free article] [PubMed] [Google Scholar]
- 57.Fang P, Li X, Dai J, Cole L, Camacho JA, Zhang Y, Ji Y, Wang J, Yang XF, Wang H. Immune cell subset differentiation and tissue inflammation. Journal of hematology & oncology. 2018;11:97. [DOI] [PMC free article] [PubMed] [Google Scholar]
- 58.Iwasaki H, Akashi K. Myeloid lineage commitment from the hematopoietic stem cell. Immunity. 2007;26:726–740 [DOI] [PubMed] [Google Scholar]
- 59.Zhu YP, Thomas GD, Hedrick CC. 2014 jeffrey m. Hoeg award lecture: Transcriptional control of monocyte development. Arteriosclerosis, thrombosis, and vascular biology. 2016;36:1722–1733 [DOI] [PMC free article] [PubMed] [Google Scholar]
- 60.Alder JK, Georgantas RW 3rd, Hildreth RL, Kaplan IM, Morisot S, Yu X, McDevitt M, Civin CI. Kruppel-like factor 4 is essential for inflammatory monocyte differentiation in vivo. Journal of immunology. 2008;180:5645–5652 [DOI] [PMC free article] [PubMed] [Google Scholar]
- 61.Nagareddy PR, Murphy AJ, Stirzaker RA, et al. Hyperglycemia promotes myelopoiesis and impairs the resolution of atherosclerosis. Cell metabolism. 2013;17:695–708 [DOI] [PMC free article] [PubMed] [Google Scholar]
- 62.Habtetsion T, Ding ZC, Pi W, et al. Alteration of tumor metabolism by cd4+ t cells leads to tnf-alpha-dependent intensification of oxidative stress and tumor cell death. Cell metabolism. 2018;28:228-242 e226 [DOI] [PMC free article] [PubMed] [Google Scholar]
- 63.Iatsenko I, Boquete JP, Lemaitre B. Microbiota-derived lactate activates production of reactive oxygen species by the intestinal nadph oxidase nox and shortens drosophila lifespan. Immunity. 2018;49:929-942 e925 [DOI] [PubMed] [Google Scholar]
- 64.Landmesser U, Dikalov S, Price SR, McCann L, Fukai T, Holland SM, Mitch WE, Harrison DG. Oxidation of tetrahydrobiopterin leads to uncoupling of endothelial cell nitric oxide synthase in hypertension. The Journal of clinical investigation. 2003;111:1201–1209 [DOI] [PMC free article] [PubMed] [Google Scholar]
- 65.Duran-Struuck R, Dysko RC. Principles of bone marrow transplantation (bmt): Providing optimal veterinary and husbandry care to irradiated mice in bmt studies. Journal of the American Association for Laboratory Animal Science : JAALAS. 2009;48:11–22 [PMC free article] [PubMed] [Google Scholar]
- 66.Lee PY, Wang JX, Parisini E, Dascher CC, Nigrovic PA. Ly6 family proteins in neutrophil biology. Journal of leukocyte biology. 2013;94:585–594 [DOI] [PubMed] [Google Scholar]
- 67.Omi A, Enomoto Y, Kiniwa T, Miyata N, Miyajima A. Mature resting ly6c(high) natural killer cells can be reactivated by il-15. European journal of immunology. 2014;44:2638–2647 [DOI] [PubMed] [Google Scholar]
- 68.Lee JY, Kim J, Yi J, Kim D, Kim HO, Han D, Sprent J, Lee YJ, Surh CD, Cho JH. Phenotypic and functional changes of peripheral ly6c(+) t regulatory cells driven by conventional effector t cells. Frontiers in immunology. 2018;9:437. [DOI] [PMC free article] [PubMed] [Google Scholar]
- 69.Merad M, Sathe P, Helft J, Miller J, Mortha A. The dendritic cell lineage: Ontogeny and function of dendritic cells and their subsets in the steady state and the inflamed setting. Annual review of immunology. 2013;31:563–604 [DOI] [PMC free article] [PubMed] [Google Scholar]
- 70.DeLong JH, Hall AO, Konradt C, Coppock GM, Park J, Harms Pritchard G, Hunter CA. Cytokine- and tcr-mediated regulation of t cell expression of ly6c and sca-1. Journal of immunology. 2018;200:1761–1770 [DOI] [PMC free article] [PubMed] [Google Scholar]
- 71.Flaquer M, Franquesa M, Barquinero J, Lloberas N, Gutierrez C, Torras J, Grinyo JM, Cruzado JM. Bone marrow transplantation induces normoglycemia in a type 2 diabetes mellitus murine model. Transplantation proceedings. 2009;41:2282–2285 [DOI] [PubMed] [Google Scholar]
- 72.Park JH, Saposnik G, Ovbiagele B, Markovic D, Towfighi A. Effect of b-vitamins on stroke risk among individuals with vascular disease who are not on antiplatelets: A meta-analysis. International journal of stroke : official journal of the International Stroke Society. 2016;11:206–211 [DOI] [PubMed] [Google Scholar]
- 73.Towfighi A, Arshi B, Markovic D, Ovbiagele B. Homocysteine-lowering therapy and risk of recurrent stroke, myocardial infarction and death: The impact of age in the visp trial. Cerebrovascular diseases. 2014;37:263–267 [DOI] [PubMed] [Google Scholar]
- 74.Saposnik G, Ray JG, Sheridan P, McQueen M, Lonn E, Heart Outcomes Prevention Evaluation I. Homocysteine-lowering therapy and stroke risk, severity, and disability: Additional findings from the hope 2 trial. Stroke. 2009;40:1365–1372 [DOI] [PubMed] [Google Scholar]
- 75.Huo Y, Li J, Qin X, et al. Efficacy of folic acid therapy in primary prevention of stroke among adults with hypertension in china: The csppt randomized clinical trial. Jama. 2015;313:1325–1335 [DOI] [PubMed] [Google Scholar]
- 76.Ji Y, Tan S, Xu Y, Chandra A, Shi C, Song B, Qin J, Gao Y. Vitamin b supplementation, homocysteine levels, and the risk of cerebrovascular disease: A meta-analysis. Neurology. 2013;81:1298–1307 [DOI] [PubMed] [Google Scholar]
- 77.Yang F, Tan HM, Wang H. Hyperhomocysteinemia and atherosclerosis. Sheng li xue bao : [Acta physiologica Sinica]. 2005;57:103–114 [PubMed] [Google Scholar]
- 78.Jamaluddin MS, Yang X, Wang H. Hyperhomocysteinemia, DNA methylation and vascular disease. Clinical chemistry and laboratory medicine. 2007;45:1660–1666 [DOI] [PubMed] [Google Scholar]
Associated Data
This section collects any data citations, data availability statements, or supplementary materials included in this article.


