

Abstract

Recently, synthesis, characterization, and application of carbon dots have received much attention. Natural products are the effectual carbon precursors to synthesize carbon dots with fascinating chemical and physical properties. In this study, the fluorescent sensor of carbon dots derived from cranberry beans without any functionalization and modification was developed. The carbon dots were prepared with a cheap, facile, and green carbon precursor through a hydrothermal treatment method. The synthetic process was toxic chemical-free, convenient, and environmentally friendly. To find the optimized synthetic conditions, the temperature, heating time duration, and carbon precursor weight were evaluated. The prepared carbon dots were characterized by UV light, transmission electron microscopy, Raman, Fourier transform infrared, UV–vis, and fluorescence spectroscopy. The resulting carbon dots exhibit stable fluorescence with a quantum yield of approximately 10.85%. The carbon dots emitted the broad fluorescence emission range between 410 and 540 nm by changing the excitation wavelength and were used for the detection of Fe3+ ions at the excitation of 380 nm. It is found that Fe3+ ions induced the fluorescence intensity quenching of the carbon dots stronger than other heavy metals and the Fe3+ ion detection can be achieved within 3 min. Spectroscopic data showed that the obtained carbon dots can detect Fe3+ ions within the wide concentration range of 30–600 μM with 9.55 μM detection limit.
Introduction
Nowadays, carbon dots (CDs) receive much attention in the size of around or below 10 nm. The structures and components of CDs have many diverse and superior properties, which, in turn, decide their application since they were discovered in 2004.1 The structures, properties, and applications of CDs were mainly based on their carbon precursors. One of the most important properties of the CDs is their fluorescence (FL) character.2 CDs have many properties and advantages over the conventional semiconductor quantum dots or traditional FL dyes, such as tunable wavelength, chemical inertness, good photostability, small size, less toxicity, environmental friendliness, high biocompatibility, high solubility, good selectivity, good sensitivity, and simple modification.3 Because of their advantages with good properties, CDs were applied in many sectors, such as bioimaging, biosensor, biomedicine delivery system, light-emitting devices, dye-sensitized and organic solar cells, photocatalysis, and chemical sensors.4 To date, many efforts have been employed on the synthesis of CDs due to their superior properties and wide applications. Various bottom-up (microwave, thermal decomposition, hydrothermal treatment, template routes, and plasma treatment) and top-down (arc-discharge, laser ablation, ultrasonic treatment, electrochemical oxidation, and chemical oxidation) approaches are used to synthesize CDs.5 From these methods, hydrothermal treatment has been widely used to synthesize CDs because of their simplicity of preparation, easy control of reaction, low consumption of energy, and green approach.
Green synthesis of CDs has received much attention, which eases the labor, reduces both the cost and time, and produces environmentally benign material with good quantum yield (QY).6 The carbohydrates in natural products composed of C, O, and H elements support the production of CDs with high abundant surface functional groups. The oxygen-related surface functional groups of CDs can enhance water solubility and FL properties. So, natural products as the ideal carbon precursors differ in chemical compositions with large abundant heteroatoms. The use of toxic materials and harsh reaction conditions can be eliminated by using natural carbon precursors. Recently, several reports showed the successful green synthesis of CDs with excellent solubility in water or organic solvents and strong FL properties by hydrothermal treatment from many available natural products, such as rose heart radish,7 citrus peels,8 tribute chrysanthemum,9 mangosteen,10 and many others. Although the use of natural carbon precursors is an effective way to synthesize CDs, a new natural carbon precursor is still challenging to explore with satisfactory physicochemical and optical properties. Therefore, the exploration of natural carbon precursors and the expansion of their applications are highly desirable and still a hot topic. The development of simple and cheap methods to synthesize CDs is also highly desirable.
Heavy metal ions are one of the most hazardous pollutants that cause alarming environmental and health concerns.11 To date, one of the major concerns is the presence of heavy metal ions particularly in aquatic systems.12 Fe3+ ions are one of the most plentiful metal ions in the human body and in the environments. The excess of iron causes severe problems, such as liver damage, kidney failure, or even death.13 In this regard, developing effective analytical methods for the detection of Fe3+ ions or other metal ions is very important and becomes a hot topic among researchers. Then, the FL quenching efficiency is one of the promising approaches for the detection of metal ions.
Recently, CDs as the FL sensor are widely applied. The corresponding applications have been explored with the preparation of CDs derived from natural products. The specific application of CDs is attributed to the different natural carbon precursors with various chemical structures. As a result, there are many efforts to develop FL sensors for Fe3+ ions. The efforts are still made to the detailed sensing mechanism, even though CDs with sensing abilities have been informed continuously. Cranberry bean (CB), one of the natural products, is a variety of common beans of the worldwide agricultural product with high yield production and commercially available in traditional and modern markets with cheap price. CB was used as a carbon precursor because CB contains a large abundance of carbohydrates, proteins, fibers, vitamins, sugars, and amino acids.14,15 Different kinds of beans contain different amounts of carbohydrates and proteins. For example, asparagus beans, peas, lentils, soybeans, cranberry beans, and chickpeas contain 8, 14, 20, 30, 60, and 61 g of carbohydrates and 2.8, 5, 9, 36, 23, and 19 g of proteins in 100 g of beans, respectively.16 Compared with the mentioned beans, CBs contain a higher amount of carbohydrates (60 g) and proteins (23 g) with a total of 83 g for both biomolecules. So, CB was chosen for the first time as a new and cheap carbon precursor to synthesize CDs by the hydrothermal treatment method without functionalization and modification. The nanostructure and functional groups of the CB-CDs were analyzed. The emission bands of the CB-CDs shifting with the change of excitation wavelength were observed. The CB-CDs started as a good FL sensor for the Fe3+ ion detection among other metal ions.
Results and Discussion
Synthetic Conditions of CB-CDs
The CB-CDs were easily prepared by the hydrothermal treatment method for the detection of Fe3+ ions through FL quenching efficiency, as demonstrated in Figure 1. The hydrothermal treatment is the most widely used method to synthesize CDs because of its comfort and simple operation without any extra chemicals or equipment.17 In a hydrothermal system, the biomolecules in the natural carbon precursors converting into CDs may go through the process of dehydration, polymerization, and carbonization.18 After 18 h of heating time duration at 200 °C of temperature, the solution appeared in brown color, denoting the formation of CB-CDs. The CB-CDs were then irradiated under day-light and UV-light, respectively. Under day-light irradiation, the CB-CD solution appeared as a light-brown transparent liquid while under UV-light irradiation at a long wavelength (365 nm), the CB-CDs showed a bright blue color. Because of good FL properties, the CB-CDs were used for the Fe3+ ion detection.
Figure 1.
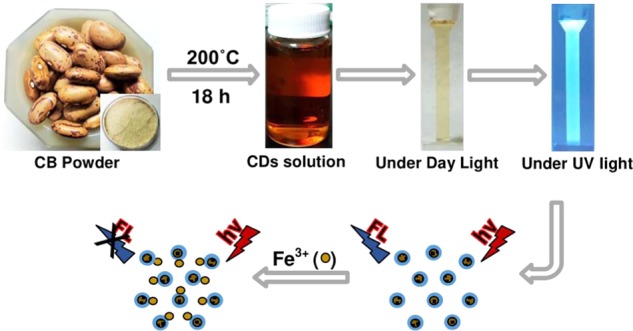
Schematic representation of CB-CDs’ formation and application.
The FL properties of CB-CDs were totally affected by the synthetic conditions. To achieve a high quality of CB-CDs, different synthetic conditions, including hydrothermal time duration, hydrothermal temperature, and CB powder weight, were evaluated by taking the FL spectrum of CB-CDs as the parameter. The hydrothermal time duration and temperature have valuable influences on the FL properties of CB-CDs.19 The CB-CDs showed strongest FL intensity with the increase of hydrothermal time duration and temperature (Figure S1A,B). The optimum FL intensity was reached with 18 h time duration, 200 °C temperature, and 1.0 g of CB powder. The prolongation of time duration and the increase in temperature can produce more carbon nuclei and cause an increase of FL intensity. A short time duration and low temperature may lead to low reaction efficiency and inadequate precursor carbonization, thus causing low FL properties.17
In addition, the CB powder weight dissolved in ultrapure water was also evaluated (Figure S1C). The FL intensity of the CB-CDs was low with a lower CB powder weight (0.25 g), and then the intensity increased when CB powder weight was increased to 1.5 g. This result may be due to a slow reaction rate of chemical constituents containing less amount of CB powder.20 The FL intensities of 1.0 and 1.5 g of CB powder were not significantly changed, and then the CB powder was fixed at 1.0 g for the synthesis. So, the optimized hydrothermal conditions were 1.0 g of CB powder in 25 mL of H2O with 200 °C temperature for 18 h of reaction time. After evaluation of optimized conditions, the reproducibility of the synthetic conditions was repeated three times (Figure S1D). The result showed that the FL intensity of CB-CDs with the same synthetic conditions gave a similar FL character with good reproducibility and precision [relative standard deviations (RSDs) = 1.16%].
Physicochemical Properties of CB-CDs
The transmission electron microscopy (TEM) and high-resolution (HR)-TEM images of CB-CDs have been captured to characterize their nanostructure morphology and size. The TEM image shows that CB-CDs marked by yellow circles display well monodisperse nanoparticles across the whole section of uniform spherical shapes and are well separated from each other without apparent aggregation (Figure 2A). In the HR-TEM image, the lattice fringes were obviously viewed and the d-spacing value was ∼0.21 nm in the presence of the (100) lattice plane of graphitic carbon, indicating the graphitic nature of the CB-CDs (inset of Figure 2A).21 The size distribution of CB-CDs was overall small, ranging from 1.23 to 6.63 nm, as shown in the histogram (Figure 2B). The average size of CB-CDs was 3.96 nm. The Raman spectrum of the CB-CDs was measured to differentiate between sp2-hybridized carbon and sp3-hybridized carbon atoms. The spectrum shows two different bands at 1350 and 1544 cm–1, which could be associated with the D and G bands, respectively (Figure 3A). The D band comes from the disordered sp3-hybridized carbon atom, and the G band comes from E2g vibration mode of the sp2-hybridized carbon atom, which indicates the graphitized nature of CB-CDs.22 Furthermore, the Fourier transform infrared (FT-IR) spectroscopy was applied to estimate the insights of surface functional groups of the CB-CDs. As shown in Figure 3B, FT-IR spectra exhibited the bands of O–H bending and stretching vibrations at 737 and 3384 cm–1, respectively.2,7 Besides, the bands of C–H stretching vibrations appeared at 2963 cm–1.23 The bands of C–H bending vibrations appeared at around 604–895, 946, and 1456 cm–1.24−26 The band of C–O stretching vibrations were observed at 1075 cm–1.27 Then, the bands of C=C and C=O stretching vibrations were found at 1597 and 1671/1766 cm–1, respectively.20,28 The band at 1297 cm–1 was attributed to O–H in-plane bending vibrations.26 In addition, the band of symmetric stretching vibrations of −COOH were observed at 1408 cm–1.7 The existence of hydroxyl, carboxyl, and carbonyl surface groups of CB-CDs give great solubility and stability in aqueous systems.
Figure 2.

(A) TEM and HR-TEM images and (B) size distribution of CB-CDs.
Figure 3.

(A) Raman spectrum and (B) FT-IR spectrum of CB-CDs.
Optical Properties of CB-CDs
The UV–vis spectra were carried out to investigate the optical properties of CB-CDs, which exhibited a wide absorption band from 220 to 380 nm and a tail extended to the visible region (Figure 4A). The little sharp absorption peak around 260–280 nm was originated from π–π* energy transition of the conjugated C=C bonds, confirming the existence of the aromatic π-system in the core of CDs.29 While, a peak at 300–380 nm was related to n−π* energy transition of C=O bonds.29 This peak yields strong FL emission because of the excited state energy trapping by the surface states.30 Absorption spectra of CB-CDs at various dilution factors are given in Figure 4B. The dilution factors significantly shifted the absorbance spectrum. At high dilution, two distinctive absorbance peaks were observed at 225 and 275 nm specifically, whereas at low dilution, the dominant absorbance peak from 260 to 280 nm and the shoulder peak from 300 to 380 nm were observed. The peak at 225 nm was originated from the σ–σ* energy transition.31 So, σ–σ*, n−π*, and π–π* energy transitions can be seen clearly with different dilution factors.
Figure 4.

(A) UV–vis spectrum of CB-CDs and (B) UV–vis spectra of CB-CD solutions (9-fold) with different dilution factors.
To further characterize optical properties, FL spectra of the CB-CDs were investigated. Figure 5A shows the intense peak in the FL excitation and emission spectra. The FL spectra exhibited the optimum excitation wavelength at 380 nm (black line) and the optimum emission wavelength at 450 nm (red line). The FL emission intensity depends on the surface nature and the most particle numbers of CB-CDs were excited at 380 nm. Figure 5B depicts the FL spectra of CB-CDs at various excitation wavelengths. The spectra clearly indicated the unique excitation-dependent emission wavelength character of CB-CDs, which is similar to that of the common FL carbon nanomaterials. The FL spectra showing the characteristic emission peaks are clearly red-shifted from 410 nm (black line) to 540 nm (blue line) with the excitation wavelength from 300 to 500 nm with 20 nm increment. The FL emission intensity first increased and then decreased. The intensity gradually increased from 410 to 450 nm with the excitation from 300 to 380 nm and then decreased from 470 to 540 nm with the excitation from 400 to 500 nm. These findings indicate that the emission peaks are dependent on the excitation wavelength. The normalized FL spectra were utilized to observe clearly the red-shift character of emission peaks with various excitation wavelengths (Figure 5C). Several possible FL origins of CDs are proposed, including surface state (degree of surface oxidation and functional groups), quantum confinement effect, the synergistic effect of the surface state, and molecular fluorescence.32
Figure 5.

(A) FL excitation and emission spectra of CB-CDs, (B) FL, and (C) normalized FL spectra of CB-CDs at various excitation wavelengths from 300 to 500 nm with a 20 nm increase.
In addition, the CB-CDs’ quantum yield was calculated by performing measurement at 380 nm of excitation wavelength and the quantum yield was approximately 10.85%. The FL spectral results strongly suggest that the CB-CDs exhibit a good quantum yield with strong FL properties. Table 1 shows the excitation wavelength and quantum yield comparisons of several CDs derived from several natural carbon precursors. The CB-CDs have high quantum yield compared with the other reported CDs.27,33−38
Table 1. Comparison of Excitation Wavelength (λex) and Quantum Yield (QY) for Several CDs with Various Carbon Precursors.
| no. | carbon precursor | λex (nm) | QY (%) | reference |
|---|---|---|---|---|
| 1 | apple juice | 350 | 6.40 | (33) |
| 2 | Nescafe instant coffee | 360 | 5.50 | (34) |
| 3 | coffee grounds | 365 | 3.80 | (35) |
| 4 | Saccharum officinarum juice | 360 | 5.67 | (36) |
| 5 | coconut water | 350 | 2.80 | (27) |
| 6 | ginkgo fruit | 380 | 3.33 | (37) |
| 7 | corn flour | 360 | 7.70 | (38) |
| 8 | cranberry beans | 380 | 10.85 | this work |
FL Stability of CB-CDs
The FL stability of CB-CD solution was assessed by comparing their FL intensities with various experimental conditions. Figure S2A shows that the FL emission intensity was almost constant and did not display any significant change even after continuous light irradiation for 1 h. It was noticed that the photobleaching and coagulation were not observed in the solution after irradiating with the light. The photobleaching-resistant property is possibly owing to the electrostatic repulsions between the negatively charged nanoparticles.39 This result shows that the CB-CDs have good photostability. Moreover, the ionic strength effect on the FL intensity of CB-CDs was measured by adding various concentrations of NaCl solution (Figure S2B). The FL intensity remains constant and almost unchanged on increasing the concentrations of the NaCl from 50 to 1000 mM. This result indicates that the aggregation of the CB-CDs can be effectively controlled by the NaCl ionic strengths and also individually separate CB-CDs under salt interference.40 The CB-CD solution reveals a long-term homogeneous phase without any obvious precipitation.41 The possible reason is that there was almost no ionization of surface functional groups of CB-CDs.42 The ionic strength effect on the FL intensity described that these CB-CDs can be applied to the extremely concentrated salt environments due to their stable FL character at higher salt concentration.
Furthermore, thermal stability was tested by heating the CB-CD solution from 30 to 100 °C. As shown in Figure S2C, even after heating for 100 °C, no significant decrease in the FL intensity was observed. Higher temperature cannot induce the permanent destruction of the surface chemical structure of CB-CDs, indicating their high thermal stability and the minimal nonradiative recombination centers or defects.43,44 The oxygen-rich groups effectively control the aggregation at a higher temperature and protect the CB-CDs from degradation induced by thermal oxidation.43 In addition, the same observation was performed when the sample was kept for 10 days at room temperature. The FL intensity remained unchanged, which suggests that CB-CDs show excellent photostability even with a long time of storage at room temperature (Figure S2D). The CB-CD solution exhibits a long-term homogeneous phase without any floater and apparent precipitation. So, the FL character is independent of light irradiation, ionic strength, heat, and storage time. These findings reveal that the CB-CDs have great potency for valuable applications and commercial purpose since the FL intensity is still high and remains fairly constant under various conditions.
The effect of CB-CD solution pH ranging from 3 to 10 on the FL emission intensity was also evaluated (Figure S2E). The pH value of the solution was fitted by adding 0.1 M HCl and NaOH. A pH of 3 caused a small decrease in the FL emission intensity. Afterward, the highest intensity was observed at pH 4 and 5. The intensity increased when the pH value was increased from 3 to 5 and then decreased dramatically on changing the pH from 6 to 10. This behavior may be related to the different degrees of deprotonation of CB-CDs at different pH values.45 The degree of deprotonation gradually increases when the pH value decreases, generating in a higher net surface charge which provides the CB-CDs with hydrophilic and dispersible properties in the water, and accordingly increasing the FL properties. Particularly, the increasing rate of intensity slows down with decreasing pH values from 5 to 3, probably because the protonation of CB-CDs tend to be saturated in a strong acid environment.9 This result indicates that the CB-CDs are very sensitive and pH-dependent to acidic and basic conditions. The CB-CDs show a good FL behavior in acidic environments while a comparatively low FL character in alkaline and neutral conditions. It is shown that the pH 4 and 5 were the best pH values for the sensing system. Due to the real pH value of CB-CDs (5.10), there is no need to adjust the pH value of the CB-CD solution for sensing metal ions that possess excellent FL properties in the weakly acidic environment.
Selectivity of CB-CDs toward Metal Ions
CB-CDs as the FL sensor for the metal ion detection according to the interaction between the surface functional groups of CB-CDs and metal ions that can form a complex have been studied. Accordingly, FL emission intensity of CB-CDs in the existence of various metal ions, such as Zn2+, Ca2+, Na+, K+, Cd2+, Ni2+, Co2+, Pb2+, Hg2+, Sn2+, Fe2+, Cu2+, and Fe3+, was carried out to evaluate their sensing capability for the selectivity of metal ions. The changes in the FL emission intensity (F/F0) at 450 nm occurred with the representative metal ions under the same conditions at a concentration of 500 μM after incubation for 2 min (Figure 6A). F and F0 are the FL intensity of CB-CDs with and without metal ions. These metal ions possessed different influences on the FL behavior of CB-CDs. The histogram was plotted by using F/F0 versus the similar concentration of metal ions (Figure 6B). The sensing potency was evaluated by monitoring the initial FL intensity of CB-CDs for significant changes once added with various metal ions. Notably, only Fe3+ ions caused a significant and strong FL intensity quenching compared with the other metal ions. The FL intensity was quenched up to 51% in the existence of 500 μM Fe3+ ions, while other metal ions exhibited either slight or no alteration in FL intensity with negligible effects. A slight quenching of about 15% observed in the case of Cu2+ ions that could be assigned to possible CD/Cu2+ complex formation, however, was not significant. This result clearly indicates that CB-CDs could be employed as a very specific, efficient, and selective FL sensor toward Fe3+ ions due to the stronger affinity.
Figure 6.

(A) FL emission spectra of CB-CD solutions in the addition of various metal ions, (B) relative FL intensities (F/F0) of CB-CD solutions without and with various metal ions (excitation wavelength = 380 nm; concentration = 500 μM), (C) FL emission spectra of CB-CD solutions in the addition of Fe3+ ions (500 μM) with real pH after addition (4.11) and adjusted pH at 5.10, and (D) CB-CD solutions with different metal ions with the concentration of 500 μM under UV light irradiation.
Furthermore, the pH values of CB-CD solution after adding various metal ions were measured. The pH of the solutions were slightly changed to various pH values (Zn2+ = 5.06, Ca2+ = 5.06, Na+ = 5.11, K+ = 5.12, Cd2+ = 4.78, Ni2+ = 5.05, Co2+ = 5.05, Pb2+ = 4.75, Hg2+ = 4.97, Sn2+ = 4.27, Fe2+ = 4.95, Cu2+ = 4.91, and Fe3+ = 4.11). The pH changes of the solutions were still around 5.10 of the real pH of CB-CDs. Although CB-CDs on being added with some metal ions, such as Cd2+, Pb2+, Sn2+, and Fe3+, have lower pH values than other metal ions, the FL intensities of CB-CDs/metal ions with their real pH and adjusted pH to 5.10 did not change. As an example, the FL intensities of CB-CDs/Fe3+ ions with the pH 4.11 (red line) and pH 5.10 (black line) were maintained stable without any changes (Figure 6C). So, these pH values had no effect on the FL intensity quenching due to the pH values of all solutions were still being in the best pH range (4–5) of the CB-CD solution (Figure S2E). In addition, a photograph of the CB-CD solutions with the addition of various metal ions (500 μM) under UV light irradiation is presented in Figure 6D. The result shows that the CB-CD solutions with the addition of all metal ions exhibited a FL bright blue color under UV light irradiation except for Fe3+ ions. The CB-CD/Fe3+ complex solution dimmed the bright blue color. This result clearly indicates that this sensing system is very selective to Fe3+ ions.
Sensitivity of CB-CDs toward Fe3+ Ions
The reaction time effect on the interaction between CB-CDs and Fe3+ ions was first investigated to monitor FL quenching efficiency (Figure 7A). It can be seen that the completion of the reaction between CB-CDs and Fe3+ ions was fast and completed within 1 min of mixing time and 2 min of incubation time. To assess the sensitivity for quantitative detection of Fe3+ ions, CB-CD solution added with various concentrations of Fe3+ ions (30–600 μM) was investigated by recording the FL emission spectra. The CB-CDs without adding Fe3+ ions displayed strong FL emission intensity at 450 nm upon excitation at 380 nm. The intensity was quenched progressively above 50% of its initial value with the increasing concentration of Fe3+ ions (Figure 7B), expressing that this FL sensor is very sensitive toward various concentrations of Fe3+ ions, which can easily and effectively interact with CB-CDs. The plot of F/F0 and the concentrations of Fe3+ ions ranging from 30 to 600 μM exhibited good linearity with the correlation coefficient of R2 = 0.99663 (Figure 7C). It can be seen that the increase in Fe3+ concentration is in accordance with the decrease in FL emission intensity of CB-CDs. The detection limit of Fe3+ ions was 9.55 μM (S/N = 3) and confirmed that CB-CDs are sensitive enough to detect Fe3+ ions. The Fe3+ ion sensing properties of the other CDs as the FL sensors are summarized in Table 2. The results denote that the developed method exhibits good selective and sensitive detection of Fe3+ ions compared with the other reported methods.28,45−50 The developed method had benefits in terms of a low detection limit and broad linear range.
Figure 7.

(A) Reaction time on FL quenching efficiency of the CB-CDs/Fe3+ system, (B) FL emission intensity quenching of CB-CDs on addition of various concentrations of Fe3+ ions at 380/450 nm of excitation/emission wavelengths, (C) the linear relationship between FL quenching of CB-CDs and Fe3+ ion concentration in the range of 30–600 μM, and (D) FL excitation intensity enhancement of CB-CDs at 760 nm on addition of various concentrations of Fe3+ ions.
Table 2. Comparison of Several CDs with Different Carbon Precursors for the Detection of Fe3+ Ions.
| no. | carbon precursor | LOD (μM) | linear range (μM) | reference |
|---|---|---|---|---|
| 1 | alginic acid and EDA | 10.98 | 0–50 | (45) |
| 2 | blueberry | 9.97 | 12.5–100 | (46) |
| 3 | hamburger sandwich leftover | 32 | 12.5–100 | (47) |
| 4 | citric acid and [APMIm][Br] | 13.68 | 0–300 | (48) |
| 5 | Chionanthus retusus fruit | 70 | 0–2 | (28) |
| 6 | citric acid and (NH4)2HPO4 | 20 | 20–200 | (49) |
| 7 | α-lipoic acid | 4 | 25–500 | (50) |
| 8 | cranberry beans | 9.55 | 30–600 | this work |
Figure 7D shows the FL excitation features of the CB-CDs/Fe3+ system. The FL emission spectra can be obtained by both downconversion and upconversion associated to the excitation of high-energy photons and multiphotons of lower energy, respectively.51 Interestingly, the FL excitation intensity of CB-CDs at 760 nm increased gradually on increasing the concentration of Fe3+ ions. This excitation wavelength exhibits relatively weaker or no emission at the shorter wavelengths due to the absorption of two or more photons supporting the electron transition from ground state to excited state.52 Considering much higher FL emission intensity, the FL emission feature from the excitation of 380 nm is a more preferential FL sensing platform for Fe3+ ions. Even so, the FL excitation peak at the longer wavelength showed another characteristic behavior and evidence of the complex interaction of CB-CDs and Fe3+ ions. Furthermore, FL excitation features of the CB-CDs/Fe3+ complex were measured by using prescan mode to specify the energy-transfer mechanism between CB-CDs and Fe3+ ions. For the FL excitation of CB-CDs, there are two appreciable characteristic excitation peaks located at 380 and 650 nm. Figure 8A shows that the FL excitation peak at 650 nm was increased dramatically after adding Fe3+ ions. The normalized peak shows clearly the increased peak intensity at 650 nm, while the peak at 380 nm was decreased with increasing Fe3+ ions (inset of Figure 8A). The FL excitation spectral shapes of CB-CDs with lower concentrations of Fe3+ ions are in relation to the characteristics of CB-CDs, while higher concentrations of Fe3+ ions show an attractive change in the excitation band’s shape. The FL excitation spectra showed the bands with higher intensity at 650 nm, which is attributed to the absorption transition of 3d5 electrons of Fe3+ ions from the ground state to the excited state.
Figure 8.

(A) FL excitation spectra and (B) UV–vis spectra of CB-CDs in the presence of Fe3+ ions in the concentration range of 30–600 μM.
The UV–vis absorption spectra of CB-CDs after addition with various concentrations of Fe3+ ions were also investigated (Figure 8B). The absorbance at the shoulder peak (300–500 nm) was gradually hyperchromic shifted with the increase of Fe3+ concentration, which can be described by the smaller enlargement of CB-CDs at higher Fe3+ concentration due to the additive absorbance nature of Fe3+ ions at ∼370 nm.53 The growth of the apparent absorbance was significantly higher and started to reach longer wavelengths in the range of 300–500 nm shoulder peak. Inset of Figure 8B shows clearly the distinction of UV–vis absorption spectra between CB-CD solution and the solution after addition of 500 μM Fe3+ ions.
Determination of Fe3+ Ions in Real Water Samples
To investigate the significance and application in real water samples, this FL sensor was applied to determine the Fe3+ ions in underground and tap water samples. Observing in the FL emission spectra, no Fe3+ ions were found in the water samples. Accordingly, the technique of standard addition was performed. Various concentrations of Fe3+ ions were added to the underground and tap water samples, and the proposed FL responses were recorded. The measurement was repeated three times, and the average analysis was presented with the relative standard deviations (RSDs). Clearly, the FL emission intensity of the CB-CDs quenched when various concentrations of Fe3+ standard solution were spiked to all real water samples, as illustrated in Table 3. The recovery ranges were between 93.24 and 100.32% for underground water and between 92.42 and 99.27% for tap water. The low RSDs ranged from 0.53 to 1.26% for underground water and from 0.15 to 1.78% for tap water, verifying that this method has good accuracy and precision. These results indicate that CB-CDs can detect Fe3+ ions in the real samples.
Table 3. Sensing Results of Fe3+ Ions in Underground and Tap Water Samples (n = 3).
| water samples | added (μM) | measured (μM) | recovery (%) | RSD (%) |
|---|---|---|---|---|
| underground water | 30 | 29.91 ± 0.13 | 99.70 | 0.63 |
| 50 | 50.16 ± 0.36 | 100.32 | 0.99 | |
| 100 | 96.62 ± 0.38 | 96.62 | 0.53 | |
| 150 | 142.61 ± 1.08 | 95.07 | 1.11 | |
| 200 | 186.47 ± 1.65 | 93.24 | 1.26 | |
| tap water | 30 | 29.78 ± 0.03 | 99.27 | 0.15 |
| 50 | 49.29 ± 0.12 | 98.58 | 0.30 | |
| 100 | 95.74 ± 0.22 | 95.74 | 0.34 | |
| 150 | 139.79 ± 1.11 | 93.19 | 1.19 | |
| 200 | 184.84 ± 2.50 | 92.42 | 1.78 |
Possible FL Quenching Mechanisms
The relatively high selectivity of the CB-CDs toward Fe3+ ions over other metal ions was attributed to the half-filled 3d orbital of Fe3+ and the unique interaction of Fe3+ ions. Fe3+ ions display the strongest FL quenching effect on CB-CDs, attributing to greater affinity and effective/quick coordination/chelation kinetics between the Fe3+ ions and the abundant hydroxyl (−OH) and/or carboxyl (−COOH) groups on the surface of CB-CDs, which facilitates the complex formation.53,54 The possible mechanisms for FL quenching of CB-CDs by Fe3+ ions was provided as illustrated in Figure 9A. The abundant electrons of CB-CDs in the excited state transfer to the half-filled 3d orbital of Fe3+ ions and lead to nonradiative electron–hole recombination due to this coordination interaction, which results in the FL quenching.7 The existence of abundant hydroxyl and carboxyl groups was ensured by the FT-IR spectrum. The FT-IR spectral characteristics of CB-CDs were completely changed with the addition of Fe3+ ions, suggesting the formation of CB-CDs/Fe3+ complex chelate (Figure S3). An extensive decrease in the intensity for the peaks at 1408 and 1297 cm–1 in the FT-IR spectrum confirms the possible binding of Fe3+ to the −COOH and −OH groups of the CB-CDs. Compared with the FT-IR spectrum of CB-CDs, CB-CDs/Fe3+ complex weakened the absorbance of C–H, C=O, C=C, and C–O bonds, indicating that the chemical bonds on the surface of CB-CDs change because of the high affinity between Fe3+ ions and oxygen-containing functional groups from the CB-CDs. As mentioned above, the FL intensity quenching may be due to the formation of ferric-hydroxyl or ferric-carboxyl complexes at the surface of CB-CDs.
Figure 9.

(A) Illustration of the possible FL intensity quenching mechanism of the CB-CDs in the addition of Fe3+ ions and (B) the formed brown color aggregation of the CB-CDs/Fe3+ system.
Furthermore, the monodisperse CB-CDs became the aggregated CB-CDs by the addition of Fe3+ ions (Figure 9B). The quenching in FL intensity may also be attributed to the aggregation of the CB-CDs.55 The aggregation of CB-CD solution after adding Fe3+ ions clearly appeared in the brown precipitation form in the bottom of the tube (red circle) after 2 h of incubation. The complex formation via coordination between the surface of CB-CDs and Fe3+ ions joins adjacent CB-CDs together to form the aggregation of CB-CD solution.56 The sizes of CB-CDs increased dramatically in the existence of Fe3+ ions, which leads to the aggregation of the CB-CD solution.10
Conclusions
In this study, a cheap, simple, and green method for the synthesis of CDs by the hydrothermal treatment derived from the CB as a new natural carbon precursor with ultrapure water without using any toxic chemicals, any surface passivation agents, and complex equipment was successfully developed. The optimized synthetic conditions were 200 °C temperature, 18 h time duration, and 1.0 g of CB powder weight. Under optimized conditions, the CB-CDs are of a spherical shape with 3.96 nm of the average size. The −OH and −COOH surface functional groups improve water solubility and FL properties of CB-CDs. The CB-CDs exhibited a strong FL bright blue color under UV light irradiation and FL emission, which is dependent on the excitation wavelength. The CB-CDs are dependent on pH values and possessed good stability to several effects, including light irradiation, ionic strength, heat, and storage time. The FL intensity of CB-CDs was prominently quenched in the existence of Fe3+ ions. The CB-CDs can be utilized as the FL sensor for the selective and sensitive detection of Fe3+ ions. The FL quenching efficiency of CB-CDs after adding Fe3+ ions ranging from 30 to 600 μM showed good linearity with the detection limit of 9.55 μM. The CB-CDs possess specific binding, high selectivity, and good sensitivity toward Fe3+ ions, thus leading to aggregations that quench their FL intensity. Therefore, CB-CDs can be utilized as an environmentally friendly nanomaterial in the future sensing application for saving environments and other important applications, such as biosensing, bioimaging, drug delivery, and catalysis.
Experimental Section
Materials and Chemicals
CB as a carbon precursor was purchased from a traditional market in Kaohsiung City, Taiwan. ZnCl2, NiCl2·6H2O, SnCl2·2H2O, KCl, NaCl, CuCl2·2H2O, CaCl2·2H2O, and NaOH were purchased from Showa Chemical Co. Ltd. FeCl2·4H2O, HgCl2, CoCl2·6H2O, CdCl2·xH2O, and quinine were purchased from Alfa Aesar. FeCl3 was obtained from Shimakyu’s Pure Chemicals. PbCl2 was bought from Sigma-Aldrich. Hydrochloric acid and sulfuric acid were obtained from J.T. Baker and Honeywell Research Chemicals, respectively. Ultrapure water from Simplicity Millipore water purification system (∼18.2 Ω, 25 °C) was used as a solvent in this study.
Synthesis of CB-CDs
The CB-CDs were prepared by hydrothermal treatment. In a typical procedure, CB seeds were first washed with ultrapure water and desiccated in the precision oven for 5 h at 100 °C. Then, the dried CB seeds were crushed into powder. One gram of CB powder was placed into a Teflon-lined autoclave hydrothermal system containing 25 mL H2O and heated for 18 h at 200 °C. After the treatment process, the solution was allowed to cool naturally to room temperature. The solution was then separated from large residue particles with a Whatman filter paper. The centrifugation at 9000 rpm for 30 min followed by 0.22 μM membrane filter was used to eliminate the remaining solid residues from the solution. Finally, the CB-CD solution was kept at 4 °C for further use. To optimize the synthetic conditions, different temperatures (120, 140, 160, 180, and 200 °C), heating time durations (6, 12, 18, and 24 h), and CB powder weights (0.25, 0.5, 1.0, and 1.5 g) were evaluated.
Instrumentation
The channel precision oven was used for hydrothermal heating treatment. The FL absorption color of CB-CDs was checked by using UV light irradiation with a long excitation wavelength at 365 nm (Analytik Jena UVP UVGL-25). The FL spectra were recorded by using FL spectroscopy (Varian Cary Eclipse Fluorescence Spectrophotometer). FT-IR spectrum was obtained by using FT-IR spectroscopy (ALPHA FT-IR Spectrometer from Bruker). The absorption spectra were recorded by UV–vis spectroscopy (Spectra Academy UV–Vis Spectrometer Detector SV-2100). The TEM images were scanned by a Hitachi HT-7700 microscope and JEM-3010 HR-TEM (JEOL, Japan). The Raman spectrum was recorded on a Micro Raman Identify Spectrometer (ProTrusTech Co. Ltd.).
Quantum Yield Calculation
The CB-CDs’ quantum yield was examined based on an established procedure. Briefly, CB-CDs were diluted with ultrapure water (η = 1.33), and quinine solution as a standard was diluted in 0.1 M H2SO4 (QY = 54%, η = 1.33). The absorbance and FL spectra were recorded at 380 nm. The absorbance value of CB-CDs and quinine solution was maintained in a 1 cm quartz cuvette at 0.05. The integrated FL intensity obtained for the sample as a function of absorbance was compared to that of quinine using the equation: QYx = QYy(Ay/Ax)(Ix/Iy)(ηx2/ηy2) where “QY” is the quantum yield, “A” is the absorbance at 380 nm, “I” is the integrated FL intensity, “η” is the solvent refraction index, “x” refers to CB-CDs, and “y” refers to quinine.
Fluorescence Sensing of Fe3+ Ions
To examine the selectivity for the metal ions, 100 μL of CB-CD solution was diluted into 900 μL of ultrapure water (9-folds). Several metal ions (Ca2+, Zn2+, Na+, K+, Ni+, Co2+, Cd2+, Pb2+, Hg2+, Sn2+, Fe2+, Cu2+, and Fe3+) were added separately into the CB-CD solution to the concentration of 500 μM. The mixtures were mixed with the vortex mixer for 1 min and incubated for 2 min under room temperature. The FL emission spectra with excitation wavelength at 380 nm were recorded to check the specific metal ions that can quench the FL intensity. To examine the sensitivity of Fe3+ ions, various concentrations of Fe3+ ions (30–600 μM) were added into the CB-CD solution. FL spectra with excitation at 380 nm were recorded and their FL quenching efficiency compared.
Sensing of Fe3+ Ions in Real Water Samples
The application of this sensing method for Fe3+ ion detection was also examined to verify the utilization of CB-CDs as the FL sensor for real water samples, such as underground and tap water samples. These water samples were used without further filtrations. These water samples (500 μL) were spiked with the Fe3+ standard solution and mixed with CB-CD solution to a final Fe3+ concentration of 30–200 μM. The samples were then measured, and the resultant FL spectra were recorded. The recoveries were counted by an equation: R = [(Cz – Cy)/Cx] × 100%, where “R” is the recovery percentage, “Cx” is Fe3+ concentration added into the water samples, “Cy” is Fe3+ concentration in the water samples before the addition of the standard Fe3+ ions, and “Cz” is Fe3+ concentration in water samples after the addition of the standard Fe3+ ions.7
Acknowledgments
The authors acknowledge the funding support from the Taiwan Ministry of Science and Technology under grant MOST107-2113-M-037-013. This work is also funded by the NSYSU-KMU Joint Research Project (#NSYSUKMU 108-I002-3).
Supporting Information Available
The Supporting Information is available free of charge on the ACS Publications website at DOI: 10.1021/acsomega.9b01333.
Comparisons of fluorescent intensities of CB-CDs prepared at various conditions and the stability of CB-CDs in different chemical environments (PDF)
The authors declare no competing financial interest.
Supplementary Material
References
- Xu X.; Ray R.; Gu Y.; Ploehn H. J.; Gearheart L.; Raker K.; Scrivens W. A. Electrophoretic Analysis and Purification of Fluorescent Single-Walled Carbon Nanotube Fragments. J. Am. Chem. Soc. 2004, 126, 12736–12737. 10.1021/ja040082h. [DOI] [PubMed] [Google Scholar]
- Shen J.; Shang S.; Chen X.; Wang D.; Cai Y. Facile Synthesis of Fluorescence Carbon Dots from Sweet Potato for Fe3+ sensing and Cell Imaging. Mater. Sci. Eng., C 2017, 76, 856–864. 10.1016/j.msec.2017.03.178. [DOI] [PubMed] [Google Scholar]
- Wang Y.; Hu A. Carbon Quantum Dots: Synthesis, Properties and Applications. J. Mater. Chem. C 2014, 2, 6921–6939. 10.1039/C4TC00988F. [DOI] [Google Scholar]
- Zheng X. T.; Ananthanarayanan A.; Luo K. Q.; Chen P. Glowing Graphene Quantum Dots and Carbon Dots: Properties, Syntheses, and Biological Applications. Small 2015, 11, 1620–1636. 10.1002/smll.201402648. [DOI] [PubMed] [Google Scholar]
- Wang R.; Lu K.-Q.; Tang Z.-R.; Xu Y.-J. Recent Progress in Carbon Quantum Dots: Synthesis, Properties and Applications in Photocatalysis. J. Mater. Chem. A 2017, 5, 3717–3734. 10.1039/C6TA08660H. [DOI] [Google Scholar]
- Bandi R.; Gangapuram B. R.; Dadigala R.; Eslavath R.; Singh S. S.; Guttena V. Facile and Green Synthesis of Fluorescent Carbon Dots from Onion Waste and Their Potential Applications as Sensor and Multicolour Imaging Agents. RSC Adv. 2016, 6, 28633–28639. 10.1039/C6RA01669C. [DOI] [Google Scholar]
- Liu W.; Diao H.; Chang H.; Wang H.; Li T.; Wei W. Green Synthesis of Carbon Dots from Rose-Heart Radish and Application for Fe3+ Detection and Cell Imaging. Sens. Actuators, B 2017, 241, 190–198. 10.1016/j.snb.2016.10.068. [DOI] [Google Scholar]
- Chatzimitakos T.; Kasouni A.; Sygellou L.; Avgeropoulos A.; Troganis A.; Stalikas C. Two of a Kind but Different: Luminescent Carbon Quantum Dots from Citrus Peels for Iron and Tartrazine Sensing and Cell Imaging. Talanta 2017, 175, 305–312. 10.1016/j.talanta.2017.07.053. [DOI] [PubMed] [Google Scholar]
- Xu L.; Fan H.; Huang L.; Xia J.; Huang J.; Li M.; Ding H.; Huang K.; Li S. Eosinophilic Nitrogen-Doped Carbon Dots Derived from Tribute Chrysanthemum for Label-Free Detection of Fe3+ Ions and Hydrazine. J. Taiwan Inst. Chem. Eng. 2017, 78, 247–253. 10.1016/j.jtice.2017.06.011. [DOI] [Google Scholar]
- Yang R.; Guo X.; Jia L.; Zhang Y.; Zhao Z.; Lonshakov F. Green Preparation of Carbon Dots with Mangosteen Pulp for the Selective Detection of Fe3+ ions and Cell Imaging. Appl. Surf. Sci. 2017, 423, 426–432. 10.1016/j.apsusc.2017.05.252. [DOI] [Google Scholar]
- Tchounwou P. B.; Yedjou C. G.; Patlolla A. K.; Sutton D. J. Heavy Metals Toxicity and the Environment. EXS 2012, 101, 133–164. 10.1007/978-3-7643-8340-4_6. [DOI] [PMC free article] [PubMed] [Google Scholar]
- Liu Y.; Liu C. Y.; Zhang Z. Y. Synthesis of Highly Luminescent Graphitized Carbon Dots and the Application in the Hg2+ Detection. Appl. Surf. Sci. 2012, 263, 481–485. 10.1016/j.apsusc.2012.09.088. [DOI] [Google Scholar]
- Que E. L.; Domaille D. W.; Chang C. J. Metals in Neurobiology: Probing Their Chemistry and Biology with Molecular Imaging. Chem. Rev. 2008, 108, 1517–1549. 10.1021/cr078203u. [DOI] [PubMed] [Google Scholar]
- Aremu M. O.; Olaofe O.; Basu S. K.; Abdulazeez G.; Acharya S. N. Processed Cranberry Bean (Phaseolus coccineus L.) Seed Flour for the African Diet. Can. J. Plant Sci. 2010, 90, 719–728. 10.4141/CJPS09149. [DOI] [Google Scholar]
- Ganesan K.; Xu B. Polyphenol-Rich Dry Common Beans (Phaseolus vulgaris L.) and Their Health Benefits. Int. J. Mol. Sci. 2017, 18, 2331 10.3390/ijms18112331. [DOI] [PMC free article] [PubMed] [Google Scholar]
- https://en.wikipedia.org/wiki/beans.
- Ogi T.; Aishima K.; Permatasari F. A.; Iskandar F.; Tanabe E.; Okuyama K. Kinetics of Nitrogen-Doped Carbon Dot Formation: Via Hydrothermal Synthesis. New J. Chem. 2016, 40, 5555–5561. 10.1039/C6NJ00009F. [DOI] [Google Scholar]
- Roy P.; Chen P. C.; Periasamy A. P.; Chen Y. N.; Chang H. T. Photoluminescent Carbon Nanodots: Synthesis, Physicochemical Properties and Analytical Applications. Mater. Today 2015, 18, 447–458. 10.1016/j.mattod.2015.04.005. [DOI] [Google Scholar]
- Wu Q.; Li W.; Wu P.; Li J.; Liu S.; Jin C.; Zhan X. Effect of Reaction Temperature on Properties of Carbon Nanodots and Their Visible-Light Photocatalytic Degradation of Tetracyline. RSC Adv. 2015, 5, 75711–75721. 10.1039/C5RA16080D. [DOI] [Google Scholar]
- Li L. S.; Jiao X. Y.; Zhang Y.; Cheng C.; Huang K.; Xu L. Green Synthesis of Fluorescent Carbon Dots from Hongcaitai for Selective Detection of Hypochlorite and Mercuric Ions and Cell Imaging. Sens. Actuators, B 2018, 263, 426–435. 10.1016/j.snb.2018.02.141. [DOI] [Google Scholar]
- Liu Y.; Liu C. Y.; Zhang Z. Y. Graphitized Carbon Dots Emitting Strong Green Photoluminescence. J. Mater. Chem. C 2013, 1, 4902–4907. 10.1039/c3tc30670d. [DOI] [Google Scholar]
- Zhao X. J.; Zhang W. L.; Zhou Z. Q. Sodium Hydroxide-Mediated Hydrogel of Citrus Pectin for Preparation of Fluorescent Carbon Dots for Bioimaging. Colloids Surf., B 2014, 123, 493–497. 10.1016/j.colsurfb.2014.09.048. [DOI] [PubMed] [Google Scholar]
- Zhang J.; Zhao X.; Xian M.; Dong C.; Shuang S. Folic Acid-Conjugated Green Luminescent Carbon Dots as a Nanoprobe for Identifying Folate Receptor-Positive Cancer Cells. Talanta 2018, 183, 39–47. 10.1016/j.talanta.2018.02.009. [DOI] [PubMed] [Google Scholar]
- Joseph J.; Anappara A. A. Ellagic Acid-Functionalized Fluorescent Carbon Dots for Ultrasensitive and Selective Detection of Mercuric Ions via Quenching. J. Lumin. 2017, 192, 761–766. 10.1016/j.jlumin.2017.08.008. [DOI] [Google Scholar]
- Gupta A.; Verma N. C.; Khan S.; Tiwari S.; Chaudhary A.; Nandi C. K. Paper Strip Based and Live Cell Ultrasensitive Lead Sensor Using Carbon Dots Synthesized from Biological Media. Sens. Actuators, B 2016, 232, 107–114. 10.1016/j.snb.2016.03.110. [DOI] [Google Scholar]
- Ma X.; Dong Y.; Sun H.; Chen N. Highly Fluorescent Carbon Dots from Peanut Shells as Potential Probes for Copper Ion: The Optimization and Analysis of the Synthetic Process. Mater. Today Chem. 2017, 5, 1–10. 10.1016/j.mtchem.2017.04.004. [DOI] [Google Scholar]
- Purbia R.; Paria S. A Simple Turn on Fluorescent Sensor for the Selective Detection of Thiamine Using Coconut Water Derived Luminescent Carbon Dots. Biosens. Bioelectron. 2016, 79, 467–475. 10.1016/j.bios.2015.12.087. [DOI] [PubMed] [Google Scholar]
- Atchudan R.; Edison T. N. J. I.; Chakradhar D.; Perumal S.; Shim J. J.; Lee Y. R. Facile Green Synthesis of Nitrogen-Doped Carbon Dots Using Chionanthus Retusus Fruit Extract and Investigation of Their Suitability for Metal Ion Sensing and Biological Applications. Sens. Actuators, B 2017, 246, 497–509. 10.1016/j.snb.2017.02.119. [DOI] [Google Scholar]
- Ansi V. A.; Renuka N. K. Table Sugar Derived Carbon Dot - a Naked Eye Sensor for Toxic Pb2+ Ions. Sens. Actuators, B 2018, 264, 67–75. 10.1016/j.snb.2018.02.167. [DOI] [Google Scholar]
- Zhu S.; Song Y.; Zhao X.; Shao J.; Zhang J.; Yang B. The Photoluminescence Mechanism in Carbon Dots (Graphene Quantum Dots, Carbon Nanodots, and Polymer Dots): Current State and Future Perspective. Nano Res. 2015, 8, 355–381. 10.1007/s12274-014-0644-3. [DOI] [Google Scholar]
- Isnaeni; Herbani Y.; Suliyanti M. M. Concentration Effect on Optical Properties of Carbon Dots at Room Temperature. J. Lumin. 2018, 198, 215–219. 10.1016/j.jlumin.2018.02.012. [DOI] [Google Scholar]
- Liu M. L.; Chen B. B.; Li C. M.; Huang C. Z. Carbon Dots: Synthesis, Formation Mechanism, Fluorescence Origin and Sensing Applications. Green Chem. 2019, 21, 449–471. 10.1039/C8GC02736F. [DOI] [Google Scholar]
- Xu Y.; Tang C. J.; Huang H.; Sun C. Q.; Zhang Y. K.; Ye Q. F.; Wang A. J. Green Synthesis of Fluorescent Carbon Quantum Dots for Detection of Hg2+. Chin. J. Anal. Chem. 2014, 42, 1252–1258. 10.1016/S1872-2040(14)60765-9. [DOI] [Google Scholar]
- Jiang C.; Wu H.; Song X.; Ma X.; Wang J.; Tan M. Presence of Photoluminescent Carbon Dots in Nescafe original Instant Coffee: Applications to Bioimaging. Talanta 2014, 127, 68–74. 10.1016/j.talanta.2014.01.046. [DOI] [PubMed] [Google Scholar]
- Hsu P.-C.; Shih Z.-Y.; Lee C.-H.; Chang H.-T. Synthesis and Analytical Applications of Photoluminescent Carbon Nanodots. Green Chem. 2012, 14, 917. 10.1039/c2gc16451e. [DOI] [Google Scholar]
- Mehta V. N.; Jha S.; Kailasa S. K. One-Pot Green Synthesis of Carbon Dots by Using Saccharum Officinarum Juice for Fluorescent Imaging of Bacteria (Escherichia coli) and Yeast (Saccharomyces cerevisiae) Cells. Mater. Sci. Eng., C 2014, 38, 20–27. 10.1016/j.msec.2014.01.038. [DOI] [PubMed] [Google Scholar]
- Li L.; Li L.; Chen C. P.; Cui F. Green Synthesis of Nitrogen-Doped Carbon Dots from Ginkgo Fruits and the Application in Cell Imaging. Inorg. Chem. Commun. 2017, 86, 227–231. 10.1016/j.inoche.2017.10.006. [DOI] [Google Scholar]
- Wei J.; Zhang X.; Sheng Y.; Shen J.; Huang P.; Guo S.; Pan J.; Feng B. Dual Functional Carbon Dots Derived from Cornflour via a Simple One-Pot Hydrothermal Route. Mater. Lett. 2014, 123, 107–111. 10.1016/j.matlet.2014.02.090. [DOI] [Google Scholar]
- Huang H.; Lv J. J.; Zhou D. L.; Bao N.; Xu Y.; Wang A. J.; Feng J. J. One-Pot Green Synthesis of Nitrogen-Doped Carbon Nanoparticles as Fluorescent Probes for Mercury Ions. RSC Adv. 2013, 3, 21691–21696. 10.1039/c3ra43452d. [DOI] [Google Scholar]
- Das P.; Ganguly S.; Bose M.; Mondal S.; Das A. K.; Banerjee S.; Das N. C. A Simplistic Approach to Green Future with Eco-Friendly Luminescent Carbon Dots and Their Application to Fluorescent Nano-Sensor “turn-off” Probe for Selective Sensing of Copper Ions. Mater. Sci. Eng., C 2017, 75, 1456–1464. 10.1016/j.msec.2017.03.045. [DOI] [PubMed] [Google Scholar]
- Xue M.; Zhan Z.; Zou M.; Zhang L.; Zhao S. Green Synthesis of Stable and Biocompatible Fluorescent Carbon Dots from Peanut Shells for Multicolor Living Cell Imaging. New J. Chem. 2016, 40, 1698–1703. 10.1039/C5NJ02181B. [DOI] [Google Scholar]
- Zhang H.; Chen Y.; Liang M.; Xu L.; Qi S.; Chen H.; Chen X. Solid-Phase Synthesis of Highly Fluorescent Nitrogen-Doped Carbon Dots for Sensitive and Selective Probing Ferric Ions in Living Cells. Anal. Chem. 2014, 86, 9846–9852. 10.1021/ac502446m. [DOI] [PubMed] [Google Scholar]
- Khan W. U.; Wang D.; Wang Y. Highly Green Emissive Nitrogen-Doped Carbon Dots with Excellent Thermal Stability for Bioimaging and Solid-State LED. Inorg. Chem. 2018, 57, 15229–15239. 10.1021/acs.inorgchem.8b02524. [DOI] [PubMed] [Google Scholar]
- Yuan F.; Yuan T.; Sui L.; Wang Z.; Xi Z.; Li Y.; Li X.; Fan L.; Tan Z.; Chen A.; et al. Engineering Triangular Carbon Quantum Dots with Unprecedented Narrow Bandwidth Emission for Multicolored LEDs. Nat. Commun. 2018, 9, 2249 10.1038/s41467-018-04635-5. [DOI] [PMC free article] [PubMed] [Google Scholar]
- Liu Y.; Liu Y.; Park S. J.; Zhang Y.; Kim T.; Chae S.; Park M.; Kim H. Y. One-Step Synthesis of Robust Nitrogen-Doped Carbon Dots: Acid-Evoked Fluorescence Enhancement and Their Application in Fe3+ Detection. J. Mater. Chem. A 2015, 3, 17747–17754. 10.1039/C5TA05189D. [DOI] [Google Scholar]
- Aslandaş A. M.; Balci N.; Arik M.; Şakirotlu H.; Onganer Y.; Meral K. Liquid Nitrogen-Assisted Synthesis of Fluorescent Carbon Dots from Blueberry and Their Performance in Fe3+ detection. Appl. Surf. Sci. 2015, 356, 747–752. 10.1016/j.apsusc.2015.08.147. [DOI] [Google Scholar]
- Ahn J.; Song Y.; Kwon J. E.; Woo J.; Kim H. Characterization of Food Waste-Driven Carbon Dot Focusing on Chemical Structural, Electron Relaxation Behavior and Fe3+ Selective Sensing. Data Brief 2019, 104038 10.1016/j.dib.2019.104038. [DOI] [PMC free article] [PubMed] [Google Scholar]
- Xie Z.; Sun X.; Jiao J.; Xin X. Ionic Liquid-Functionalized Carbon Quantum Dots as Fluorescent Probes for Sensitive and Selective Detection of Iron Ion and Ascorbic Acid. Colloids Surf., A 2017, 529, 38–44. 10.1016/j.colsurfa.2017.05.069. [DOI] [Google Scholar]
- Chandra S.; Laha D.; Pramanik A.; Ray Chowdhuri A.; Karmakar P.; Sahu S. K. Synthesis of Highly Fluorescent Nitrogen and Phosphorus Doped Carbon Dots for the Detection of Fe3+ Ions in Cancer Cells. Luminescence 2016, 31, 81–87. 10.1002/bio.2927. [DOI] [PubMed] [Google Scholar]
- Ding H.; Wei J. S.; Xiong H. M. Nitrogen and Sulfur Co-Doped Carbon Dots with Strong Blue Luminescence. Nanoscale 2014, 6, 13817–13823. 10.1039/C4NR04267K. [DOI] [PubMed] [Google Scholar]
- Zhang Y.; Gao Z.; Zhang W.; Wang W.; Chang J.; Kai J. Fluorescent Carbon Dots as Nanoprobe for Determination of Lidocaine Hydrochloride. Sens. Actuators, B 2018, 262, 928–937. 10.1016/j.snb.2018.02.079. [DOI] [Google Scholar]
- Sun Y. P.; Zhou B.; Lin Y.; Wang W.; Fernando K. A. S.; Pathak P.; Meziani M. J.; Harruff B. A.; Wang X.; Wang H.; et al. Quantum-Sized Carbon Dots for Bright and Colorful Photoluminescence. J. Am. Chem. Soc. 2006, 128, 7756–7757. 10.1021/ja062677d. [DOI] [PubMed] [Google Scholar]
- Ramanan V.; Subray S. H.; Ramamurthy P. A Green Synthesis of Highly Luminescent Carbon Dots from Itaconic Acid and Their Application as an Efficient Sensor for Fe3+ Ions in Aqueous Medium. New J. Chem. 2018, 42, 8933–8942. 10.1039/C8NJ00813B. [DOI] [Google Scholar]
- Bao R.; Chen Z.; Zhao Z.; Sun X.; Zhang J.; Hou L.; Yuan C. Green and Facile Synthesis of Nitrogen and Phosphorus Co-Doped Carbon Quantum Dots towards Fluorescent Ink and Sensing Applications. Nanomaterials 2018, 8, 386. 10.3390/nano8060386. [DOI] [PMC free article] [PubMed] [Google Scholar]
- Wang N.; Liu Z. X.; Li R. S.; Zhang H. Z.; Huang C. Z.; Wang J. The Aggregation Induced Emission Quenching of Graphene Quantum Dots for Visualizing the Dynamic Invasions of Cobalt (II) into Living Cells. J. Mater. Chem. B 2017, 5, 6394–6399. 10.1039/C7TB01316G. [DOI] [PubMed] [Google Scholar]
- Zhu X.; Zhang Z.; Xue Z.; Huang C.; Shan Y.; Liu C.; Qin X.; Yang W.; Chen X.; Wang T. Understanding the Selective Detection of Fe3+ Based on Graphene Quantum Dots as Fluorescent Probes: The Ksp of a Metal Hydroxide-Assisted Mechanism. Anal. Chem. 2017, 89, 12054–12058. 10.1021/acs.analchem.7b02499. [DOI] [PubMed] [Google Scholar]
Associated Data
This section collects any data citations, data availability statements, or supplementary materials included in this article.