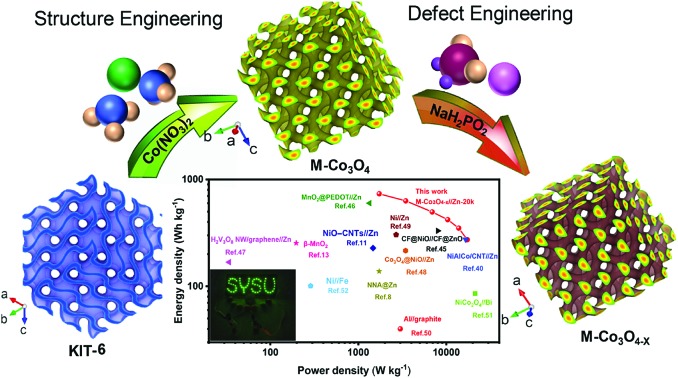
 Ordered mesoporous and oxygen-vacancy are demonstrated to significantly improve the electrochemical performance of Co3O4. Capitalizing on the optimized M-Co3O4–x cathode, the ZBB exhibits ultrahigh energy density and extraordinary cycling stability.
Abstract
The key challenges of aqueous Zn-based batteries (ZBBs) are their unsatisfactory energy density and poor lifespan, mainly arising from the low capacity and irreversibility of the cathode materials. Herein, a three-dimensional (3D) ordered mesoporous nanoarchitecture cobaltosic oxide (M-Co3O4) with rich oxygen vacancies (M-Co3O4–x) is reported as a new promising advanced cathode material for rechargeable ZBBs. The experimental results and DFT calculations reveal that the energy storage capacity is significantly enhanced by the synergistic effect of mesopores and oxygen vacancies. Benefiting from the merits of a substantially fast ion diffusion channel, high electrical conductivity, large active surface area, strong OH– adsorption capacity and stable structure, the fabricated M-Co3O4–x//Zn battery delivers a remarkable capacity of 384 mA h g–1 at 1.0 A g–1 which even rises up to 420 mA h g–1 after cycling activation with an ultrahigh energy density of 722.4 W h kg–1 (based on the weights of the cathode active material), which outperforms most of the previously reported aqueous ZBBs. More impressively, the M-Co3O4–x//Zn battery exhibits extraordinary cycling stability, both at 1 A g–1 and 10 A g–1 without any decay of capacity after 6000 and 60 000 cycles, respectively, and such high cycling stability is reported for the first time in ZBBs. The ultrahigh energy and superlong lifespan of aqueous ZBBs could make it satisfy some practical energy demands.
Introduction
Cost-effective, environmentally friendly, and safe advanced energy-storage devices are critical for future widespread utilization of renewable energy sources (such as wind, wave, and solar), power portable electronics and electrified vehicles.1–3 Among various alternative options, aqueous zinc-based batteries (ZBBs) are particularly attractive due to their unique properties of high safety, low-cost, extensive zinc global stockpile, environmental benignity, low Zn/Zn2+ redox potential (about 0.76 V vs. the standard hydrogen electrode (SHE)),4,5 and high theoretic capacity of the zinc metal electrode (820 mA h g–1).4,6 However, the widespread application of these ZBBs is still seriously impeded by two main challenges. The first one is the poor lifespan (<2000 cycles), which mainly derives from the dendritic formation of the Zn anode, and the dissolution or huge volume change of the cathode during charging–discharging processes.5,7,8 The other one is the unsatisfactory energy density as a result of the much lower capacity of the cathode than the Zn anode.9 The exploitation of high-capacity and durable cathode materials is very hopeful to address these two issues. Currently, various kinds of transition metal oxides including NiO, MnO2, Co3O4, V2O5etc.7,9–15 have been widely investigated as cathodes in ZBBs because of their abundant oxidation states that are available for reversible redox reactions and extensive global stockpile of the most transition metal oxides. Particularly, spinel cobaltosic oxide (Co3O4) has received ever-growing interest as a promising ZBB electrode material because of its unique advantages of high theoretical capacity (446 mA h g–1), low-cost, earth abundance, and high thermodynamic stability. For instance, Wang et al.7 constructed a Zn//Co3O4 battery by using ultrathin Co3O4 nanosheets as the cathode, which displayed a capacity of 162 mA h g–1 at 1 A g–1 and 80% capacity retention after 2000 cycles. A high-voltage Co//Zn battery with a high discharge capacity of 205 mA h g–1 and a remarkable energy density of 360.8 W h kg–1 at 0.5 A g–1 was recently demonstrated by employing a Co(iii) rich-Co3O4 nanorod material as the cathode.10 This battery also yielded fairly good cycling stability of 92% capacity retention after 5000 charge–discharge cycles. In spite of these advances, due to the inherently poor conductivity (semiconducting nature), limited active site exposure and huge volume change of Co3O4, the energy density and cyclic life of these current Zn//Co3O4 batteries are still far from practical application. To sum up, it is still a great challenge and highly attractive to explore new Co3O4 cathodes with ultrahigh capacity and excellent durability for ZBBs.
In this work, we report a structure and defect engineered Co3O4 architecture with unprecedented electrochemical activity as a robust cathode for Zn//Co3O4 batteries. This Co3O4 architecture composed of three-dimensional (3D) ordered mesopores and abundant oxygen vacancies is facilely prepared through a simple nanocasting method and post-thermal-reduction treatment (denoted as M-Co3O4–x). The characteristic 3D mesoporous morphology design provides a large surface area, enhanced permeability and shortened ion transport distance.16,17 In addition, the appropriate channel and stable structure are beneficial to alleviate the large volume changes during the charge/discharge process,18 which are favorable to gain a longer cycling life.16,19 Meanwhile, the creation of oxygen vacancies within the metal oxide is an effective approach to improve the conductivity and achieve more active sites for surface redox reactions in electrodes,20,21 which is verified by both experimental and density functional theory (DFT) studies. As a result, the as-fabricated ZBB based on the optimized M-Co3O4–x cathode delivers an admirable capacity of 420 mA h g–1 at 1.0 A g–1 and an ultrahigh energy density of 722.4 W h kg–1 (based on the weights of M-Co3O4–x) after cycling activation. Moreover, the rechargeable M-Co3O4–x//Zn battery possesses extraordinary cycling stability without any capacity decay after 6000 and 60 000 cycles at 1 A g–1 and 10 A g–1, respectively. All of the results imply that the porous M-Co3O4–x has high potential for real application in high-performance ZBBs.
Results and discussion
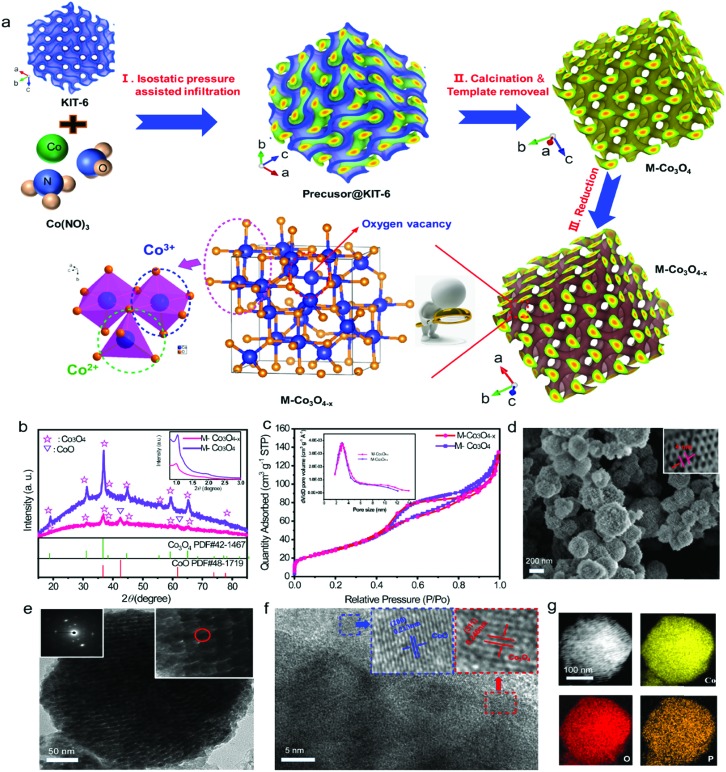
The M-Co3O4–x architecture is fabricated by a facile isostatic pressure assisted nanocasting method, which we first designed and has been used in the preparation of zeolite templated carbon (ZTC),22 and following reduction treatment under a reductive steam (Fig. 1a). Typically, an ordered mesoporous Co3O4 (M-Co3O4) architecture is synthesized by using a high isostatic pressure assisted nanocasting method under 300 MPa with mesoporous KIT-6 zeolite as a hard template (Fig. S1†). Then, in order to induce oxygen vacancies, the as-obtained M-Co3O4 is calcined in the presence of a NaH2PO2·H2O steam at 250 °C (see detailed methods in the Experimental section). Fig. 1b compares the typical X-ray diffraction (XRD) patterns of the M-Co3O4 and M-Co3O4–x samples. Besides the diffraction peaks of Co3O4 (PDF#42-1467, FD-3m(227)), two additional weak diffraction peaks at 42.6° and 62° that correspond to the (200) and (220) planes of the CoO phase (PDF#48-1719) are observed for the M-Co3O4–x samples, indicating that a small amount of Co3+ has been successfully reduced to Co2+ during the thermal-reduction process. It is well known that oxygen vacancies are easily formed in Co3O4, accompanied by the transformation of Co3+ to Co2+.21,23 The inset in Fig. 1b shows the corresponding low-angle powder XRD pattern. Two resolved peaks at around 1° and 1.9° assigned to (211) and (332) reflections suggest that the as-obtained sample is successfully replicated from the template KIT-6 topology.24 The mesoporous structure of M-Co3O4 and M-Co3O4–x samples is further confirmed by N2 sorption. In Fig. 1c, both of them show similar obvious hysteresis loops, which clearly supports the mesoporous structure conclusion. The pore size distribution (PSD) plot inserted in Fig. 1c shows the majority mesopore sizes of 2–5 nm for both samples. In addition, high Brunauer–Emmett–Teller (BET) surface areas of 143 m2 g–1 and 139 m2 g–1 are obtained for the pristine M-Co3O4 and M-Co3O4–x samples (Table S1†), respectively. Both the similar pore size and BET surface area indicate that the morphology and mesoporous features of M-Co3O4 are well preserved after the thermal-reduction treatment.
Fig. 1. (a) Schematic illustration of the synthesis procedure of M-Co3O4 and M-Co3O4–x samples, (b) XRD patterns, (c) N2 sorption isotherms and pore size distributions (PSDs) of M-Co3O4 and M-Co3O4–x. (d, e and f) SEM, TEM and HRTEM images of M-Co3O4–x; (g) high-angle annular dark-field scanning TEM (HAADF-STEM) of M-Co3O4–x and its corresponding elemental color mapping for Co, O and P.
The scanning electron microscopy (SEM) and transmission electron microscopy (TEM) images of M-Co3O4–x (Fig. 1d and e) show a round pie shaped morphology with diameters of around 100–250 nm and ordered mesopores throughout the whole architecture. The higher resolution image indicates that the nanoporous architectures are constituted by interconnected sphere nanoparticles, which give rise to a regular porous texture. The average pore diameter is around 4 nm, in good agreement with the PSD results of the N2 sorption test (Fig. 1c inset), which is beneficial for the penetration of the electrolyte and fast ion transport. After reduction treatment, the morphology of M-Co3O4–x remains intact (Fig. 1d, e and S2†), which implies a strong connection between the nanoparticles. The selected-area electron diffraction (SAED) analyses further confirm the polycrystalline nature of pristine M-Co3O4 and M-Co3O4–x (Fig. 1e, S2b†, inset). High-resolution TEM (Fig. 1f) clearly reveals the well-resolved lattice fringes of 0.213 and 0.246 nm, corresponding to the (200) plane of CoO (PDF#48-1719) and the (311) plane of Co3O4 (PDF#42-1467),19,25,26 consistent with the XRD results. Besides, the energy-dispersive spectroscopy (EDS) mapping demonstrates that Co, O and P elements are distributed homogeneously (Fig. 1g).
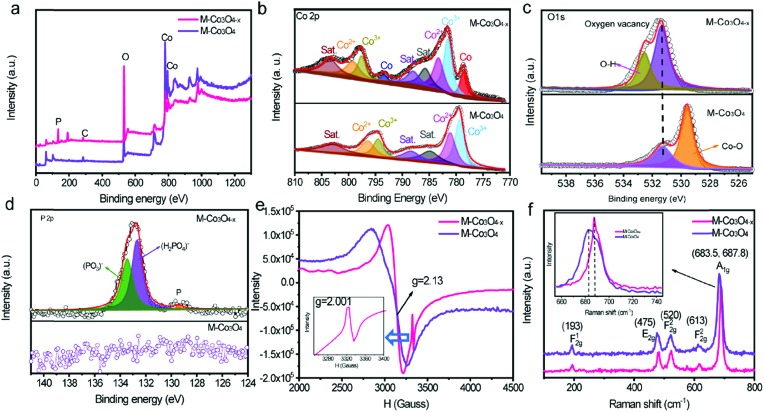
The evolution of the chemical states of Co and O species in M-Co3O4–x is identified by X-ray photoelectron spectroscopy (XPS) and low temperature electron paramagnetic resonance (EPR) measurements. The XPS full-survey scan spectra (Fig. 2a) exhibit the characteristic peaks for Co, O and/or P as the principal elemental components for pristine M-Co3O4 and M-Co3O4–x. The Co 2p emission spectra of both samples (Fig. 2b) show two spin orbit doublets (Co 2p1/2 and Co 2p2/3) and three shakeup satellites.27 Compared with the M-Co3O4 sample, the surface Co2+/Co3+ ratio of the M-Co3O4–x sample is increased from 1.08 to 1.16, suggesting that some Co3+ species are successfully reduced to Co2+ after the thermal-reduction process. Moreover, the peak of Co 2p shifted to a higher energy location, which further indicates the increased ratio of Co2+/Co3+ in the surface lattice.28 In addition, there are noticeable characteristic peaks of Co,29 suggesting the existence of a spot of the metal Co phase in M-Co3O4–x. Fig. 2c compares the core level O 1s XPS spectra of the pristine M-Co3O4 and M-Co3O4–x samples. The peak at 531.5 eV is ascribed to oxygen vacancy sites with a low oxygen coordination,30 and the peak at 532.7 eV belongs to O–H from surface absorbed water.30,31 In comparison with the pristine M-Co3O4 sample, the peak attributed to oxygen vacancy sites (531.5 eV) is obviously enhanced for M-Co3O4–x, indicating an increased number of oxygen defects after the thermal-reduction treatment. The P 2p core-level XPS spectra (Fig. 2d) reveal that the P species present as (PO3)– and (HPO4)2–on the surface of M-Co3O4–x which may also contribute to electrochemical reactivity.32 The thermal reduction result is further investigated by using EPR spectra (Fig. 2e). The big signal peak in EPR spectrum is attributed to Co2+ which is noticed higher in M-Co3O4–x than that of pristine M-Co3O4, confirming the generation of Co2+ species after the reduction treatment. In addition, a noticeable narrow peak signal with a g factor of 2.001 is developed in the M-Co3O4–x spectrum, which is characteristic of paramagnetic (single-electron-trapped) oxygen vacancies,33 verifying the formation of oxygen vacancies in the lattice. Both Raman spectra of M-Co3O4 and M-Co3O4–x in Fig. 2f display characteristic peaks at 193, 475, 520, 613 and around 685 cm–1, corresponding to the F12g, E2g, F22g, F22g, and A1g phonon modes of the Co–O bond respectively.34 In addition, it is worth noting that the A1g peak center for the M-Co3O4–x sample is obviously blue shifted (687.8 cm–1) compared with that of pristine M-Co3O4 (683.5 cm–1), which suggests the change of vibrational energy levels of Co–O after the formation of oxygen vacancies.
Fig. 2. (a) XPS spectra of M-Co3O4–x and M-Co3O4, and their corresponding high-resolution XPS spectra of Co 2p (b), O 1s (c) and P 2p (d) peaks. (e) EPR spectra of M-Co3O4–x and M-Co3O4 samples. (f) Raman spectra of M-Co3O4–x and M-Co3O4 samples.
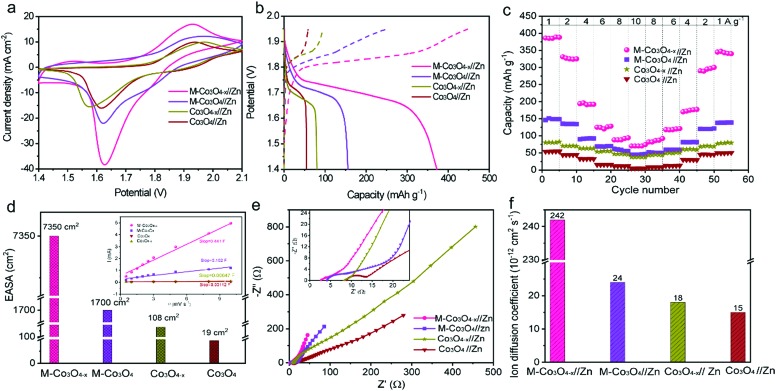
To illustrate the virtues of our structure and defect design in boosting the electrochemical performance, non-porous Co3O4 nanoparticles and non-porous oxygen-vacancy Co3O4 (denoted as Co3O4–x) nanoparticle products are also prepared via similar synthetic procedures (Experiment section, Fig. S3†). The electrochemical performance of the as-prepared samples as cathodes in aqueous ZBBs is evaluated with metallic Zn foil as the anode in the electrolyte of 6 M KOH with 0.02 M Zn(Ac)2. Fig. 3a compares the cyclic voltammetry (CV) profiles of the M-Co3O4//Zn, M-Co3O4–x//Zn, Co3O4//Zn, and Co3O4–x//Zn batteries at 10 mV s–1, from which the highest current densities are observed for the M-Co3O4–x//Zn battery. This demonstrates the significantly enhanced electrochemical performance of the M-Co3O4–x electrode after introducing 3D ordered mesopores and oxygen vacancies. The redox peaks in the four CV curves are attributed to reversible faradaic processes between Co–O and CoO–OH in the alkaline electrolyte.7,27
Fig. 3. (a and b) CV and GCD curves of M-Co3O4–x//Zn, M-Co3O4//Zn, Co3O4–x//Zn and Co3O4//Zn batteries at 10 mV s–1 and 1 A g–1, respectively. (c) Rate performance of the batteries at various current densities. (d, e and f) Electrochemically active surface area (EASA), electrochemical impedance spectroscopy (EIS) and ion diffusion coefficient (D) tests of M-Co3O4–x//Zn, M-Co3O4//Zn, Co3O4–x//Zn and Co3O4//Zn batteries.
The galvanostatic charge–discharge (GCD) profiles of M-Co3O4–x//Zn, M-Co3O4//Zn, Co3O4–x//Zn and Co3O4//Zn batteries are displayed in Fig. 3b. Obviously, the M-Co3O4–x//Zn battery delivers a considerably longer discharge plateau than the other three batteries, confirming its highest capacity. By calculation, the Zn//M-Co3O4–x yields a remarkable specific capacity of 384 mA h g–1 (based on the weights of M-Co3O4–x, 0.384 mA h cm–2) at a current density of 1.0 A g–1, which is 2.6-fold, 4.9-fold and 7.2-fold greater than that of M-Co3O4 (150 mA h g–1), Co3O4–x (80 mA h g–1) and Co3O4 (50 mA h g–1), respectively. The above results indicate a strong synergistic effect between the porous architecture and oxygen vacancies on electrochemical energy storage and highlight the superiority of the optimized M-Co3O4–x nanoarray as a cathode electrode. In addition, the high specific capacity of the M-Co3O4–x//Zn battery is the highest value among those of all the cathode materials for Zn-based batteries so far (except Zn–Air batteries) (Table S2†), such as Zn//V2O5 (224 mA h g–1 at 0.1 A g–1),12 Zn//Co3O4 (168 mA h g–1 at 1 A g–1),7 α-MnO2//Zn (382.2 mA h g–1 at 0.3 A g–1),35 ZnMn2O4//Zn (150 mA h g–1 at 0.5 A g–1),36 VS2//Zn (190.3 mA h g–1 at 0.05A g–1),37 Zn/polyaniline (PANI)-intercalated MnO2 (280 mA h g–1 at 0.2 A g–1),38 Na1.1V3O7.9@rGO//Zn (220 mA h g–1 at 0.3 A g–1),39 Zn//Na0.95MnO2 (60 mA h g–1 at 2 C),40 and Zn//Al ion batteries (94 mA h g–1 at 0.1 A g–1).41 Meanwhile, the area capacity of our Zn//M-Co3O4–x battery (0.384 mA h cm–2) is also higher than or comparable to that of reported ZBBs with a similar mass loading (based on cathode materials), such as Zn//Co3O4 (0.336 mA h cm–2 at 2 mA cm–2),7 Zn//ZnMn2O4 (0.3 mA h cm–2 at 0.1 mA cm–2),36 NiAlCoLDH//Zn (0.305 mA h cm–2 at 5.81 mA cm–2),42 and Zn/Co(iii) rich-Co3O4 batteries (0.215 mA h cm–2 at 0.525 mA cm–2).10
The detailed rate performance of the four batteries is presented in Fig. 3c and S4a.† When cycling at current densities of 1, 2, 4, 6, 8 and 10 A g–1, the M-Co3O4–x//Zn battery exhibits capacities of 384, 331, 196, 125, 92 and 70 mA h g–1, respectively, and these values are much higher than those of the M-Co3O4//Zn, Co3O4–x//Zn and Co3O4//Zn batteries. Upon switching back to 1.0 A g–1 after 50 cycles, the specific capacity of the M-Co3O4–x//Zn battery still remains at 340 mA h g–1, revealing its outstanding capacity and cycling performance. All these observations suggest a great enhancement of the electrochemical performance of the M-Co3O4–x//Zn battery over the others.
To investigate the electrochemical kinetics of the M-Co3O4–x//Zn battery, the anodic/cathodic current (i) is assumed to obey a power-law relationship with the scan rate (v) of i = avb, with a and b being adjustable values. In the ln(i)–ln(ν) plot (Fig. S4b†), the M-Co3O4–x//Zn battery possesses an approximate b-value of 0.5 at scan rates ranging from 5 to 100 mV s–1, implying a diffusion-controlled kinetics process. Such improved performance is clearly elucidated by electrochemically active surface area (EASA), electrochemical impedance spectroscopy (EIS) and ion diffusion coefficient (D) tests. The EASA of these samples is estimated using a mature method as seen in the ESI† calculation,31,43 and Fig. S5.† The Fig. 3d inset displays the anodic charging current (i) measured at 1.45 V as a function of the scan rate for all electrodes. Importantly, M-Co3O4–x achieves a far steeper slope than the M-Co3O4, Co3O4–x and Co3O4 samples, revealing its largest number of active sites. The corresponding EASA of the M-Co3O4–x electrode, determined by assuming a Cdl value of 60 μF cm–2 for a smooth surface sample,31,43 is 7350 cm2, which is much higher than that of M-Co3O4 (1700 cm2), Co3O4–x (108 cm2) and Co3O4 (19 cm2). Obviously, the mesoporous and/or defective oxygen-vacancy samples show a much higher EASA than pristine ones, indicating the crucial synergetic effect of the mesopores and oxygen vacancies. The charge transfer resistance (Rct, the diameter of semicircles on the x-axis of the Nyquist plot, Fig. 3e) of M-Co3O4–x//Zn and Co3O4–x//Zn batteries is determined to be 2.0 Ω and 1.4 Ω, respectively, which are much smaller than those of M-Co3O4//Zn (4.4 Ω) and Co3O4//Zn (5.0 Ω). The smaller resistance confirms that oxygen vacancies are able to greatly improve the conductivity of cobaltosic oxide, which is consistent with most previous reports.23,44,45 In addition, in the low frequency region, M-Co3O4–x//Zn exhibits a steeper slope than the other three batteries, implying that the ion mobility in M-Co3O4–x is very efficient. To quantify the ion diffusion rate in the electrodes, we further measured the chemical diffusion coefficient (D) by using the potentiostatic intermittent titration technique (PITT).46 Fig. S6a† shows the transient i–t plots of the M-Co3O4–x//Zn, M-Co3O4//Zn, Co3O4–x//Zn and Co3O4//Zn batteries collected at 1.72 V with a potential step of 10 mV. The rate of current decay is related to the speed of ion diffusion from the electrode/electrolyte interface into the electrode. The ln(i)–t curves are collected and are linearly fitted (Fig. S6b†), and the value of D is calculated from the slope of the linear region in the plot of ln(i) vs. t (ESI,† “calculation”), using the following equation: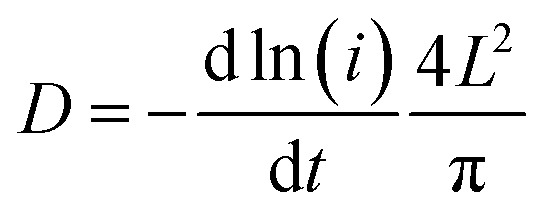 Significantly, the M-Co3O4–x//Zn battery has much higher D values than M-Co3O4//Zn, Co3O4–x//Zn and Co3O4//Zn electrodes at the potential we measured (Fig. 3f), supporting that the 3D porous nanoarray and oxygen-vacancy structure enhances the ion diffusion efficiency in the M-Co3O4–x electrode.
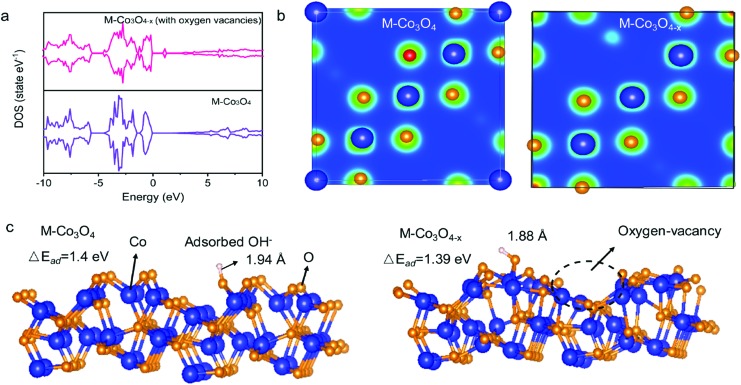
The density functional theory (DFT) calculations are carried out to investigate the effect of oxygen vacancies of M-Co3O4–x on its electrochemical performance. The total densities of states (DOSs) of both the pristine M-Co3O4 and the oxygen-vacancy M-Co3O4–x are plotted in Fig. 4a. Obviously, for the oxygen-vacancy M-Co3O4–x a new state is formed within the band gap, located at ≈ 1.5 eV below the conduction band minimum, which narrows the bandgap of the valence and conduction bands from 2.7 to 0.89 eV. This narrowed bandgap is beneficial for the enhanced excitation of charge carriers to the conduction band, which accounts for the experimentally observed increasing conductivity after the formation of oxygen vacancies in Co3O4. Meanwhile, the charge distribution in M-Co3O4–x is disturbed after the incorporation of oxygen vacancies. As shown in Fig. 4b, the charge densities around oxygen vacancies are weakened, and this special charge distribution can provide more active sites for electrochemical reactions.20 In addition, the energy storage nature is gained by assessing the adsorption properties of OH– on the surface of cobaltosic oxide, and two configurations of M-Co3O4 (311) and oxygen-vacancy M-Co3O4–x (311) are modeled in Fig. 4c. Compared with pristine M-Co3O4 (Fig. 4c), the oxygen-vacancy M-Co3O4–x shows smaller calculated absorption energy (ΔEad) and a decreased Co–O bond length of adsorbed OH– by 0.01 eV and 0.06 Å, respectively, indicating its stronger affinity with OH– after introducing oxygen vacancies, which is useful to accelerate the following faradaic reaction for energy storage: . The theoretical calculations support that the oxygen vacancies could endow Co3O4 with an optimal electronic structure for energy storage.
Fig. 4. (a) DOS of pristine M-Co3O4 and defective M-Co3O4–x (with oxygen vacancies). (b) The differential charge density of M-Co3O4 and M-Co3O4–x. (c) Calculated structures and OH– adsorption energies (ΔEad) of M-Co3O4 (311) and M-Co3O4–x (with oxygen vacancies) (311) surfaces.
Therefore, the enhanced performance of the M-Co3O4–x//Zn battery can be attributed to the unique features of its M-Co3O4–x cathode. First, the 3D ordered mesoporous nanoarray structure simultaneously provides higher electron-ion transport pathways and more electrochemical active area, which is much higher than that of its bulk counterparts. Second, the introduction of oxygen vacancies into the nanoarray decreases the energy required for the adsorption of OH– onto the surface, which in turn leads to an enhanced redox reaction. Finally, the defect feature improves the electrode's electrical conductivity and shortens the electron transfer distance from the redox sites to the conductive intermediate via metallic Co–Co chains and oxygen vacancies resulting in facilitating charge transfer kinetics.
We also investigated the influence of the calcination temperature on the electrochemical properties of the M-Co3O4 electrode. The samples of M-Co3O4 treated at different phosphating temperatures (X) are denoted as M-Co3O4–x(X), while the sample treated at 250 °C is denoted as M-Co3O4–x in the text. These oxygen-defective M-Co3O4–x(X) samples are characterized and tested as shown in Fig. S7–S13.† As the thermal treatment temperature increases from 205 °C to 300 °C, these samples give similar morphologies, but a rougher surface, lower BET surface area, larger pore size and more oxygen vacancies and Co/CoO phase formation accompanied by more Co3+ species reduction (Fig. S7, S8a, S8b, S8c, S8d and S10†). Fig. S12a and S12b† compare the capacities of the pristine M-Co3O4 and M-Co3O4–x(X) electrodes at 1 A g–1 current density. Evidently, all M-Co3O4–x(X)//Zn exhibit higher capacity than pristine M-Co3O4//Zn, revealing that structural defects exert a profound effect on the charge–discharge properties of the M-Co3O4 electrode. But excess oxygen vacancies lead to the decrease of reaction active sites (Fig. S12e†), and the M-Co3O4–x electrode with 250 °C NaH2PO2·H2O treatment shows the best performance.
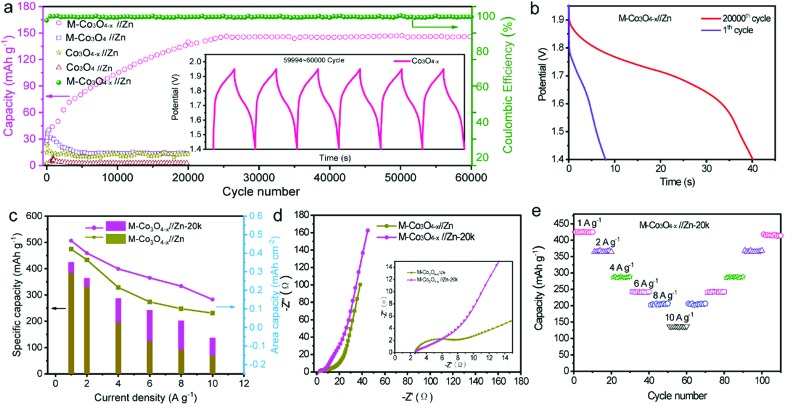
We also studied the long-term cycling performance of the M-Co3O4–x//Zn battery. Fig. 5a shows the variation of the specific capacity collected for the four batteries at a current density of 10 A g–1 for 20 000 and/or 60 000 cycles. Notably, the specific capacity of the M-Co3O4–x//Zn battery continuously increases in the initial 20 000 cycles and then remains comparatively steady as the cycling continued. After 60 000 cycles, the M-Co3O4–x//Zn battery achieves 140 mA h g–1, which represents an about 400% enhancement compared with its initial capacity before cycling (35 mA h g–1). The capacity increases up to 120% (after 2000 cycles) compared to the first cycle and remains stable even after 6000 cycles under deep charge–discharge conditions of 1 A g–1, (Fig. S14†), indicating an ultrahigh cycling ability and structural stability. In contrast, the M-Co3O4//Zn, Co3O4–x//Zn and Co3O4//Zn batteries show much lower cycling abilities and capacities. To the best of our knowledge, such a long cycling lifespan has not been reported in ZBBs to date. Considering that the Zn anode has great influence on the stability of Zn-based batteries, the morphology and phase of the Zn anode after cycling were investigated. As shown in Fig. S15 and S16,† the smooth surface of the Zn anode became highly coarse and some ZnO was formed on its surface. However, the Zn anode used in our experiment is highly overdosed (the mass ratio of Zn to Co3O4 is up to 170 : 1), and the effect of the dendrite issue of the Zn anode on the stability of these four batteries is not dominant. The electrochemical performance of the M-Co3O4–x electrode after 20 000 cycles is further investigated, and good capacitive behavior is maintained. Fig. 5b, c and d compare the GCD curves, specific capacities at different current densities and EIS for the M-Co3O4–x//Zn battery before and after 20 000 cycles. The battery after 20 000 cycles is denoted as M-Co3O4–x//Zn-20k. Obviously, M-Co3O4–x//Zn-20k shows higher capacity and rate capacity and lower resistance than that before cycling. When cycling at current densities of 1, 2, 4, 6, 8 and 10 A g–1, M-Co3O4–x//Zn-20k exhibits high capacities of 420 mA h g–1, 366 mA h g–1, 288, 242, 204, and 137 mA h g–1, respectively. Upon switching back to 1 A g–1 after 110 cycles, the specific capacity is still maintained at 410 mA h g–1, revealing its outstanding rate and cycling performance (Fig. 5e). Fig. S17† compares the CV curves of M-Co3O4–x//Zn and Co3O4–x//Zn-20k collected at 10 mV s–1. In addition to the increased current density of Co3O4–x//Zn-20k, the intensity of the redox peaks also obviously increased, which may be attributed to the further enrichment of the active material during the cycling test.
Fig. 5. (a) Cycling performance of M-Co3O4–x//Zn, M-Co3O4//Zn, Co3O4–x//Zn and Co3O4–x//Zn batteries at 10 A g–1. (b, c and d) GCD curves, specific capacities at various current densities and Nyquist plots of M-Co3O4–x//Zn and M-Co3O4–x//Zn-20k batteries. (e) Cycling rate performance of M-Co3O4–x//Zn-20k.
To understand the origin of the enhanced capacity and super-long cycle lifespan of the M-Co3O4–x//Zn battery, the morphology and chemical composition of the M-Co3O4–x electrode after cycling are investigated. SEM and TEM images reveal that after cycling M-Co3O4–x still kept the ordered porous morphology, which is almost the same as that of the initial M-Co3O4–x (Fig. S18a,† S19a). For comparison, the morphologies of M-Co3O4, Co3O4–x and Co3O4 before and after cycling are also determined. The same as M-Co3O4–x, pristine M-Co3O4 still kept structural stability after cycling (Fig. S18b and S19b†). In contrast, the structures of non-porous Co3O4–x and Co3O4 electrodes are almost totally destroyed (Fig. S18c, S19c and S19d†), indicating that the ordered 3D porous structure is useful to keep the structural integrity during the charge/discharge process. Besides, the EDS mapping of the M-Co3O4–x electrode after cycling (Fig. S20a†) demonstrates that all elements involved, i.e. Co, O, P, K, and Zn, are homogeneously distributed without enrichment. Fig. S20† compares the core level Co 2p, O 1s and P 2p XPS spectra of M-Co3O4 in different cycles. The ratio of Co2+/Co3+ decreases and the Co peaks absolutely disappear after cycling, indicating that partial Co and CoO have been re-oxidized during the cycling process, accompanied by the gradual decrease of oxygen vacancies. It is well known that the appropriate amount of the oxygen vacancies is important for achieving optimum electrical conductivity and electrochemical activity.47,48 Additionally, oxygen vacancies still exist and remain stable without further decrease after cycling (Fig. S20†). Therefore, the enhanced performance of the M-Co3O4–x//Zn battery during the cycling test is mainly because of the continual formation of electrochemically active Co3O4 from the oxidization of newly exposed Co and CoO and an optimal oxygen-vacancy level achieved during both the activation and cycling test processes. These findings indicate that the electrochemical performance of the M-Co3O4–x electrode can be improved through this activation.
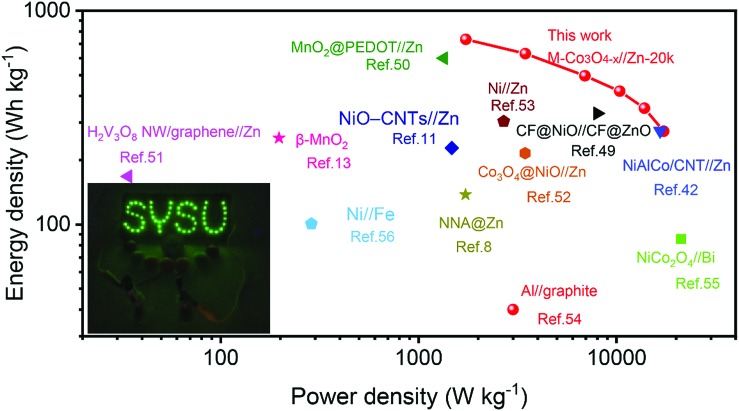
Fig. 6 presents the Ragone plots of M-Co3O4–x//Zn-20k with the comparison of energy and power densities of other reported aqueous batteries. Encouragingly, a remarkable energy density of 722.4 W h kg–1 at a power density of 1.73 kW kg–1 (based on the mass of the M-Co3O4–x cathode) is achieved by the M-Co3O4–x//Zn-20k battery. Such an ultrahigh energy density of the M-Co3O4–x//Zn-20k battery surpasses that of lots of recently reported Zn-based batteries and other aqueous batteries, such as the NiAlCo/CNT//Zn battery (274 W h kg–1 at 16.6 kW kg–1),42 CF@NiO//CF@ZnO battery (330.8 W h kg–1 at 8.0 kW kg–1),49 MnO2@PEDOT//Zn battery (599.8 W h kg–1 at 1.34 kW kg–1),50 NiO-CNTs//Zn (228 W h kg–1 at 1.47 kW kg–1),11 H2V3O8 NW/graphene//Zn (168 W h kg–1 at 0.034 kW kg–1),51 β-MnO2 (254 W h kg–1 at 197 W kg–1),13 Co3O4@NiO//Zn battery (215.5 W h kg–1 at 3.45 kW kg–1),52 NNA@Zn (148.54 W h kg–1 at a power density of 1725 W kg–1),8 Ni//Zn (303.8 W h kg–1 at 2.69 kW kg–1),53 Al//graphite Al ion battery (40 W h kg–1 at 3.0 kW kg–1),54 NiCo2O4//Bi battery (85.5 W h kg–1 at 21.2 kW kg–1),55 Ni//Fe battery (100.7 W h kg–1 at 0.287 kW kg–1),56 and Zn//LiNi1/3Co1/3Mn1/3O2 (154 W h kg–1 at 0.5 C).57 Furthermore, to verify its potential application, two as-fabricated M-Co3O4–x//Zn batteries in series are employed for charging a neon sign consisting of 57 light-emitting diodes (Fig. 6 inset).
Fig. 6. Ragone plots of the M-Co3O4–x//Zn-20k battery. The values reported for other aqueous batteries are added for comparison. The inset is a photograph of a neon sign powered by two M-Co3O4–x//Zn battery devices.
Conclusion
In summary, we have developed an efficient structural and defect engineering strategy for designing 3D ordered mesoporous and oxygen-vacancy nanoarchitectures to significantly enhance the electrochemical performance of M-Co3O4–x as a robust cathode for Zn-based batteries. Benefiting from the synergetic effect of the ordered mesoporous nanoarchitecture and oxygen vacancies, the M-Co3O4–x electrode possesses a fast ion diffusion channel, short ion transport distance, high electrical conductivity, abundant active sites, strong OH– adsorption capacity and highly stabilized structure. As a result, the fabricated optimal M-Co3O4–x//Zn battery presents a considerable capacity of 384 mA h g–1 at 1 A g–1, which is about 8-fold greater than that of the pristine Co3O4//Zn battery (50 mA h g–1). In addition, the M-Co3O4–x//Zn-20k battery shows an extraordinary energy density of 722.4 W h kg–1 at a power density of 1.73 kW kg–1. Furthermore, the rechargeable M-Co3O4–x//Zn battery possesses unprecedented cycling stability without any capacity decay after 60 000 cycles. This 3D ordered mesoporous structural and oxygen-vacancy defect engineering is an effective strategy to design ultrahigh energy density and super durable cathode materials for ZBBs, which can also be extended for other metal oxide and metal sulfide electrode materials.
Experimental section
Preparation of M-Co3O4–x, M-Co3O4, Co3O4 and Co3O4–x
Three-dimensional mesoporous silica (KIT-6) with Ia3d symmetry is used as a hard template. The synthesis of mesoporous KIT-6 has been described in previous reports.58 A facile high isostatic assisted nanocasting is used to prepare ordered mesoporous Co3O4 (M-Co3O4): 1 g KIT-6 powder as the template is first degassed at 400 °C under dynamic vacuum for 3 h and then impregnated with a solution of Co(NO3)2·6H2O (wt%: 60%) at room temperature under reduced pressure. Subsequently the above mixture is poured into isostatic-pressing equipment (Fig. S21†), and then exposed to 300 MPa impregnation pressure for several minutes. The excrescent Co(NO3)2·6H2O solution is filtered, and the resulting material is calcined at 500 °C for 6 h in air with a heating rate of 1 °C min–1. Then the resulting complex (KIT-6@Co3O4) is twice treated with a 2 M NaOH solution at 60 °C to remove the silica template, followed by washing with deionized water several times, and then drying at 60 °C. To obtain M-Co3O4–x, the as-prepared M-Co3O4 is annealed in a N2 atmosphere in the presence of NaH2PO2·H2O (2 g) at 205–300 °C for 1 h (denoted as M-Co3O4–x(X), where X represents the treatment temperature, while the sample treated at 250 °C is denoted as M-Co3O4–x in the text).
The non-porous nanoparticle Co3O4 (denoted as Co3O4) is obtained by directly calcining the Co(NO3)2·6H2O precursor at 500 °C for 6 h in air. The non-porous oxygen-vacancy Co3O4–x (denoted as Co3O4–x) is prepared by using the same method as that of M-Co3O4–x.
Material characterization
The microstructures and compositions of the electrode materials are analyzed using N2 adsorption (Micromeritics ASAP 2020 PLUS HD88), Field-Emission-SEM (Zeiss/Bruker, Gemini500), a Spherical Aberration Corrected Transmission Electron Microscope (JEM-ARM200P), Raman spectroscopy (Renishaw in Via), XPS (ESCALab250, Thermo VG), and XRD (SmartLab). EPR tests are carried out in the X band (9.45 GHz) with a 5.00 G modulation amplitude and a magnetic field modulation of 100 kHz using a Bruker EPR spectrometer (A300-10-12, Bruker) at 77 K.
Electrochemical measurements
Cathode electrodes are prepared by mixing samples with the polyvinylidene fluoride (PVDF) binder (AR, Sigma-Aldrich) and carbon black (AR, Sigma-Aldrich) in a weight ratio of 7 : 2 : 1 in 1-methyl-2-pyrrolidinone until a homogeneous slurry is formed. The slurry is painted on nickel foam, and then the electrode is dried overnight at 333 K in a vacuum, and thereafter mechanically pressed under a pressure of 1 MPa for several seconds. The active material on nickel foam has a geometric area of 0.5 cm2 (0.5 cm × 1.0 cm), and the active mass loading of the electrode is 1.2 mg cm–2.
Commercial Zn foil is directly used as the anode without any treatment. The weight ratio of Zn and Co3O4 is about 170 : 1. CV, GCD measurements and electrochemical impedance spectroscopy are conducted using an electrochemical workstation (CHI 760E). The electrochemical characterization of the aqueous M-Co3O4–x//Zn, M-Co3O4//Zn, Co3O4–x//Zn and Co3O4//Zn batteries is performed in a two-electrode cell in an electrolyte solution of 6 M KOH with 0.2 M Zn(Ac)2, with cobaltosic oxide as the cathode and zinc foil as the anode.
Conflicts of interest
There are no conflicts to declare.
Supplementary Material
Acknowledgments
This work was supported by the Youth 1000 Talents Program of China, the National Natural Science Foundation of China (No. 21601211, 21805316, 21822509, and U1810110), the Tip-top Scientific and Technical Innovative Youth Talents of Guangdong Special Support Program (2015TQ01C205), and the Pearl River Nova Program of Guangzhou (201610010080).
Footnotes
†Electronic supplementary information (ESI) available: Additional morphology characterization, XPS, nitrogen adsorption–desorption data, electrochemical characterization of the samples and calculation formulas. See DOI: 10.1039/c9sc01902b
References
- Choi N. S., Chen Z., Freunberger S. A., Ji X., Sun Y. K., Amine K., Yushin G., Nazar L. F., Cho J., Bruce P. G. Angew. Chem., Int. Ed. Engl. 2012;51:9994. doi: 10.1002/anie.201201429. [DOI] [PubMed] [Google Scholar]
- Etacheri V., Marom R., Elazari R., Salitra G., Aurbach D. Energy Environ. Sci. 2011;4:3243. [Google Scholar]
- Bruce D., Haresh K., Jean-Marie T. Science. 2011;334:928. [Google Scholar]
- Xia C., Guo J., Li P., Zhang X., Alshareef H. N. Angew. Chem., Int. Ed. Engl. 2018;57:3943. doi: 10.1002/anie.201713291. [DOI] [PubMed] [Google Scholar]
- Fang G., Zhou J., Pan A., Liang S. ACS Energy Lett. 2018;3:2480. [Google Scholar]
- Kim H., Jeong G., Kim Y. U., Kim J. H., Park C. M., Sohn H. J. Chem. Soc. Rev. 2013;42:9011. doi: 10.1039/c3cs60177c. [DOI] [PubMed] [Google Scholar]
- Wang X., Wang F., Wang L., Li M., Wang Y., Chen B., Zhu Y., Fu L., Zha L., Zhang L., Wu Y., Huang W. Adv. Mater. 2016;28:4904. doi: 10.1002/adma.201505370. [DOI] [PubMed] [Google Scholar]
- Xu C., Liao J., Yang C., Wang R., Wu D., Zou P., Lin Z., Li B., Kang F., Wong C.-P. Nano Energy. 2016;30:900. [Google Scholar]
- Song M., Tan H., Chao D., Fan H. J. Adv. Funct. Mater. 2018;28:1802564. [Google Scholar]
- Ma L., Chen S., Li H., Ruan Z., Tang Z., Liu Z., Wang Z., Huang Y., Pei Z., Zapien J. A., Zhi C. Energy Environ. Sci. 2018;11:2521. [Google Scholar]
- Wang X., Li M., Wang Y., Chen B., Zhu Y., Wu Y. J. Mater. Chem. A. 2015;3:8280. [Google Scholar]
- Zhou J., Shan L., Wu Z., Guo X., Fang G., Liang S. Chem. Commun. 2018;54:4457. doi: 10.1039/c8cc02250j. [DOI] [PubMed] [Google Scholar]
- Zhang N., Cheng F., Liu J., Wang L., Long X., Liu X., Li F., Chen J. Nat. Commun. 2017;8:1. doi: 10.1038/s41467-017-00467-x. [DOI] [PMC free article] [PubMed] [Google Scholar]
- Mo F., Liang G., Meng Q., Liu Z., Li H., Fan J., Zhi C. Energy Environ. Sci. 2019;12:706–715. [Google Scholar]
- Ma L., Chen S., Pei Z., Li H., Wang Z., Liu Z., Tang Z., Zapien J. A., Zhi C. ACS Nano. 2018;12:8597–8605. doi: 10.1021/acsnano.8b04317. [DOI] [PubMed] [Google Scholar]
- Du H., Huang K., Li M., Xia Y., Sun Y., Yu M., Geng B. Nano Res. 2018;11:1490. [Google Scholar]
- Yu M., Wang W., Li C., Zhai T., Lu X., Tong Y. NPG Asia Mater. 2014;6:129. [Google Scholar]
- Guan C., Wang Y., Zacharias M., Wang J., Fan H. J. Nanotechnology. 2015;26:014001. doi: 10.1088/0957-4484/26/1/014001. [DOI] [PubMed] [Google Scholar]
- Wang Q., Yu B., Li X., Xing L., Xue X. J. Mater. Chem. A. 2016;4:425. [Google Scholar]
- Zong W., Lai F., He G., Feng J., Wang W., Lian R., Miao Y. E., Wang G. C., Parkin I. P., Liu T. Small. 2018;14:1801562. doi: 10.1002/smll.201801562. [DOI] [PubMed] [Google Scholar]
- Wang J., Gao R., Zhou D., Chen Z., Wu Z., Schumacher G., Hu Z., Liu X. ACS Catal. 2017;7:6533. [Google Scholar]
- Teng C., Han Y., Fu G., Hu J., Zheng H., Lu X., Jiang J. J. Mater. Chem. A. 2018;6:18938–18947. [Google Scholar]
- Cai Z., Bi Y., Hu E., Liu W., Dwarica N., Tian Y., Li X., Kuang Y., Li Y., Yang X.-Q., Wang H., Sun X. Adv. Energy Mater. 2018;8:1701694. [Google Scholar]
- Luo J., Zhang J., Xia Y. Cheminform. 2010;38:5618. [Google Scholar]
- Sun L., Deng Q., Li Y., Mi H., Wang S., Deng L., Ren X., Zhang P. Electrochim. Acta. 2017;241:252. [Google Scholar]
- Zhang Y., Ouyang B., Xu J., Jia G., Chen S., Rawat R. S., Fan H. J. Angew. Chem., Int. Ed. Engl. 2016;55:8670–8674. doi: 10.1002/anie.201604372. [DOI] [PubMed] [Google Scholar]
- Cheng M., Duan S., Fan H., Su X., Cui Y., Wang R. Chem. Eng. J. 2017;327:100. [Google Scholar]
- Hu C., Zhang L., Zhao Z. J., Luo J., Shi J., Huang Z., Gong J. Adv. Mater. 2017;29:1701820. doi: 10.1002/adma.201701820. [DOI] [PubMed] [Google Scholar]
- McIntyre N. S., Cook M. G. Anal. Chem. 1975;47:2208. [Google Scholar]
- Guan C., Liu X., Ren W., Li X., Cheng C., Wang J. Adv. Energy Mater. 2017;7:1602391. [Google Scholar]
- Zhu C., Fu S., Du D., Lin Y. Chemistry. 2016;22:4000. doi: 10.1002/chem.201504739. [DOI] [PubMed] [Google Scholar]
- Zhai T., Wan L., Sun S., Chen Q., Sun J., Xia Q., Xia H. Adv. Mater. 2017;29:1604167. doi: 10.1002/adma.201604167. [DOI] [PubMed] [Google Scholar]
- Hamdy M. S., Yahia I. S., Knoff W., Story T. Optik. 2018;158:1123. [Google Scholar]
- Dou Y., Xu J., Ruan B., Liu Q., Pan Y., Sun Z., Dou S. X. Adv. Energy Mater. 2016;6:1501835. [Google Scholar]
- Wu B., Zhang G., Yan M., Xiong T., He P., He L., Xu X., Mai L. Small. 2018;14:1703850. doi: 10.1002/smll.201703850. [DOI] [PubMed] [Google Scholar]
- Zhang N., Cheng F., Liu Y., Zhao Q., Lei K., Chen C., Liu X., Chen J. J. Am. Chem. Soc. 2016;138:12894. doi: 10.1021/jacs.6b05958. [DOI] [PubMed] [Google Scholar]
- He P., Yan M., Zhang G., Sun R., Chen L., An Q., Mai L. Adv. Energy Mater. 2017;7:1601920. [Google Scholar]
- Huang J., Wang Z., Hou M., Dong X., Liu Y., Wang Y., Xia Y. Nat. Commun. 2018;9:2906. doi: 10.1038/s41467-018-04949-4. [DOI] [PMC free article] [PubMed] [Google Scholar]
- Cai Y., Liu F., Luo Z., Fang G., Zhou J., Pan A., Liang S. Energy Storage Materials. 2018;13:168–174. [Google Scholar]
- Zhang B., Liu Y., Wu X., Yang Y., Chang Z., Wen Z., Wu Y. Chem. Commun. 2014;50:1209–1211. doi: 10.1039/c3cc48382g. [DOI] [PubMed] [Google Scholar]
- Wang F., Yu F., Wang X., Chang Z., Fu L., Zhu Y., Wen Z., Wu Y., Huang W. ACS Appl. Mater. Interfaces. 2016;8:9022–9029. doi: 10.1021/acsami.5b06142. [DOI] [PubMed] [Google Scholar]
- Gong M., Li Y., Zhang H., Zhang B., Zhou W., Feng J., Wang H., Liang Y., Fan Z., Liu J., Dai H. Energy Environ. Sci. 2014;7:2025. [Google Scholar]
- Benck J. D., Chen Z., Kuritzky L. Y., Forman A. J., Jaramillo T. F. ACS Catal. 2012;2:1916. [Google Scholar]
- Yu M., Wang Z., Hou C., Wang Z., Liang C., Zhao C., Tong Y., Lu X., Yang S. Adv. Mater. 2017;29:1602868. doi: 10.1002/adma.201602868. [DOI] [PubMed] [Google Scholar]
- Zeng Y., Lai Z., Han Y., Zhang H., Xie S., Lu X. Adv. Mater. 2018;30:1802396. doi: 10.1002/adma.201802396. [DOI] [PubMed] [Google Scholar]
- Tang S. B., Lai M. O., Lu L. J. Alloys Compd. 2008;449:300. [Google Scholar]
- Zhai T., Xie S., Yu M., Fang P., Liang C., Lu X., Tong Y. Nano Energy. 2014;8:255–263. [Google Scholar]
- Ventosa E., Xia W., Klink S., La Mantia F., Mei B., Muhler M., Schuhmann W. Chemistry. 2013;19:14194–14199. doi: 10.1002/chem.201302306. [DOI] [PubMed] [Google Scholar]
- Liu J., Guan C., Zhou C., Fan Z., Ke Q., Zhang G., Liu C., Wang J. Adv. Mater. 2016;28:8732. doi: 10.1002/adma.201603038. [DOI] [PubMed] [Google Scholar]
- Zeng Y., Zhang X., Meng Y., Yu M., Yi J., Wu Y., Lu X., Tong Y. Adv. Mater. 2017;29:1700274. doi: 10.1002/adma.201700274. [DOI] [PubMed] [Google Scholar]
- Pang Q., Sun C., Yu Y., Zhao K., Zhang Z., Voyles P. M., Chen G., Wei Y., Wang X. Adv. Energy Mater. 2018;8:1800144. [Google Scholar]
- Lu Z., Wu X., Lei X., Li Y., Sun X. Inorg. Chem. Front. 2015;2:184. [Google Scholar]
- Zhang H., Zhang X., Li H., Zhang Y., Zeng Y., Tong Y., Zhang P., Lu X. Green Energy Environment. 2018;3:56. [Google Scholar]
- Lin M. C., Gong M., Lu B., Wu Y., Wang D. Y., Guan M., Angell M., Chen C., Yang J., Hwang B. J., Dai H. Nature. 2015;520:325. doi: 10.1038/nature14340. [DOI] [PubMed] [Google Scholar]
- Zeng Y., Lin Z., Meng Y., Wang Y., Yu M., Lu X., Tong Y. Adv. Mater. 2016;28:9188. doi: 10.1002/adma.201603304. [DOI] [PubMed] [Google Scholar]
- Liu J., Chen M., Zhang L., Jiang J., Yan J., Huang Y., Lin J., Fan H. J., Shen Z. X. Nano Lett. 2014;14:7180. doi: 10.1021/nl503852m. [DOI] [PubMed] [Google Scholar]
- Wang F., Liu Y., Wang X., Chang Z., Wu Y., Holze R. ChemElectroChem. 2015;2:1024–1030. [Google Scholar]
- Kleitz F., Hei Choi S., Ryoo R. Chem. Commun. 2003;17:2136. doi: 10.1039/b306504a. [DOI] [PubMed] [Google Scholar]
Associated Data
This section collects any data citations, data availability statements, or supplementary materials included in this article.


