

Abstract
Voltage-dependent G-protein inhibition of presynaptic Ca2+ channels is a key mechanism for regulating synaptic efficacy. G-protein βγ subunits produce such inhibition by binding to and shifting channel opening patterns from high to low open probability regimes, known respectively as “willing” and “reluctant” modes of gating. Recent macroscopic electrophysiological data hint that only N-type, but not P/Q-type channels can open in the reluctant mode, a distinction that could enrich the dimensions of synaptic modulation arising from channel inhibition. Here, using high-resolution single-channel recording of recombinant channels, we directly distinguished this core contrast in the prevalence of reluctant openings. Single, inhibited N-type channels manifested relatively infrequent openings of submillisecond duration (reluctant openings), which differed sharply from the high-frequency, millisecond gating events characteristic of uninhibited channels. By contrast, inhibited P/Q-type channels were electrically silent at the single-channel level. The functional impact of the differing inhibitory mechanisms was revealed in macroscopic Ca2+ currents evoked with neuronal action potential waveforms (APWs). Fitting with a change in the manner of opening, inhibition of such N-type currents produced both decreased current amplitude and temporally advanced waveform, effects that would not only reduce synaptic efficacy, but also influence the timing of synaptic transmission. On the other hand, inhibition of P/Q-type currents evoked by APWs showed diminished amplitude without shape alteration, as expected from a simple reduction in the number of functional channels. Variable expression of N- and P/Q-type channels at spatially distinct synapses therefore offers the potential for custom regulation of both synaptic efficacy and synchrony, by G-protein inhibition.
Keywords: α1A, α1B, channel modulation, G-proteins, heterologous expression, short-term synaptic plasticity
Voltage-dependent G-protein inhibition of N- and P/Q-type channels is a ubiquitous and potent mechanism for presynaptic inhibition of neurotransmitter release (Lipscombe et al., 1989; Wu and Saggau, 1994; Takahashi et al., 1996;Wu and Saggau, 1997). Such inhibition is believed to result from direct binding of G-protein βγ subunits (Gβγ) to N- and P/Q-type channels (Herlitze et al., 1996; Ikeda, 1996; Zhang et al., 1996; De Waard et al., 1997; Zamponi et al., 1997), which then shifts gating from willing (normal) to reluctant (inhibited) modes of opening (Bean, 1989; Boland and Bean, 1993; Patil et al., 1996).
Whether Gβγ-bound channels remain electrically silent or can open and close with distinctive kinetics (reluctant activity) during action potentials would lead to divergent effects on the waveform of Ca2+ entry (Brody et al., 1997). The waveform would be reduced in amplitude but maintain the same shape in the electrically silent case. By contrast, the waveform could exhibit both diminished amplitude and altered shape in the latter case. These two scenarios could impact the timing and efficacy of synaptic transmission in fundamentally different ways (Bertram et al., 1996;Borst and Sakmann, 1998; Sabatini and Regehr, 1999).
We have recently suggested, based on indirect whole-cell recordings, that N-type, but not P/Q-type channels can open in the reluctant mode (Colecraft et al., 2000). The strength of this suggestion is critically dependent on direct, single-channel resolution of this core contrast in the prevalence of reluctant openings. Presently, however, no single-channel records of P/Q-type channels during G-protein inhibition are available. Moreover, despite several single-channel studies of inhibited N-type channels (Lipscombe et al., 1989; Delcour and Tsien, 1993; Carabelli et al., 1996; Patil et al., 1996; Lee and Elmslie, 2000), there is no clear consensus about the prevalence of reluctant openings. Particularly challenging issues for such single-channel experiments include: (1) the requirement for unambiguous isolation of unitary N-type or P/Q-type channel activity (Lipscombe et al., 1989;Delcour and Tsien, 1993; Elmslie, 1997); (2) additional, voltage-independent inhibitory mechanisms that could produce activity mimicking reluctant gating (Hille, 1992; Luebke and Dunlap, 1994;Carabelli et al., 1996); and (3) the presumed voltage dependence of reluctant openings (Colecraft et al., 2000), which could render the usual voltage range attainable in single-channel studies (Carabelli et al., 1996; Patil et al., 1996) inadequate for resolution of reluctant gating (but see, Lee and Elmslie, 2000).
Here, we report the single-channel mechanisms underlying voltage-dependent G-protein inhibition of recombinant N- and P/Q-type channels, as reconstituted in human embryonic kidney (HEK 293) cells. This system permits unambiguous identification of channel type and reconstitution of a purely voltage-dependent G-protein inhibitory mechanism (Patil et al., 1996; Colecraft et al., 2000). Using quartz pipette technology to enhance resolution of single-channel currents at higher voltages, we provide direct evidence for the occurrence of reluctant openings in N-type channels and their absence in P/Q-type channels. In addition, reluctant openings of N-type channels activated fast enough to alter the shape of Ca2+currents evoked by neuronal action potential waveforms, whereas corresponding P/Q-type currents exhibited no such behavior.
MATERIALS AND METHODS
Transfection of HEK 293 cells. HEK 293 cells were maintained as previously described (Brody et al., 1997) and were transiently transfected using the calcium phosphate precipitation method with 8 μg each of calcium channel subunit cDNAs encoding rat brain α1A (Starr et al., 1991) or human brain α1B (Williams et al., 1992), rat brain β2a (Perez-Reyes et al., 1992), and rat α2δ (Tomlinson et al., 1993), together with 2 μg of m2 muscarinic receptor cDNA (Peralta et al., 1987). The use of the β2a subunit minimized voltage-dependent inactivation (Patil et al., 1998; Colecraft et al., 2000), allowing clear resolution of the slow phase of current activation and prepulse facilitation, during G-protein inhibition.
Electrophysiological recordings. Both whole-cell and single-channel currents were recorded at room temperature, 2–3 d after transfection, using an Axopatch 200A patch-clamp amplifier (Axon Instruments, Foster City, CA). For whole-cell recordings, cells were continuously perfused with a bath solution containing in mm: 150 tetraethylammonium methanesulfonate (TEA-MeSO3), 2 CaCl2, 1 MgCl2, and 10 HEPES, adjusted to pH 7.4 with TEA-OH. Where noted, 50 μm carbachol was added to the bathing medium to activate G-proteins via the cotransfected m2 receptor. The internal solution contained (in mm): 135 cesium methanesulfonate (Cs-MeSO3), 5 CsCl, 10 EGTA, 1 MgCl2, 10 HEPES, and freshly added 4 MgATP, pH 7.3, adjusted with CsOH. Electrodes were fashioned from borosilicate glass capillaries (WPI MTW 150-F4) and had pipette resistances ranging from 1.2 to 2.5 MΩ, before series resistance compensation of 75%. Voltage pulses were applied at 30 sec intervals. Currents were filtered at 5 kHz for action potential (AP) trains, or at 10 kHz for tail current measurements (four-pole Bessel), and digitized at 25 or 50 kHz, respectively. Voltages were corrected for a liquid junction potential of −11 mV before recording, and leak and capacitance transients subtracted by a P/8 protocol. AP voltage templates were based on recordings from the Calyx of Held (Borst et al., 1995), as previously described (Patil et al., 1998).
Single-channel and macropatch currents were obtained in the cell-attached patch-clamp configuration. To zero the membrane potential, the bath contained a solution consisting of (in mm): 132 K-glutamate, 5 KCl, 5 NaCl, 3 MgCl2, 2 EGTA, 10 glucose, and 10 HEPES, pH 7.4, adjusted with KOH. The pipette solution contained 90 mm BaCl2, 20 mm TEA-MeSO3, 50 μmcarbachol (where indicated), and 10 mm HEPES, pH 7.4, adjusted with TEA-OH. Patch pipettes were fashioned from fused quartz capillaries (Garner Glass Company, Claremont, CA) using a laser puller (Sutter Instrument, Novato, CA) and coated with Sylgard. Pipettes typically had resistances ranging from 5 to 20 MΩ when filled with pipette solution. Voltage pulses were applied at a repetition interval of 6 sec; data were sampled at 40 μsec intervals and filtered at 2 kHz (single-channel) or 5 kHz (single-channel and macropatch) in some instances (−3 dB, four-pole bessel). Reported voltages have been corrected for a liquid junction potential of −17 mV. Smooth functions fitted to leak and capacitative transients (P/8 protocol) were subtracted from single-channel records in a semiautomatic manner using custom software written in Matlab (MathWorks, Natick, MA).
Single-channel data analysis. All patches analyzed in this study contained a single active channel. Custom analysis software, written in Matlab, was used throughout. Records were additionally filtered to a 1.8 kHz bandwidth using a digital Gaussian filter and idealized using half-height criteria. Idealized records were used for generation of histograms, ensemble averages, andPoo distributions. Ensemble average currents, first-latency distribution (FL), and conditional open probability (Poo) were calculated as previously described (Imredy and Yue, 1994). Open and shut time histograms were fitted to the indicated number of exponentials using the method of maximum likelihood (Colquhoun and Sigworth, 1995), with the bin size maintained at the sampling interval (40 μsec) throughout. The maximum number of significant exponentials required to best fit each dwell time histogram, was determined by the likelihood ratio test (McManus and Magleby, 1988). The first two or three bins of each open or shut dwell time histogram, respectively, was excluded from the analysis to prevent distortion by events near the dead time.
Statistics. Throughout, pooled data are presented as mean ± SEM. All p values were calculated from two-tailed t-test; p < 0.05 was considered as significant.
RESULTS
Large surface-potential shifts complicate physiological interpretation of single-channel data
To facilitate resolution of single, Ca2+-channel gating events with adequate frequency bandwidth, pipette solutions typically contain ≥90 mm Ba2+ to increase unitary current amplitude. Such high concentrations of divalent cations screen negative surface charges much more effectively than would physiological concentrations of Ca2+ (Frankenhaeuser and Hodgkin, 1957; Krafte and Kass, 1988; Green and Andersen, 1991), resulting in potentially large, but as-yet-undetermined depolarizing voltage shifts in the gating properties observed at the single-channel level. The unspecified magnitude of this voltage shift constituted a particularly critical ambiguity in this study, because earlier macroscopic current experiments (using physiological Ca2+) indirectly hinted that the prevalence of reluctant openings may increase sharply with depolarization (Colecraft et al., 2000). Hence, in testing for reluctant openings at the single-channel level, it was essential to establish the corresponding voltages over which unitary reluctant openings would be expected to occur.
High-level expression of recombinant N-type (α1B β2aα2δ) channels in HEK 293 cells permitted robust determination of the sought after voltage shift, by enabling direct comparison of tail-activation curves obtained in whole cells using 2 mm Ca2+ as charge carrier, with those obtained in cell-attached macropatches using 90 mm Ba2+. Measurements of well resolved tail currents for the two configurations (Fig.1A,B) facilitated construction of corresponding tail-activation curves (Fig. 1C, symbols). Fits of Boltzmann functions with identical slope but differing voltage midpoints (smooth curves) established a large ∼50 mV depolarizing shift of the single-channel (filled circle) compared with whole-cell (open circle) activation curves. A ∼55 mV depolarizing shift of P/Q-type (α1A β2aα2δ) channel-gating properties was established by analogous methods (Fig. 1D). Thus, the physiological voltages corresponding to single-channel experiments could be obtained by subtracting ∼50 mV from the values reported in the figures and in the text.
Fig. 1.
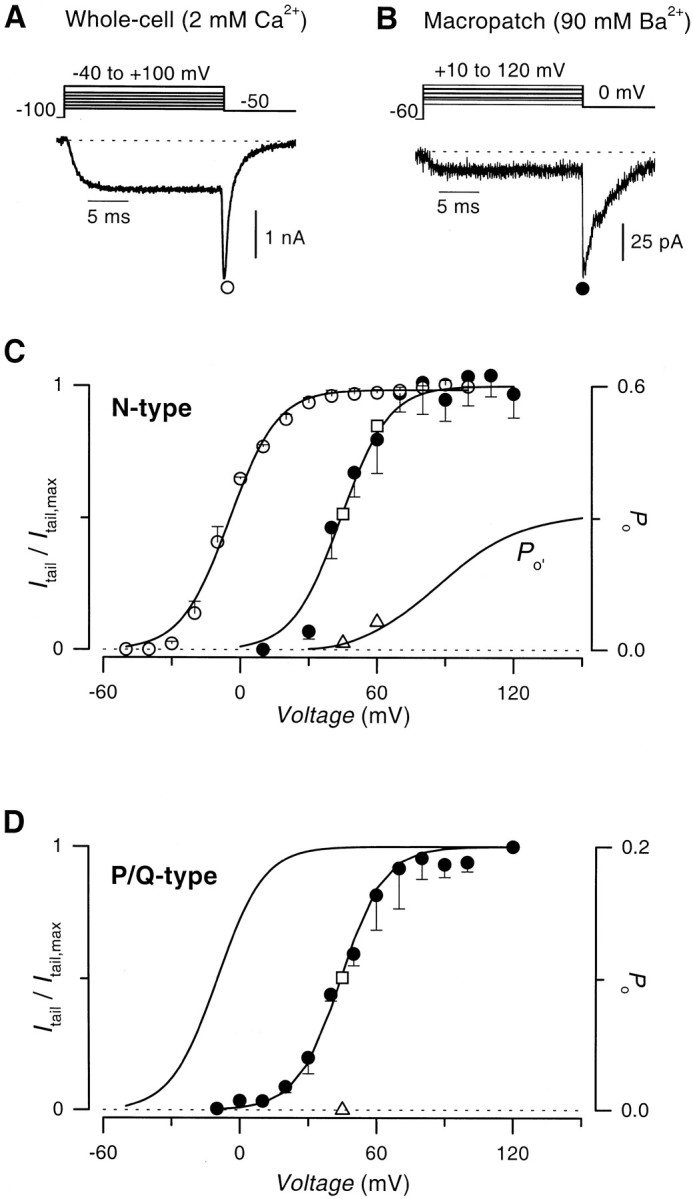
Magnitude of surface potential shift in cell-attached recordings of calcium channel activity, with 90 mm Ba2+ as charge carrier.A,Top, Voltage protocol.Bottom, Exemplar N-type channel whole-cell tail current evoked after a step depolarization to +10 mV, with 2 mmCa2+ as charge carrier. B, Top, Voltage protocol. Bottom, Exemplar N-type channel macropatch tail current obtained in a cell-attached recording, with 90 mm Ba2+ as charge carrier. Displayed tail current was evoked after a step depolarization to +50 mV.C, Comparison of N-type channel whole-cell (open circles) or cell-attached macropatch (filled circles) tail activation (G–V) curves. Smooth curves through the data are least-squares single Boltzmann fits with the following parameters: whole-cell (V1/2, −4.9 mV; slope factor, 9.8), macropatch (V1/2, +44 mV; slope factor, 9.8). In single-channel recordings (with 90 mmBa2+), the Po of the N-type channel was 0.31 at +45 mV and 0.51 at +60 mV (Figs.2B, 4B, respectively, + prepulse). Values (open square) were used to calibrate the macropatchG–V curve in terms of absolutePo of the N-type channel (right axis). The curve representing the reluctant N-type channel open probability, Po′, was obtained as the product of a previous whole-cell estimate ofPo′/Po (corrected for a surface charge shift of +50 mV) (Colecraft et al., 2000) and the absolute Po curve described here. ActualPo′ values measured from single-channel recordings in this study (open triangles) were obtained from the product of the steady-state Poovalues of reluctant gating (Figs. 3H, 4H), and the plateau values of FLafter prepulse, which expressly takes into account blank sweeps (Figs.3C, 4C). This calculation assumes the same fraction of blank sweeps for reluctant and willing channels, as suggested from the convergence of FL curves (Figs.3C, 4C), despite persistence of reluctant gating throughout many sweeps (e.g., Fig. 3A, sweeps2 and 5). D, P/Q-type channel whole-cell and cell-attached macropatch (filled circles) G–V curves constructed as in C, for the N-type channel. The single Boltzmann fit to the whole-cell tail current data are reproduced here (C. D. DeMaria, H. M. Colecraft, and D. T. Yue, unpublished observations). Least-squares fits had the following parameters: whole-cell (V1/2, −9.8 mV; slope factor, 9.4), cell-attached macropatch (V1/2, +44.3 mV; slope factor, 9.4). The measured single-channel Po of the P/Q-channel at +45 mV was 0.1 (Fig. 5), and this value (open square) was used to calibrate the macropatchG–V curve in terms of absolutePo (right axis).Po′ at +45 mV was zero (triangle), as shown in Figure 5.
Single-channel gating properties of uninhibited N-type channels
The surprisingly large surface-potential shift of voltage-dependent gating under single-channel recording conditions challenged us to undertake considerably stronger single-channel depolarizations than previously attempted, to establish gating properties with greater relevance for physiological behavior, and to test appropriately for unitary reluctant openings. Such stronger depolarization would incur substantial drops in electrochemical driving force with resulting diminution of unitary current amplitudes. Nonetheless, stronger depolarization was an absolute requirement here, given that our traditional single-channel experiments (Patil et al., 1996), nominally performed with +20 mV steps, would correspond to physiological depolarizations of only −30 mV, well below the potentials required for either the bulk of activation (Fig. 1C, open circles) or the anticipated occurrence of reluctant openings (Colecraft et al., 2000).
As a prelude to G-protein modulation experiments, Figure2 illustrates good resolution of the baseline characteristics of single, unmodified N-type channels, despite test-pulse depolarization to +45 mV. Quartz pipettes proved invaluable, here and throughout, in reducing noise sufficiently to distinguish elementary events during strong depolarization (Levis and Rae, 1998). Under these control conditions, N-type channels activated quickly after the start of the voltage step and subsequently displayed a dense bursting pattern (Fig. 2A), with millisecond mean open times (Fig. 2E). Ultimately, these features gave rise to fast-activating and maintained ensemble average currents (Fig.2B). As expected for unmodified channels, a large depolarizing prepulse had no appreciable effect on either the gating pattern of single-channel traces or on the amplitude and kinetics of the ensemble average current (Fig. 2A,B). These visual impressions were entirely confirmed by in-depth kinetic analysis of channel gating statistics averaged from multiple patches (Fig.2C–F). The first-latency distribution (FL) (Fig. 2C), which represents activation properties by plotting the probability of first opening before timet in the test pulse, was identical in the presence (black line) or absence (gray line) of a prepulse. Also unaffected by prepulse depolarization was the conditional open probability (Poo) (Fig.2D), which reflects aggregate gating behavior after first opening. Here and throughout,Poo is the channel open probability determined with a delay t after first opening. Together,FL and Poo specify the total gating characteristics of the channel (Imredy and Yue, 1994;Patil et al., 1996), and their invariance therefore demonstrates the lack of effect of a prepulse on the baseline gating of N-type channels. Similarly, traditional open and closed time distributions (Fig.2E,F) were essentially unchanged by a depolarizing prepulse.
Fig. 2.

Baseline single-channel gating characteristics of recombinant N-type channels. A,Top,Voltage protocol. Test pulses without (left) or with (right) a prepulse were interleaved.Bottom, Representative unitary current activity from a patch containing a single N-type channel. Here and throughout, representative records are not consecutive, and dotted lines represent the zero current level, unless otherwise stated. The mean unitary current amplitude was 0.65 ± 0.05 pA (n = 3). B, Ensemble average currents averaged from three patches. Here and throughout, ensemble currents were averaged from all sweeps, including nulls.C,FL distributions obtained either without (gray trace) or with (black trace) a prepulse. D, Conditional open probability distributions, Poo, obtained without (gray trace) or with (black trace) a prepulse. Smooth curve is a least-squares fit of a biexponential function to the no prepulse data. E, Open time distribution histograms of N-type channels obtained either without (left), or with (right) a prepulse. The number of openings with duration more than or equal to the time interval on the x-axis was normalized by the total number of openings estimated from maximum likelihood fits [yielding # events/bin (norm.)], and plotted on log–log coordinates with bin width fixed at 40 μsec throughout. Maximum likelihood fits to the data had the following parameters: −prepulse (τ1= 0.61 msec, 66%; τ2 = 2.2 msec, 34%; 10, 086 total events), +prepulse (τ1 = 0.55 msec, 68%;τ2 = 2.09 msec, 32%; 10, 440 events). F, Closed time distribution histograms constructed in analogous fashion to open time distributions in (E) above. The data were fit by the sum of three exponentials, by the method of maximum likelihood, with the following parameters: −prepulse (τ1 = 0.23 msec, 67%; τ2 = 1.98 msec, 23%;τ3 = 10.7 msec, 10%; 9916 events), +prepulse (τ1 = 0.25 msec, 68%;τ2 = 2.08 msec, 23%;τ3 = 12.9 msec, 9%; 10,221 events). All histograms, here and throughout, were averaged from three patches.
Beyond demonstrating the feasibility of acquiring single-channel data at strongly depolarized test potentials, these results also provided immediate dividends by permitting the first calibration of macroscopic tail-activation curves (Fig. 1) in terms of absolute open probabilitiesPo, a long-sought-after feat with important implications for the physiological performance of presynaptic Ca2+ channels (Borst and Helmchen, 1998). The steady-state Po under single-channel conditions at +45 mV could be determined directly by dividing the unitary current amplitude into the plateau level of ensemble average currents (Figs. 2B, 5B), yielding a Po ∼0.3 or 0.1 for N- and P/Q-type channels, respectively. Plotting these values at the appropriate positions on the tail-activation curves in Figure 1,C and D (open squares), enabled overall calibration of curves in terms of open probability, shown on the right axes.
Fig. 5.

G-protein-inhibited P/Q channels display a delayed latency to first opening, with no evidence of reluctant openings.A–F, Identical format as in Figure 3. A,Mean unitary current amplitude was 0.64 ± 0.04 pA (n = 3). D, Smooth curve through the data are a biexponential fit to Poogenerated from −prepulse traces under control conditions (−CCh).E, Parameters for fits to open time histograms were −prepulse (τ1 = 0.38 msec, 93%;τ2 = 1.05 msec, 7%; 16,078 total events), +prepulse (τ1 = 0.39 msec, 93%; τ2 = 1.12 msec, 7%; 17,503 total events). F, Closed time histogram fit parameters were: −prepulse (τ1 = 0.58 msec, 53%; τ2 = 2.77 msec, 45%;τ3 = 27.58 msec, 2%; 15,802 events); +prepulse (τ1 = 0.59 msec, 54%;τ2 = 2.87 msec, 44%;τ3 = 26.76 msec, 2%; 17,229 events).
Single-channel detection of reluctant N-type channel openings during G-protein inhibition
We next turned to single-channel investigation of N-type channels during G-protein inhibition, using strong depolarizations as might be required to elicit reluctant openings (Fig.3). The protocols and display format were identical to those used in the controls (Fig. 2), except that G-protein activation was produced by the inclusion of saturating 50 μm carbachol (CCh) in the patch pipette to activate coexpressed m2 muscarinic receptors (Patil et al., 1996).
Fig. 3.

With depolarizations to +45 mV, G-protein-inhibited single N-type channels display slowly activating reluctant openings. A–F, Identical format as in Figure2. A, Mean unitary current amplitude was 0.62 ± 0.03 pA (n = 3). B, Ensemble average currents. Smooth gray traces overlaying ensemble average currents were produced by convolving the derivative of the FL with or without a prepulse (C), respectively, and thePoo obtained with a prepulse (Poo, +pre), as explained in Results.D,Poo distribution. Smooth curve through the data are reproduced from Figure2D. E, Open time histograms were fit by the sum of two exponentials with the following parameters: −prepulse (τ1 = 0.47 msec, 67%;τ2 = 1.75 msec, 33%; 7666 total events), and +prepulse (τ1 = 0.51 msec, 68%; τ2 = 1.74 msec, 32%; 13,252 events). F, Fits to closed time histograms had the following parameters; −prepulse (τ1 = 0.29 msec, 67%;τ2 = 2.68 msec, 29%;τ3 = 21.14 msec, 4%; 7494 events), +prepulse (τ1 = 0.28 msec, 69%;τ2 = 2.33 msec, 27%;τ3 = 14.18 msec, 4%; 13,078 events).G, Inhibited (no prepulse) traces were visually sorted into reluctant or willing groups based on whether they started out in a sparse or dense gating pattern. Lifetime distributions for first openings in the reluctant group were fit by a single exponential (τ = 0.22 msec.), whereas the same distribution for the willing group was well fit by the sum of two exponentials with the same parameters as in E (+prepulse), above.H,Poo distributions for visually sorted reluctant and willing sweeps. The steady-statePoo value of reluctant openings at this voltage was 0.02 (dotted line). Smooth linethrough willing Poo was reproduced from Figure 2D.
Strong G-protein modulation was immediately evident in ensemble average currents (Fig. 3B), as the waveform observed without a prepulse was initially small and exhibited a slow phase of activation (“kinetic slowing”; Luebke and Dunlap, 1994). Furthermore, a prepulse transiently removed inhibition, yielding a large initial amplitude and no slowly activating component (“prepulse facilitation”; Elmslie et al., 1990; Boland and Bean, 1993; Patil et al., 1996; Colecraft et al., 2000). Inspection of single-channel records (Fig. 3A) pointed to the underlying basis for these macroscopic hallmarks of G-protein inhibition. Traces corresponding to inhibited channels (Fig. 3A, left column, without prepulse) frequently displayed a considerable delay to first opening after the start of the voltage step (traces 1, 2, 3, and 5), and subsequent gating was usually dominated by brief, submillisecond openings (Fig.3G) interspersed by long closed periods. Within a sweep, this sparse gating mode could persist throughout the test pulse (traces 2 and 5), or convert to a dense-bursting pattern (trace 3) that appeared identical to that seen in unmodulated channels (Fig. 2). This long delay to the onset of dense bursting rationalized the small initial amplitude and subsequent slow-activating phase of ensemble average currents. Single-channel traces after a prepulse (Fig.3A, right column, with prepulse) differed dramatically, usually showing rapid activation to a dense-bursting pattern (traces 1, 2, 4, and 5) that appeared identical to that in unmodulated channels (Fig. 2). The prepulse-induced conversion of single-channel gating behavior toward its unmodulated form provides an explanation for the prepulse facilitation evident in ensemble average currents.
Averages from multiple patches confirmed the features suggested above by exemplar single-channel sweeps. First, the existence of a large fraction of slow-activating sweeps is supported by the slow component of the FL without prepulse (Fig. 3C, gray curve). Such sweeps are virtually absent after a prepulse, as evident from the fast and uniform rise of the correspondingFL curve (black curve), which is closely similar to those in control (Fig. 2C). Second, the persistence of a sparse gating mode in sweeps without prepulse is evident from the maintained deficit of the corresponding conditional open probability (Poo) (Fig. 3D, gray trace), compared with the Poocomputed for sweeps with prepulse (black trace). The virtual absence of sparse gating after prepulse is established by the close similarity of this Poo for sweeps with prepulse (Fig. 3D, black trace) and those for control sweeps (Fig. 3D, fitted curve). Third, the indistinguishability of the dense-burst gating in sweeps with and without prepulse during G-protein modulation, as well as in control patches, is corroborated by the near identity of open and closed time distributions for the various conditions (Figs. 2, 3, panels E and F). Although computed from all events, these distributions are largely identical to those that would be obtained from pure dense-burst gating, because the sparse gating pattern contributes a comparatively negligible number of open and closed events (Fig. 3A, left column). Many of these single-channel characteristics have been previously observed and shown to account for the characteristics of macroscopic current waveforms (Patil et al., 1996), albeit at far less depolarized potentials.
The important new finding came with the sparse gating pattern observed above (Fig. 3A, left column, sweeps 2, 3, 4), which featured openings with properties expected of the reluctant events whose existence we sought to determine. First, sparse gating was only appreciable where G-protein inhibition was expected to favor channel occupancy of the reluctant mode: present in modulated patches when observed without a prepulse, and essentially absent after a prepulse, or in control patches (where little basal modulation is present;Colecraft et al., 2000). Second, fitting with the anticipated voltage-dependent prevalence of reluctant openings (Colecraft et al., 2000), sparse gating was present in G-protein-modulated patches with strong, single-channel depolarization to +45 mV, but absent with weaker depolarization to +20 mV (Patil et al., 1996). Third, when present, sparse gating appeared as the first type of activity in a sweep, before conversion to dense-burst gating. The converse was seldom observed, as would be predicted from the inferred steady-state predominance of willing versus reluctant mode occupancy for these potentials (Colecraft et al., 2000). Finally, the brief openings and long closures of sparse gating were clearly consistent with the anticipated lowerPo of reluctant mode gating (Colecraft et al., 2000). All these reasons argue that the sparse gating activity observed in single-channel records represents direct resolution of gating in the reluctant mode.
Beyond supporting the existence of reluctant gating, the single-channel data could also provide in-depth kinetic information about such gating in isolation, after visual selection for sweeps (without prepulse) that started out in the sparse gating pattern. Lifetime distributions for the first openings of selected sweeps, which should mainly reflect reluctant gating, indicate brief, clearly submillisecond open times (τ = 0.22 msec) (Fig. 3G, reluctant). Likewise, the Poo for selected sweeps, which should mostly reflect reluctant gating for at least tens of milliseconds (Fig. 3D), decays rapidly to a plateau value of ∼0.02 (Fig. 3H, reluctant). This value enables direct calculation of the steady-state open probability in the reluctant mode (Fig. 1C, legend, triangle), providing the first explicit comparison of the steady-state open probabilities of gating in the reluctant versus willing mode. Reassuringly, kinetic analysis for the remainder of sweeps (without prepulse) recapitulated behavior expected of willing mode gating, as represented by the fits in Figure 3,G and H (willing). Such concordance bolstered confidence that our visual sorting of gating patterns was unbiased. Overall, the briefer open times and precipitousPoo decay for reluctant gating could produce altered waveforms of Ca2+ entry during action potential-evoked activity, if reluctant openings could be evoked by such brief stimuli.
Impact of reluctant openings of N-type channels at physiological potentials
Indeed, the remaining challenge for proposals of a physiological contribution of reluctant openings was that they might not activate fast enough to contribute during the brief 1–4 msec duration of neuronal action potentials; the slow phase of the FLdistribution that tallies the first occurrence of such openings (Fig.3C, gray) fits a time constant of 116 msec. However, the +45 mV voltage step used in Figure 3 corresponds to −5 mV in 2 mm Ca2+ (Fig. 1), which is well short of the +30–35 mV amplitude of neuronal action potentials. Given the presumed voltage dependence of the activation of reluctant openings (Boland and Bean, 1993; Jones and Elmslie, 1997;Colecraft et al., 2000), we investigated whether they could activate fast enough at higher voltages, using the strongest single-channel depolarizations that permitted resolution of unitary activity.
Figure 4 summarizes the results of single-channel experiments on inhibited N-type channels, using voltage steps to +60 mV (corresponding to +10 mV in 2 mmCa2+). The protocols and format are otherwise identical to those in Figure 3. Despite the decrease in unitary current amplitudes (≤0.5 pA) caused by the stronger depolarization, single-channel activity was still clearly resolved, including the sparse gating pattern believed to correspond to reluctant gating (Fig. 4A, left column, sweeps 1, 2, 4, and 5). As observed previously with depolarizations to +45 mV (Fig. 3), all of the data and analysis here (Fig. 4) supported the identification of sparse gating as reluctant mode activity, as well as the same elementary basis for G-protein modulation. Two important quantitative differences concerned the increased likelihood of evoking reluctant gating at physiological potentials. First, the steady-state probability of reluctant opening was now increased to ∼0.07 (Fig. 4H, reluctant), consolidating projections favoring an appreciable reluctant open probability near the peak of action potentials (Fig. 1C, triangles). Second, the activation of presumed reluctant openings was markedly accelerated, as evident from exemplar traces (Fig.4A, left) and the near coalescence of slow and rapid phases of the FL distribution (Fig. 4C, gray). At even greater depolarizations approaching action potential peaks, the activation of reluctant openings would be accelerated still further. Whereas single-channel experiments could not be performed explicitly at these higher physiological potentials, because of reduced signal amplitude, extrapolation of the results in Figures 3 and 4 strongly established the likelihood that reluctant N-type channel openings would contribute during neuronal action potentials.
Fig. 4.

Reluctant N-channel openings occur with increased frequency and faster activation kinetics at +60 mV.A–H, Identical format as in Figure 3. A,Mean unitary current amplitude was 0.46 ± 0.01 pA (n = 3). B, Ensemble average currents. Identical format as in Figure 3B.C,FL distributions obtained either without (gray trace) or with (black trace) a prepulse. D, Smooth curve through the data are a least-squares fit of a biexponential function to the +prepulse data.E, Fits to open time histograms had the following parameters: −prepulse (τ1 = 0.41 msec, 72%; τ2 = 2.11 msec, 28%; 7722 total events), +prepulse (τ1 = 0.44 msec, 69%; τ2 = 2.23 msec, 31%; 10,365 total events). F, Fits to closed time histograms had the following parameters: −prepulse (τ1 = 0.23 msec, 73%;τ2 = 1.51 msec, 20%;τ3 = 15.9 msec, 7%; 7601 events), +prepulse (τ1 = 0.23 msec, 76%;τ2 = 1.64 msec, 19%;τ3 = 11.18 msec, 5%; 10,305 events).G, Lifetime distributions for first openings of reluctant sweeps were fit by a single exponential (τ = 0.23 msec), whereas those of willing channels were fit by two exponentials (τ1 = 0.58 msec, 61%;τ2 = 2.28 msec, 39%).H, The steady state reluctantPoo value was 0.07 (dotted line). Smooth curve through the willingPoo was reproduced from the fit inD.
Before considering subsequent experiments that tested directly for such a physiological contribution, we next turned to single-channel experiments that established fundamental differences in the G-protein modulation of P/Q-type channels. This order permitted subsequent, side-by-side assessment of the physiological impact of differences in the behavior of these two channel types.
Absence of reluctant openings in G-protein-inhibited P/Q-type channels
On the basis of previous whole-cell experiments (Colecraft et al., 2000), we have suggested that G-protein inhibition of P/Q-type and N-type channels may differ in two key regards. First, N-type channels exhibit a greater degree of inhibition than P/Q-type channels in a variety of preparations (Bourinet et al., 1996; Zhang et al., 1996;Currie and Fox, 1997; Roche and Treistman, 1998; Colecraft et al., 2000). The second postulated difference, based on indirect inferences from whole-cell data (Colecraft et al., 2000), concerns a more fundamental qualitative difference in that only N-type channels seem to open in the reluctant mode.
To directly investigate these potential differences, we conducted experiments on single P/Q-type channels during G-protein inhibition (Fig. 5), using the identical protocols and format as with N-type channels (Fig. 3). The ensemble average current of P/Q-type channels displayed clear-cut kinetic slowing and prepulse facilitation (Fig. 5B), indicating strong G-protein modulation. Nevertheless, close inspection of ensemble currents indicated that the degree of inhibition of P/Q-type channels was clearly less than that obtained for N-type channels (Fig.3B), demonstrating that the weaker inhibition of macroscopic currents has its basis at the level of individual channels. Single-channel records (Fig. 5A) contrasted sharply from those of N-type channels, in that there was no hint of the sparse gating pattern attributed to reluctant openings (Fig. 5D), despite clear delays in the onset of first opening in sweeps without prepulse (Fig. 5A, traces 1, 2, 4, and 5; also Fig. 5C). Gating subsequent to first opening always followed a dense-burst pattern that was unchanged by prepulse and identical to that in unmodulated controls, as established explicitly by the overlay of Poo for the various conditions (Fig. 5D) and the similarity of duration histograms (Fig.5E,F).
Convolution analysis (Aldrich et al., 1983; Yue et al., 1990) provided a further powerful test that slowing of first openings was the sole mechanism of G-protein inhibition of P/Q-type channels and that a sparse gating mode was absent. If these features held true, then the convolution of the following two entities should predict the ensemble average current waveform without prepulse (Fig. 5B, left): (1) The derivative of the FL without prepulse (dFL/dt-pre), which incorporates the slowing of first latency in sweeps without prepulse. (2) The conditional open probability with prepulse (Poo,+pre), which would faithfully represent gating after first opening in sweeps lacking sparse gating. This prediction was met precisely, as shown by the overlay of the convolution (Fig. 5B, smooth curve) and the data. By contrast, if sparse gating were present in sweeps without prepulse, then the same convolution would overpredict the ensemble average data, because Poo,+pre would overestimate the propensity for being open after the first event, given the greater prevalence of sparse gating. In fact, such a convolution exceeded the ensemble average data for N-type channels (Figs. 3B,4B, left, smooth curve), where sparse gating was in fact prevalent. The convolutions in Figures 3Band 4B (−prepulse) also provide important information regarding the rate of activation of reluctant openings, because they would begin to deviate from the ensemble average current at the onset of such reluctant gating activity. With +45 mV depolarization, the convolution overlaid the early part of the ensemble average current, but began to deviate later on in the pulse (Fig.3B, left) suggestive of slowly activating reluctant gating activity. With +60 mV depolarization, however, the convolution deviated from the ensemble average current very early in the test pulse (Fig.4B, left), consolidating our argument that reluctant openings occur with much faster activation kinetics at this elevated voltage. Reassuringly, in all cases where gating would be almost exclusively of the dense-bursting (willing) pattern, the convolution of dFL/dt+preand Poo,+pre precisely predicted ensemble average currents (Figs. 3B, 4B,5B, with prepulse). These results clearly demonstrated the absence of reluctant openings in P/Q-type channels, at least with +45 mV depolarizations.
Because of the faster gating kinetics of P/Q-type channels, it was not possible to routinely obtain well resolved, single-channel records at +60 mV, as was possible for N-type channel (Fig. 4). However, the following macroscopic current experiments confirmed the relative paucity of reluctant openings of P/Q-type channels at voltages greater than +45 mV.
Physiological impact of the differential occurrence of reluctant openings
To explore the physiological implications of the contrasting prevalence of reluctant openings in N-type and P/Q-type channels, we investigated the effects of G-protein inhibition of whole-cell Ca2+ currents evoked by action potential waveforms. If reluctant openings of N-type channels activate fast enough to occur during neuronal action potentials, their briefer open times and lower open probability suggests that G-protein inhibition would serve to both decrease the amplitude and alter the shape of Ca2+ entry waveforms during physiological stimulation. By contrast, the absence of reluctant openings in P/Q-type channels predicts that G-protein modulation would simply reduce the number of functional channels, resulting in decreased amplitude of the Ca2+ entry waveform without shape alteration.
Direct tests of these predictions are summarized in Figure6. Whole-cell Ca2+ currents were elicited by action potential waveforms modeled after those recorded in the calyx of Held (Borst et al., 1995), which in this case spanned a variety of widths at half-maximal amplitude (Fig. 6A). Corresponding N-type and P/Q-type currents are shown below (Fig.6B,C, respectively). Under control conditions (−CCh, black traces), N-type channels had broader waveforms of Ca2+ entry than did P/Q-type channels, consistent with the generally slower kinetics observed above in the single-channel experiments. Activation of G-proteins with 50 μm CCh (+CCh, dotted traces) markedly decreased the amplitude of Ca2+current carried by either channel type, although the anticipated stronger inhibition of N-type channels was clearly apparent.
Fig. 6.

Functional impact of reluctant openings on Ca2+ currents evoked by neuronal APWs.A, APWs of different half-width amplitudes (1.5, 2, and 2.5 msec) used to elicit Ca2+ currents.B, Exemplar N-type currents elicited by the indicated APWs either under control conditions (−CCh, black traces) or during G-protein inhibition (+CCh, dotted traces). G-protein-inhibited traces were scaled up (gray traces) to match their peaks with −CCh currents, to facilitate direct visual comparison of differences in time course. The difference in time for currents to reach 90% of maximal amplitude (Δt90) in the presence or absence of CCh was measured (arrows).Δt90 was significantly different in currents evoked by APWs of half-width 2 and 2.5 msec, respectively (*p < 0.05, paired two-tailedt test). C, Exemplar P/Q currents evoked under identical conditions as in B. Scaled-up +CCh traces (thick gray traces) precisely superimposed on the −CCh traces.
To test for effects on the shape of Ca2+entry waveforms, we scaled up +CCh traces (gray traces) to match peak amplitudes with those of −CCh currents. For N-type channels, the amplified +CCh traces were clearly advanced in time from control traces, as confirmed by nonzero population averages for Δt90 shown in Figure6B (bottom). Given that Ca2+ entry elicited here by action potential waveforms is largely akin to a tail current, such temporal advance of +CCh waveforms would be predicted from the faster deactivation kinetics of reluctant versus willing channels (Elmslie et al., 1990; Boland and Bean, 1993; Colecraft et al., 2000). Indeed, as more reluctant channels activate with prolongation of action potential waveforms (Fig. 6A), the extent of temporal advance would be expected to increase as the fraction of tail current carried by reluctant channels accrues, an effect that we observed experimentally (Fig. 6B). This same mechanism explains the overall temporal advance of Ca2+-entry waveforms for P/Q-type versus N-type channels (Fig. 6, compare B, C), as deactivation kinetics of P/Q-type channels are considerably faster than those for N-type channels (Colecraft et al., 2000). For P/Q-type channels, analogous amplification of +CCh traces (Fig. 6C) indicated precise conservation of waveform shape with inhibition. This result is consistent with the absence of reluctant gating in P/Q-type channels, at least during the 2–5 msec time span of the applied action potential waveforms. These distinctions in regard to the temporal advance or invariance of the shape of Ca2+-entry waveforms could enrich the dimensions of synaptic modulation during G-protein inhibition, as will be discussed.
DISCUSSION
This study provides the first single-channel comparison of N- and P/Q-type calcium channels during G-protein inhibition. Single, inhibited N-type channels exhibited a sparse pattern of opening, which likely represents direct resolution of gating in the reluctant mode with Gβγ subunit(s) bound to the channel. By contrast, inhibited P/Q-type channels were electrically silent, presumably reflecting an inability of these channels to open while complexed with Gβγ. These striking contrasts in single-channel properties were shown to produce fundamental differences in the effect of G-protein inhibition on the waveform of Ca2+ entry elicited by physiological action potential waveforms. Our findings help to clarify divergent viewpoints of previous studies of reluctant gating and raise new possibilities regarding both the molecular basis of G-protein inhibition, as well as the dimensions of synaptic modulation that ensue from such channel inhibition.
Previous studies of reluctant gating
Several whole-cell studies have provided indirect evidence that N-type channels can open in the reluctant mode during G-protein inhibition (Elmslie et al., 1990; Boland and Bean, 1993; Jones and Elmslie, 1997; Colecraft et al., 2000). In contrast to the consensus at the whole-cell level, direct single-channel resolution of reluctant gating of N-type channels has been elusive. Early studies may have been challenged by improper isolation of single N-type channels (Delcour and Tsien, 1993; Elmslie, 1997). A subsequent study of inhibited N-type channels in IMR32 cells (Carabelli et al., 1996) reported a sparser form of gating after first opening, suggestive of reluctant gating. However, the presence of both voltage-dependent and voltage-independent forms of G-protein inhibition in this preparation (Carabelli et al., 1996) made it difficult to unambiguously associate such sparse gating with reluctant openings, because the voltage-independent mechanism might itself produce such effects. Our contemporaneous single-channel study (Patil et al., 1996), using recombinant N-type channels expressed in HEK 293 cells, offered the advantage that only voltage-dependent G-protein inhibition is present in this system (Patil et al., 1996; Colecraft et al., 2000). In this setting in which a sparser pattern of gating could be directly attributed to reluctant gating, inhibited N-type channels were electrically silent. However, the challenge of resolving small unitary events at strong depolarizations limited this study to voltages that might be too hyperpolarized to elicit reluctant gating, according to inferences drawn from whole-cell analyses (Jones and Elmslie, 1997; Colecraft et al., 2000) (see also Fig. 1B). Subsequent results confirm this scenario. In frog sympathetic neurons, Lee and Elmslie (2000) observed reluctant gating of single N-type channels, with quantitative resolution of unitary events at depolarizations as high as +40 mV (approximately −10 mV at physiological Ca2+). However, the slow activation of such reluctant openings made it difficult to argue that they would contribute to physiological responses. Here, using quartz pipettes to enhance resolution of unitary currents at even higher voltages with near doubling of bandwidth, we find not only that single N-type channels support reluctant openings (Fig. 3), but that such openings have rapid activation at voltages approaching the peak of action potentials (Fig. 4). Our experiments with action potential waveforms (Fig. 6) explicitly confirm the impact of reluctant gating during physiological stimuli.
Moreover, our current study provides the first report of single P/Q-type channel gating during G-protein inhibition. Our results directly establish the absence of reluctant gating in P/Q-type channels, irrespective of voltages spanning the entire physiological range. An important caveat here is that we might not be able to detect reluctant P/Q-type channel openings should they occur much too slowly to impact currents evoked by action potential waveforms. Such a scenario, however, would be inconsistent with our previous whole-cell data (Colecraft et al., 2000).
Features of channel structure underlying differing prevalence of reluctant gating
Much research has sought to determine the structural determinants of G-protein inhibition of neuronal calcium channels, using channel mutations and chimeras to identify critical regions on the corresponding pore-forming α1 subunits. To some extent, the overall mechanism and structural basis for G-protein inhibition has been considered to be largely conserved across the neuronal channels that are subject to G-protein modulation (N-type (α1B), P/Q-type (α1A), and R-type (α1E)). In this view, structure–function studies focused on different members of this group of channels, have collectively identified at least three regions of the α1 backbone that may be essential for G-protein inhibition, namely: (1) the N terminus (Zhang et al., 1996; Page et al., 1998; Simen and Miller, 1998; Canti et al., 1999); (2) the cytoplasmic linker between domains I and II (De Waard et al., 1997;Herlitze et al., 1997; Zamponi et al., 1997; Furukawa et al., 1998a,b); and (3) the C terminus (Zhang et al., 1996; Qin et al., 1997; Furukawa et al., 1998a,b).
Whether these regions all contribute similarly to G-protein inhibition across neuronal channel types seems less certain, given our finding that N-type, but not P/Q-type channels can open in the reluctant mode. Within the context of the willing-reluctant model of channel inhibition (Elmslie et al., 1990; Boland and Bean, 1993; Patil et al., 1996), this finding implies that Gβγ-bound N-type channels can open, whereas P/Q-type channels remain entirely closed while complexed with Gβγ. This striking contrast in molecular properties gives reason to wonder whether channel-specific differences in one, or more of the three regions can account for the very different allosteric coupling between Gβγ binding and channel opening.
Physiological implications of reluctant openings
The differential occurrence of reluctant openings in N-type versus P/Q-type channels raises rich possibilities for the dimensions of synaptic modulation produced by G-protein inhibition, especially because the involvement of these two channel types differs at spatially distinct synapses (Luebke et al., 1993; Takahashi and Momiyama, 1993;Wheeler et al., 1994; Takahashi et al., 1996; Poncer et al., 1997; Reid et al., 1998).
Our results suggest that at synapses where P/Q-type channels trigger release, presynaptic channel inhibition by G-proteins is attributable solely to delayed activation kinetics of inhibited channels (Fig. 5), effectively silencing them for the brief duration of neuronal action potentials. Hence, G-protein inhibition would reduce the amplitude of the waveform of Ca2+entry during action potentials but preserve waveform shape (Fig.6C). In this case, synaptic efficacy would be reduced, but the timing and precision of neurotransmission (Sabatini and Regehr, 1999) would be preserved.
At synapses dominated by N-type channels, the effects of G-protein inhibition on synaptic communication could be considerably different. Here, the slower activation of inhibited channels would also cause many of them to remain closed throughout a given action potential, but a significant fraction of inhibited channels would contribute reluctant openings during a neuronal spike. Accordingly, whereas the silencing of inhibited channels would diminish the overall amplitude of Ca2+ entry, the faster deactivation kinetics pertaining to reluctant openings (Colecraft et al., 2000) would result in temporal advancement of the Ca2+-entry waveform during an action potential (Fig. 6B). Such temporal acceleration of Ca2+ entry holds intriguing ramifications for synaptic modulation, because the changes in presynaptic Ca2+ entry could be tightly linked to analogous alterations in the waveform of postsynaptic responses (Sabatini and Regehr, 1997; Borst and Sakmann, 1999). A close linkage might be expected, given that the presynaptic release probability (RP) can be the rate-limiting function for specifying the EPSC waveform at cerebellar synapses (Chen and Regehr, 1999; Sabatini and Regehr, 1999), and the time course of RP may be largely shaped by the waveform of presynaptic Ca2+ entry (Sabatini and Regehr, 1996; Bollman et al., 2000) (W. Regehr, personal communication) (J. G. G. Borst, personal communication). In the case of such linkage, G-protein inhibition at synapses dominated by N-type channels would not only decrease synaptic efficacy, but also shorten delays between presynaptic and postsynaptic responses. The latter effect would impact the timing and coincidence detection properties of such synapses (Sabatini and Regehr, 1999).
Another potential effect of reluctant openings is to modulate the coupling efficiency of open N-type channels to release sites. The effect can be understood by considering that individual channels support a “calcium microdomain” surrounding the cytoplasmic mouth of the channel pore. At many synapses, the overlap of several domains with a single release site enables multiple channels to trigger the cognate release site (Mintz et al., 1995; Borst and Sakmann, 1998); at others, only one domain overlaps with a given release site (Augustine et al., 1991; Stanley, 1993; Bertram et al., 1996). Because the size of such microdomains is determined by both the unitary current flux and the duration of typical openings (Bertram et al., 1996; Neher, 1998), N-type channels supporting briefer reluctant openings should have smaller microdomains than those exhibiting willing openings. It is quite plausible, then, that an N-type channel manifesting willing openings would be coupled to a given release site, although the same channel would become uncoupled when opening reluctantly. Hence, G-protein inhibition could shift synapses toward regimes where a smaller proportion of active channels are coupled to release sites. This effect would deepen the presynaptic inhibition produced by a specified decrease in N-type Ca2+ current, over that which would be produced if N-type channels were incapable of reluctant gating. The deeper inhibition would occur because Ca2+ entering through formerly coupled channels would be “wasted” in terms of transmitter release. By contrast, the proportion of open P/Q-type channels coupled to release sites should remain invariant with G-protein inhibition.
Overall, these distinctions in G-protein inhibition of N- and P/Q-type channels contribute to the growing awareness that differences in the operational features of seemingly similar neuronal calcium channels, and their splice variants, may provide an important basis for custom regulation of synaptic function.
Footnotes
This work was supported by grants from the National Institutes of Health (D.T.Y.) and a National Institutes of Health Medical Scientist Training Program Award (D.L.B.). We thank SIBIA Neurosciences for the human α1B-1 clone, T. P. Snutch for the α1A-a and α2δ clones, E. Perez-Reyes for the β2a clone, Ernst Peralta for the m2 clone, and Devi Rathod and Rebecca Alvania for technical assistance.
Correspondence should be addressed to David T. Yue, Program in Molecular and Cellular Systems Physiology, Departments of Biomedical Engineering and Neuroscience, Johns Hopkins University School of Medicine, Ross Building, Room 713, 720 Rutland Avenue, Baltimore, MD 21205. E-mail: dyue@bme.jhu.edu.
REFERENCES
- 1.Aldrich RW, Corey DP, Stevens CF. A reinterpretation of mammalian sodium channel gating based on single channel recording. Nature. 1983;306:436–441. doi: 10.1038/306436a0. [DOI] [PubMed] [Google Scholar]
- 2.Augustine GJ, Adler EM, Charlton MP. The calcium signal for transmitter secretion from presynaptic nerve terminals. Ann NY Acad Sci. 1991;635:365–381. doi: 10.1111/j.1749-6632.1991.tb36505.x. [DOI] [PubMed] [Google Scholar]
- 3.Bean BP. Neurotransmitter inhibition of neuronal calcium currents by changes in channel voltage dependence. Nature. 1989;340:153–156. doi: 10.1038/340153a0. [DOI] [PubMed] [Google Scholar]
- 4.Bertram R, Sherman A, Stanley EF. Single-domain/bound calcium hypothesis of transmitter release and facilitation. J Neurophysiol. 1996;75:1919–1931. doi: 10.1152/jn.1996.75.5.1919. [DOI] [PubMed] [Google Scholar]
- 5.Boland LM, Bean BP. Modulation of N-type calcium channels in bullfrog sympathetic neurons by luteinizing hormone-releasing hormone: kinetics and voltage dependence. J Neurosci. 1993;13:516–533. doi: 10.1523/JNEUROSCI.13-02-00516.1993. [DOI] [PMC free article] [PubMed] [Google Scholar]
- 6.Bollmann JH, Sakmann B, Borst JGG. Calcium sensitivity of glutamate release in a calyx-type terminal. Science. 2000;289:953–957. doi: 10.1126/science.289.5481.953. [DOI] [PubMed] [Google Scholar]
- 7.Borst JG, Helmchen F. Calcium influx during an action potential. Methods Enzymol. 1998;293:352–371. doi: 10.1016/s0076-6879(98)93023-3. [DOI] [PubMed] [Google Scholar]
- 8.Borst JG, Sakmann B. Calcium current during a single action potential in a large presynaptic terminal of the rat brainstem. J Physiol (Lond) 1998;506:143–157. doi: 10.1111/j.1469-7793.1998.143bx.x. [DOI] [PMC free article] [PubMed] [Google Scholar]
- 9.Borst JG, Sakmann B. Effect of changes in action potential shape on calcium currents and transmitter release in a calyx-type synapse of the rat auditory brainstem. Philos Trans R Soc Lond B Biol Sci. 1999;354:347–355. doi: 10.1098/rstb.1999.0386. [DOI] [PMC free article] [PubMed] [Google Scholar]
- 10.Borst JGG, Helmchen F, Sakmann B. Pre- and postsynaptic whole-cell recordings in the medial nucleus of the trapezoid body of the rat. J Physiol (Lond) 1995;489:825–840. doi: 10.1113/jphysiol.1995.sp021095. [DOI] [PMC free article] [PubMed] [Google Scholar]
- 11.Bourinet E, Soong TW, Stea A, Snutch TP. Determinants of the G-protein-dependent opioid modulation of neuronal calcium channels. Proc Natl Acad Sci USA. 1996;93:1486–1491. doi: 10.1073/pnas.93.4.1486. [DOI] [PMC free article] [PubMed] [Google Scholar]
- 12.Brody DL, Patil PG, Mulle JG, Snutch TP, Yue DT. Bursts of action potential waveforms relieve G-protein inhibition of recombinant P/Q-type Ca2+ channels in HEK 293 cells. J Physiol (Lond) 1997;499:637–644. doi: 10.1113/jphysiol.1997.sp021956. [DOI] [PMC free article] [PubMed] [Google Scholar]
- 13.Canti C, Page KM, Stephens GJ, Dolphin AC. Identification of residues in the N terminus of α1B critical for inhibition of the voltage-dependent calcium channel by Gβγ. J Neurosci. 1999;19:6855–6864. doi: 10.1523/JNEUROSCI.19-16-06855.1999. [DOI] [PMC free article] [PubMed] [Google Scholar]
- 14.Carabelli V, Lovallo M, Magnelli V, Zucker H, Carbone E. Voltage-dependent modulation of single N-Type Ca2+ channel kinetics by receptor agonists in IMR32 cells. Biophys J. 1996;70:2144–2154. doi: 10.1016/S0006-3495(96)79780-1. [DOI] [PMC free article] [PubMed] [Google Scholar]
- 15.Chen C, Regehr WG. Contributions of residual calcium to fast synaptic transmission. J Neurosci. 1999;19:6257–6266. doi: 10.1523/JNEUROSCI.19-15-06257.1999. [DOI] [PMC free article] [PubMed] [Google Scholar]
- 16.Colecraft HM, Patil PG, Yue DT. Differential occurrence of reluctant openings in G-protein-inhibited N- and P/Q-type calcium channels. J Gen Physiol. 2000;115:175–192. doi: 10.1085/jgp.115.2.175. [DOI] [PMC free article] [PubMed] [Google Scholar]
- 17.Colquhoun D, Sigworth FJ. Fitting and statistical analysis of single-channel records. In: Sakmann B, Neher E, editors. Single-channel recording. Plenum; New York: 1995. pp. 483–587. [Google Scholar]
- 18.Currie KP, Fox AP. Comparison of N- and P/Q-type voltage-gated calcium channel current inhibition. J Neurosci. 1997;17:4570–4579. doi: 10.1523/JNEUROSCI.17-12-04570.1997. [DOI] [PMC free article] [PubMed] [Google Scholar]
- 19.De Waard M, Liu H, Walker D, Scott VE, Gurnett CA, Campbell KP. Direct binding of G-protein βγ complex to voltage-dependent calcium channels. Nature. 1997;385:446–450. doi: 10.1038/385446a0. [DOI] [PubMed] [Google Scholar]
- 20.Delcour A, Tsien R. Altered prevalence of gating modes in neurotransmitter inhibition of N-type calcium channels. Science. 1993;259:980–984. doi: 10.1126/science.8094902. [DOI] [PubMed] [Google Scholar]
- 21.Elmslie KS. Identification of the single channels that underlie the N-type and L-type calcium currents in bullfrog sympathetic neurons. J Neurosci. 1997;17:2658–2668. doi: 10.1523/JNEUROSCI.17-08-02658.1997. [DOI] [PMC free article] [PubMed] [Google Scholar]
- 22.Elmslie KS, Zhou W, Jones SW. LHRH and GTP-γ-S modify calcium current activation in bullfrog sympathetic neurons. Neuron. 1990;5:75–80. doi: 10.1016/0896-6273(90)90035-e. [DOI] [PubMed] [Google Scholar]
- 23.Frankenhaeuser B, Hodgkin AL. The action of calcium on the electrical properties of squid axons. J Physiol (Lond) 1957;137:218–244. doi: 10.1113/jphysiol.1957.sp005808. [DOI] [PMC free article] [PubMed] [Google Scholar]
- 24.Furukawa T, Miura R, Mori Y, Strobeck M, Suzuki K, Ogihara Y, Asano T, Morishita R, Hashii M, Higashida H, Yoshii M, Nukada T. Differential interactions of the C-terminus and the cytoplasmic I-II loop of neuronal calcium channels with G-protein α and βγ subunits: II. Evidence for direct binding. J Biol Chem. 1998a;273:17595–17603. doi: 10.1074/jbc.273.28.17595. [DOI] [PubMed] [Google Scholar]
- 25.Furukawa T, Nukada T, Mori Y, Wakamori M, Fujuita Y, Ishida H, Fukuda K, Kato S, Yoshii M. Differential interactions of the C-terminus and the cytoplasmic I-II loop of neuronal calcium channels with G-protein α and βγ subunits: I. Molecular determination. J Biol Chem. 1998b;273:17585–17594. doi: 10.1074/jbc.273.28.17585. [DOI] [PubMed] [Google Scholar]
- 26.Green WN, Andersen OS. Surface charges and ion channel function. Annu Rev Physiol. 1991;53:341–359. doi: 10.1146/annurev.ph.53.030191.002013. [DOI] [PubMed] [Google Scholar]
- 27.Herlitze S, Garcia DE, Mackie K, Hille B, Catterall WA. Modulation of Ca2+ channels by G-protein βγ subunits. Nature. 1996;380:258–262. doi: 10.1038/380258a0. [DOI] [PubMed] [Google Scholar]
- 28.Herlitze S, Hockerman GH, Scheuer T, Catterall WA. Molecular determinants of inactivation and G-protein modulation in the intracellular loop connecting domains I and II of the calcium channel α1A subunit. Proc Natl Acad Sci USA. 1997;94:1512–1516. doi: 10.1073/pnas.94.4.1512. [DOI] [PMC free article] [PubMed] [Google Scholar]
- 29.Hille B. G-protein-coupled mechanisms and nervous signaling. Neuron. 1992;9:187–195. doi: 10.1016/0896-6273(92)90158-a. [DOI] [PubMed] [Google Scholar]
- 30.Ikeda SR. Voltage-dependent modulation of N-type calcium channels by G-protein βγ subunits. Nature. 1996;380:255–258. doi: 10.1038/380255a0. [DOI] [PubMed] [Google Scholar]
- 31.Imredy JP, Yue DT. Mechanism of Ca2+-sensitive inactivation of L-type Ca2+ channels. Neuron. 1994;12:1301–1318. doi: 10.1016/0896-6273(94)90446-4. [DOI] [PubMed] [Google Scholar]
- 32.Jones SW, Elmslie KS. Transmitter modulation of neuronal calcium channels. J Membr Biol. 1997;155:1–10. doi: 10.1007/s002329900153. [DOI] [PubMed] [Google Scholar]
- 33.Krafte DS, Kass RS. Hydrogen ion modulation of Ca channel current in cardiac ventricular cells. Evidence for multiple mechanisms. J Gen Physiol. 1988;91:641–657. doi: 10.1085/jgp.91.5.641. [DOI] [PMC free article] [PubMed] [Google Scholar]
- 34.Lee HK, Elmslie KS. Reluctant gating of single N-type calcium channels during neurotransmitter-induced inhibition in bullfrog sympathetic neurons. J Neurosci. 2000;20:3115–3128. doi: 10.1523/JNEUROSCI.20-09-03115.2000. [DOI] [PMC free article] [PubMed] [Google Scholar]
- 35.Levis RA, Rae JL. Low-noise patch-clamp techniques. Methods Enzymol. 1998;293:218–266. doi: 10.1016/s0076-6879(98)93017-8. [DOI] [PubMed] [Google Scholar]
- 36.Lipscombe D, Kongsamut S, Tsien R. α-adrenergic inhibition of sympathetic neurotransmitter release mediated by modulation of N-type calcium-channel gating. Nature. 1989;340:639–642. doi: 10.1038/340639a0. [DOI] [PubMed] [Google Scholar]
- 37.Luebke JI, Dunlap K. Sensory neuron N-type calcium currents are inhibited by both voltage-dependent and -independent mechanisms. Pflügers Arch. 1994;428:499–507. doi: 10.1007/BF00374571. [DOI] [PubMed] [Google Scholar]
- 38.Luebke JI, Dunlap K, Turner T. Multiple calcium channel types control glutamatergic synaptic transmission in the hippocampus. Neuron. 1993;11:895–902. doi: 10.1016/0896-6273(93)90119-c. [DOI] [PubMed] [Google Scholar]
- 39.McManus OB, Magleby KL. Kinetic states and modes of single large-conductance calcium-activated potassium channels in cultured rat skeletal muscle. J Physiol (Lond) 1988;402:79–120. doi: 10.1113/jphysiol.1988.sp017195. [DOI] [PMC free article] [PubMed] [Google Scholar]
- 40.Mintz IM, Sabatini BL, Regehr WG. Calcium control of transmitter release at a cerebellar synapse. Neuron. 1995;15:675–688. doi: 10.1016/0896-6273(95)90155-8. [DOI] [PubMed] [Google Scholar]
- 41.Neher E. Vesicle pools and Ca2+ microdomains: new tools for understanding their roles in neurotransmitter release. Neuron. 1998;20:389–399. doi: 10.1016/s0896-6273(00)80983-6. [DOI] [PubMed] [Google Scholar]
- 42.Page KM, Canti C, Stephens GJ, Berrow NS, Dolphin AC. Identification of the amino terminus of neuronal Ca2+ channel α1 subunits α1B and α1E as an essential determinant of G-protein modulation. J Neurosci. 1998;18:4815–4824. doi: 10.1523/JNEUROSCI.18-13-04815.1998. [DOI] [PMC free article] [PubMed] [Google Scholar]
- 43.Patil PG, de Leon M, Reed RR, Dubel S, Snutch TP, Yue DT. Elementary events underlying voltage-dependent G-protein inhibition of N-type calcium channels. Biophys J. 1996;71:2509–2521. doi: 10.1016/S0006-3495(96)79444-4. [DOI] [PMC free article] [PubMed] [Google Scholar]
- 44.Patil PG, Brody DL, Yue DT. Preferential closed-state inactivation of neuronal calcium channels. Neuron. 1998;20:1027–1038. doi: 10.1016/s0896-6273(00)80483-3. [DOI] [PubMed] [Google Scholar]
- 45.Peralta EG, Ashkenazi A, Winslow JW, Smith DH, Ramachandran J, Capon DJ. Distinct primary structures, ligand-binding properties and tissue-specific expression of four human muscarinic acetylcholine receptors. EMBO J. 1987;6:3923–3929. doi: 10.1002/j.1460-2075.1987.tb02733.x. [DOI] [PMC free article] [PubMed] [Google Scholar]
- 46.Perez-Reyes E, Castellano A, Kim HS, Bertrand P, Baggstrom E, Lacerda AE, Wei XY, Birnbaumer L. Cloning and expression of a cardiac/brain beta subunit of the L- type calcium channel. J Biol Chem. 1992;267:1792–1797. [PubMed] [Google Scholar]
- 47.Poncer JC, McKinney RA, Gahwiler BH, Thompson SM. Either N- or P-type calcium channels mediate GABA release at distinct hippocampal inhibitory synapses. Neuron. 1997;18:463–472. doi: 10.1016/s0896-6273(00)81246-5. [DOI] [PubMed] [Google Scholar]
- 48.Qin N, Platano D, Olcese R, Stefani E, Birnbaumer L. Direct interaction of Gβγ with a C-terminal Gβγ-binding domain of the Ca2+ channel α1 subunit is responsible for channel inhibition by G-protein-coupled receptors. Proc Natl Acad Sci USA. 1997;94:8866–8871. doi: 10.1073/pnas.94.16.8866. [DOI] [PMC free article] [PubMed] [Google Scholar]
- 49.Reid CA, Bekkers JM, Clements JD. N- and P/Q-type Ca2+ channels mediate transmitter release with a similar cooperativity at rat hippocampal autapses. J Neurosci. 1998;18:2849–2855. doi: 10.1523/JNEUROSCI.18-08-02849.1998. [DOI] [PMC free article] [PubMed] [Google Scholar]
- 50.Roche JP, Treistman SN. The Ca2+ channel β3 subunit differentially modulates G-protein sensitivity of α1A and α1B Ca2+ channels. J Neurosci. 1998;18:878–886. doi: 10.1523/JNEUROSCI.18-03-00878.1998. [DOI] [PMC free article] [PubMed] [Google Scholar]
- 51.Sabatini BL, Regehr WG. Timing of neurotransmission at fast synapses in the mammalian brain. Nature. 1996;384:170–172. doi: 10.1038/384170a0. [DOI] [PubMed] [Google Scholar]
- 52.Sabatini BL, Regehr WG. Control of neurotransmitter release by presynaptic waveform at the granule cell to Purkinje cell synapse. J Neurosci. 1997;17:3425–3435. doi: 10.1523/JNEUROSCI.17-10-03425.1997. [DOI] [PMC free article] [PubMed] [Google Scholar]
- 53.Sabatini BL, Regehr WG. Timing of synaptic transmission. Annu Rev Physiol. 1999;61:521–542. doi: 10.1146/annurev.physiol.61.1.521. [DOI] [PubMed] [Google Scholar]
- 54.Simen AA, Miller RJ. Structural features determining differential receptor regulation of neuronal Ca channels. J Neurosci. 1998;18:3689–3698. doi: 10.1523/JNEUROSCI.18-10-03689.1998. [DOI] [PMC free article] [PubMed] [Google Scholar]
- 55.Stanley EF. Single calcium channels and acetylcholine release at a presynaptic nerve terminal. Neuron. 1993;11:1007–1011. doi: 10.1016/0896-6273(93)90214-c. [DOI] [PubMed] [Google Scholar]
- 56.Starr TV, Prystay W, Snutch TP. Primary structure of a calcium channel that is highly expressed in the rat cerebellum. Proc Natl Acad Sci USA. 1991;88:5621–5625. doi: 10.1073/pnas.88.13.5621. [DOI] [PMC free article] [PubMed] [Google Scholar]
- 57.Takahashi T, Momiyama A. Different types of calcium channels mediate central synaptic transmission. Nature. 1993;366:156–158. doi: 10.1038/366156a0. [DOI] [PubMed] [Google Scholar]
- 58.Takahashi T, Forsythe ID, Tsujimoto T, Barnes-Davies M, Onodera K. Presynaptic calcium current modulation by a metabotropic glutamate receptor. Science. 1996;274:594–597. doi: 10.1126/science.274.5287.594. [DOI] [PubMed] [Google Scholar]
- 59.Tomlinson WJ, Stea A, Bourinet E, Charnet P, Nargeot J, Snutch TP. Functional properties of a neuronal class C L-type calcium channel. Neuropharmacology. 1993;32:1117–1126. doi: 10.1016/0028-3908(93)90006-o. [DOI] [PubMed] [Google Scholar]
- 60.Wheeler DB, Randall A, Tsien RW. Roles of N-type and Q-type Ca2+ channels in supporting hippocampal synaptic transmission. Science. 1994;264:107–111. doi: 10.1126/science.7832825. [DOI] [PubMed] [Google Scholar]
- 61.Williams ME, Brust PF, Feldman DH, Patthi S, Simerson S, Maroufi A, McCue AF, Velicelebi G, Ellis SB, Harpold MM. Structure and functional expression of an ω-conotoxin- sensitive human N-type calcium channel. Science. 1992;257:389–395. doi: 10.1126/science.1321501. [DOI] [PubMed] [Google Scholar]
- 62.Wu LG, Saggau P. Adenosine inhibits evoked synaptic transmission primarily by reducing presynaptic calcium influx in area CA1 of hippocampus. Neuron. 1994;12:1139–1148. doi: 10.1016/0896-6273(94)90321-2. [DOI] [PubMed] [Google Scholar]
- 63.Wu LG, Saggau P. Presynaptic inhibition of elicited neurotransmitter release. Trends Neurosci. 1997;20:204–212. doi: 10.1016/s0166-2236(96)01015-6. [DOI] [PubMed] [Google Scholar]
- 64.Yue DT, Backx PH, Imredy JP. Calcium-sensitive inactivation in the gating of single calcium channels. Science. 1990;250:1735–1738. doi: 10.1126/science.2176745. [DOI] [PubMed] [Google Scholar]
- 65.Zamponi GW, Bourinet E, Nelson D, Nargeot J, Snutch TP. Crosstalk between G-proteins and protein kinase C mediated by the calcium channel α1 subunit. Nature. 1997;385:442–446. doi: 10.1038/385442a0. [DOI] [PubMed] [Google Scholar]
- 66.Zhang J-F, Ellinor PT, Aldrich RW, Tsien RW. Multiple structural elements in voltage-dependent Ca2+ channels support their inhibition by G-proteins. Neuron. 1996;17:991–1003. doi: 10.1016/s0896-6273(00)80229-9. [DOI] [PubMed] [Google Scholar]