

Abstract
Spontaneous episodic activity occurs throughout the developing nervous system because immature circuits are hyperexcitable. It is not fully understood how the temporal pattern of this activity is regulated. Here, we study the role of activity-dependent depression of network excitability in the generation and regulation of spontaneous activity in the embryonic chick spinal cord. We demonstrate that the duration of an episode of activity depends on the network excitability at the beginning of the episode. We found a positive correlation between episode duration and the preceding inter-episode interval, but not with the following interval, suggesting that episode onset is stochastic whereas episode termination occurs deterministically, when network excitability falls to a fixed level. This is true over a wide range of developmental stages and under blockade of glutamatergic or GABAergic/glycinergic synapses.
We also demonstrate that during glutamatergic blockade the remaining part of the network becomes more excitable, compensating for the loss of glutamatergic synapses and allowing spontaneous activity to recover. This compensatory increase in the excitability of the remaining network reflects the progressive increase in synaptic efficacy that occurs in the absence of activity. Therefore, the mechanism responsible for the episodic nature of the activity automatically renders this activity robust to network disruptions. The results are presented using the framework of our computational model of spontaneous activity in the developing cord. Specifically, we show how they follow logically from a bistable network with a slow activity-dependent depression switching periodically between the active and inactive states.
Keywords: spontaneous activity, activity-dependent depression, network plasticity, homeostasis, spinal cord, chick embryo
Developing networks throughout the nervous system exhibit a transient period of spontaneous activity. This behavior is remarkably similar in networks of very diverse architecture (e.g., spinal cord, retina, and hippocampus), with episodes of discharge punctuated by periods of quiescence. Early developing networks are hyperexcitable because their GABAergic synapses are depolarizing, resulting in recurrent, functionally excitatory connectivity (Cherubini et al., 1991; Sernagor et al., 1995; Nishimaru et al., 1996; Leinekugel et al., 1997; Fisher et al., 1998). This hyperexcitability can explain the presence of spontaneous activity, but not its episodic nature.
It has been postulated that active networks in the developing retina become transiently refractory to further activation (Meister et al., 1991; Feller et al., 1996, 1997; Butts et al., 1999). In the chick embryo, we have identified several factors contributing to such refractoriness. After an episode, the amplitude of spontaneous and evoked synaptic potentials is transiently depressed (Fedirchuk et al., 1999; Chub and O'Donovan, 2001), and the membrane potential of spinal neurons is transiently hyperpolarized (Chub and O'Donovan, 2001). Modeling studies have shown that hyperexcitability and activity-dependent depression of network excitability are sufficient to account for many features of spontaneous activity in the chick cord (Tabak et al., 2000b). These studies have also shown that slow activity-dependent depression endows excitatory networks with a remarkable form of homeostatic plasticity so that their spontaneous output is resistant to disruptions of connectivity (Tabak et al., 2000b), a property that has been confirmed experimentally (Chub and O'Donovan 1998; Milner and Landmesser, 1999).
Despite the apparent importance of activity-induced depression in the regulation of spontaneous activity, there is no direct evidence that it is “causally” involved in the regulation of spontaneous episodes. In this paper, we address this issue. We provide direct evidence that network excitability is transiently depressed after spontaneous episodes and recovers in the inter-episode interval. In addition, we examine the statistical relationship between episode duration and inter-episode interval (Grzywacz and Sernagor, 2000). The particular form of this relationship will depend on the underlying mechanisms. If episodes terminate at a specific and relatively invariant level of network excitability, then the duration of the inter-episode interval will determine the extent of network recovery and hence network excitability. As a result, long intervals will be followed by long episodes. If, on the other hand, the degree of network depression is determined by the duration of the episode, then it will take longer to recover from a long episode, and there will be a correlation between episode duration and the subsequent interval.
In the second part of the paper, we examine the mechanisms involved in the recovery of spontaneous activity after pharmacological blockade. We also test one prediction of our model: that during pharmacological blockade the synapses remaining functional should progressively increase their strength until spontaneous activity can resume (Tabak et al., 2000b). Finally, we demonstrate that under pharmacological blockade the same mechanisms regulate the expression of activity as under control conditions.
Some of this work has been published previously in preliminary form (Tabak and O'Donovan, 1998; Tabak et al., 2000a).
MATERIALS AND METHODS
Dissection
Experiments were performed on the isolated spinal cord of embryonic day (E) 7–12 White Leghorn chicken embryos. The spinal cord (lumbosacral, thoracic up to brachial) was dissected out under cooled (12–14°C) oxygenated (95% O2, 5% CO2) Tyrode's solution containing (in mm): 139 NaCl, 12 glucose, 17 NaHCO3, 2.9 KCl, 1 MgCl2, 3 CaCl2. The preparation was then transferred at room temperature to a recording chamber and superfused with oxygenated Tyrode's solution. After 4 hr at room temperature, the cord was heated to 26–28°C, inducing spontaneous episodic activity. For the experiments involving pharmacological blockade of glutamatergic or GABAergic/glycinergic transmission, extracellular potassium concentration in the recording solution was elevated to 5 mm (Chub and O'Donovan, 1998).
Recordings
Spontaneous activity. Neural activity was recorded from ventral roots for 12–24 hr. Recordings were made using tight-fitting suction electrodes and amplified (DC −3 kHz or 0.01–3 kHz) with high-gain DC amplifiers (DAM 50 and IsoDAM, World Precision Instruments). Amplified signals were directly digitized through a PCI board (National Instruments) and/or recorded on tape (Neurodata) for further analysis.
Evoked potentials. The ventrolateral funiculus (VLF), dorsal roots, or ventral roots were stimulated by single current pulses (duration 200–500 μsec, amplitude 5–50 μAmp) using an Iso-Flex (AMPI) stimulus isolator. Responses were recorded from ventral roots, filtered at 500 Hz, and directly digitized.
Analysis
Spontaneous activity. DC recordings of ventral root activity were digitized at 5–20 Hz for the detection of episode onset and offset and cycle frequency. Episode onsets and offsets were initially detected manually using a LabVIEW Virtual Instrument (National Instruments), whereas later experiments used a threshold-based detection program written in Mathematica (Wolfram Research) as explained below. Some preparations were analyzed using both methods to verify that the same results were obtained. Cycles within episodes were also detected either manually or using an algorithm to automate the process (see below).
Episode duration is defined as the period of time between the beginning and end of an episode, whereas the inter-episode interval (or recovery period) is defined as the interval between the termination of an episode and the onset of the consecutive episode (see Fig.3A). We distinguish between the “preceding” inter-episode interval (the interval immediately before an episode) and the “following” interval (the interval immediately after an episode).
Fig. 3.

A, Spontaneous episodes followed by episodes evoked by an external stimulus applied at different times. The arrows mark the time of the stimulus. B, Episode duration is plotted against the preceding interval (time between the stimulus and an end of the spontaneous episode) for an E10 embryo. Black dotsindicate evoked episodes; gray dots indicate spontaneously occurring episodes. The black curve is an exponential fit with time constant τ = 81 ± 16 sec. All points (evoked and spontaneous) were used for the fit. Points markeda–c are from the episodes shown inA. C, In the same preparation as shown inB, the VLF was stimulated once per minute during the inter-episode interval, and the evoked ventral root potentials were recorded. The plot illustrates the amplitude of the normalized ventral root potentials (mean ± SEM; averaged using 7 inter-episode intervals) during the time elapsed after an episode. The black curve is an exponential fit of the data asymptotically reaching 1 with time constant τ = 107 ± 45 sec. This is comparable with the time constant obtained from episode durations shown inB. D, Comparison between episode duration and median cycle frequency for another E10 embryo. Median cycle frequency is plotted against episode duration for stimulated (black dots) and spontaneous (gray dots) episodes. One episode comprised a single cycle, and therefore its “cycle frequency” is zero. Coefficient of correlation between frequency and duration was 0.94. E, The episodes marked d–f in D are shown (high-pass filtered at 0.01 Hz). Note how cycling frequency increases with episode duration.
Episode onset was defined as the time the signal “derivative” [v′(t) = [v(t + Δt) − v(t)]/Δt, with Δt being the sampling period] crossed a threshold that excluded most of the noise. The end of the episode was defined as the time when the DC signal returned to baseline and did not rise again for a period of time slightly greater than the maximum cycling period. Use of the derivative of the signal to detect episode onset was necessary because of the slow baseline drift in some of the DC recordings. It was not necessary to use the derivative when the electrical activity was high-pass filtered at 0.01 Hz, which eliminated the slow signal drift.
Cycling frequency during an episode was also measured. Cycles were detected according to the point of highest slope at cycle onset. Because the time derivative v′(t) of the signal was too noisy for accurate detection, we used the productv′(t) · v′(t + Δt). This transformation increases the signal-to-noise ratio and thus allows for an easy detection of the cycle onsets (note: cycle offset is much slower than onset and therefore was not detected by this method). We then calculated each instantaneous cycle frequency during an episode as the inverse of the interval between two cycles. Because the instantaneous cycling frequency is not constant but decreases from the beginning to the end of episode, we defined the cycling frequency of an episode as the median of the measured instantaneous frequencies. For long episodes, there is often a tonic phase at the beginning, sometimes comprising fast oscillations of amplitude that are too small for accurate detection of the individual cycles. Therefore the period between the onset of the episode and the first detectable cycle was discarded in that case. This problem was more significant in older preparations, which often have long episodes with cycling progressively emerging from a tonic depolarization. Because the first cycles were not consistently detectable from episode to episode in the older animals, we mainly used cycle frequency as a measure of network excitability in the younger preparations.
Because we investigated the effect of the previous interval on episode duration and the effect of episode duration on the next interval, it was important to remove slow trends in the data that might result in spurious correlations. Although it is possible that these slow changes might contain useful biological information, in this paper we are interested in the correlation between episode duration and the immediately following or immediately preceding interval. These “immediate” relationships between episode duration and inter-episode can be spuriously altered by slow trends in the data. For example, if both interval and duration increase or decrease with time, as illustrated in the example of Figure 1, there will be a positive correlation between duration and both the previous and the next interval. On the other hand, if the inter-episode interval decreases with time while the episode duration increases, a negative correlation between episode duration and interval might be found, because short episodes will tend to be accompanied by a long inter-episode interval. These correlations, attributable to the slow variations of interval and duration, could mask or exaggerate the correlations that result from the mechanisms involved in generating episodic activity.
Fig. 1.

Data obtained from an E11 embryo illustrating the de-trending procedure. A, Graph of inter-episode interval; C, episode duration for each episode. The smoothed intervals and durations are superimposed. In this particular experiment, episode durations and inter-episode intervals increased and then decreased together, which would create a positive correlation between interval and duration. B, De-trended data, that is, subtraction of the smoothed data from the raw data (plus addition of the mean of the raw data) for the inter-episode intervals;D, episode durations.
Strong trends at the beginning and end of the experiment, caused by warm-up and degradation of the preparation, were removed by discarding the very first data points and the very last ones. To remove the remaining trends from the data, we smoothed the plots of the episode duration and inter-episode interval versus time using a combination of moving median and moving average (the number of points used for each filter, med and ave are given bymed = 2√size + 1 and ave =med/2 + 3, rounded off to the next smaller integer, wheresize is the number of episodes recorded). The moving average provides a smoother result than the moving median but is more sensitive to outliers (strong peaks or troughs). This is why we first used a moving median filter, the result of which is then smoothed by a moving average. The resulting smoothed curves (Fig.1A,C) were then subtracted from the raw data to produce the de-trended data (Fig.1B,D). Under these conditions, only short-term variations are conserved. Note that the simpler method of differencing the sets of data will introduce some spurious correlations. All correlation coefficients were calculated from the de-trended data, except when episodes were evoked by stimulation. We have verified that other methods for de-trending the data (Fourier filtering, polynomial fitting, lowess fitting) gave very similar results, suggesting that our conclusions are not biased by the particular de-trending method that we chose.
Evoked potentials. The signals were digitized at a 1250 Hz sampling rate. The amplitude of evoked potentials was calculated by averaging over one or two limited portions of the traces. Specifically, for dorsal root stimulation we distinguished a short- and a long-latency phase of the response (Lee et al., 1988). The signal was averaged over a few milliseconds for the short-latency component and over ∼100 msec for the slower long-latency component. For VLF stimulation, we have similarly computed two averages but added them together into a composite measure because it was harder in that case to distinguish between short- and long-latency responses. For the slow responses obtained with ventral root stimulation, we used an average over 100–200 msec of the peak amplitude.
RESULTS
Conceptual framework
To better convey the goals and results of our experiments, we briefly describe the conceptual framework that underlies our view of the network dynamics. This framework also embodies the essence of the mathematical model for episodic rhythmicity that we developed and applied to the chick spinal cord (Tabak et al., 2000b). In Discussion, we discuss more fully this model in relation to the experimental results reported here.
The essential mechanism of episodic activity can be viewed as follows. The network either can be active because the recurrent synaptic input provides adequate drive to maintain neuronal firing or it can be inactive, with few spontaneously firing cells. When the network is inactive it can be switched to the active state by a suitable external stimulus. We denote the relative activity level of the network (so the maximum is one) as a and the excitability or susceptibility of the network to be switched into the active state as s(1 − s being the level of depression). Whens is high enough, the network can self-sustain the active state, and when s is low the network remains quiescent. In such recurrent excitatory networks there is often found a range ofs values within which the system can be in either state (i.e., the network is bistable). The dynamics that underlie the oscillation between active and silent states assumes that excitability (s) slowly decreases when the network is in the high activity state (activity-dependent depression), until it falls below a critical level, at which point the network switches down to the low activity state. Then, recovery occurs and s slowly increases. When excitability has recovered above a critical level, the network jumps to the high activity state again and the process repeats. This periodic alternation between activity and inactivity can be viewed as a trajectory on the state diagram (phase plane) of a ands, as seen in Figure2A. The corresponding time courses of a and s versus time are seen in Figure 2B.
Fig. 2.
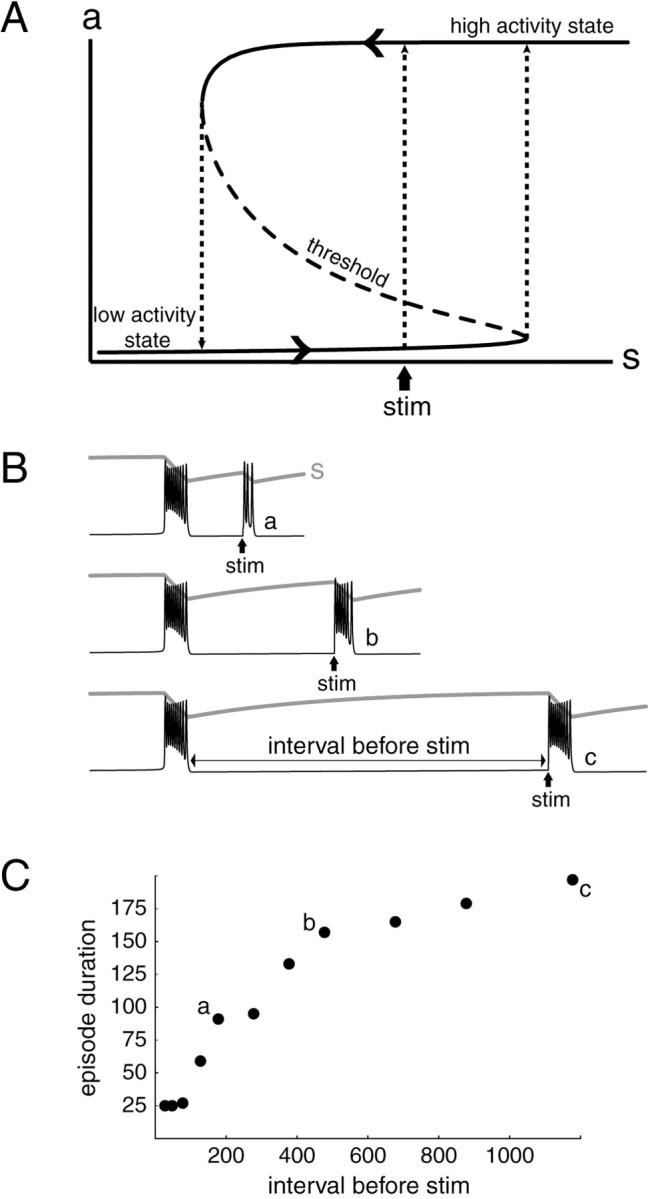
Conceptual framework underlying the design of experiments. A, Phase plane, or state diagram for a recurrent excitatory network, showing the possible values of activity (a) as the relative measure of network excitability (s) varies. For a range ofs values (marked by the dotted vertical lines on the inflection points), the system can be in either of two states, active (high activity state) or silent (low activity state); the middle curve,dashed, is a third but unstable state that represents a functional threshold between the two stable states. When the system is in the high activity state, s decreases (left-pointing arrowhead) until it is too low for the high activity state to be sustained. It then falls down to the low activity state and recovers (right-pointing arrowhead). When s reaches the value for which the low activity state coincides with threshold, a new episode begins. Before this value is reached, a stimulus (stim) or transient that brings the activity above threshold can trigger an episode. For simplicity, the oscillatory cycles that take place during an episode are not represented. B, Time course of activity (black) and network excitability (gray) corresponding to the phase plane trajectory shown in A, for different time intervals between an episode and an externally applied stimulus (stim). In this example we illustrate the cyclic oscillations during an episode. C, Episode duration is plotted as a function of the time interval between the preceding episode and the time of stimulation; a–crepresent the traces shown in B. Note that for the smallest intervals, episode duration does not increase with interval, because the evoked episodes have only one cycle.
The dashed curve with negative slope between the high and low activity states represents a state of intermediate activity that is actually unstable (not physically realizable). This can be considered a functional threshold. If the network is in the low state, then a brief perturbation could cause a transition to the upper state if it raises the network activity above the threshold. From this graphical representation one immediately sees that adequate-sized perturbations, evoked or spontaneous, can cause a premature transition from the low to the high activity state, beginning a new episode (Fig. 2,stim). Such premature triggering would mean a short inter-episode interval and a correspondingly short episode duration. Thus, there is a monotonic relation between the time interval before an episode is evoked and the duration of the episode (Fig. 2C). This demonstrates that episode duration, because it increases with the interval and therefore with s, is itself a good indicator of the network excitability at the time of episode onset. In the following section, we confirm this model prediction experimentally.
Of course, the neurons in the cord are subject to stochastic perturbations (e.g., synaptic noise), so that the relationship between episode duration and preceding interval will be statistical rather than purely deterministic. Moreover, although it is not clear a priori whether “up-transitions” or “down-transitions” will be more sensitive to fluctuations, we show that the former are.
Episode duration and cycling frequency as indicators of network excitability
We have shown previously that synaptic potentials evoked in the ventral roots by stimulation of the VLF or dorsal roots are depressed after an episode and recover with a time scale of minutes (Fedirchuk et al., 1999). This finding suggests that network excitability is depressed after an episode and recovers during the inter-episode interval. However, the amplitude of synaptic potentials is just one factor contributing to network excitability. Therefore, to provide a more comprehensive assay of network excitability we have used “evoked” episodes to monitor network excitability during the inter-episode interval. We hypothesized that the episode duration or the cycling frequency within an episode would be related to the level of network excitability after a spontaneous episode, as explained in the previous section. To test this idea, we evoked episodes by dorsal root stimulation at various times after spontaneous episodes and monitored their duration and cycling frequency (Fig.3A). In addition, we compared the time course of these changes with the depression and recovery of VLF-evoked ventral root potentials during the inter-episode interval (Fedirchuk et al., 1999).
In six of six preparations (aged E9–11), we found that the duration of the evoked episode increased monotonically with the time interval between the end of a spontaneous episode and the dorsal root stimulus (Fig. 3A,B). The time course of the changes in evoked episode duration after a spontaneous episode paralleled the changes in the amplitude of VLF-evoked ventral root potentials during the inter-episode interval (Fig. 3C). As illustrated in Figure 3B, the duration of stimulated episodes (black dots) increased monotonically with the time from the previous spontaneous episode. When the dorsal root stimulus was presented less than ∼2 min after a spontaneous episode, the evoked episodes comprised a single cycle, a result similar to the behavior of the model for stimuli presented at short intervals (Fig.2C). In Figure 3B, we have also plotted the duration of “spontaneously” occurring episodes against the previous inter-episode interval (gray dots), and it can be seen that these points fall along the curve defined by the evoked data. Although there is no difference in the form of spontaneous and evoked episodes, episodes can be evoked at any time, whereas most spontaneous episodes occur only after a certain amount of recovery has occurred. For instance, 90% of all spontaneous episodes recorded from eight preparations at E10–11 had a duration of at least 65% of the maximum duration. This result suggests that the excitability level at which the network can “maintain” an episode, once initiated, differs from the level of excitability that is required on average to “initiate” a spontaneous episode.
In three of six experiments, we also monitored the amplitude of the VLF-evoked ventral root potentials. In all three of these experiments, this response increased with a similar time course to the evoked episode durations over the inter-episode interval (shown on Fig.3C for the same preparation as Fig. 3B). As reported previously (Fedirchuk et al., 1999), the maximal depression of the VLF-evoked potentials occurs ∼1 min after the end of an episode. For both the episode duration and the amplitude of the evoked potentials, the recovery is steeper at the start of the recovery and becomes shallower as the inter-episode lengthens, as if the recovery process were saturating. To compare the recovery time course for both processes, we have fit both sets of data with an exponential recovery curve in these three experiments. This was done for descriptive purposes and is not meant to imply that the recovery process is exponential. For these three preparations, we found that the time constant for the recovery of episode duration as a function of time from the previous episode was 219 ± 72 sec, and that for the recovery of the VLF-evoked potentials in motoneurons was 211 ± 59 sec. The similarity of these time constants is compatible with the idea that both the evoked episode duration and the amplitude of the evoked potentials are manifestations of the same recovery process.
We also compared the cycling frequency within an episode and the episode duration for both evoked and spontaneously occurring episodes (Fig. 3D). In six of six experiments (E9–11) we found a monotonic relationship between episode duration and median cycling frequency, suggesting that both episode duration and cycling frequency reflect the level of network excitability (this is also true for the model; data not shown). We also found the same relationship between number of cycles per episode and episode duration (data not shown).
Collectively, these findings provide additional evidence that network excitability is depressed after an episode and recovers in the inter-episode interval. In addition, they suggest that the duration or cycle frequency of spontaneously occurring episodes provides a measure network excitability (or the level of activity-dependent depression) present at the onset of the episode.
Relationship between episode duration and inter-episode interval for spontaneous episodes
In the next set of experiments, we investigated the relationship between episode duration and inter-episode interval for spontaneously occurring episodes. We hypothesized that if episodes terminate at a specific and relatively invariant level of network excitability, then the duration of an episode should be determined by the extent of the network recovery, as it is for stimulated episodes. Accordingly, long inter-episode intervals (i.e., greater recovery) should be followed by long episodes. Alternatively, if episodes start only when network excitability reaches a certain level, then the degree of network depression after an episode will be determined by the duration of the episode, so it should take longer to recover from a long episode, and there will be a positive correlation between episode duration and the subsequent interval. These relationships are schematized in Figure4B.
Fig. 4.

Analysis of spontaneous activity.A, Activity recorded from a ventral root of an E10 chick spinal cord (high-pass filtered at 0.01 Hz to remove DC drift). The inter-episode interval is defined by the period of time between the last cycle of an episode and the onset of the following episode. Episode duration (∗) is defined from the onset of the first cycle to the end of the last cycle. B, Schematics showing the behavior of two models in which network excitability declines during the episode (light gray rectangles) and then recovers during the inter-episode interval. In the first model (a) all episodes end at the same level of network excitability (defined by the dotted line) but can begin at different levels of excitability. As a result, the duration of the recovery period determines the length of the next episode. In an alternative model (b), all episodes start once a threshold of network excitability is reached (dotted line) but can end at various levels of excitability. Therefore, the duration of the episode determines the duration of the next inter-episode interval. C, Data obtained from an E11 embryo illustrating the relationship between the preceding or the following inter-episode intervals (de-trended; see Materials and Methods) and episode duration. D, Summary of the median correlation coefficients obtained from linear regression of the episode duration versus inter-episode interval at several different embryonic ages (E7–12). The number of preparations (n) used for each age range is indicated under each bar.
Figure 4A shows the activity recorded from the spinal cord of an E10 embryo for a period of 35 min. As discussed in Materials and Methods, we found that neither the inter-episode interval nor the episode duration were constant over the monitoring period, which could be up to 24 hr. Episode duration often increased during the initial part of the experiment and then decreased. Inter-episode intervals sometimes varied in a similar way to the duration and sometimes in the opposite way, decreasing at the beginning of the experiment. Some of these variations could be attributable to the warm-up of the preparation at the beginning of the experiment and its progressive degradation toward the end. In the embryonic chick hindbrain, which exhibits spontaneous episodes similar to those seen in the spinal cord, it has been proposed that the slow increase in episode duration occurs because of continued development (Fortin et al., 1994). However, we feel that this explanation is unlikely in our experiments, because the increase in episode duration was not always accompanied by a similar increase in the inter-episode interval, which would be expected if the changes were developmental (Tabak et al., 2000b).
Regardless of the underlying reasons, slow trends in either variable could induce spurious correlations or mask the short-term correlations between inter-episode interval and episode duration. For these reasons, the slow changes were removed as described in Materials and Methods. Using the de-trended data, we plotted inter-episode interval against episode duration and calculated the linear correlation coefficient for the paired data as illustrated in Figure 4C. We found a positive correlation between the duration of an episode and its preceding inter-episode interval but no relationship between the duration of an episode and the next (following interval) inter-episode interval. Figure4D summarizes the correlation coefficients found in 21 preparations between E7 and E12. The positive correlation between episode duration and preceding inter-episode interval is consistently observed throughout most of the age range (Fig. 4D,left panel). All correlations found were highly significant (p < 0.001), except for five E7–8 preparations (in two of these, p < 0.05) and one E9 preparation (p < 0.01). We found no correlation between episode duration and the following inter-episode interval for all of the different developmental stages (Fig. 4D,right panel); only one case of significant positive correlation was found (E8; p < 0.01).
The lower correlations between episode duration and preceding inter-episode interval at E7–8 (Fig. 4D,leftmost bar) deserve comment. It is possible that the mechanisms of episode generation might differ at these stages from those operating at E11–12. Alternatively, it might be that episode duration is not an accurate measure of network excitability at the youngest stages. Indeed, as illustrated in Figure5A, episode duration and cycling frequency were not well correlated at E7–8 and may sometimes be negatively correlated (Fig.5B,C). This is because at the early stages the cord generates only a few cycles of activity. Because the active phase of a cycle is relatively constant in duration (O'Donovan and Landmesser, 1987; Ho and O'Donovan, 1993), the longest episodes tend to have the lowest cycling frequency (Fig.5A,B) and therefore might correspond to low network excitability. For this reason, we used cycle frequency rather than episode duration as an indicator of network excitability at these ages.
Fig. 5.

A, Example of spontaneous activity recorded from an E7 embryo spinal cord illustrating the dissociation between episode duration and cycling frequency. B, Scatterplot showing an inverse relationship between episode duration and cycling frequency in an E7 embryo. C, Scatterplot showing the absence of a relationship between episode duration and cycling frequency in an E8 embryo. D, Scatterplots showing the positive correlation between cycling frequency and preceding inter-episode interval (left) and the absence of correlation between cycling frequency and following inter-episode interval in an E8 embryo (right).
Figure 5D shows that cycle frequency was positively correlated with preceding inter-episode interval and that there was no correlation between cycle frequency and following interval. In the five preparations we referred to above that did not show a significant correlation between episode duration and preceding interval, all exhibited a significant positive correlation between cycle frequency and preceding inter-episode interval (p < 0.01 or less). This finding is consistent with the idea that the mechanisms of episode generation are similar between E7 and E12.
Collectively, the results from the E7–12 embryos show that the duration or cycling frequency within an episode, both measures of network excitability, increase monotonically with the length of the preceding inter-episode interval. This finding strongly supports the model illustrated in Figure 4Ba, in which episodes terminate at about the same level of network depression and network excitability progressively recovers during the inter-episode interval.
Spontaneous activity and the recovery of evoked potentials during pharmacological blockade
We have demonstrated previously that spontaneous episodes recover in the presence of pharmacological blockade. When glutamate antagonists are bath applied, spontaneous activity is interrupted for a period of time and then resumes at a somewhat lower frequency than under control conditions (Chub and O'Donovan, 1998). When GABA/glycinergic blockade is used, activity is still expressed, but the inter-episode intervals are generally longer and more variable than under control conditions (Chub and O'Donovan, 1998). The mechanisms responsible for the recovery of activity under glutamatergic blockade are not known, nor is it known whether spontaneous activity in the presence of either class of antagonists uses the same mechanisms as under control conditions. For these reasons, we investigated whether synaptic potentials are depressed by activity in the presence of the antagonists (as they are under control conditions) and whether the correlations between inter-episode interval and episode durations are similar in the presence of drugs as under control conditions.
Recovery of activity under glutamatergic blockade
We have shown previously that our model (Tabak et al., 2000b) can mimic the effects of glutamatergic blockade on network activity if we assume that glutamatergic blockade is equivalent to a reduction in the number of functional synapses and if the slow depression of network excitability is caused mainly by a synaptic, rather than cellular, process. In this formulation, the slow variable s, which is a relative measure of network excitability, can be taken as the fraction of available synapses (or normalized synaptic strength). Of course, glutamatergic blockade in the actual network will influence a number of other processes, but this assumption is sufficient to mimic the observed activity. In the model, the occurrence of spontaneous episodes is governed by the effective connectivity. This is the product of the connectivity in the network, n (representing the average number of synapses on a cell) and the fraction of available synapses s, which is a slowly varying variable. As described above, under control conditions, when all synapses are available,s decreases during an episode and reaches a level where the effective connectivity (n.s) is too low to maintain activity (Fig. 6,Control). As a result, the episode stops, ands recovers during the inter-episode interval until a new episode can start.
Fig. 6.

Time course of the model activity (black trace), connectivity (n, dashed line in bottom panel), average synaptic strength (s, dark gray solid line), and effective connectivity (n.s,dotted line). To mimic glutamatergic blockade,n was suddenly decreased (by 25% from 1.2 to 0.9 at thevertical dotted line; see bottom panel), which in turn decreasedn.s. Becausen.s, which represents the gain of the positive feedback in the circuit, is too small, activity stops. In the absence of activity, s recovers and reaches a higher level than in control (in other words, the level of depression in the network, 1 − s, has decreased). Whens is high enough to compensate for the decrease ofn, the product n.s reaches the control value, and the network becomes active again. Once the activity has recovered, the inter-episode intervals are longer, and the episode durations are slightly shorter than under control conditions.
We mimic the pharmacological blockade of glutamatergic receptors by abruptly decreasing the average number of functional synapsesn (Fig. 6, dashed line, bottom). As shown in Figure 6, the effective connectivity (n.s, dotted line) in the network abruptly falls when n is reduced, and because of such a drop in effective connectivity the network remains inactive. However,s (solid gray line) recovers as under control conditions, but because no episodes occur it can actually reach higher values than in control. After a suitably long interval, the value reached by s will be such that it compensates for the decreased n and n.s approaches its peak control level again. At that point, activity resumes, with inter-episode intervals slightly longer than in control. Note that this is possible because s does not saturate in control conditions. After blockade, the network compensates by shifting to a higher level of synaptic efficacy (s) or a lower level of depression (1 − s). In the model, therefore, the recovery of activity after a reduction in the number of effective synapses is a manifestation of the same process generating the episodes under control conditions. In other words, no additional mechanisms are required for the recovery of activity.
Thus, if this mechanism is responsible for the observed recovery of activity under glutamatergic blockade, we would predict that the strength of those synapses that remain functional (e.g., GABAergic, glycinergic, cholinergic) should increase continuously above control levels during the recovery period, as they become less depressed. Once activity resumes, the maximum and minimum synaptic strengths will have shifted to a higher level than under control conditions.
In the next set of experiments, we tested these predictions by stimulating a cholinergic/GABAergic pathway [ventral root-evoked ventral root (VR-VR) potentials] every 2 min and monitoring the amplitude of the evoked responses under control conditions and during the recovery and the subsequent inter-episode intervals in the presence of the glutamate antagonists APV (50 μm) and CNQX (5 μm). Previous work has shown that ventral root potentials evoked by ventral root stimulation are mediated by cholinergic and GABAergic synapses (Wenner and O'Donovan, 1999) and are depressed transiently after an episode. Consistent with the predictions of the model, we found that after glutamatergic blockade the amplitude of the VR-VR potentials increased above the maximum value recorded under control conditions and maintained this increase when spontaneous episodes resumed. One such experiment is illustrated in Figure7, A and B. When the glutamate antagonists were added to the bath, we observed an immediate but transient decline in the amplitude of the evoked potential. However, the amplitude of the potential continued to recover and reached an amplitude well above the control value before an episode occurred.
Fig. 7.

Recovery of the VR-VR response in control conditions and during glutamatergic blockade. A, Schematic representation of the experimental protocol, showing the amplitude of the VR-VR response (height of vertical lines) during the interval between episodes (rectangles), under control conditions (blue traces), during the interval when glutamatergic antagonists APV (50 μm) and CNQX (5 μm) were applied (green traces), and after recovery of the spontaneous activity (red traces; drugs still in bath). Ventral root stimuli were delivered every 2 min, and the evoked response was monitored in an adjacent ventral root. B, Plot of the normalized amplitude of the VR-VR response with time after an episode. Immediately after drug application (arrow ongreen trace), the amplitude of the VR-VR response declines and then recovers progressively to reach a level above the maximal control value (which was used for normalization). Once the activity resumed, the size of the VR-VR response varied over a range that was shifted upward from the control range. Thedouble-arrowed vertical dashed line indicates the net difference in size between the response after recovery in APV/CNQX and before recovery (just after APV/CNQX application). Theinset in B shows examples of the potentials evoked at the times indicated by the letters. The responses were recorded from lumbosacral root (LS)5, and the stimuli were delivered to the adjacent LS4 (10 μA for 0.4 msec). The records in a and c were obtained ∼2 min after an episode, and those in b and dwere obtained <2 min before the next episode. C, Comparison of control values of the VR-VR response with the values obtained in the interval immediately after drug application. Data were averaged from three experiments. Time was normalized with respect to longest control interval in each preparation, and points were binned in 10% increments. D, Comparison of the inter-episode interval under control conditions and once the activity has recovered in the presence of blockade, excluding the first interval after drug application. Data are as in C. Results are from an E10 embryo.
Once the activity has resumed, the inter-episode variations in the response amplitude were similar to those under control conditions, but remained shifted upward by ∼20% (Fig. 7A, red lines, B, red traces). Figure 7Cillustrates the control and recovery curves averaged from three experiments. The maximal value reached after glutamatergic blockade was 21% greater than the maximal control value (significant according to Welch's approximate t test; p < 0.002). Similarly, in Figure 7D, the control values for the normalized amplitudes are compared with values obtained after recovery of the activity. Over the entire control range of intervals, the average values were 22% greater compared with control (p < 0.00002; n = 3 experiments) once the activity had resumed. There was no significant difference between the maximal value of the VR-VR response obtained after drug application and the maximal value obtained once activity had resumed, showing that there is no further change in the level of depression once the activity has recovered.
Although the recovered amplitudes were ∼20% greater than the control values over the entire inter-episode interval, we note that the glutamatergic blockade caused an immediate drop in the response of 23% (± 5% SD; n = 3 exp). We do not believe that the drug-induced decline in the amplitude of the VR-VR response necessarily implies the existence of a glutamatergic component to this pathway because extracellular glutamate could facilitate polysynaptic transmission by depolarizing the interneurons involved in this pathway (R-interneurons) (Wenner and O'Donovan, 1999). However, because of this effect, a better measure of the difference between the response amplitude before and after recovery of the activity can be calculated as indicated in Figure 7B by the dashed double-arrowed line, that is, to compare the response just after drug application with the response after recovery of the activity (at the same time point after an episode). Using this method, the average increase was 64% (±55% SD; n = 3 experiments).
In three experiments we washed out the drugs and established that the amplitude of the evoked potentials decreased from the recovery level once the frequency of spontaneous episodes had stabilized. This finding indicates that the amplitude increases observed in the presence of the drugs were not artifactual (e.g., depending on uncontrolled changes in the recording conditions). In addition, this result suggests that the network output can adjust to a sudden “increase” in connectivity (removal of the drugs) by operating at a higher level of depression.
Relationship between episode duration and inter-episode interval for spontaneous episodes under glutamatergic blockade
The previous experiments suggested that the recovery of activity in the presence of glutamatergic blockade engaged the same mechanisms responsible for the expression of spontaneous activity under control conditions. If so, then we would predict that the correlation between preceding inter-episode interval and episode duration observed under control conditions should also be present under glutamatergic blockade. In agreement with this prediction, we found a positive correlation between preceding interval and duration (Fig.8A) (significant correlation in four of four experiments) but no correlation between following interval and episode duration (Fig. 8B) (no significant correlation in four of four experiments). This result is consistent with our hypothesis that the same mechanisms are responsible for spontaneous activity in control conditions and under glutamatergic blockade.
Fig. 8.

Relationship between episode duration and inter-episode interval under glutamatergic blockade. A, Scatterplot for the preceding interval (r = 0.68).B, Scatterplot for the following interval (r = −0.10); same preparation as A(E10). C, Summary of the median correlations generated from linear regression between the interval and the episode duration for four experiments (all E10).
Activity under GABA/glycinergic blockade
Under control conditions, it has been proposed that Cl− extrusion during the episode leads to a decline in the GABAA reversal potential and a corresponding reduction in the driving force for GABAergic potentials (Chub and O'Donovan, 2001). This process has been proposed to underlie some of the reduction of synaptic efficacy that follows an episode. Obviously, this mechanism will not be operating in the presence of bicuculline and strychnine, raising the possibility that the mechanism responsible for the generation of activity under GABAergic/glycinergic blockade might be different from that operating under control conditions. In the next set of experiments, therefore, we investigated the role of network depression in the generation of spontaneous activity in the presence of GABA/glycinergic blockade. We first determined whether evoked synaptic potentials persisting in the presence of GABA/glycinergic antagonists exhibit a post-episode depression and recovery. We then established whether the correlations between inter-episode interval and episode duration persist under GABA/glycinergic blockade.
To investigate the post-episode behavior of synaptic potentials under GABA/glycinergic blockade, we stimulated either a dorsal root or the VLF every minute and monitored the amplitude of the evoked ventral root potentials during the interval between episodes. Under these conditions, activity persisted but intervals were generally larger and less regular than in control, as reported previously (Chub and O'Donovan, 1998). In five of five experiments, we found that the evoked potentials were depressed after episodes, as under control conditions. Figure 9 illustrates the effects of spontaneous episodes on the amplitude of VLF-evoked ventral root potentials. Under control conditions (blue traces), the evoked potentials were depressed after an episode. Once the drugs were added, the amplitude of the evoked potentials declined and then began to recover (green trace). This behavior was similar for both dorsal root- and VLF-evoked potentials. However, the GABA/glycinergic antagonists depressed the amplitude of the long-latency components of the evoked responses to a much greater degree for the dorsal root-evoked potentials than for the VLF-evoked responses. As a result, it was sometimes necessary to increase the stimulus intensity applied to the dorsal roots once the drugs had been given to obtain a response that could be measured reliably.
Fig. 9.

Effect of GABAergic/glycinergic blockade on VLF-evoked VR response. A, Traces showing ventral root (LS5) responses evoked by stimulation of the caudal (LS8) VLF in an E11 preparation. The responses were evoked at the times indicated by theletters in B. Records were obtained under control conditions (blue traces) and in the presence of bicuculline (50 μm) and strychnine (5 μm) (Bic/Str, red traces). Although the blockade initially decreased the amplitude of the response (comparea and c, b andd), the response could recover to levels comparable with control levels (e), suggesting that the remaining (glutamatergic and/or cholinergic) synapses have increased in strength.B, Plot of the normalized amplitude of the evoked responses during several inter-episode intervals under control conditions (blue), in the interval when bicuculline (50 μm) and strychnine (5 μm) were added (green trace), and subsequently once activity recovered in the presence of the drugs (red). Note the increased variability of the intervals and the presence of intervals shorter than controls.
Given our observations using glutamatergic blockade, we would expect the unblocked (glutamatergic and/or cholinergic) synapses to become stronger to compensate for the blockade of GABA/glycinergic synapses. Unfortunately, however, there are no purely glutamatergic (or cholinergic) pathways that can be used as a test system. Both the VLF and dorsal root pathways contain a significant GABA/glycinergic component that will be blocked by the antagonists. As a result, if complete compensation of the “unblocked” glutamatergic/cholinergic connections occurred, then the amplitude of the responses evoked by dorsal root or by VLF stimulation in the presence of bicuculline and strychnine would be expected to reach the maximum amplitude of the same pathway before the drugs. However, as illustrated in Figure9B, the amplitude of the evoked responses just before an episode was sometimes below that of the control experiments. Furthermore, the rate of recovery appeared to be slower than under control conditions. These observations are consistent with the increased variability of the inter-episode intervals observed during GABA/glycinergic blockade, and they indicate that episode triggering can occur prematurely under this condition. Also, this increased variability helps illustrate the idea that episodes terminate at about the same level of network excitability, whereas they can start at very different levels of excitability (as in Fig. 4Ba). As illustrated in Figure 9B (red traces), the range of response amplitude (i.e., excitability) over which episodes could start was broad (ranging between the values defined by pointsd and e), whereas the range of excitability was much more restricted when episodes terminated (small range of post-episode amplitudes at the beginning of the red traces, around point c).
In addition, as reported previously under control conditions (Fedirchuk et al., 1999), we noticed that the short-latency component of the dorsal root-evoked response was not depressed after an episode and remained unchanged once activity had recurred in the presence of the antagonists (Fig. 10). By contrast, the long-latency component of the evoked response was modulated by the episode, as it was under control conditions. This result is consistent with the idea that the same mechanism underlies the post-episode depression and recovery of evoked potentials under GABAergic/glycinergic blockade and under control conditions.
Fig. 10.
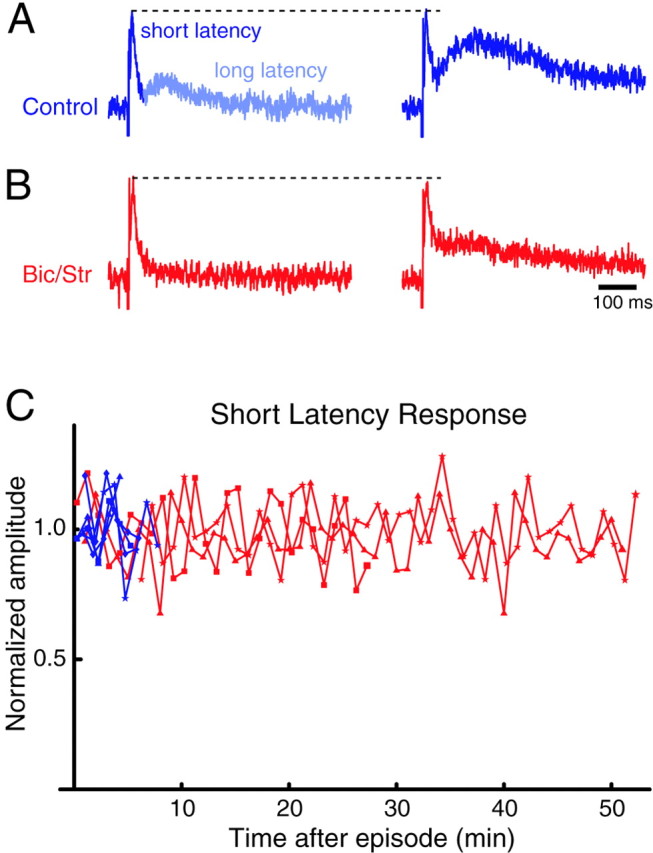
The long-latency component of the dorsal to ventral root response was modulated by activity after GABA/glycinergic blockade, whereas the amplitude of the short-latency component remained approximately constant. Traces show the response from an LS2 root in control (A, blue) and in the presence of the drugs (B, 50 μm bicuculline and 5 μm strychnine; red). The left-hand traces were obtained ∼1 min after an episode, and theright-hand traces were obtained just before the next episode. The short-latency component was not modulated by activity and was not affected by the application of the drugs. C, Normalized amplitude of the short-latency component of the evoked responses during inter-episode intervals before (blue) and after (red) drug application. Note the longer inter-episode intervals after the drugs and the relatively constant amplitude of the short-latency component during the inter-episode interval, although the long-latency component did increase (as shown in the right-hand traces of B) during the long intervals induced by the drugs.
Despite the variability in the inter-episode interval, we found that the correlations observed between inter-episode interval and episode duration were similar to those found under control conditions or under glutamatergic blockade (Fig.11). In three experiments, we found a positive correlation between episode duration and preceding interval but no correlation between episode duration and following interval. This result is consistent with our hypothesis that the basic mechanism responsible for episode generation does not alter under GABA/glycine blockade.
Fig. 11.

Relationship between episode duration and inter-episode interval during blockade of GABA/glycinergic synapses.A, Scatterplot for the preceding interval (r = 0.81). B, Following interval (r = −0.09) for the same E11 preparation.C, Summary of the median correlations generated from linear regression between the interval and the episode duration for three experiments (E9–11).
DISCUSSION
In this paper, we have provided additional evidence for our hypothesis that network excitability decreases continuously during an episode and recovers continuously during the inter-episode interval. In addition, we have demonstrated that the duration of an episode is correlated positively with the preceding but not with the following inter-episode interval. This finding implies a stochastic triggering of episodes and a deterministic termination. We have also shown that the recovery of activity under either glutamatergic or GABA/glycinergic synaptic blockade is a manifestation of the mechanism that generates spontaneous episodes under control conditions. Finally, we have demonstrated that glutamatergic or cholinergic pathways exhibit a transient activity-dependent depression of efficacy, complementing earlier work demonstrating this process at GABA/glycinergic synapses (Chub and O'Donovan, 2001).
What factors control the onset and termination of spontaneous episodes?
To investigate the excitability changes during the inter-episode interval, we evoked episodes at various times after a previously occurring spontaneous episode. We found that episode duration increased monotonically with the time from the last episode, consistent with a progressive increase in network excitability during the inter-episode interval. However, spontaneous episodes could start over a surprisingly wide range of excitability levels, as measured by the duration of episode or the preceding inter-episode interval. This finding suggests that once a critical level of excitability has been achieved episodes can start and that stochastic factors have a significant influence on episode initiation. Consistent with this hypothesis, we have shown recently that transient depolarizations can be recorded in motoneurons and interneurons during the inter-episode interval and that these depolarizations appear to trigger an episode (Wenner and O'Donovan, 2001). Such stochastic onset has also been demonstrated for spontaneous giant depolarizing potentials in the neonatal hippocampus slice (Menendez de la Prida and Sanchez-Andres, 1999).
In contrast to the stochastic initiation of episodes, our evidence suggests that episodes terminate at approximately the same level of network excitability. This was demonstrated strikingly in the presence of bicuculline and strychnine. Under this condition, the amplitude of the evoked potentials varied over a wide range at episode onset but a much narrower range just after an episode (Fig. 9B,red traces). This was also true in control conditions (data not shown) but less obvious because of the relatively small inter-episode interval variability. Furthermore, we found no correlation between episode duration and the following interval, consistent with episodes stopping at about the same level of network excitability.
If episodes do terminate once a certain level of depression has been reached, then it is perhaps surprising that the minimum amplitude of evoked synaptic potentials does not occur until ∼1 min after the end of the episode (Fedirchuk et al., 1999) (Fig. 3C). We do not know the reason for this apparent discrepancy, but it is possible that the amplitude of evoked potentials just after an episode depends on additional factors that we have not yet characterized. As a result, it may not provide an accurate estimate of network excitability just after an episode.
Mechanisms of spontaneous activity during pharmacological blockade
Previous work has shown that spontaneous network activity recovers in the presence of either glutamatergic blockade or GABA/glycinergic blockade (Barry and O'Donovan, 1987; Chub and O'Donovan, 1998). Our model demonstrated that this type of recovery is a characteristic of excitatory networks with a slow form of activity-dependent depression (Tabak et al., 2000b). The data we have presented here are consistent with this idea and suggest that the recovery of activity under glutamatergic blockade is a manifestation of the mechanism generating activity under control conditions. Several lines of evidence support this hypothesis. First, in the presence of glutamate antagonists, VR-VR potentials progressively increased in amplitude and attained a level ∼20% higher than under control conditions, as predicted by the model. This increase is an underestimate because the application of the glutamate antagonists initially reduced the VR-VR potential by 23%. We hypothesize that the increase in the amplitude of the unblocked synaptic potentials allows network excitability to recover to a level that allows the initiation and maintenance of spontaneous episodes. Second, once episodes had begun under glutamatergic blockade, the amplitudes of evoked synaptic potentials were modulated as under control conditions, except that their range was shifted upward. Finally, the pattern of correlation between the inter-episode intervals and episode duration was the same under glutamatergic blockade as it was under control conditions.
Under GABA/glycinergic blockade, spontaneous activity persisted, but the inter-episode intervals became longer and more erratic, without any evidence of recovery to control levels (Chub and O'Donovan, 1998). Although this observation might suggest that the mechanism of activity has altered under these conditions, our results suggest the contrary. First we demonstrated that the unblocked glutamatergic or cholinergic pathways were transiently depressed after an episode, as has been shown for GABA/glycinergic transmission (Chub and O'Donovan, 2001). Second, we found that the correlations between inter-episode interval and episode duration were similar to control.
Under GABAergic/glycinergic blockade, episodes could occasionally start prematurely and at an apparently lower level of network excitability than under control conditions. We do not know why this occurs, but one possibility is that an increase in the amplitude of voltage-dependent NMDA receptor-mediated currents might endow the network with a greater sensitivity to synaptic noise than under control conditions.
Comparison with other studies
Although many other developmental systems have been shown to be hyperexcitable, only in the chick embryo spinal cord has it been shown that episodes depress network excitability. In the retina, a “refractoriness” is assumed to limit wave propagation (Butts et al., 1999), but its mechanism is undetermined. Nevertheless, the pattern of correlation between episode duration and preceding interval that characterizes a mechanism on the basis of activity-dependent depression has been found in several other preparations, including the turtle retina (Grzywacz and Sernagor, 2000), hyperexcitable hippocampal slices (Staley et al., 1998), and disinhibited rat spinal cord cultures (Streit, 1993). The same pattern of correlation also seems to be present in a hippocampal gap-junctional network (Xiong et al., 2000). In some of these preparations, activity-dependent forms of depression have also been demonstrated (Streit, 1993; Staley et al., 1998). Although the physiological mechanisms for the recurrent excitatory feedback (synaptic connections or gap junctions) and for the depression (vesicle depletion, intracellular acidification, etc.) can be different, as well as the anatomy of the networks and the time scale of the activity, in each of these networks spontaneous episodic activity appears to be generated by the same basic combination of recurrent excitation and activity-dependent depression. Although the recurrent excitation renders the network bistable, the activity-dependent depression allows periodic switching between the low and high activity states (Fig. 12).
Fig. 12.

Qualitative model for spontaneous activity in hyperexcitable systems. We assume that such a system can be described by only two variables, the average activity (a) and the relative network excitability (s), and therefore any state of the system corresponds to a point in thea–s plane [for simplicity, we have not included a faster modulation of the positive feedback that is responsible for oscillations seen during an episode (Tabak et al., 2000b)]. The black S-shaped curve represents the possible activity states for each value of the positive feedback gain. There is a range of s values for which the system has several possible states, one being unstable (dashed) and representing a threshold value between the two stable states. For a given value ofs, any system with activity that is above threshold will reach the high activity state (equivalent to an episode), whereas a system with activity that is below threshold will fall to the low activity state (equivalent to the inter-episode interval). During an episode, because activity is high, network excitability declines; that is, the amount of positive feedback in the network decreases, moving the state of the system to the left as indicated by thearrowhead. For a critical value of s, only the low activity state persists, and the network falls back to low activity: this is the end of the episode. Network excitability can then recover, so the system state moves toward the right (arrowhead on low activity state). In the actual spinal network there are transient depolarizations in motoneurons and interneurons that may arise from the random coincidence of interneuronal spiking (Wenner and O'Donovan, 2001). Such events are represented in the diagram by the small vertical lineslabeled activity transients on the low activity state. When the maximum amplitude of such events becomes above threshold after sufficient recovery of the network, some of these events can trigger an episode. Because of the random nature of these events, there is no unique value of s for which episodes will occur, but rather a range of values. In the diagram, this range spans the point at which the maximum transient amplitude line crosses the threshold curve to the point at which the low activity state and the threshold curves coincide (gray segment ofabscissa). When the low activity state reaches threshold, even the slightest amount of noise will trigger an episode. Because episodes stop at a unique value of s, episodes that start after a longer inter-episode interval will have a longer duration. That is, the length of the episode is determined by the value of s at which an episode starts, and it does not affect the terminating value of s. As a result, episode length is correlated with the previous inter-episode duration and not the following one.
Although our model is deterministic, Figure 12 shows how random network events (transients) might trigger episodes at different time points. Such transients have been observed recently in chick spinal neurons, and they have been shown to increase in amplitude during the inter-episode interval (Chub and O'Donovan, 2001; Wenner and O'Donovan, 2001). Figure 12 illustrates that the amplitude of the transients (height of lines on low activity state) must reach threshold to trigger an episode. Because the amplitude of the transients varies randomly and increases during the inter-episode interval, episodes will be triggered only in the latter part of the inter-episode interval. However, the precise time of initiation will depend on the amplitude of the transient and whether it crosses threshold. Adding such random events to our model produced a pattern of correlation similar to the one observed experimentally.
Although we have been able to experimentally confirm several predictions of our model, a number of additional predictions remain to be tested. For example, the model predicts that it should be possible to terminate episodes prematurely be applying a “negative” transient that reaches threshold (for the low activity state) from the high activity state. This would result in a positive correlation between the duration of the artificially terminated episodes and the following intervals, because when an episode is artificially shortened, the level of network depression will be correspondingly less; therefore, it will take less time for the level of excitability (s value) to recover to the range where another episode may start. Another model prediction is that the threshold for triggering an episode should progressively decrease during the inter-episode interval as network excitability increases. This could be tested experimentally by estimating the threshold for episode initiation using external stimuli applied at various times during the inter-episode interval.
Self-regulation of spontaneous network activity: possible significance
Our results suggest that the mechanism that generates spontaneous activity in the spinal cord is self regulating and can compensate for externally induced changes in connectivity. Although few studies so far have investigated how the temporal pattern of activity influences circuit development (Fields et al., 1990; Gu and Spitzer, 1995; Li et al., 1996; Buonanno and Fields, 1999), they suggest that it might be important to conserve a given pattern or a particular frequency of network activation. In addition, it has been found that synaptic and cellular properties can adjust to compensate for synaptic blockade (Turrigiano et al., 1998; Desai et al., 1999; Galante et al., 2000; Baines et al., 2001), with possibly long-term mechanisms involving neurotrophins. In the developing chick spinal cord, the very mechanism of activity generation provides a substantial degree of stability by setting the level of depression in the network.
Footnotes
J.R. acknowledges the support of the Laboratory of Neural Control, National Institute of Neurological Diseases and Stroke, which facilitated his participation in this project. We thank Nikolai Chub, Uri Cohen, Jessica Exelbert, and Peter Wenner for their help and interest in this work.
Correspondence should be addressed to Dr. Joël Tabak, Laboratory of Neural Control, Section on Developmental Neurobiology, National Institute of Neurological Disorders and Stroke, National Institutes of Health, Bethesda, MD 20892. E-mail:joel@spine.ninds.nih.gov.
REFERENCES
- 1.Baines RA, Uhler JP, Thompson A, Sweeney ST, Bate M. Altered electrical properties in Drosophila neurons developing without synaptic transmission. J Neurosci. 2001;21:1523–1531. doi: 10.1523/JNEUROSCI.21-05-01523.2001. [DOI] [PMC free article] [PubMed] [Google Scholar]
- 2.Buonanno A, Fields RD. Gene regulation by patterned electrical activity during neural and skeletal muscle development. Curr Opin Neurobiol. 1999;9:110–120. doi: 10.1016/s0959-4388(99)80014-2. [DOI] [PubMed] [Google Scholar]
- 3.Cherubini E, Gaiarsa JL, Ben-Ari Y. GABA: an excitatory transmitter in early postnatal life. Trends Neurosci. 1991;14:515–519. doi: 10.1016/0166-2236(91)90003-d. [DOI] [PubMed] [Google Scholar]
- 4.Chub N, O'Donovan MJ. Blockade and recovery of spontaneous rhythmic activity after application of neurotransmitter antagonists to spinal networks of the chick embryo. J Neurosci. 1998;18:294–306. doi: 10.1523/JNEUROSCI.18-01-00294.1998. [DOI] [PMC free article] [PubMed] [Google Scholar]
- 5.Chub N, O'Donovan MJ. Na+/K+/2Cl− cotransporters are required for the recovery of spontaneous activity during glutamatergic blockade in chick embryo spinal cord. Soc Neurosci Abstr. 2000;26:1443. [Google Scholar]
- 6.Chub N, O'Donovan MJ. Post-episode depression of GABAergic transmission in spinal neurons of the chick embryo. J Neurophysiol. 2001;85:2166–2176. doi: 10.1152/jn.2001.85.5.2166. [DOI] [PubMed] [Google Scholar]
- 7.Desai NS, Rutherford LC, Turrigiano GG. Plasticity in the intrinsic excitability of cortical pyramidal neurons. Nat Neurosci. 1999;2:515–520. doi: 10.1038/9165. [DOI] [PubMed] [Google Scholar]
- 8.Fedirchuk B, Wenner P, Whelan PJ, Ho S, Tabak J, O'Donovan MJ. Spontaneous network activity transiently depresses synaptic transmission in the embryonic chick spinal cord. J Neurosci. 1999;19:2102–2112. doi: 10.1523/JNEUROSCI.19-06-02102.1999. [DOI] [PMC free article] [PubMed] [Google Scholar]
- 9.Feller MB, Wellis DP, Stellwagen D, Werblin FS, Shatz CJ. Requirement for cholinergic synaptic transmission in the propagation of spontaneous retinal waves. Science. 1996;272:1182–1187. doi: 10.1126/science.272.5265.1182. [DOI] [PubMed] [Google Scholar]
- 10.Feller MB, Butts DA, Aaron HL, Rokhsar DS, Shatz CJ. Dynamic processes shape spatiotemporal properties of retinal waves. Neuron. 1997;19:293–306. doi: 10.1016/s0896-6273(00)80940-x. [DOI] [PubMed] [Google Scholar]
- 11.Fields RD, Neale EA, Nelson PG. Effects of patterned electrical activity on neurite outgrowth from mouse sensory neurons. J Neurosci. 1990;10:2950–2964. doi: 10.1523/JNEUROSCI.10-09-02950.1990. [DOI] [PMC free article] [PubMed] [Google Scholar]
- 12.Fisher KF, Lukasiewicz PD, Wong ROL. Age-dependent and cell class-specific modulation of retinal ganglion cell bursting activity by GABA. J Neurosci. 1998;18:3767–3778. doi: 10.1523/JNEUROSCI.18-10-03767.1998. [DOI] [PMC free article] [PubMed] [Google Scholar]
- 13.Fortin G, Champagnat J, Lumsden A. Onset and maturation of branchio-motor activities in the chick hindbrain. NeuroReport. 1994;5:1149–1152. doi: 10.1097/00001756-199405000-00032. [DOI] [PubMed] [Google Scholar]
- 14.Galante M, Nistri A, Ballerini L. Opposite changes in synaptic activity of organotypic rat spinal cord cultures after chronic block of AMPA/kainate or glycine and GABAA receptors. J Physiol (Lond) 2000;523:639–651. doi: 10.1111/j.1469-7793.2000.t01-1-00639.x. [DOI] [PMC free article] [PubMed] [Google Scholar]
- 15.Grzywacz N, Sernagor E. Spontaneous activity in developing turtle retinal ganglion cells. Vis Neurosci. 2000;17:229–241. doi: 10.1017/s0952523800172050. [DOI] [PubMed] [Google Scholar]
- 16.Gu X, Spitzer NC. Distinct aspects of neuronal differentiation encoded by frequency of spontaneous Ca2+ transients. Nature. 1995;375:784–787. doi: 10.1038/375784a0. [DOI] [PubMed] [Google Scholar]
- 17.Ho S, O'Donovan MJ. Regionalization and intersegmental coordination of rhythm-generating networks in the spinal cord of the chick embryo. J Neurosci. 1993;13:1354–1371. doi: 10.1523/JNEUROSCI.13-04-01354.1993. [DOI] [PMC free article] [PubMed] [Google Scholar]
- 18.Lee MT, Koebbe MJ, O'Donovan MJ. The development of sensorimotor synaptic connections in the lumbosacral cord of the chick embryo. J Neurosci. 1988;8:2530–2543. doi: 10.1523/JNEUROSCI.08-07-02530.1988. [DOI] [PMC free article] [PubMed] [Google Scholar]
- 19.Leinekugel X, Medina I, Khalilov I, Ben-Ari Y, Khazipov R. Ca2+ oscillations mediated by the synergistic excitatory actions of GABA(A) and NMDA receptors in the neonatal hippocampus. Neuron. 1997;18:243–255. doi: 10.1016/s0896-6273(00)80265-2. [DOI] [PubMed] [Google Scholar]
- 20.Li M, Jia M, Fields RD, Nelson PG. Modulation of calcium currents by electrical activity. J Neurophysiol. 1996;76:2595–2607. doi: 10.1152/jn.1996.76.4.2595. [DOI] [PubMed] [Google Scholar]
- 21.Meister M, Wong ROL, Baylor DA, Shatz CJ. Synchronous bursts of action potentials in ganglion cells of the developing mammalian retina. Science. 1991;252:939–943. doi: 10.1126/science.2035024. [DOI] [PubMed] [Google Scholar]
- 22.Menendez de la Prida L, Sanchez-Andres JV. Nonlinear frequency-dependent synchronization in the developing hippocampus. J Neurophysiol. 1999;82:202–208. doi: 10.1152/jn.1999.82.1.202. [DOI] [PubMed] [Google Scholar]
- 23.Milner LD, Landmesser LT. Cholinergic and GABAergic inputs drive patterned spontaneous motoneuron activity before target contact. J Neurosci. 1999;19:3007–3022. doi: 10.1523/JNEUROSCI.19-08-03007.1999. [DOI] [PMC free article] [PubMed] [Google Scholar]
- 24.Nishimaru H, Iizuka M, Ozaki S, Kudo N. Spontaneous activity mediated by glycine and GABA in the spinal cord of rat fetuses in vitro. J Physiol (Lond) 1996;497:131–143. doi: 10.1113/jphysiol.1996.sp021755. [DOI] [PMC free article] [PubMed] [Google Scholar]
- 25.O'Donovan MJ, Landmesser LT. The development of hindlimb motor activity studied in the isolated spinal cord of the chick embryo. J Neurosci. 1987;7:3256–3264. doi: 10.1523/JNEUROSCI.07-10-03256.1987. [DOI] [PMC free article] [PubMed] [Google Scholar]
- 26.Sernagor E, Chub N, Ritter A, O'Donovan MJ. Pharmacological characterization of the rhythmic synaptic drive onto lumbosacral motoneurons in the chick embryo spinal cord. J Neurosci. 1995;15:7452–7464. doi: 10.1523/JNEUROSCI.15-11-07452.1995. [DOI] [PMC free article] [PubMed] [Google Scholar]
- 27.Staley KJ, Longacher M, Bains JS, Yee A. Presynaptic modulation of CA3 network activity. Nat Neurosci. 1998;1:201–209. doi: 10.1038/651. [DOI] [PubMed] [Google Scholar]
- 28.Streit J. Regular oscillations of synaptic activity in spinal networks in vitro. J Neurophysiol. 1993;70:871–878. doi: 10.1152/jn.1993.70.3.871. [DOI] [PubMed] [Google Scholar]
- 29.Tabak J, O'Donovan MJ. Statistical analysis and intersegmental delays reveal possible roles of network depression in the generation of spontaneous activity in the chick embryo spinal cord. Ann NY Acad Sci. 1998;860:428–431. doi: 10.1111/j.1749-6632.1998.tb09067.x. [DOI] [PubMed] [Google Scholar]
- 30.Tabak J, Rinzel J, O'Donovan MJ. Network plasticity following glutamatergic blockade linked to synaptic depression. Soc Neurosci Abstr. 2000a;26:454. [Google Scholar]
- 31.Tabak J, Senn W, O'Donovan MJ, Rinzel J. Modeling of spontaneous activity in the developing spinal cord using activity-dependent depression in an excitatory network. J Neurosci. 2000b;20:3041–3056. doi: 10.1523/JNEUROSCI.20-08-03041.2000. [DOI] [PMC free article] [PubMed] [Google Scholar]
- 32.Turrigiano GG, Leslie KR, Desai NS, Rutherford LC, Nelson SB. Activity-dependent scaling of quantal amplitude in neocortical neurons. Nature. 1998;391:892–895. doi: 10.1038/36103. [DOI] [PubMed] [Google Scholar]
- 33.Wenner P, O'Donovan MJ. Identification of an interneuronal population that mediates recurrent inhibition of motoneurons in the developing chick spinal cord. J Neurosci. 1999;19:7557–7567. doi: 10.1523/JNEUROSCI.19-17-07557.1999. [DOI] [PMC free article] [PubMed] [Google Scholar]
- 34.Wenner P, O'Donovan MJ. Mechanisms that initiate spontaneous network activity in the developing chick spinal cord. J Neurophysiol. 2001;86:1481–1498. doi: 10.1152/jn.2001.86.3.1481. [DOI] [PubMed] [Google Scholar]
- 35.Xiong Z-Q, Saggau P, Stringer JL. Activity-dependent intracellular acidification correlates with the duration of seizure activity. J Neurosci. 2000;20:1290–1296. doi: 10.1523/JNEUROSCI.20-04-01290.2000. [DOI] [PMC free article] [PubMed] [Google Scholar]