

Abstract
The low-threshold spike (LTS), generated by the transient Ca2+ current IT, plays a pivotal role in thalamic relay cell responsiveness and thus in the nature of the thalamic relay. By injecting depolarizing current ramps at various rates to manipulate the slope of membrane depolarization (dV/dt), we found that an LTS occurred only if dV/dt exceeded a minimum value of ∼5–12 mV/sec. We injected current ramps of variable dV/dt into relay cells that were sufficiently hyperpolarized to de-inactivateIT completely. Higher values of dV/dt activated an LTS. However, lower values of dV/dt eventually led to tonic firing without ever activating an LTS; apparently, the inactivation ofIT proceeded beforeIT could be recruited. Because the maximum rate of rise of the LTS decreased with slower activating ramps of injected current, we conclude that slower ramps allow increasing inactivation of IT before the threshold for its activation gating is reached, and when the injected ramps have a sufficiently low dV/dt, the inactivation is severe enough to prevent activation of an LTS. In the presence of Cs+, we found that even the lowest dV/dt that we applied led to LTS activation, apparently because Cs+ reduced the K+ “leak” conductance and increased neuronal input resistance. Nonetheless, under normal conditions, our data suggest that there is neither significant window current (related to the overlap of the inactivation and activation curves forIT), rhythmogenic properties, nor bistability properties for these neurons. Our theoretical results using a minimal model of LTS excitability in these neurons are consistent with the experimental observations and support our conclusions. We suggest that inputs activating very slow EPSPs (i.e., via metabotropic receptors) may be able to inactivateIT without generating sizableIT and a spurious burst of action potentials to cortex.
Keywords: low-threshold spike, thalamus, burst firing, T channel, window current, lateral geniculate nucleus
The voltage-dependent, low-threshold, transient Ca2+ current, known as IT, is a ubiquitous property found in all thalamic relay cells of all thalamic nuclei in all mammalian species tested to date (Deschênes et al., 1984; Jahnsen and Llinás, 1984a,b; Crunelli et al., 1989; Bal et al., 1995). The status of IT is controlled by a complex combination of voltage and time (Jahnsen and Llinás, 1984a,b; Zhan et al., 1999). IT is inactivated when the membrane is maintained at a level more depolarized than approximately −60 to −65 mV for 50–100 msec. This inactivation is removed (i.e., IT is de-inactivated) by sustaining a hyperpolarization more than approximately −65 to −70 mV for 50–100 msec. If IT is inactivated when the cell is sufficiently depolarized, such as by a large EPSP, the cell responds with a stream of unitary action potentials that characterizes tonic firing. If, instead,IT is de-inactivated when a large transient EPSP is evoked, then IT is recruited, producing a large, transient Ca2+ depolarization known as the low-threshold spike (LTS). A high-frequency cluster of several action potentials usually rides the crest of the LTS, and this characterizesburst firing. Both tonic and burst firing are effective relay modes during normal waking behavior (Guido and Weyand, 1995; Lenz et al., 1998; Radhakrishnan et al., 1999; Ramcharan et al., 2000), and the two modes represent different forms of transmission of information to cortex (Sherman, 1996; Reinagel et al., 1999).IT is thus an important property of thalamic functioning that needs to be better understood.
One unresolved issue is whether a minimum rate of membrane depolarization is required to activate an LTS. The activation and inactivation curves for IT overlap across a limited range of membrane potentials, and it has been suggested that when the membrane potential of a cell is within this range,IT is generated in a sustained manner, producing a “window current” (Coulter et al., 1989). A sizableIT window current can underlie resonant or rhythmogenic behavior in thalamic and other neurons and models (Puil and Carlen, 1984; Wang et al., 1991). It can also lead to an N-shaped steady-state current–voltage relation that, in turn, can lead to “bistability” (Williams et al., 1997; Hughes et al., 1999). That is, for some range of input current (between the “knees” of the N) the membrane potential of the cell will sit stably on the right or left “leg” of the N but not on the middle “leg.” The presence of a window current argues that there is no minimum rate of depolarization that must be exceeded to generateIT. However, it was reported recently that very low frequencies of sinusoidal current injection failed to activate an LTS, whereas higher (but not too high) frequencies of the same amplitude reliably activated an LTS (Smith et al., 2000). This suggests that a minimum rate of depolarization must be exceeded to generateIT.
To resolve this question, we studied LTS activation (and indirectlyIT generation) in thalamic relay cells via intracellular injection of current ramps that varied in their rate of depolarization. We found that, under normal circumstances, the rate of rise of the evoked voltage must exceed a minimum value to activate an LTS, and this has implications also for the presence of anIT window current, rhythmogenesis, and bistability.
MATERIALS AND METHODS
General methodology. General methods for tissue preparation were similar to those used routinely in our laboratory (Cox et al., 1998). Briefly, cats (4–8 weeks old) were deeply anesthetized with an intramuscular injection of ketamine (25 mg/kg) and xylazine (1 mg/kg). A craniotomy was made overlying the thalamus, and a block of tissue containing the lateral geniculate nucleus was removed and placed in a cold oxygenated solution containing (in mm): 2.5 KCl, 1.25 NaH2PO4, 10.0 MgCl2, 26.0 NaHCO3, 11.0 glucose, and 234.0 sucrose. The tissue block was then sliced into 400-μm-thick sections in either the coronal or sagittal plane. The slices were placed in a holding chamber with artificial CSF (ACSF) containing (in mm): 126.0 NaCl, 2.5 KCl, 1.25 NaH2PO4, 2.0 MgCl2, 2.0 CaCl2, 26.0 NaHCO3, and 10.0 glucose; slices were gassed with 95% O2 and 5% CO2 to a final pH of 7.4. After incubation for at least 2 hr, individual slices were transferred to an interface-style recording chamber that was maintained at 32 ± 1°C and through which ACSF continually flowed at a rate of 1–1.5 ml/min.
Intracellular recordings were obtained from relay cells from the lateral geniculate nucleus by use of the whole-cell configuration. Recording pipettes had a tip resistance of 4–8 MΩ when filled with the following intracellular solution (in mm): 117 K-gluconate, 13 KCl, 1.0 MgCl2, 0.07 CaCl2, 0.1 EGTA, and 10.0 HEPES. Current-clamp recordings were made with an Axoclamp 2A amplifier (Axon Instruments, Foster City, CA), and the bridge was continually monitored and adjusted to compensate for membrane potential changes caused by the passage of current through the recording electrode throughout each experiment. Data were digitized and stored on an IBM-compatible computer and videotape for off-line analyses. A 10 mV correction for the junction potential was applied to the membrane potential of all cells during data analysis (Hagiwara and Ohmori, 1982).
The model. Our experimental observations (see Results) (Zhan et al., 1999) demonstrated that the basic response properties of Ca2+ spikes were similar in the presence or absence of TTX (Jahnsen and Llinás, 1984a,b;Hernández-Cruz and Pape, 1989). Thus, as before (Zhan et al., 1999), we use a minimal Hodgkin-Huxley type of model that neglects the primary currents involved in generating and shaping action potentials. Our model includes those currents that we believe capture the essence of our observed activation of Ca2+spikes.
The current balance equation is:
where IT is the “T-type” low-threshold Ca2+ current,IA is a transient K+ current,Ih is the hyperpolarization-activated “sag” current, the leakage components (IK-leak andINa-leak) are ohmic,Iapp represents any current injected into the cell, V is membrane potential (in millivolts),t is time (in milliseconds), and C is total capacitance, equal to 290 pF, corresponding to a cell model with a surface membrane area of 29,000 μm2. We used the formulations for IT,IA, and Ihfound in the computer program Cclamp of Huguenard and McCormick (1994)and based on their previous voltage-clamp data (summarized in McCormick and Huguenard, 1992). The model uses the Goldman-Hodgkin-Katz formulation for IT as:
where PT is the maximum permeability of an open channel (30 cm3/sec); z = 2; Caint and Caext are the concentrations of Ca2+ inside and outside the cell, respectively (assumed fixed in our model at 50 nm and 2 mm, respectively); and F, R, and T are Faraday's constant, the gas constant, and absolute temperature, respectively (Hille, 1992). The transient K+ current is given by:
with the reversal potential VK= −105 mV and gA = 2 μS unless stated otherwise. The sag current is given by:
with the reversal potentialVh = −40 mV. As noted in Results, the conductance gh was quite small (<1 nS) for the relay cells of the cat's lateral geniculate nucleus under study here. The leakage currents are given by:
and:
where gNa-leak = 2.65 nS,gK-leak = 7 nS, andVNa = 45 mV. The general form for the gating dynamics of the voltage-gated channels is:
where x = mT,hT, mA,hA, or r with:
The specific parameter values (in millivolts) are:
and
and the “time-constant” functions are:
and:
We adjusted the gating rates to 33.5°C from Cclamp's set condition of 23.5°C by using a temperature correction factor, θ, of 3.
All computed results shown here were obtained with the above minimal model by use of the software XPPAUT (found athttp://www.pitt. edu/∼phase/). For numerical integration we used the fourth-order, adaptive-step Runge-Kutta method in XPPAUT (with error tolerance, 10−5). Computations were performed on a Linux/Unix Pentium II workstation.
RESULTS
Experimental observations
We recorded from 33 neurons of the cat's lateral geniculate nucleus. All of these neurons exhibited overshooting action potentials; their resting membrane potentials were −63 ± 7.1 mV (here and below, this refers to the mean ± SD), and their input resistances were 105 ± 32.5 MΩ. On the basis of electrophysiological criteria, including the presence of LTSs and relatively small depolarizing sag responses (see below) to hyperpolarizing pulses, these were all deemed to be relay cells. For further confirmation of relay cell recordings, five of the neurons were filled with biocytin and after the recording were visualized after histological processing. All five cells exhibited the characteristic morphology of relay cells rather than interneurons (Guillery, 1966; Friedlander et al., 1981). Of the overall sample of 33 cells, 13 were studied strictly as controls (i.e., without additional drugs), 1 was studied also in the presence of TTX, and the remaining 6 were studied also in the presence of Cs+.
Effect of rate of depolarization on activation of low-threshold spikes
Activation of LTSs in geniculate relay cells can readily be accomplished by depolarizing the neuron after it has been sufficiently hyperpolarized to de-inactivate IT. Here, we were especially interested in activatingIT and the LTS with current injected to depolarize the cell at various rates. To do this, we used depolarizing current ramps for which we varied the rate of rise of the ramp (or dV/dt) while keeping the initial and final depolarization constant. In other words, the final amplitude of current injected was kept constant, but the duration of the ramp was varied between 0.8 and 20 sec. To ensure full de-inactivation ofIT, the geniculate neurons were hyperpolarized to membrane potentials more hyperpolarized than −80 mV before the application of current ramps. These ramps depolarized the cells sufficiently to pass through the zone ofIT activation and, with rare exceptions, continued to depolarize the cells sufficiently to evoke tonic firing in the absence of TTX.
Figure 1 shows a typical experiment performed in a geniculate relay cell before TTX application. Four current ramps were injected into the cell, with dV/dt decreasing from top tobottom (i.e., Fig. 1, from A to D). Note that in all cases, tonic firing was eventually evoked when the depolarizing ramp reached the threshold for action potentials. However, LTSs were evoked only from the faster ramps (Fig.1A,B) and not from the slower ones (Fig.1C,D). Furthermore, there is not even a hint that the slower ramps activate any IT in the voltage region in which LTSs are evoked from faster ramps. That is, there is no discernable “bump” indicative of a subthreshold LTS (but see below). Thus, with a sufficiently low dV/dt, the firing mode of this cell was switched from burst to tonic without activating a burst. In other words, it is possible with a sufficiently low value of dV/dt to start with completely de-inactivated IT and then to proceed to inactivate IT without ever activating an LTS. This failure to evoke LTSs and thusIT from sufficiently low depolarizing values of dV/dt was seen in every one of the 33 relay cells we studied. All 33 cells showed a fairly sharp and repeatable threshold for the minimum dV/dtneeded to activate an LTS in individual cells, and the mean ± SD of the threshold dV/dt was 9.1 ± 3.5 mV/sec. We found no correlation between the threshold dV/dt and neuronal input resistance (p > 0.1). Each of the following figures illustrates this in a different geniculate relay cell to emphasize the generality of this observation.
Fig. 1.
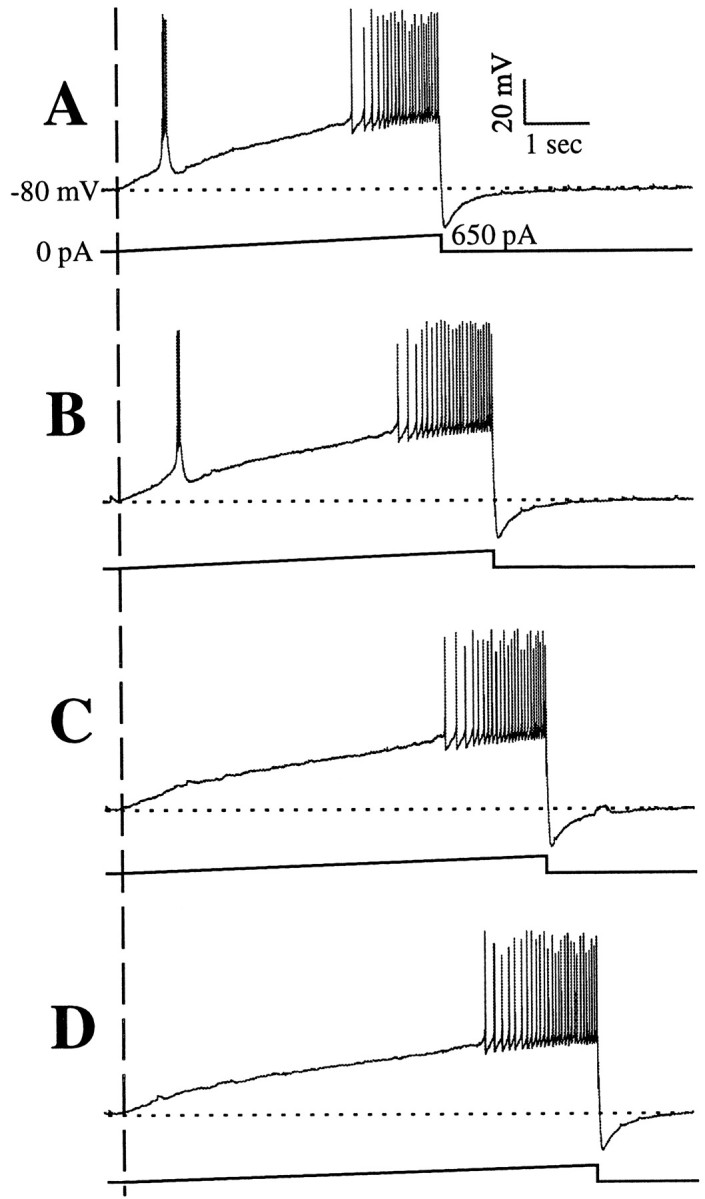
Responses of a geniculate cell (top trace of each panel) to injected current ramps (bottom trace of each panel). The vertical dashed line shows the beginning of each ramp, which culminated in 650 nA of injected current. The initial holding potential in each case was −80 mV (indicated by the horizontal dotted line), and each response ended with tonic firing. A–D, Series of ramps of increasing duration and thus decreasing dV/dt. The faster ramps ofA and B activated LTSs and associated bursts of action potentials, whereas the slower ramps ofC and D failed to activate LTSs.
To analyze quantitatively the voltage response to the current ramps, three different measurements were calculated: the slope of depolarization (dV/dt), the maximum rate of rise of the LTS, and LTS threshold. Because measurements of the maximum rate of rise of the LTS might be compromised by the presence of action potentials, these measurements were limited to the 14 cells studied in the presence of TTX. The measures of dV/dt and LTS threshold were made on all cells.
Figure 2 illustrates how these measures were made in a cell studied in the presence of TTX. First, we obtained the voltage response of the cell to the injected current ramp (Fig.2A) and temporally differentiated it (Fig.2B). In the differentiated trace, a baseline voltage was established in the region before onset of the current ramp (Fig. 2, between vertical lines 1 and 2, with line 2 marking the beginning of the current ramp). The upper and lower confidence limits encompassing 95% of all data points in the baseline region were then calculated. We defined LTS threshold in all cells as the first of at least five consecutive voltage points sampled at 200 Hz (for the illustrated cell, sampling ranged between 200 and 400 Hz) for which the differentiated trace exceeded the upper confidence limit (Fig. 2, vertical line 3). The dV/dt was calculated from a linear regression of the voltage response between vertical lines 2and 3 in Figure 2A. The correlation coefficients of the regression lines ranged between 0.97 and 0.99, indicating that the voltage response during this time was quite linear. Finally, the maximum rate of rise of the LTS was determined from the differentiated trace (Fig. 2B, arrow).
Fig. 2.

Determination of LTS threshold, LTS amplitude, and dV/dt. A, Voltage response (top trace) to injection of current ramp (bottom trace) to a cell in the presence of TTX. B, Differentiated voltage trace in A. The region bounded bylines 1 and 2 indicates the baseline response (in which no current was passed) and in which the upper 95% confidence limit was determined (see text for details). The LTS threshold was determined by extrapolating this confidence limit to the point at which 5 consecutive bins in the differentiated trace exceeded it. This point, indicated by line 3, provides the estimate of the LTS threshold. The slope (dV/dt) of the voltage response was then measured from the onset of the current injection (line 2) to the LTS threshold (line 3). Finally, the amplitude of the LTS was made by subtracting the voltage at the peak of the LTS by the voltage of the extrapolated gray lineunder the peak (arrows in A).
Figure 3, A and B, shows the responses evoked from current ramps of differing dV/dt values in another geniculate relay cell before and after TTX application. Both with and without TTX, ramps with a faster dV/dt activated low-threshold spikes (Fig. 3A,B, top three traces), whereas those with a slower dV/dt did not (Fig. 3A,B,bottom two traces). Note that occasionally more than one LTS was evoked (Fig. 3A, second trace fromtop); we saw evidence of double and triple LTSs in 12 of the 33 cells studied.
Fig. 3.

Voltage responses to ramps of injected current before and during TTX application. Conventions are as described in Figure 1. A, Responses before TTX application. Faster ramps (top 3 traces) activate LTSs, but slower ramps (lower 2 traces) do not. B, Responses during TTX application. Faster ramps (top 3 traces) activate LTSs, but slower ramps (lower 2 traces) do not.C, Relationship between LTS amplitude and depolarizing slope for data in B. D, E, Relationship between LTS amplitude and depolarizing slope for two other geniculate cells. Max, Maximum.
Figure 3C plots, for the cell illustrated in Figure 3,A and B, the relationship between the maximum rate of rise of the LTS (measured in the presence of TTX) and the dV/dt resulting from the injected current ramp. Figure 3, D and E, plots the same relationship for two other geniculate relay cells. In each of these examples, there is a significant positive correlation between the dV/dt of the ramp and the maximum rate of rise of the LTS. Overall, the relationships shown in Figure3C–E were representative of the 14 cells studied in this manner in the presence of TTX; of these, 12 had a highly significant correlation (p < 0.001 or p < 0.01), 1 had a relationship that was close to significance (0.1 >p > 0.05), and only 1 had a relationship that was clearly insignificant (p > 0.1). A lower value for the maximum rate of rise of the LTS indicates that there is more inactivation of IT, and the correlation of this with dV/dt suggests that slower values of dV/dt produce more inactivation of IT before activation of an LTS. We thus conclude that the reason that even lower values of dV/dt fail to activate an LTS is because these permit enough IT inactivation to leave an insufficient number of de-inactivated T channels to support an LTS.
We noticed that the transition from a dV/dt that was subthreshold for activating an LTS to a suprathreshold one was not only sharp but in most cases the LTS varied little in amplitude after being activated (see Zhan et al., 1999). We found such an activation of the LTS in response to ramps in 21 of the 33 cells (see also Fig.4A). In the remaining 12 cells, the LTS amplitude appeared to be graded over a narrow range of dV/dt values near threshold (see Fig.4B). However, although not illustrated here, partial LTSs such as those illustrated in Figure 4B were not reliably evoked, because repeated trials with the same dV/dt might evoke no partial LTS at all, and this is in contrast to the extremely reliable full-blown LTSs activated at greater dV/dt values.
Fig. 4.

Responses of two different geniculate cells in TTX to injected ramps producing slower dV/dt values fromleft to right. A, Cell showing all-or-none LTS to faster ramps (6 traces on theleft) and no LTS to slower ones. B, Cell showing a partial LTS (4th trace fromleft) as a transition between all-or-none LTSs (3 traces on the left) and no discernable LTS (6 traces on the right).
Thresholds for low-threshold spikes
Figure 5A shows another example of a geniculate relay cell with LTSs being activated only by ramps with higher values of dV/dt. In this example, the threshold for activating the low-threshold spike (Fig.5A, arrows; see also Fig. 2) is remarkably constant (ranging <5 mV) despite the varying dV/dt values of the ramps. Among all cells observed (n = 22), the LTS thresholds varied <10 mV. For this same cell, Figure 5B shows the scatter plot of dV/dt versus voltage threshold for activation of the low-threshold spike, and Figure 5, C andD, shows this relationship for two other geniculate relay cells. The LTS thresholds for the cells in Figure 5, B andC, appeared to be independent of the slope of the depolarization. This observation was true for 18 of 22 cells. For the remaining four cells, there was a significant negative correlation between dV/dt and LTS threshold (e.g., Fig. 5D). Why only some cells showed such a correlation is unclear, but it is worth emphasizing that, in any given cell, the range of voltage thresholds was quite small.
Fig. 5.

Reliability of LTS thresholds with different current ramps. A, Responses of a geniculate cell to injected current ramps producing lower dV/dt values fromleft to right. Arrowsindicate the threshold for each LTS (see Fig. 2 for how these were determined). B, Relationship between slope of the voltage ramp and threshold for activating the LTS for the cell illustrated in A. Only slopes fast enough to activate an LTS are considered. C, D, Plots as in Bfor two other geniculate cells.
Effect of the K-leak conductance and/orIA on activation of low-threshold spikes
It has been argued that there is a range of membrane potentials for thalamic relay cells in which the activation and inactivation curves for IT overlap (see introductory remarks) (see also Coulter et al., 1989; Williams et al., 1997). If so, then a relay cell with a membrane potential within that voltage range should experience this window current and the regenerative nature of IT. If this voltage range and window current are large enough, the cell should fire repeated, spontaneous LTSs or exhibit bistability. If a significant window current existed, we should expect to see evidence of it in all of our ramps, including those with a dV/dt too low to activate an LTS. As noted above, the slowest ramps for each cell that failed to evoke an LTS also failed to show any sort of irregularity in the voltage response as the threshold for the LTS was crossed, so that any IT or window current that might have been activated as we traversed the critical voltage range was either too small to be detected or masked by other currents.
Nonetheless, several recent studies suggest that thalamic relay cells do have a window current that leads to bistability in membrane properties (Williams et al., 1997; Hughes et al., 1999) However, this bistability was dependent on a relatively high apparent input resistance, consistent with a very small resting K-leak conductance and attenuation of the hyperpolarization-activated mixed cation currentIh (Williams et al., 1997). We have tried to test this idea for six geniculate relay cells by adding a relatively low concentration of Cs+ (2–10 mm) to the bathing solution during the recordings to block both K+ channels, therefore blocking the K-leak conductance and IA(McCormick and Pape, 1990) and also increasing input resistance; this also blocks Ih (McCormick and Pape, 1990). For the six cells we studied, the mean input resistance was elevated by Cs+ from 115 to 142 MΩ, or by 23%.
We repeated the ramp protocols before and during exposure to Cs+ in six geniculate relay cells (Fig.6). In control conditions, we repeated our typical result: larger dV/dt values evoked an LTS (Fig. 6A, top three traces), whereas smaller ones did not (Fig. 6A, bottom two traces). In the presence of Cs+(6 mm), the smallest dV/dt still evoked LTSs, and typically several LTSs were evoked (Fig. 6Bi). Ramps with even smaller dV/dt values continued to evoke LTSs (Fig. 6Bii,iii), and indeed, we never were able to ramp the injected current slowly enough to avoid activation of LTSs.
Fig. 6.
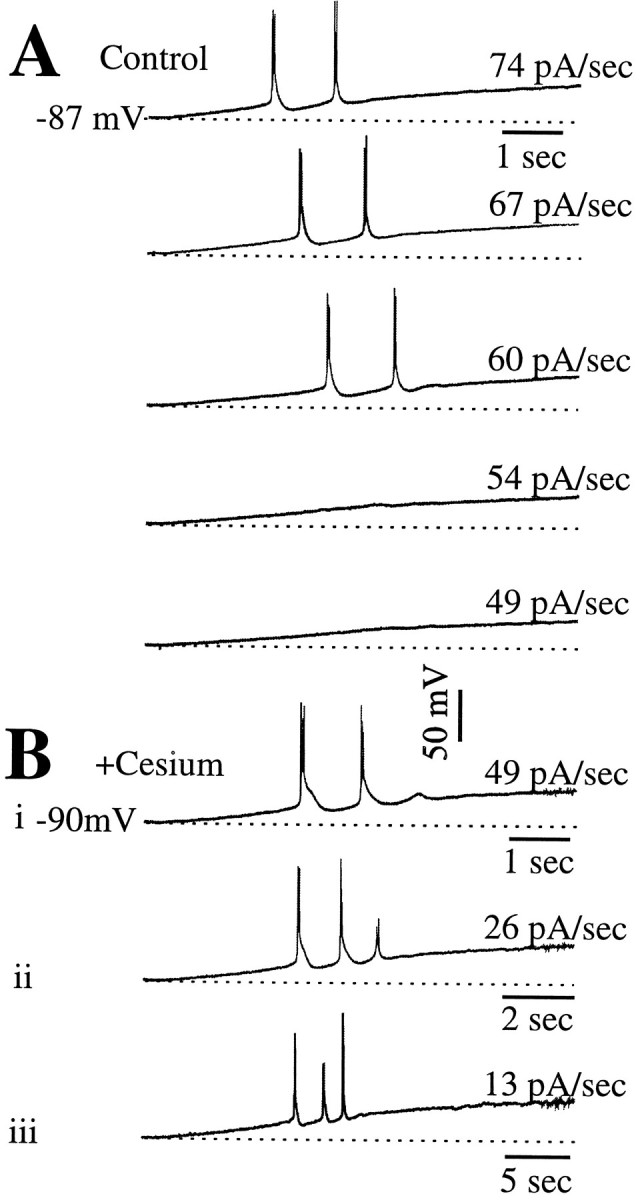
Effect of Cs+ on activation of LTSs. A, Responses of a geniculate cell before application of Cs+. The rate of the ramp is indicated to the right of each trace. As in other cells, only faster ramps activate LTSs. B, i–iii, Responses of the same cell to ramps after application of Cs+. Now, even the smallest dV/dt values that we applied activated LTSs, and these included dV/dt values much slower than those used before Cs+ application.
Our observations suggest that it may be possible in a thalamic relay cell under physiological conditions to inactivateIT without activating an LTS if the cell is depolarized slowly enough. Depolarization is normally achieved via synaptically generated EPSPs, but the typical EPSP activated via ionotropic receptors seems too fast to prevent activation of an LTS, and it has been demonstrated that such EPSPs activated from stimulation of the optic tract do indeed activate LTSs (Scharfman et al., 1990). However, relay cells also are innervated by inputs that activate metabotropic receptors, which are associated with much slower EPSPs, perhaps slow enough to inactivate ITwithout an LTS. One problem with this is that the most prominent of these, a glutamatergic input from cortex that activates metabotropic glutamate receptors and a cholinergic input from the parabrachial region of the brainstem that activates muscarinic receptors, produce an EPSP by reducing a K+ conductance (for review, see McCormick, 1992). Figure 6Bsuggests that, if the reduction in the K+conductance is large enough, LTSs may always be generated even with metabotropic receptor activation.
We tested for this possibility with the application of 1-aminocyclopentane-1,3-dicarboxylic acid (ACPD), a general agonist for metabotropic glutamate receptors, to three geniculate cells. Figure 7 illustrates the basic result we observed in all cells tested. ACPD was applied after the cell was initially hyperpolarized (to −70 mV), at which levelIT is effectively de-inactivated. Thus depolarizing pulses activate LTSs and bursts of action potentials. Application of ACPD then depolarizes the cell slowly enough to inactivate IT, because depolarizing pulses now activate individual action potentials in tonic-firing mode, and no LTS was generated during this depolarization. It is important to note that the slow depolarization seen with ACPD activation is a result of both the slow kinetics associated with activation of metabotropic receptors and the diffusion time of the agonist to the receptor sites; that is, synaptic activation of these receptors would likely produce a faster response. Nonetheless, the results summarized in Figure 7 indicate that the reduction in the K+ conductance associated with ACPD application is not so large that de-inactivation ofIT is necessarily associated with activation of an LTS.
Fig. 7.

Effect of ACPD application on response mode. The cell has initially been hyperpolarized to −70 mV (horizontal dashed lines in all traces) so thatIT is de-inactivated. In the slower time base (top trace), responses to current injection are shown, and three of these (a–c) are shown at a faster time base in the bottom traces. Fora, before ACPD application, and c, after the membrane has returned to its previous hyperpolarized level, the response is in burst mode with LTSs. For b, after the ACPD has depolarized the cell, the response is in tonic mode. Notice that, during the transition from burst to tonic mode after ACPD application, no LTS was activated.
Theoretical observations
In a previous paper, we studied, both experimentally and theoretically, latency and threshold properties of LTS excitability (Zhan et al., 1999). For addressing these issues, a minimal Hodgkin-Huxley type of model for the LTS was helpful. Sodium spiking was excluded because it did not influence the features of interest in that study, nor does it here (e.g., Figs. 3-5). We used a reduced version of the model developed by McCormick and Huguenard (McCormick and Huguenard, 1992; Huguenard and McCormick, 1994) for thalamic relay cells. Currents for generating Na+–K+action potentials were neglected as well as some other K+ currents that played only a minor role for a single LTS. This same model (see Materials and Methods) is used here. It contains a T-type low-threshold Ca2+ current (IT), a transient K+ current (IA), and leakage currents (IK-leak andINa-leak); for some simulations (see below) we included a sag current (Ih).
Figure 8 shows that the response of the model to current ramps of various speeds, starting from a hyperpolarized holding state, compares well with our observed behaviors of thalamic relay cells (Figs. 1, 3-6). For ramps rising fast enough, an LTS is generated, but this does not occur for ramps that rise too slowly. Note, in this reduced model, IA, which is the only voltage-gated K+ current in the model, alone controls the LTS amplitude. Of course, the model does not go into tonic-firing mode even with strong depolarization, because the Na+-spiking mechanism has been ignored. At the holding state for this simulation,IT was de-inactivated (hT = 1). During the ramp depolarization,hT can drop substantially (data not shown) even before the LTS upstroke. For example,hT is ∼0.3 at the upstroke of the LTS for the second case of Figure 7 before the voltage reaches the threshold for the activation gating variable m. If the ramp speed is too slow, hT drops so much that the current is prevented from activating. This behavior is in close agreement with the basic conclusion reached from the experimental observations (e.g., Fig. 3).
Fig. 8.

Simulated voltage responses to ramps of injected current at various speeds. LTS generation does not occur for very slow ramps. The model is a minimal biophysical description and does not include currents for generating Na+–K+ action potentials (see Materials and Methods). The holding potential is −91.5 mV, and the ramp speeds are 50, 100, 200, and 300 pA/sec.
To understand the involvement of K+currents in these phenomena, we simulated the effect of blockingIA andIK-leak. In Figure9A, where both currents are blocked, an LTS is evoked for even the slowest ramps. In fact, for the slowest ramp, the model cell shows nearly steady subthreshold oscillations, reflecting the rhythmogenic effect of the window current of IT. These results agree with our electrophysiological experiments, demonstrating that one or both K+ currents must override the regenerative property of the window current. Notice that the LTSs have higher amplitude in Figure 9A than in Figure 8 now thatIA has been blocked. Also, in the absence of these outward currents, we had to apply more anodal current to hold the cell hyperpolarized to approximately −90 mV. Finally, the ramp speeds are lower by a factor of 10 or more than are those in Figure8.
Fig. 9.

Effects of blocking either or both of the two K+ currents of the model on the voltage response of the model to current ramp input. A, Blocking ofIA andIK-leak leads to LTS generation at even very slow ramp speeds. The computed LTSs are large becauseIA is absent. B, OnlyIA is blocked here. As in the control case (compare Fig. 6), there is a minimal ramp speed below which no LTS is activated. C, Blocking onlyIK-leak enables LTS generation at any ramp speed. The ramp speeds in A and C are 1, 5, 10, and 30 pA/sec; in B, they are 50, 100, 300, and 500 pA/sec. The holding conditions are as follows: inA and C, Iholdis −0.36 nA, and Vhold is approximately −87.4 mV; in B, Ihold is −0.27 nA, and Vhold is approximately −91.4 mV.
Using our computer model, we can selectively block either current to identify the primary contributor to masking of the window current. In Figure 9B, we simulate the block ofIA withIK-leak intact, and this restores the feature of the control case that LTS generation requires that the ramp stimulus be fast enough. The ramp speeds here are comparable with those in the control case, and the slowest ramp fails to activate an LTS. This simulation shows that IK-leakalone can still mask the influence of the window current. Indeed, blocking IK-leak but notIA (Fig. 9C) enables LTS generation for all ramp speeds. The subthreshold behavior in this case is very similar to that in Figure 9A, particularly the slow-rising phase of voltage and the timing of the LTS upstroke. However, the amplitudes are less in Figure 9C becauseIA is present.
To see more directly the masking effect ofIK-leak we plot in Figure10A the steady-state current–voltage relationISS(V) versusV. The prominent N-shape in the control case is caused by the outward window current of IA; it disappears when IA is blocked. The lowermost ISS curve is with both K+ currents blocked. This reveals the window current of IT, which makesISS modestly N-shaped in the hyperpolarized regimen, and this is seen better in the magnification of Figure 10B. It suggests the possibility of bistability in this reduced model, in which K+ currents have been eliminated. Now imagine the trajectory of the membrane potential in Figure10B during the ramp. Before the LTS the voltage–current pair rises upward along the left leg of the N. As the ramp current passes above the knee, the voltage is no longer at the pseudo steady state but increases rightward rapidly toward the right leg of the N. During this transient phase the activation gating variable of IT outraces the inactivation process, and an LTS is generated. Thus the N-shape accounts for the ∼20 mV jump in voltage from just before to just after the leading LTS in the ramp responses in Figure 9A and the smaller jumps in Figure 9C. Note that this N-shape is also partially preserved when IA is present. Interestingly, this model with IA present and IK-leak blocked has a double N-shape.
Fig. 10.

Steady-state current–voltage relation,ISS versus V, for the model, showing the effects of blocking either or both of the two K+ currents of the model. A, Large “bump” in ISS in the voltage range of −60 to −40 mV is caused by the (outward) window current ofIA. The modest “trough” inISS at approximately −70 mV is caused by the (inward) window current of IT at steady state. This N-shaped region of ISS is seen better in the magnification in B. B, Part of A is magnified.
Although the window current, by creating an N-shapedISS(V), can destabilize the membrane over a certain voltage range, this is not the only possible destabilization mechanism. Resonance and rhythmicity are also possible, even with a monotonicISS(V), as occurs in the standard Hodgkin-Huxley model (Rinzel, 1978). Modest parameter changes in our minimal model in this low-conductance hyperpolarized voltage range can evoke either mechanism or both (Fig. 9A, see the near-sustained oscillations after the LTS, and with voltage jump, for the slowest ramp). Apparently relay neurons with different parameter values (i.e., in different preparations) are also capable of either or both when masking conductances are blocked. In our case the destabilization appears more like resonance (with multiple LTSs and no jump); in other experiments bistability (and sometimes oscillations) are seen (Williams et al., 1997; Hughes et al., 1999).
Although we do not illustrate the point with a figure here, we have explored computationally the potential effect ofIh on LTS generation for slow ramp inputs. For these simulations we used the model forIh as developed previously (McCormick and Huguenard, 1992) (see Materials and Methods). With a maximal conductance gh set to a value (10 nS) at the lower end of the range reported by Huguenard and McCormick for rat thalamic relay cells, we find that LTS generation is precluded for very slow ramps regardless of whether or notIK-leak is present. This strong inward but nonregenerative current swamps the small window current ofIT. As mentioned above, these relay neurons have a small depolarizing sag in response to hyperpolarizing current pulses. In four neurons, we have conducted voltage-clamp recordings to estimate gh in these neurons. In these cells the average gh was 0.3 nS and ranged from 0.1 to 0.5 nS. This small depolarizing sag is observed in all cat LGN relay cells and does not appear to be a result of experimental manipulation (i.e., whole-cell recording), because recordings from interneurons indicate large depolarizing sag responses with similar recording procedures. Furthermore, there does not appear to be a time-dependent run-down of the sag response. When using the much smaller value of gh of 1 nS (which is still larger than what we observe experimentally in geniculate relay cells), we find that our results are essentially unchanged from Figures1 and 2. This agreement between experimental and theoretical results supports the idea that Ih is quite small in cat thalamocortical relay neurons.
DISCUSSION
We have shown in geniculate neurons that, to activate an LTS (which we take as implying IT generation), the activating input must exceed a minimum rate of depolarization or dV/dt. Our experimental observations of this behavior have been supported and extended by use of model thalamic relay cells that also offer insights into the voltage-dependent conductances underlying this phenomenon.
Space-clamp issues
We recorded from and injected current into the soma, whereas many or most of the T channels underlying ITreside in the dendrites (Zhou et al., 1997; Destexhe et al., 1998; Zhan et al., 2000). Because geniculate neurons have extensive dendritic arbors (Guillery, 1966; Friedlander et al., 1981), space-clamp limitations could affect interpretation in two related ways: (1) when we hyperpolarize the soma to completely de-inactivateIT, the hyperpolarization at dendritic locations is probably less, and (2) the ramps applied at the soma likely produce ramps in dendrites with a lower voltage amplitude and thus a corresponding reduction in dV/dt. However, for several reasons, we do not believe that these factors affect our basic conclusions. Because we observe LTSs with applied ramps of a sufficiently fast dV/dt, at least many if not all dendritic T channels must have been de-inactivated. Furthermore, although ramps may differ in absolute amplitude and dV/dt at different dendritic locations, it is still the case that relative speeding up or slowing down of dV/dt from injections in the soma determines whether or not an LTS is activated. Thus even with space-clamp limitations, our basic conclusion that LTS activation requires a minimum dV/dt seems sound.
Our theoretical results for an electrotonically compact (space-clamped) cell model support the conclusion that the minimum dV/dt requirement depends on the relative amount of masking of the window current related toIT. With sufficient masking ofIT or inadequateIT one expects accommodation, by which we mean failure to respond, to a very slow ramp. Accommodation may be precluded by manipulations that block or partially block the conductances that mask IT. In a distributed cable structure one should also expect the phenomenon of accommodation to depend on the degree of masking, although more unmasking might be required to preclude accommodation. Theoretical results for a simplified excitable membrane model show that the critical level of an excitability parameter (analogous to voltage threshold or degree of masking) beyond which accommodation is possible for very slow ramps is greater for the space-clamped case than for local stimulation in a cable (Rinzel and Keener, 1983).
Window current
If the inactivation and activation curves forIT overlap, a membrane potential held within the overlapped voltage range will generate someIT, and the result is a steady-state window current (Coulter et al., 1989; Williams et al., 1997). If this occurs, under certain conditions, it can also lead to bistability or resonance or oscillations of the membrane potential (Hutcheon et al., 1994; Puil et al., 1994; Manor et al., 1997; Williams et al., 1997). The presence of a window current and these nonlinear dynamic response properties could have important functional implications regarding integration of afferent synaptic activity in thalamic relay cells.
However, if a minimum dV/dt is needed to activate an LTS, then a window current cannot occur to any appreciable extent, because this current by definition can be generated by a steady-state (i.e., dV/dt = 0) voltage within the window. Also, a window current should create a deviation in the slope of the voltage response to the slow current ramps we used, and this was never observed in our experiments without Cs+. Of course, it is possible that the window currents are so small that they are below our resolution to detect, but if so, such a window current would have rather limited functional significance.
However, with Cs+ we found that even the slowest ramps activated LTSs. There are at least two possible and perhaps related explanations for this. One is that the Cs+, by reducing the K+ conductances, increases the apparent membrane resistance. This, in turn, increases the amplitude and dV/dt of the background fluctuations in membrane potential, many of which are caused by spontaneous synaptic events (Cox et al., 1998). Thus the voltage ramps evoked by the current injections are not perfectly smooth but instead include small fluctuations, and these would be amplified because of the presence of Cs+, perhaps enough to activate an LTS. The other possibility derives from the experiments and theories that reveal mechanisms for dynamic destabilization (bistability, resonance, and oscillations) in certain parameter and stimulus ranges. In particular, we note that membrane bistability occurs in relay neurons only after suppression of Ih andIK-leak (Williams et al., 1997; Hughes et al., 1999). By reducing bothIK-leak andIh with Cs+, we have created experimental conditions that would promote observing the bistability. Although we did evoke LTSs with all ramps used in the presence of Cs+, we did not observe any obvious bistability in the voltage responses to these very slow current ramps, such as lasting tail responses on the LTSs. Destabilization in this case may be caused by resonance.
However, although our experimental observations cannot reveal details of the conductances involved in these phenomena, our modeling studies do so. They show that blockade by Cs+ ofIK-leak but not ofIA is responsible for allowing the slowest ramps to activate an LTS. As for Ih, the modeling also shows that blockade of a largeIh by Cs+could also account for this phenomenon, but our experimental observations are that geniculate relay cells in the cat (as opposed presumably to many other thalamic relay cells) have such a small Ih that this is not really a factor for these cells. We thus conclude that blockade by Cs+ ofIK-leak is mainly responsible for the observation that, with Cs+, even the slowest ramps evoke an LTS; IK-leak is the principal masking agent for the window current ofIT.
Significance of a minimum dV/dt for control of response mode
An important factor of the dV/dt of an evoked EPSP is the nature of the postsynaptic receptor involved. Ionotropic receptors are associated with fast postsynaptic potentials (PSPs), whereas activation of metabotropic receptors produce much slower PSPs. The major neurotransmitters producing EPSPs in geniculate relay cells are glutamate and acetylcholine, and each can activate both ionotropic and metabotropic receptors (for review, see Sherman and Guillery, 1996). Regarding glutamatergic inputs, retinal afferents activate only ionotropic receptors and thus fast EPSPs, but cortical afferents also activate metabotropic glutamate receptors and can thus evoke slow EPSPs. Ionotropic (nicotinic) and metabotropic (muscarinic) cholinergic receptors are activated via axons from the parabrachial region of the brainstem.
For a thalamic relay cell in burst mode, the present results are consistent with evidence that EPSPs generated via ionotropic receptors are fast enough to activate LTSs and burst firing (Scharfman et al., 1990). They also suggest that EPSPs via metabotropic receptors may be slow enough to inactivate IT and thus convert a relay cell from burst to tonic mode without activating a burst, although an important caveat to this is offered in the next paragraph. We have shown in Figure 7 that, although EPSPs generated in these relay cells via metabotropic receptors involve a reduction inIK-leak (McCormick and Von Krosigk, 1992), this reduction is sufficiently limited (see also Fig. 9) that the resulting slow depolarization fails to elicit an LTS. EPSPs via metabotropic glutamate receptors effectively switch firing modes from burst to tonic (McCormick and Von Krosigk, 1992; Godwin et al., 1996), but the experiment shown in Figure 7 involves bath application of a metabotropic glutamate agonist, and there has as yet been no test to see whether synaptic activation of metabotropic glutamate or muscarinic receptors will perform the switch without activating a burst.
Obviously, the switch from tonic to burst mode involves hyperpolarization that would not produce spurious firing in the relay cell. The mechanism we suggest, involving a slow EPSP via metabotropic receptors, can do the opposite, but also without producing any spurious burst response relayed to cortex. Whether this regularly occurs for geniculate relay cells may be doubted. This is because retinal ganglion cells have background firing rates of 10–60 Hz (Bullier and Norton, 1979), and the fast EPSP generated by each retinal action potential is fairly large (∼2–3 mV) (Bloomfield and Sherman, 1988). Thus, although activation of metabotropic receptors from modulatory inputs might produce a very slow EPSP, it seems likely that fast EPSPs from retina would be superimposed on this and would activate an LTS. A burst of action potentials would likely be relayed to cortex, but this is not really a spurious signal, because it would, in this scenario, always be activated by a retinal input.
Thus although it is questionable whether relay cells in the lateral geniculate nucleus can be switched from burst to tonic firing without a burst being activated, the possibility does exist for other thalamic nuclei, providing that the driver inputs (i.e., those equivalent to retinogeniculate inputs) have sufficiently low spontaneous activity. Also, for cortical or brainstem inputs to do this would require that mainly only metabotropic and not ionotropic receptors are activated. How different patterns of active cortical or brainstem inputs activate the different receptor types is presently unknown, but it is plausible that, within each pathway, a subset of axons may primarily activate only metabotropic receptors. Suprathreshold driver input, which carries the basic information to be relayed to cortex, evokes only fast EPSPs, meaning that it will always fire a relay cell in burst or tonic mode, and thus driver input has limited capabilities of switching modes. On the other hand, in some thalamic nuclei, cortical and parabrachial inputs operating via metabotropic receptors may be able to perform the trick of pure mode switching uncomplicated by unnecessary extra action potentials.
Footnotes
This research was supported by United States Public Health Service Grant EY 03038 and National Science Foundation Grant MS 0078420. Additional support was provided by the National Institutes of Health Intramural Programs of the National Institute of Diabetes and Digestive and Kidney Diseases and the National Institute of Neurological Diseases and Stroke. We thank Susan Van Horn for her excellent technical assistance.
Correspondence should be addressed to S. M. Sherman, Department of Neurobiology, State University of New York, Stony Brook, NY 11794-5230. E-mail: s.sherman@sunysb.edu.
REFERENCES
- 1.Bal T, Von Krosigk M, McCormick DA. Synaptic and membrane mechanisms underlying synchronized oscillations in the ferret lateral geniculate nucleus in vitro. J Physiol (Lond) 1995;483:641–663. doi: 10.1113/jphysiol.1995.sp020612. [DOI] [PMC free article] [PubMed] [Google Scholar]
- 2.Bloomfield SA, Sherman SM. Postsynaptic potentials recorded in neurons of the cat's lateral geniculate nucleus following electrical stimulation of the optic chiasm. J Neurophysiol. 1988;60:1924–1945. doi: 10.1152/jn.1988.60.6.1924. [DOI] [PubMed] [Google Scholar]
- 3.Bullier J, Norton TT. Comparison of receptive-field properties of X and Y ganglion cells with X and Y lateral geniculate cells in the cat. J Neurophysiol. 1979;42:274–291. doi: 10.1152/jn.1979.42.1.274. [DOI] [PubMed] [Google Scholar]
- 4.Coulter DA, Huguenard JR, Prince DA. Calcium currents in rat thalamocortical relay neurones: kinetic properties of the transient, low-threshold current. J Physiol (Lond) 1989;414:587–604. doi: 10.1113/jphysiol.1989.sp017705. [DOI] [PMC free article] [PubMed] [Google Scholar]
- 5.Cox CL, Zhou Q, Sherman SM. Glutamate locally activates dendritic outputs of thalamic interneurons. Nature. 1998;394:478–482. doi: 10.1038/28855. [DOI] [PubMed] [Google Scholar]
- 6.Crunelli V, Lightowler S, Pollard CE. A T-type Ca2+ current underlies low-threshold Ca2+ potentials in cells of the cat and rat lateral geniculate nucleus. J Physiol (Lond) 1989;413:543–561. doi: 10.1113/jphysiol.1989.sp017668. [DOI] [PMC free article] [PubMed] [Google Scholar]
- 7.Deschênes M, Paradis M, Roy JP, Steriade M. Electrophysiology of neurons of lateral thalamic nuclei in cat: resting properties and burst discharges. J Neurophysiol. 1984;51:1196–1219. doi: 10.1152/jn.1984.51.6.1196. [DOI] [PubMed] [Google Scholar]
- 8.Destexhe A, Neubig M, Ulrich D, Huguenard J. Dendritic low-threshold calcium currents in thalamic relay cells. J Neurosci. 1998;18:3574–3588. doi: 10.1523/JNEUROSCI.18-10-03574.1998. [DOI] [PMC free article] [PubMed] [Google Scholar]
- 9.Friedlander MJ, Lin C-S, Stanford LR, Sherman SM. Morphology of functionally identified neurons in lateral geniculate nucleus of the cat. J Neurophysiol. 1981;46:80–129. doi: 10.1152/jn.1981.46.1.80. [DOI] [PubMed] [Google Scholar]
- 10.Godwin DW, Vaughan JW, Sherman SM. Metabotropic glutamate receptors switch visual response mode of lateral geniculate nucleus cells from burst to tonic. J Neurophysiol. 1996;76:1800–1816. doi: 10.1152/jn.1996.76.3.1800. [DOI] [PubMed] [Google Scholar]
- 11.Guido W, Weyand T. Burst responses in thalamic relay cells of the awake behaving cat. J Neurophysiol. 1995;74:1782–1786. doi: 10.1152/jn.1995.74.4.1782. [DOI] [PubMed] [Google Scholar]
- 12.Guillery RW. A study of Golgi preparations from the dorsal lateral geniculate nucleus of the adult cat. J Comp Neurol. 1966;128:21–50. doi: 10.1002/cne.901280104. [DOI] [PubMed] [Google Scholar]
- 13.Hagiwara S, Ohmori H. Studies of calcium channels in rat clonal pituitary cells with patch electrode voltage clamp. J Physiol (Lond) 1982;331:231–252. doi: 10.1113/jphysiol.1982.sp014371. [DOI] [PMC free article] [PubMed] [Google Scholar]
- 14.Hernández-Cruz A, Pape H-C. Identification of two calcium currents in acutely dissociated neurons from the rat lateral geniculate nucleus. J Neurophysiol. 1989;61:1270–1283. doi: 10.1152/jn.1989.61.6.1270. [DOI] [PubMed] [Google Scholar]
- 15.Hille B. Ionic channels of excitable membranes. Sinauer; Sunderland, MA: 1992. [Google Scholar]
- 16.Hughes SW, Cope DW, Tóth TI, Williams SR, Crunelli V. All thalamocortical neurones possess a T-type Ca2+ “window” current that enables the expression of bistability-mediated activities. J Physiol (Lond) 1999;517:805–815. doi: 10.1111/j.1469-7793.1999.0805s.x. [DOI] [PMC free article] [PubMed] [Google Scholar]
- 17.Huguenard JR, McCormick DA. Electrophysiology of the neuron. Oxford UP; New York: 1994. [Google Scholar]
- 18.Hutcheon B, Miura RM, Yarom Y, Puil E. Low-threshold calcium current and resonance in thalamic neurons: a model of frequency preference. J Neurophysiol. 1994;71:583–594. doi: 10.1152/jn.1994.71.2.583. [DOI] [PubMed] [Google Scholar]
- 19.Jahnsen H, Llinás R. Electrophysiological properties of guinea-pig thalamic neurones: an in vitro study. J Physiol (Lond) 1984a;349:205–226. doi: 10.1113/jphysiol.1984.sp015153. [DOI] [PMC free article] [PubMed] [Google Scholar]
- 20.Jahnsen H, Llinás R. Ionic basis for the electroresponsiveness and oscillatory properties of guinea-pig thalamic neurones in vitro. J Physiol (Lond) 1984b;349:227–247. doi: 10.1113/jphysiol.1984.sp015154. [DOI] [PMC free article] [PubMed] [Google Scholar]
- 21.Lenz FA, Garonzik IM, Zirh TA, Dougherty PM. Neuronal activity in the region of the thalamic principal sensory nucleus (ventralis caudalis) in patients with pain following amputations. Neuroscience. 1998;86:1065–1081. doi: 10.1016/s0306-4522(98)00099-2. [DOI] [PubMed] [Google Scholar]
- 22.Manor Y, Rinzel J, Segev I, Yarom Y. Low amplitude oscillations in the inferior olive: a model based on electrical coupling of neurons with heterogeneous channel densities. J Neurophysiol. 1997;77:2736–2752. doi: 10.1152/jn.1997.77.5.2736. [DOI] [PubMed] [Google Scholar]
- 23.McCormick DA. Neurotransmitter actions in the thalamus and cerebral cortex and their role in neuromodulation of thalamocortical activity. Prog Neurobiol. 1992;39:337–388. doi: 10.1016/0301-0082(92)90012-4. [DOI] [PubMed] [Google Scholar]
- 24.McCormick DA, Huguenard JR. A model of the electrophysiological properties of thalamocortical relay neurons. J Neurophysiol. 1992;68:1384–1400. doi: 10.1152/jn.1992.68.4.1384. [DOI] [PubMed] [Google Scholar]
- 25.McCormick DA, Pape H-C. Properties of a hyperpolarization-activated cation current and its role in rhythmic oscillation in thalamic relay neurones. J Physiol (Lond) 1990;431:291–318. doi: 10.1113/jphysiol.1990.sp018331. [DOI] [PMC free article] [PubMed] [Google Scholar]
- 26.McCormick DA, Von Krosigk M. Corticothalamic activation modulates thalamic firing through glutamate “metabotropic” receptors. Proc Natl Acad Sci USA. 1992;89:2774–2778. doi: 10.1073/pnas.89.7.2774. [DOI] [PMC free article] [PubMed] [Google Scholar]
- 27.Puil E, Carlen PL. Attenuation of glutamate-action, excitatory postsynaptic potentials, and spikes by intracellular QX 222 in hippocampal neurons. Neuroscience. 1984;11:389–398. doi: 10.1016/0306-4522(84)90031-9. [DOI] [PubMed] [Google Scholar]
- 28.Puil E, Meiri H, Yarom Y. Resonant behavior and frequency preferences of thalamic neurons. J Neurophysiol. 1994;71:575–582. doi: 10.1152/jn.1994.71.2.575. [DOI] [PubMed] [Google Scholar]
- 29.Radhakrishnan V, Tsoukatos J, Davis KD, Tasker RR, Lozano AM, Dostrovsky JO. A comparison of the burst activity of lateral thalamic neurons in chronic pain and non-pain patients. Pain. 1999;80:567–575. doi: 10.1016/S0304-3959(98)00248-6. [DOI] [PubMed] [Google Scholar]
- 30.Ramcharan EJ, Gnadt JW, Sherman SM. Burst and tonic firing in thalamic cells of unanesthetized, behaving monkeys. Vis Neurosci. 2000;17:55–62. doi: 10.1017/s0952523800171056. [DOI] [PubMed] [Google Scholar]
- 31.Reinagel P, Godwin DW, Sherman SM, Koch C. Encoding of visual information by LGN bursts. J Neurophysiol. 1999;81:2558–2569. doi: 10.1152/jn.1999.81.5.2558. [DOI] [PubMed] [Google Scholar]
- 32.Rinzel J. On repetitive activity in nerve. Fed Proc. 1978;37:2793–2802. [PubMed] [Google Scholar]
- 33.Rinzel J, Keener JP. Hopf bifurcation to repetitive activity in nerve. SIAM J Appl Math. 1983;43:907–922. [Google Scholar]
- 34.Scharfman HE, Lu S-M, Guido W, Adams PR, Sherman SM. N-methyl-d-aspartate (NMDA) receptors contribute to excitatory postsynaptic potentials of cat lateral geniculate neurons recorded in thalamic slices. Proc Natl Acad Sci USA. 1990;87:4548–4552. doi: 10.1073/pnas.87.12.4548. [DOI] [PMC free article] [PubMed] [Google Scholar]
- 35.Sherman SM. Dual response modes in lateral geniculate neurons: mechanisms and functions. Vis Neurosci. 1996;13:205–213. doi: 10.1017/s0952523800007446. [DOI] [PubMed] [Google Scholar]
- 36.Sherman SM, Guillery RW. The functional organization of thalamocortical relays. J Neurophysiol. 1996;76:1367–1395. doi: 10.1152/jn.1996.76.3.1367. [DOI] [PubMed] [Google Scholar]
- 37.Smith GD, Cox CL, Sherman SM, Rinzel J. Fourier analysis of sinusoidally-driven thalamocortical relay neurons and a minimal integrate-and-fire-or-burst model. J Neurophysiol. 2000;83:588–610. doi: 10.1152/jn.2000.83.1.588. [DOI] [PubMed] [Google Scholar]
- 38.Wang X-J, Rinzel J, Rogawski MA. A model of the T-type calcium current and the low-threshold spike in thalamic neurons. J Neurophysiol. 1991;66:839–850. doi: 10.1152/jn.1991.66.3.839. [DOI] [PubMed] [Google Scholar]
- 39.Williams SR, Tóth TI, Turner JP, Hughes SW, Crunelli V. The “window” component of the low threshold Ca2+ current produces input signal amplification and bistability in cat and rat thalamocortical neurones. J Physiol (Lond) 1997;505:689–705. doi: 10.1111/j.1469-7793.1997.689ba.x. [DOI] [PMC free article] [PubMed] [Google Scholar]
- 40.Zhan XJ, Cox CL, Rinzel J, Sherman SM. Current clamp and modeling studies of low threshold calcium spikes in cells of the cat's lateral geniculate nucleus. J Neurophysiol. 1999;81:2360–2373. doi: 10.1152/jn.1999.81.5.2360. [DOI] [PubMed] [Google Scholar]
- 41.Zhan XJ, Cox CL, Sherman SM. Dendritic depolarization efficiently attenuates low-threshold calcium spikes in thalamic relay cells. J Neurosci. 2000;20:3909–3914. doi: 10.1523/JNEUROSCI.20-10-03909.2000. [DOI] [PMC free article] [PubMed] [Google Scholar]
- 42.Zhou Q, Godwin DW, O'Malley DM, Adams PR. Visualization of calcium influx through channels that shape size burst and tonic firing modes of thalamic relay cells. J Neurophysiol. 1997;77:2816–2825. doi: 10.1152/jn.1997.77.5.2816. [DOI] [PubMed] [Google Scholar]