

Abstract
Dendritic spines commonly receive glutamatergic innervation at postsynaptic densities and compartmentalize calcium influx arising from synaptic signaling. Recently, it was shown that a class of nicotinic acetylcholine receptors containing α7 subunits is concentrated on somatic spines emanating from chick ciliary ganglion neurons. The receptors have a high relative calcium permeability and contribute importantly to synaptic currents, although they appear to be excluded from postsynaptic densities. Here we show that low-frequency synaptic stimulation of the α7-containing receptors induces calcium transients confined to the spines. High-frequency stimulation induces a transient calcium elevation in the spines and a more sustained cell-wide elevation. The high-frequency transient elevation again depends on α7-containing receptors, whereas the sustained elevation can be triggered by other nicotinic receptors and depends on calcium release from internal stores and probably influx through voltage-gated L-type calcium channels as well. Retrograde axonal stimulation of the neurons at high frequency mimics synaptic stimulation in producing sustained cell-wide calcium increases that depend on L-type channels and release from internal stores, but it does not produce calcium transients in the spines. Thus frequent action potentials are sufficient to generate the cell-wide increases, but α7-containing receptors are needed for spine-specific effects. Patch-clamp recording indicates that α7-containing receptors preferentially desensitize at high-frequency stimulation, accounting for the inability of the stimulation to sustain high calcium levels in the spines. The spatial and temporal differences in the patterns of calcium elevation could enable the neurons to monitor their own firing histories for regulatory purposes.
Keywords: nicotinic, spines, calcium, acetylcholine receptors, ciliary ganglion, α7
Dendritic spines have been the subject of intense study because they first were recognized as primary sites of synaptic excitation and likely sites of synaptic plasticity in the CNS (for review, see Harris, 1999). Theirraison d'être appears to be an ability to segregate electrical and biochemical components of synaptic signaling such that the synaptic current can spread to other compartments whereas chemical effects are confined mainly to the spine of origin (Koch and Zador, 1993; Yuste and Denk, 1995). This has been demonstrated best for synaptically driven calcium elevations in hippocampal spines (Muller and Connor, 1991; Yuste and Denk, 1995; Svoboda et al., 1996), where the calcium transients mediate synaptic plasticity (for review, seeMalenka and Nicoll, 1999). Constraining calcium elevations to individual spines serves a dual purpose: it permits limited calcium influx to achieve a high, local concentration for maximum regulatory impact on adjacent molecules, and it spatially confines the regulatory effects to one or a few nearby spines. The spatial constraint may be essential for maintaining the input specificity of synaptic plasticity (Koch and Zador, 1993; Yuste and Denk, 1995) and for reducing the risk of excitotoxicity (Choi, 1992).
Most spines that have been analyzed to date receive glutamatergic input and depend on NMDA receptors for much of the calcium influx that has been observed. An interesting exception is that of somatic spines on chick ciliary ganglion neurons. Recent studies show that ciliary spines are heavily endowed with nicotinic acetylcholine receptors containing α7 subunits (Shoop et al., 1999). Such receptors (α7-nAChRs) have a high relative calcium permeability, equivalent to that of NMDA receptors (Bertrand et al., 1993; Seguela et al., 1993), and generate large synaptic currents when activated (Zhang et al., 1996; Ullian et al., 1997). Surprisingly, α7-nAChRs are excluded from postsynaptic densities (Jacob and Berg, 1983), which instead contain a less abundant nAChR subtype having α3 and other subunits (α3*-nAChRs; Jacob et al., 1984; Vernallis et al., 1993). During development the α7-nAChRs are required for reliable, synchronized nicotinic transmission through the ganglion (Chang and Berg, 1999). The receptors remain in abundance throughout adulthood but become less important for acute ganglionic transmission at later times, when α3*-nAChRs suffice (Chiappinelli, 1983; Chang and Berg, 1999) in combination with electrical synapses that form between preganglionic calyces and postganglionic ciliary neurons (Martin and Pilar, 1964a). The calcium permeability of α7-nAChRs, their abundance and positioning on somatic spines, and their apparent dispensability for acute transmission in adulthood suggest that the receptors play other signaling roles. A prime candidate would be regulation of calcium-dependent events in the postsynaptic cell. By translating firing history into specific temporal and spatial patterns of calcium elevation, the receptor could produce distinctive regulatory effects. We have used calcium imaging and rapid multi-photon laser-scanning fluorescence microscopy to examine the contributions of α7-nAChRs to synaptically driven calcium transients in the postsynaptic cell and to assess how the resulting patterns reflect the frequency and duration of synaptic input to the neurons.
MATERIALS AND METHODS
Dye loading of ciliary ganglia. Ciliary ganglia were dissected with preganglionic and postganglionic nerve roots intact from embryonic day 15 (E15) chick embryos and from 3-week-old chickens, and each postganglionic nerve root was trimmed to a length of 2–4 mm. Neurons in the ganglia were backloaded with the calcium fluorescent indicator dye Oregon green-1 conjugated to 10,000 MW dextran (Molecular Probes, Eugene, OR). The dye was chosen in part because of its relatively low affinity for calcium (KD = 398 nm[scap], as reported by Molecular Probes for the batch that was used) so that bound calcium could be expected to dissociate rapidly and not artificially prolong the calcium signal that is observed. The methods for dye loading have been described previously (Brain and Bennett, 1995) and were followed here with minor modifications. Briefly, a drawn out Pasteur pipette was used to apply a saturated solution of Oregon green-1–dextran to the postganglionic nerve root for 1.5–3 hr at 37°C. An oxygenated phosphate-free buffer containing (in mm) 170 Na+, 5 K+, 5 Ca2+, 2 Mg2+, 169 Cl−, 20 HCO3−, and 11 glucose, pH 7.4, was used both to perfuse ganglia and to dissolve the dye. After backfilling, the ganglia were perfused for an additional 10 min and then mounted for stimulation and recording in the oxygenated buffer at 37°C.
Calcium imaging. Visualization of the calcium dye was performed with a high-speed multi-photon laser-scanning microscope designed and built at the National Center for Microscopy and Imaging Resources Center at the University of California, San Diego (Fan et al., 1999). This system uses a femtosecond pulsed laser system (Spectra-Physics, Mountain View, CA) and is built around a highly modified version of the Nikon RCM 8000 video-rate confocal instrument (Tsien and Bacskai, 1995). The microscope system used in these studies was the development prototype for the Bio-Rad RTS2000 (Bio-Rad Laboratories, Hercules, CA). The instrument has the normal advantages of a typical multi-photon confocal microscope (e.g., decreased photo damage, greater depth of visualization) as well as the additional advantage of being able to capture images faster than video-rate. Most of the images that were recorded for this study were taken at 18.5 msec/frame. To examine rapid rise times, we achieved a greater sampling frequency (2–8 msec/frame) by reducing the frame size or by using line scanning. Data were transferred directly from a real-time image- processing subsystem (Datacube) to a hard disk array developed specifically for this instrument by Nikon . These operations were managed by a user interface running under Windows NT. Some analysis of data was performed as data streamed from the preparation, allowing calcium fluctuations to be tracked during an experiment. Subsequent processing of the data was accomplished with the RCM software created specifically for this instrument. Subsequent analysis was performed with RCM software, NIH Image, and CricketGraph.
Ganglia were stimulated by using a suction electrode attached to either the preganglionic or postganglionic nerve root and a Master-8 (AMPI, Jerusalem, Israel) controller device to deliver trains of electrical pulses. Stimulation was triggered by the RCM software, allowing the visual data to be time-locked with the stimulus data. An individual stimulus within a train was typically 1 msec in duration at 12–15 V (the minimal voltage required for robust stimulation was determined experimentally). Atropine at 100 nm (Calbiochem, La Jolla, CA) was included routinely in the bath solution during recording to prevent the activation of muscarinic receptors. When α7-nAChRs were to be blocked selectively, α-bungarotoxin (α-Bgt; Molecular Probes) was added to a final concentration of 100 nm at least 30 min before stimulation of the ganglion. When α7-nAChRs were to be imaged as part of the experiment, fluorescently conjugated α-Bgt (rhodamine-α-Bgt; Molecular Probes) was applied at 100 nmto the ganglion, and images were collected after 10–15 min at 37°C. When calcium release from internal stores was to be blocked, ganglia were incubated with either 10 μm ryanodine or 1 μm thapsigargin (Calbiochem) for > 30 min before stimulation. Nifedipine at 10 μm (Calbiochem) was used to block L-type voltage-gated calcium channels. When ganglia were stimulated via the postganglionic nerve root, 20 μmd-tubocurarine (Calbiochem) was included in the bath to prevent any intraganglionic nicotinic signaling.
Ganglia could be imaged continuously for ∼22 sec at 18.5 msec/frame (>1100 frames) before significant photobleaching occurred. Neurons were excluded from the data set if they underwent bleaching or if their calcium levels did not return to baseline after stimulation. When calcium levels were to be compared quantitatively in different regions of the same cell, the mean fluorescence intensity was measured for defined circles with diameters of 2.5 μm positioned on the neuron perimeter. Circles were chosen either to include (“on-spine”) or to exclude (“off-spine”) membrane regions later shown to be rich in α-Bgt binding sites, indicative of α7-nAChR clusters correlated with spine mats (Shoop et al., 1999, 2000). Calcium levels were compared for the same neuron over space, time, or incubation condition, but only relative rather than absolute levels were compared among neurons because of variations in extent of dye loading and fluorescence yield. For each set of experiments the gain of the photomultiplier was adjusted to ensure operation in the midrange. The time course of decay for the calcium signal was fit to either a first- or second-order exponential with the Origin software (Microcal Software, Northampton, MA). The best fit was determined by performing an F test of significance.
Imaging on dissociated neurons. Voltage-gated calcium channels and α7-nAChRs were colabeled on freshly dissociated E15 ciliary ganglion neurons by incubating Alexa-488 conjugated α-Bgt (Molecular Probes) for 45 min immediately after the neurons were dissociated and plated in culture medium as previously described (Shoop et al., 2000). After three 5 min rinses in culture medium, the neurons were fixed in 4% paraformaldehyde in phosphate buffer for 30 min at room temperature, rinsed five times in PBS (0.15 mNaCl and 0.01 mNa2HPO4, pH 7.4), and permeabilized in PBS containing 0.1% (v/v) Triton X-100; they were incubated for 3 hr at room temperature in PBS with 5% normal donkey serum containing a 1:200 dilution of a rabbit antibody directed against the α1c subunit of L-type voltage-gated calcium channels (Chemicon, Temecula, CA) or rabbit IgG as a negative control. After five rinses in PBS the neurons were incubated for 1 hr in the secondary antibody, Cy3-conjugated anti-rabbit (1:200 dilution; Jackson ImmunoResearch Laboratories, West Grove, PA), in PBS with 5% normal donkey serum and 0.1% Triton X-100.
Labeled cells were viewed with a Bio-Rad MC1024 confocal microscope with a 63×, 1.4 numerical aperture objective lens. Optical sections were taken at 0.75 μm intervals through the neuron, and the final volume was assembled digitally with Lasersharp software (Bio-Rad). A final projection was reconstructed from this volume with NIH Image software (National Institutes of Health, Bethesda, MD).
Electrophysiology. Synaptic currents and postsynaptic action potentials were recorded from neurons in dissected E15 whole ciliary ganglia with patch-clamp techniques as previously described (Chang and Berg, 1999). Briefly, E15 ciliary ganglia were excised with the preganglionic nerve root attached and then trimmed and treated with enzymes to loosen connective tissue. A suction electrode was used to stimulate the preganglionic nerve root while whole-cell patch-clamp recording was used from individual neurons in situ at 37°C to record either the resulting synaptic current in voltage-clamp mode or the resting membrane potential and elicited postganglionic action potentials in current-clamp mode. Cells were discarded if the resting potential at the end of the recording session was more positive than −50 mV or if the cell failed to follow presynaptic stimulation consistently with postsynaptic action potentials during the first 5 sec stimulation period at 1 Hz. The extracellular perfusion solution (recording medium) contained (in mm): 120 NaCl, 4 KCl, 10 glucose, 2 CaCl2, 1 MgSO4, 30 NaHCO3, and 1 NaH2PO4, pH 7.4. Atropine (100 nm) was added routinely, and the solution was warmed to 37°C and gassed with 95% O2/5% CO2. The intracellular solution (in the patch pipette) contained (in mm): 140 KCl, 5 glucose, 2 EGTA-KOH, 1 MgCl2, and 10 HEPES, pH 7.2. Other aspects were as described previously (Chang and Berg, 1999).
The relative declines in α7-nAChR and α3*-nAChR responses during a stimulus train were calculated on the basis of the following. Normally 90% of the peak synaptic current is generated by α7-nAChRs, in the absence of previous desensitization (Zhang et al., 1996; Liu and Berg, 1999b). At later times the α3*-nAChR response dominates. Accordingly, measurement of synaptic current 7.5 msec after the peak response was used to determine the decline in the α3*-nAChR response as a function of stimulus number, because the α7-nAChR response had declined to < 3% of its original value by then and the α3*-nAChR response was still large enough to measure accurately. Curve fitting for each individual trial to distinguish α3*- and α7-nAChR components as done previously (Zhang et al., 1996) was impractical here because of the small amplitude of the signals toward the end of the stimulus train. Once the relative decline in α3*-nAChR response as a function of stimulus number was known, the information was used to calculate how the α3*-nAChR portion of the peak current would have changed with stimulus number; this, in turn, was used to determine (by subtraction) the amplitude of the α7-nAChR component of the peak as a function of stimulus number. In this way both the α3*-nAChR and α7-nAChR components of the synaptic response were calculated for each stimulus and then expressed as a fraction of their respective values seen at the outset (i.e., generated by the first stimulus in the train) for normalization.
In some cases whole-cell patch-clamp recording was used to measure the nicotinic responses of freshly dissociated E14–E15 ciliary ganglion neurons before and after exposure to individual drugs. In these cases the techniques and procedures were as previously described (Liu and Berg, 1999a,b).
Materials. White leghorn chick embryos were obtained from McIntyre Poultry (Lakeside, CA) and maintained at 37°C in a humidified incubator. Three-week-old chickens were purchased from the same source and killed on the day of arrival for experiments. All animal care and handling was in strict accordance with the policies of the University of California, San Diego, Committee on Animal Subjects and the American Association for Accreditation of Laboratory Animal Care. The University holds a currently approved National Institutes of Health Assurance and a United States Department of Agriculture License. Reagents were purchased from Sigma (St. Louis, MO) unless otherwise indicated.
RESULTS
Low-frequency synaptic stimulation induces calcium transients confined to spines
Rapid calcium imaging was used to examine the effects of synaptic stimulation in situ on intracellular calcium levels of chick ciliary ganglion neurons. Ganglia were dissected from E15 embryos and backfilled via the postganglionic nerve root with the calcium indicator fluor Oregon green-1 conjugated to dextran. After rinsing, the ganglia were stimulated synaptically with a suction electrode positioned on the preganglionic nerve root. Individual fluorescence images were collected at a rapid rate (18.5 msec/frame) with a modified laser-scanning microscope, allowing for the visualization of calcium entry into a single optical cross section of an entire neuron. Relatively large neurons were chosen for the imaging and, therefore, were likely to be ciliary instead of choroid neurons (McNerney et al., 2000). Background fluorescence, defined as the signal 20 msec before stimulation, was low in the neurons (Fig.1A). A single stimulus caused a detectable rise in the calcium levels within the first 18.5 msec after stimulation, and it was confined to regions immediately underlying the cell membrane at specific sites (Fig.1B). Within 1 sec after stimulation the calcium levels had returned to baseline (Fig. 1C). When stimulated with a train of stimuli at 1 Hz, the pattern reproduced. Eight successive trials were averaged to show more clearly the baseline levels before stimulation (Fig. 1D), during the first 18.5 msec after stimulation (Fig. 1E), and after the calcium level returned to baseline (Fig. 1F). The images indicate that the 1 Hz train of stimuli caused localized, transient increases in the concentration of free calcium immediately beneath certain regions of the plasma membrane.
Fig. 1.

Fluorescence imaging of calcium transients induced in spine regions by low-frequency synaptic stimulation. Neurons in dissected E15 ciliary ganglia were filled with Oregon green-1–dextran via the postganglionic nerve root and then imaged with a multi-photon laser-scanning microscope at 18.5 msec/frame before, during, and after synaptic stimulation through the preganglionic nerve root.A–C, Single frames of a neuron taken 20 msec before, immediately after, and 1 sec after delivering a single synaptic stimulus. D–F, Averaged images of eight successive responses to 1 Hz stimulation taken 20 msec before, immediately after, and 800 msec after each stimulus. G, Labeling with rhodamine-conjugated α-Bgt for 10 min at the end of the experiment to identify α7-nAChR clusters defining spine mats. The same neuron is shown throughout. A single stimulus produces calcium transients in discrete regions along the perimeter. Averaging the responses intensifies the signal and shows that the calcium transients consistently correlate in location with spine mats defined by α7-nAChR clusters. A total of 20 neurons was examined in this manner and gave similar results. Arrow, A spine mat (on-spine);arrowhead, a region lacking detectable spines (off-spine). Scale bar, 10 μm.
The nature of the regions displaying the transient calcium increases was examined by labeling the neurons with rhodamine-α-Bgt after the calcium imaging had been completed. The rhodamine-α-Bgt binds to α7-nAChRs, which are concentrated on somatic spines folded into distinct mats on ciliary neurons (Shoop et al., 1999). As a result, the large clusters of fluorescent α-Bgt labeling on the cell surface indicate the location of spine mats. Because the receptors are concentrated and bind α-Bgt with high affinity (Couturier et al., 1990; Schoepfer et al., 1990), they can be detected in the ganglion with confocal microscopy under these conditions without having to rinse away unbound toxin and risk moving the preparation. It was clear that the somatic spine mats, defined by rhodamine-α-Bgt binding to α7-nAChRs, exactly coincided with the regions displaying the calcium transients (Fig. 1G).
The time course of the calcium transients in discrete regions was examined in more detail by quantifying the fluorescence in a 2.5-μm-diameter circle either overlying a spine mat (“on-spine”) or overlying an equivalent portion of the surface membrane lacking detectable α7-nAChR labeling (“off-spine”). In such experiments, continuous imaging of the calcium signal was performed during the 1 Hz train of synaptic stimulation as above, and then the cells were labeled with rhodamine-α-Bgt to define the spine mats and permit selection of appropriate on-spine (e.g., Fig. 1G, arrow) and off-spine (e.g., Fig. 1G, arrowhead) regions of the images for analysis. Examined in this manner, on-spine regions showed rapid increases in calcium after each stimulus of the 1 Hz train (Fig. 2A). The increases reached a maximum within the first 18.5 msec (first frame) and declined over the next several frames to reach baseline in < 1 sec. Very little increase in calcium could be detected in the off-spine region (Fig. 2B) or in the cytoplasm away from the plasma membrane (data not shown). Thus the calcium transients consistently occurred on-spine, and, although the amplitude of the transients at a given on-spine location varied from stimulus to stimulus, there seemed to be no failures. If an on-spine region responded to one stimulus in the train (as most did), it responded to all stimuli in the train.
Fig. 2.

Time courses of synaptically driven calcium transients at identified sites on the postsynaptic neuron. The amount of calcium fluorescence in a 2.5-μm-diameter circle either overlying a spine mat (on-spine) or overlying part of the cell surface devoid of spines (off-spine) was quantified from a series of images collected continuously during synaptic stimulation at 1 Hz (18.5 msec/image). The cell that was analyzed was the same as that in Figure 1, and the on-spine and off-spine regions that were measured were those indicated by the arrow and arrowhead, respectively, in Figure 1G. A, Continuous imaging on-spine. B, Continuous imaging off-spine.C, Eight averaged responses from A. Error bars are shown for each individual time point. Thearrowheads indicate the time of stimulation.D, Eight averaged responses from B with the corresponding error bars. Synaptic stimulation at 1 Hz elicits calcium transients that reach maximum during the first 18.5 msec poststimulation and quickly return to baseline; they are confined mainly to the spine mat area because very little change is seen in the off-spine region. Similar results were obtained with 18 neurons that were tested. Calibration: A, B, 1 sec; C, D, 200 msec.
For greater clarity, all eight responses elicited by an 8-sec-long 1 Hz train of stimuli were averaged both for on-spine (Fig. 2C) and off-spine (Fig. 2D) regions. A significant, rapidly rising and rapidly decaying calcium elevation is apparent in the on-spine region, whereas only a small, slowly decaying elevation can be distinguished in the off-spine region. As indicated by the figure, all of the rise on-spine occurred during the first 18.5 msec, represented by the time between the stimulus and the peak response. In fact, reducing the area of the circle that was examined so that the image could be collected as rapidly as 8 msec after the stimulus still yielded a peak on-spine response, indicating that it occurred very quickly. The mean time constant of decay for the calcium transient on-spine was 163 ± 25 msec (n = 18 cells).
High-frequency synaptic stimulation induces calcium elevations throughout the soma
High-frequency stimulation produces a qualitatively different pattern from that seen with 1 Hz. A 5 sec stimulation at 50 Hz produces a sustained calcium elevation extending across the entire cell; the elevation quickly collapses to baseline after stimulation ceases (Fig.3A–C). The pattern depended on the frequency of stimulation rather than on the number of stimuli delivered because even after three stimuli at 50 Hz the cell-wide increase was seen, although eight stimuli at 1 Hz failed to produce it. Comparing the time courses of calcium changes in on-spine and off-spine regions shows a complex pattern. At 50 Hz on-spine the calcium level quickly rises to a maximum and decays slowly in a biphasic manner throughout the 5 sec stimulation period (Fig. 3D). Off-spine the calcium level rises to a smaller maximum and decays slowly in a monophasic manner (Fig. 3E). Analyzing the responses from a number of cells yielded mean time constants for decay on-spine of 3.3 ± 1.4 sec (mean ± SEM; n = 16) and 15 ± 4 min (n = 16). The latter should be considered only an estimate because it extends so far beyond the 5 sec stimulation period that was examined. The faster decaying component represented 37 ± 6% (n = 16) of the maximum response. Analysis of off-spine regions yielded an estimated mean single time constant for decay of 18 ± 3 min (n = 16), a value similar to that found for the slowly decaying component on-spine. At the end of the 50 Hz stimulation the calcium elevation collapsed to baseline, with time constants of 380 ± 200 and 560 ± 260 msec (n = 16) for on- and off-spine locations, respectively.
Fig. 3.

Cell-wide spread of calcium elevations at high-frequency synaptic stimulation. The same cell shown in Figure 1was stimulated synaptically at 50 Hz and analyzed as described in Figure 2. A–C, Images collected 20 msec before, midway through a 5 sec stimulation at 50 Hz, and 1 sec after the stimulation was stopped. D, E, Continuous quantification of calcium fluorescence in the on-spine and off-spine regions identified in Figure1G while the neuron was stimulated synaptically at 50 Hz. High-frequency stimulation causes a rapid increase in calcium fluorescence both on- and off-spine; the decay is biphasic with both a fast and slow component on-spine, whereas it is monophasic with only a slow component off-spine. Similar results were obtained with 16 neurons that were tested. F, Stimulation of a neuron continuously for 30 min at 50 Hz but imaged only briefly on-spine at 10 min intervals, as indicated. Arrowhead, Termination of the stimulation. A smooth, slow decline in the calcium elevation occurs over the 30 min stimulation period. G, Same neuron as inF, allowed a brief recovery before being stimulated again at 50 Hz to show that the cell remained competent. Scale bar forA–C, 10 μm; calibration for D–G, 1 sec.
A better estimate for the slowly decaying component during 50 Hz stimulation was obtained by extending the stimulation period to 30 min. Imaging the neurons briefly at widely spaced intervals to avoid bleaching allowed a mean time constant of decay to be calculated for the entire period (Fig. 3F). The value obtained, 17 ± 5 min (n = 4) for the slow on-spine component, is in good agreement with that extrapolated from the 5 sec stimulation period above. After a brief rest period 50 Hz stimulation of the same neuron again produced the original pattern of calcium elevation, indicating it had not been damaged by the procedure (Fig.3G). Stimulation at 20 Hz produced on- and off-spine calcium elevations qualitatively similar in time courses to those seen at 50 Hz (data not shown). Taken together, the results indicate that both the spatial and temporal patterns of calcium elevation caused by high-frequency synaptic stimulation are quite different from those caused by low-frequency stimulation in the same neurons.
Calcium transients in spines depend on α7-nAChRs
Because α7-nAChRs are the major nicotinic receptor on ciliary ganglion neurons and because the receptors are concentrated on the spines and have a high relative permeability to calcium, it seemed likely that they would play a major role in the calcium transients elicited by synaptic stimulation. This was tested by comparing the calcium transients induced by stimulation in the same neurons before and after treatment with 100 nm α-Bgt for 30 min to block α7-nAChRs. Under these conditions the synaptic currents generated by α3*-nAChRs are sufficient to elicit postsynaptic action potentials approximately one-half of the time, averaged over the ciliary population (Chang and Berg, 1999). At 1 Hz the toxin treatment almost completely blocked calcium transients in the on-spine regions seen by signal averaging (Fig.4A,B). The residual calcium transient seen in the presence of the toxin was comparable with that seen for off-spine regions (Fig. 4C). The off-spine signal was not reduced by α-Bgt (Fig. 4D).
Fig. 4.

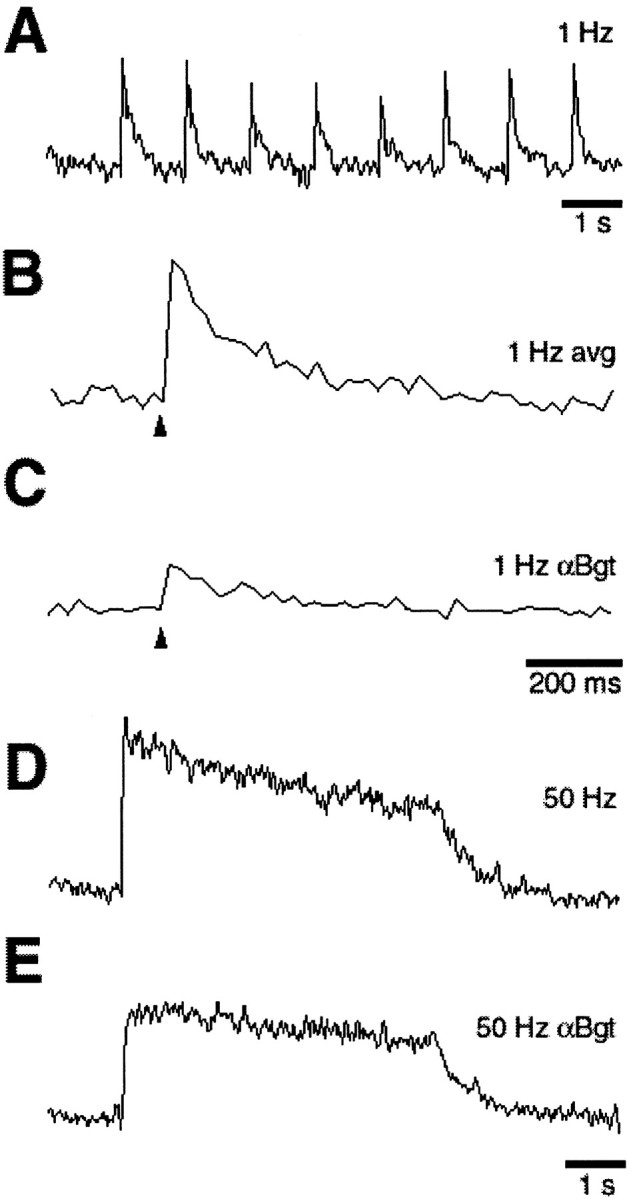
Effects of α7-nAChR blockade on synaptically driven calcium transients. Neurons were tested for calcium elevations during synaptic stimulation both before and after a 30 min exposure to 100 nm α-Bgt to block α7-nAChRs; the results were analyzed as in Figures 2 and 3. A–D, Averaged sequential responses to eight stimuli at 1 Hz obtained from a single neuron either on-spine or off-spine before and after α-Bgt treatment, as indicated. Note that the error bars (see Fig. 2) have been omitted both here and in subsequent figures for clarity, but the time from stimulus to peak response nonetheless represents the average of the first 18.5 msec frame captured in each trial. E, Complete blockade of the calcium transient by 20 μmd-tubocurarine. Arrowheads indicate the time of stimulation. F, G, Unaveraged responses elicited from a single neuron on-spine before and after α-Bgt treatment while it was stimulated at 50 Hz. H, I, Control showing no change in the amplitude or time course of the calcium transient elicited by 50 Hz stimulation when a cell was held for 30 min without α-Bgt. Blockade of α7-nAChRs almost completely eliminated both the rapid on-spine calcium transient seen at 1 Hz and the rapidly decaying on-spine transient seen at 50 Hz, reducing them to the kind of signal seen at off-spine regions. Similar results were obtained with 14 neurons that were tested. J, Complete blockade of the calcium elevation elicited by 50 Hz synaptic stimulation in the presence of 20 μmd-tubocurarine. Calibration: A–E, 200 msec; F–J, 1 sec.
At 50 Hz stimulation the toxin blockade affected only the initial component of the calcium elevation on-spine. The maximum response was reduced and the decay phase was monophasic (Fig.4F,G), resembling that seen above for off-spine calcium elevations induced by 50 Hz stimulation. Control experiments showed that no change of signal occurred in on-spine regions during the test period when toxin was omitted from the incubation (Fig.4H,I). Calculating the proportion of the peak on-spine signal that remained after α-Bgt treatment yielded a value of 65 ± 8% (n = 14 cells), in good agreement with that found above for the portion of the response that slowly decays at 50 Hz stimulation. Including 20 μmd-tubocurarine in the bath to block all nAChRs completely eliminated the calcium transients induced by either 1 or 50 Hz (Fig. 4E,J). The toxin results demonstrate that α7-nAChRs are essential for the transient calcium increases elicited by 1 Hz synaptic stimulation in spines but contribute less significantly to the extended increases seen at 50 Hz throughout the cell. These latter cell-wide increases seen at high-frequency stimulation apparently can be triggered by synaptic activation of α3*-nAChRs because they persist after toxin blockade. Similarly, the small, transient increases seen in off-spine regions at low-frequency stimulation also arise from activation of α3*-nAChRs.
Analysis of ganglia from older animals yielded the same kind of results that were obtained with E15 ganglia. Thus ciliary neurons in ganglia from 3-week-old chickens showed the rapid calcium transients confined to on-spine regions at 1 Hz, and the transients were blocked almost completely by α-Bgt (Fig.5A–C), as was the case for neurons in E15 ganglia. Synaptic stimulation at 50 Hz produced sustained calcium elevation throughout the cell; on-spine the elevation decayed in a biphasic manner, and blockade with α-Bgt removed the more rapidly decaying component (Fig. 5D,E) as it did for calcium elevations in E15 neurons synaptically driven at 50 Hz. The calcium patterns that were observed, then, are not confined to early developmental stages in the ganglion but rather can be seen at posthatch times when the visual system and attendant reflexes are fully functional.
Fig. 5.
Synaptically driven calcium transients in ciliary neurons from posthatch chicks. Ciliary ganglia from 3-week-old chicks were dissected, loaded with dye, stimulated, and imaged as described for E15 ganglia in Figures 1-4. A–C, On-spine calcium transients elicited by 1 Hz synaptic stimulation and shown either as a continuous trace or as a signal averaged over eight responses either before or after a 30 min exposure to α-Bgt to block α7-nAChRs, as indicated. D, E, On-spine calcium elevations induced by 50 Hz synaptic stimulation before and after α-Bgt treatment. As in E15 ganglia, synaptic stimulation at 1 Hz induced rapid calcium transients on-spine, and the transients were almost completely dependent on α7-nAChRs; 50 Hz stimulation induced a sustained elevation showing a biphasic decay, and α7-nAChR blockade eliminated the rapidly decaying component. Similar results were obtained with all six ganglia that were tested (one neuron per ganglion). Calibration: A, D, E, 1 sec; B, C, 200 msec. Arrowheads indicate the time of stimulation.
Frequency-dependent attenuation of synaptic current limits α7-nAChR contributions
The fact that α7-nAChRs rapidly desensitize in situ suggests an explanation for the short-lived calcium elevations that are α-Bgt-sensitive on-spine: the α7-nAChRs quickly may cease to contribute significantly at high-frequency stimulation. This was examined by using patch-clamp recording from neurons in situ to compare the stimulus-dependent attenuation of synaptic currents in response to low- and high-frequency stimulation of the presynaptic nerve root. At 1 Hz the peak whole-cell response showed no significant decline during the 5 sec stimulation period (Fig.6A). In contrast, at 50 Hz there was a rapid and large decrement in the whole-cell peak current. When the portion of the peak response attributable to α7-nAChRs was calculated (normally ≥90%; Liu and Berg, 1999b), it was found to decline to approximately one-third within 1 sec (Fig.6B). Although the α3*-nAChR response also declines, possibly because of reduced transmitter release (Fig. 6C), the decline was not as severe as that for α7-nAChRs.
Fig. 6.

Frequency-dependent changes in synaptic currents and the reliability of synaptic transmission. E15 ganglia were stimulated via the preganglionic nerve root at either 1 or 50 Hz for 5 sec while the postsynaptic responses were monitored with patch-clamp recording. A, Individual synaptic responses recorded in voltage-clamp mode at the beginning and end of the 5 sec stimulation period either at 1 Hz (left pair) or at 50 Hz (right pair). No change is seen in the amplitude or time course of the synaptic current after the stimulation period at 1 Hz, but a substantial decrement in amplitude and a change in shape are seen for the synaptic current after 50 Hz. B, Relative amplitude of the α7-nAChR portion of the synaptic current as a function of stimulation time either at 1 Hz (open circles) or 50 Hz (filled circles). Values (mean ± SEM) have been normalized to the initial response and are shown at 100 msec intervals for the 1st sec and at 200 msec intervals for the remaining 4 sec of stimulation. A large decline is seen after the first few stimuli at 50 Hz. C, Relative amplitude of α3*-nAChR responses as a function of stimulation time either at 1 Hz (open circles) or 50 Hz (filled circles). Values (mean ± SEM) have been normalized to the initial response and plotted as inC. The α3*-nAChR response declines with stimulation frequency although proportionately not as much as does the α7-nAChR response. D, Action potentials elicited by 1 Hz stimulation for 5 sec and recorded in current-clamp mode.E, Action potentials elicited by 50 Hz stimulation. No failures were seen at 1 Hz, but a significant incidence of failures is seen at 50 Hz.
Despite the reduction in synaptic currents at high-frequency stimulation, the synapses were still capable of triggering action potentials with some frequency. At 1 Hz, transmission was 100% reliable during the 5 sec test period as seen by the five action potentials (Fig. 6D), whereas at 50 Hz it was much reduced but not eliminated (Fig. 6E). Some neurons showed no failure in transmission for the first 10 stimuli at high frequency (Chang and Berg, 1999), but all showed substantial failures at later times. Examining six neurons yielded an average number of 75 ± 18 (mean ± SEM) for the number of action potentials elicited by the 250 stimuli delivered at 50 Hz for 5 sec; 13 ± 6 action potentials occurred during the final 2 sec of stimulation. The fact that at least some action potentials occurred in all cells throughout the test period raises the possibility that voltage-gated channels may contribute importantly to the cell-wide calcium signal seen at high-frequency stimulation.
Sustained calcium increases depend on multiple calcium sources
Two potential sources of calcium, in addition to nAChRs, are voltage-gated calcium channels and release from internal stores. Both are known to contribute to calcium levels in the neurons (Rathouz et al., 1996; Brain and Bennett, 1998). L-type calcium channels are distributed all over the cell body, as revealed by immunostaining with a monoclonal antibody directed against the α1csubunit; no preferential localization is seen on spine mats defined by staining for α7-nAChRs (Fig.7A–C). Blockade of L-type channels with 10 μm nifedipine had no obvious effect on calcium transients that were induced by 1 Hz synaptic stimulation (Fig. 7D,E), but it did have a dramatic impact on calcium elevations in response to 50 Hz. On-spine the elevations were reduced to baseline shortly after the initial maximum seen at 50 Hz (Fig. 7F,G). The slowly decaying component was lost completely, and the residual response had a mean time constant for decay of 1.2 ± 0.1 sec (n = 9). The amplitude of the residual response was 41 ± 5% (n = 9) of the peak response before nifedipine treatment. Thus both the relative amplitude and the time course of decay for the residual component approximated those calculated above for the on-spine calcium transient generated by α7-nAChRs at 50 Hz, although the small difference in decay constants suggested some contribution of L-type channels to the on-spine signal. The much more important role of L-type channels in the sustained calcium signal can be seen readily in off-spine regions; in these cases the 50 Hz signal was blocked almost completely by the nifedipine treatment (Fig. 7H,I).
Fig. 7.
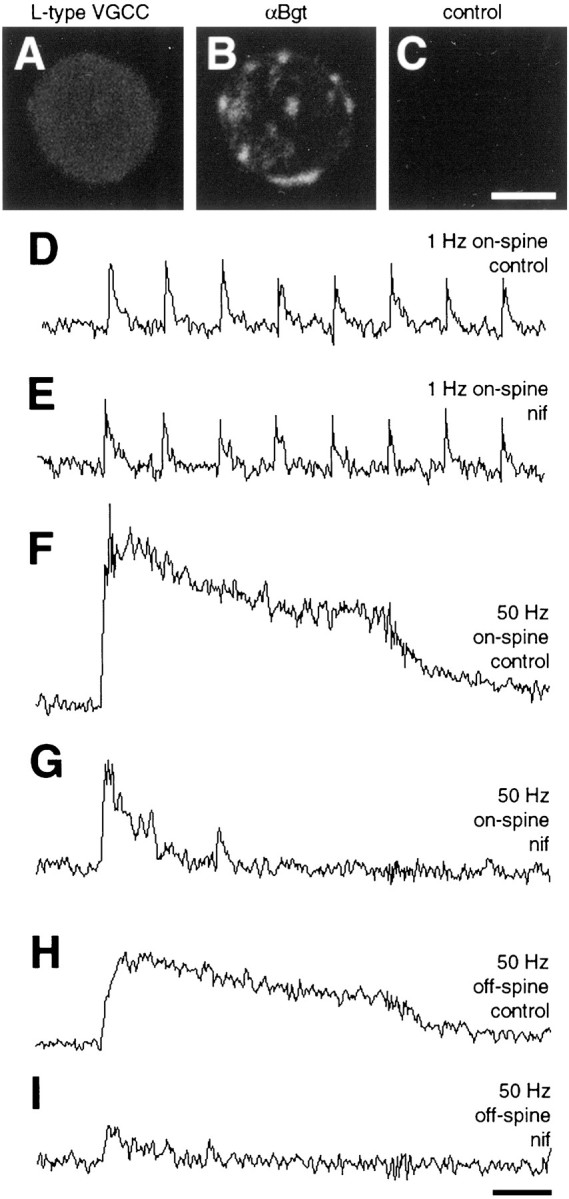
Contribution of voltage-gated L-type calcium channels to synaptically driven calcium elevations. A, Immunofluorescent detection of voltage-gated L-type calcium channels on a dissociated E15 ciliary neuron, using an antibody to the α1c subunit and fluorescent secondary antibody.B, Same neuron as in A costained with rhodamine-α-Bgt to reveal the α7-nAChRs clusters representing somatic spine mats. C, Control showing absence of labeling for an E15 neuron incubated with rabbit IgG instead of the α1c antibody. The same gain and exposure times were used for A–C. D–I, Continuous calcium imaging of on-spine and off-spine regions of a neuron stimulated at 1 or 50 Hz, as indicated, before (control) and after (nif) a 30 min incubation with 10 μm nifedipine to block voltage-gated L-type calcium channels. Almost all of the slowly decaying cell-wide calcium elevation was lost when L-type calcium channels were blocked; much of the fast-decaying on-spine calcium transient remained. Similar results were obtained for all nine neurons that were tested. Scale bar forA–C, 10 μm; calibration for D–G, 1 sec.
Calcium release from internal stores also was tested for a contribution to the sustained cell-wide elevation induced by high-frequency synaptic stimulation. A 30 min incubation with 10 μm ryanodine to block release from internal stores reduced the slowly decaying component of the on-spine calcium elevation caused by 50 Hz stimulation while having little, if any, effect on the more rapidly decaying component (Fig.8A,B). Off-spine the ryanodine again decreased the amplitude of the slowly decaying calcium component (Fig. 8C,D). No significant effect of ryanodine treatment was seen for the calcium transients induced by 1 Hz stimulation (data not shown). Treating ganglia with 1 μm thapsigargin to deplete internal calcium stores had the same effects as with ryanodine (data not shown). The results suggest that calcium-induced calcium release selectively amplifies the cell-wide calcium elevations caused by high-frequency synaptic stimulation and has little effect on the transients attributed to α7-nAChR activation.
Fig. 8.

Contribution of release from internal stores to synaptically driven calcium elevations. Shown is continuous calcium imaging of on-spine (A, B) and off-spine (C, D) regions of a neuron stimulated at 50 Hz before (control) and after (ryan) a 30 min incubation with 10 μm ryanodine to block calcium release from internal stores. Much of the slowly decaying cell-wide calcium elevation was lost when the release from internal stores was blocked; little effect was seen on the rapidly decaying on-spine response. Similar results were obtained with all 10 neurons that were tested. Calibration, 1 sec.
The ryanodine experiments also provide information about the distribution of receptors contributing to the calcium changes and about the sequence of events that is involved. Ryanodine establishes blockade early on with the protocols used, as demonstrated by the fact that it is already maximally effective in reducing the off-spine calcium signal generated by 50 Hz stimulation even at the earliest times (Fig.8C,D). The fact that ryanodine is unable to reduce the initial calcium elevations on-spine under these conditions although less than one-half of it is generated by α7-nAChRs leads to several conclusions. First, the compound seems to have no direct effect on either α7- or α3*-nAChRs, because both receptor subtypes contribute importantly and directly to the initial increase in on-spine calcium at high-frequency stimulation; second, release from internal stores apparently does not contribute to the initial signal on-spine; and third, essentially all of the cell-wide off-spine signal generated at 50 Hz arises from L-type channels and internal release with little, if any, coming directly from either α7- or α3*-nAChRs. This last conclusion is consistent with the known distribution of the receptors from imaging experiments (Shoop et al., 1999).
The strength of the nifedipine and ryanodine experiments depends on the specificity of the compounds. Neither significantly impacted the α7-nAChR response, as seen from the calcium signals at 1 Hz. For α3*-nAChRs the specificity was tested directly by incubating dissociated ciliary ganglion neurons in 100 nm α-Bgt for ≥1 hr to block α7-nAChRs and then by using whole-cell patch-clamp recording to measure the α3*-nAChR response to 20 μmnicotine before and during exposure to either 10 μmnifedipine or ryanodine. Ryanodine had no significant effect on the α3*-nAChR response (≤5% inhibition; n = 4 cells), but nifedipine produced a substantial inhibition (58 ± 7%, mean ± SEM; n = 5 cells). This raised questions about the mechanism by which nifedipine blocked the sustained calcium increases seen at high-frequency synaptic stimulation.
We examined this further by testing the ability of retrograde stimulation via the postganglionic nerve root to produce sustained cell-wide calcium elevations in the absence of synaptic input. The ganglia were perfused with 20 μmd-tubocurarine during such experiments to ensure that no intraganglionic nicotinic signaling (if such exists) could influence the outcome. Retrograde stimulation at 50 Hz produced a prominent calcium elevation throughout the soma both at on- and off-spine locations (Fig. 9A). The elevation was sustained throughout the period of stimulation and showed no evident decay until stimulation was stopped. Ryanodine treatment significantly reduced the plateau response (Fig. 9B), demonstrating that calcium release from internal stores contributed to the signal. With 1 Hz stimulation only a small, transient calcium increase was seen either on- or off-spine (Fig. 9C), approximately equivalent to that seen on-spine after the blockade of α7-nAChRs. Ryanodine treatment almost completely blocked the calcium transient induced by retrograde stimulation at 1 Hz (Fig.9D). Blockade of the L-type voltage-gated calcium channels with nifedipine completely blocked the calcium elevations induced either by 1 or 50 Hz retrograde stimulation (Fig. 9E). The fact that nifedipine was more effective than ryanodine at 50 Hz suggests that L-type channels not only contribute directly to the calcium signal but also may be needed to trigger ryanodine-sensitive release from internal stores. In any case, the results indicate that voltage-gated channels and release from internal stores define a pathway for elevating intracellular calcium levels in the neurons and that repetitive membrane depolarization is sufficient to activate the pathway. High-frequency stimulation of α3*-nAChRs depolarizes the membrane and may well use this same pathway to generate sustained cell-wide calcium increases.
Fig. 9.
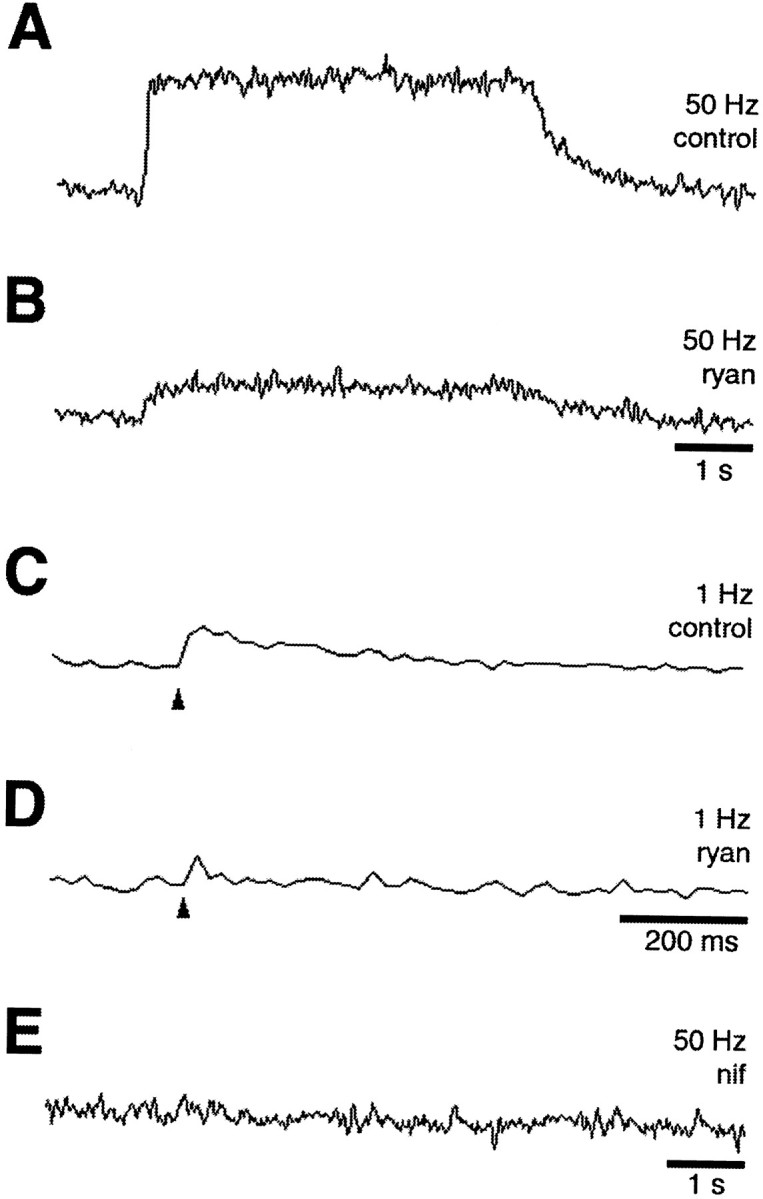
Calcium elevations elicited by retrograde stimulation. E15 ciliary ganglia were backfilled with dye and stimulated in a retrograde manner via the postganglionic nerve root at either 1 or 50 Hz while individual cells were imaged for calcium fluorescence on-spine. At 50 Hz the stimulation caused a sustained calcium increase (A) that was blocked substantially by ryanodine (B) and blocked completely at the end of the experiment by nifedipine (E). At 1 Hz the stimulation produced a small averaged signal (eight responses) on-spine (C) that also was decreased by ryanodine (D). Thearrowheads indicate the time of stimulus. Both L-type channels (n = 5 neurons) and release from internal stores (n = 10 neurons) contribute substantially to the sustained cell-wide calcium elevations seen at high-frequency stimulation. No difference was seen between on-spine and off-spine regions with respect to calcium increases at either 1 or 50 Hz retrograde stimulation (n = 21 neurons). Calibration: A, B, E, 1 sec; C, D, 200 msec.
DISCUSSION
The principal findings reported here are that low-frequency synaptic stimulation triggers calcium transients that are confined to somatic spine mats on ciliary neurons and that the transients are dependent on the activation of α7-nAChRs. High-frequency synaptic stimulation induces sustained cell-wide calcium elevations that can be triggered by α3*-nAChRs and depend on release from internal stores and very likely participation of voltage-gated L-type calcium channels as well. The temporal and spatial differences of the two kinds of patterns offer clear mechanisms by which the neuron could encode information about transmission efficiency and firing frequency, and, as such, enable the neuron to exploit calcium-dependent mechanisms for self-regulation of future signaling capabilities.
The imaging analysis performed here was made possible by the rapid -scanning feature of the recently developed multi-photon laser-scanning microscope and by the distinct topography of the somatic spine mats on ciliary neurons. Because the calcium transients elicited at low-frequency synaptic stimulation rapidly decay, the signal would have been much reduced or missed completely if captured at conventional imaging rates. The fact that the spines are grouped in distinct mats or clumps on the ciliary neuron soma also facilitated the on- versus off-spine quantification. Previous studies have demonstrated that the α7-nAChRs are highly concentrated on the spines, that the spines are arranged in discrete mats, and that fluorescent α-Bgt labeling of α7-nAChRs is a good marker for spine location (Shoop et al., 1999,2000). Key for success in correlating the location of spine mats and calcium transients in the present experiments was the fact that the preparation could be held rigidly for the duration with no detectable spatial drift of the cell that was being imaged and the fact that the α7-nAChR density was sufficient to bind adequate fluorescent α-Bgt for detection even in the presence of unbound toxin.
A low-affinity calcium fluor was used for the present experiments so that bound calcium would be released quickly and not artificially extend the time courses measured for calcium elevations in the cells. Because of large variations in the efficiency of dye loading, it was not feasible to manipulate the dye level in a controlled way to test directly whether the dye itself constrained the spatial or temporal patterns being reported for the calcium transients. The fact that an L-type channel blocker in the present experiments shortened the time course of decay for the calcium transient, however, suggests that the dye was not rate limiting in determining the duration. The dye previously has been used successfully to monitor rapid calcium transients in dendritic spines (Helmchen et al., 1999; Yuste et al., 1999).
The finding that α7-nAChRs are responsible for synaptically driven calcium transients in somatic spine mats is consistent with the high relative calcium permeability of the receptors and their being concentrated on the spines (Bertrand et al., 1993; Shoop et al., 1999). The on-spine calcium transients generated by α7-nAChR activation both at 1 and 50 Hz appear to be mainly independent of contributions from L-type channels and release from internal stores. At 1 Hz neither nifedipine nor ryanodine had any effect on the transients although α-Bgt almost completely blocked them. At 50 Hz nifedipine had the most effect, sharply reducing the sustained calcium elevation, but it had little effect on the rapidly decaying α-Bgt-sensitive component generated by α7-nAChRs. The nifedipine-resistant component had the same relative peak amplitude (proportion of peak current before treatment) as did the proportion of the control response calculated to be α-Bgt-sensitive. A small difference in decay rate was observed for the two, but this could arise either from a small contribution of L-type channels to the rapidly decaying component or from the limitations of calculating a decay constant for a small, rapidly decaying component in the presence of a larger, more slowly decaying one. If L-type channels and calcium stores contribute to local calcium transients in spines, their contributions must be minor compared with that of α7-nAChRs. In fact, the high local concentrations of calcium produced in spines by α7-nAChRs transiently might inhibit nearby voltage-gated calcium channels (Levitan, 1999). Endoplasmic reticulum has been seen in ciliary spines (Shoop et al., 1999), but it may be more important for calcium buffering.
The sustained cell-wide calcium elevations induced by high-frequency synaptic stimulation depend on α3*-nAChRs, but not on α7-nAChRs, because the elevations can be blocked byd-tubocurarine, but not by α-Bgt. Although α3*-nAChRs are much less abundant than are α7-nAChRs, they are distributed more widely, being found both on spines and at postsynaptic densities on the soma (Jacob et al., 1984; Wilson Horch and Sargent, 1995; Williams et al., 1998; Shoop et al., 1999). The present measurements could not resolve the site of origin for the sustained calcium elevations; the speed of image collection was considerable, but not sufficient to distinguish differences in the rates of rise for calcium increases at different points along the cell surface.
The role of α3*-nAChRs in generating the sustained calcium elevations may be primarily that of a catalyst, acting to depolarize the membrane. Depolarizing the membrane would activate L-type calcium channels, and these, in turn, apparently can induce calcium release from internal stores, as the retrograde stimulation experiments demonstrate. The immunofluorescence staining of L-type channels showed that they are distributed all over the ciliary neuron soma, and membrane compartments likely to serve as sites of calcium release can be found throughout the soma as well (Pilar and Landmesser, 1976; Jacob and Berg, 1988). A second mode of action for α3*-nAChRs that cannot be excluded yet (given the partial inhibition of the receptors by nifedipine in the present experiments) is that they may permit sufficient calcium influx themselves to trigger some calcium-induced calcium release from internal stores.
Calcium imaging in chick ciliary ganglion neurons in situhas been used previously to examine the rate at which calcium levels in the neurons return to normal after varying periods of high-frequency stimulation (Brain and Bennett, 1998). The instrumentation that was used would not have detected the rapid on-spine calcium transients reported here, but the study was able to consider in some detail the mechanisms influencing calcium release from internal stores and those responsible for returning calcium levels to baseline in ciliary neurons (Brain and Bennett, 1998). Recovery was not examined in the present study, other than to determine mean time constants for return to baseline after 50 Hz stimulation. The fact that very little decrement occurred in the cell-wide calcium increase during the 5 sec stimulation at 50 Hz demonstrates the stamina of the signaling system.
What might be the purpose of synaptically driven calcium signaling in ciliary ganglion neurons? One possibility is that it helps to guide developmental events. Spontaneous bursting activity has been reported in a number of developing systems, including the visual system and the somatic motor pathway, and it has been postulated to shape neuronal development and circuit formation (Feller, 1999; Milner and Landmesser, 1999). It is not known whether spontaneous bursting activity occurs in the ciliary ganglion during embryogenesis, but the fact that the ganglion represents a motor pathway makes this a consideration. The mature calyx synapse also can support high-frequency signaling (Dryer, 1994), but it is not known how often the synapse is called on to do so in vivo. The present results indicate that high-frequency signaling can produce sustained cell-wide calcium elevations, raising the possibility of excitotoxicity. Chronic exposurein ovo to nicotinic antagonists in general and α-Bgt in particular have pronounced and complex effects on neuronal survival and development in the ciliary ganglion (Meriney et al., 1987). It has not yet been possible, however, to dissect unambiguously the contributions of ganglionic receptors and peripheral muscle receptors to these events.
The fact that the synaptically driven calcium transients persist into posthatch chicks and retain many of the features seen earlier during development suggests that the calcium signaling may play a regulatory role in the mature system. An attractive possibility is that synaptically driven calcium transients in the ciliary ganglion regulate synaptic plasticity, as is the case in the CNS. Several forms of synaptic plasticity have been reported for the calyx synapse on ciliary neurons; these include facilitation, post-tetanic potentiation (PTP), and long-term potentiation (LTP; Martin and Pilar, 1964b; Poage and Zengel, 1993; Scott and Bennett, 1993a,b; Brain and Bennett, 1995). In addition, α7-nAChRs on ciliary ganglion neurons undergo activity-dependent rundown, as do NMDA receptors on hippocampal spines, and the rundown depends on calcium influx and the ensuing balance of activities between calcium/calmodulin-dependent protein kinase II and calcineurin (Liu and Berg, 1999a). Thus calcium transients in somatic spines may act locally to regulate signal detection in the spine over the short term. Local calcium transients also may influence the shape or stability of the spine itself, as demonstrated for dendritic spines (for review, see Segal et al., 2000). Over the long range, synaptically driven changes in calcium levels could regulate gene expression (Mermelstein et al., 2000). Understanding these processes may provide information about nicotinic signaling elsewhere in the nervous system and offer new insight into the many functions of spines, whether dendritic or somatic.
Footnotes
This work was supported by National Institutes of Health Grants NS12601, NS35469, and RR04050 and by Tobacco-Related Disease Research Program Grant 9RT-0221. We thank Drs. Maryann Martone and Gary Fan (University of California, San Diego) for advice on sample preparation and image collection, and we thank Dr. Keith Brain (University of Sydney, Sydney, Australia) for advice on retrograde dye filling of neurons.
Correspondence should be addressed to Dr. Darwin K. Berg, Department of Biology 0357, University of California, San Diego, 9500 Gilman Drive, La Jolla, CA 92093-0357. Email: dberg@ucsd.edu.
REFERENCES
- 1.Bertrand D, Galzi JL, Devillers-Thiery A, Bertrand S, Changeux J-P. Mutations at two distinct sites within the channel domain M2 alter calcium permeability of neuronal α7 nicotinic receptor. Proc Natl Acad Sci USA. 1993;90:6971–6975. doi: 10.1073/pnas.90.15.6971. [DOI] [PMC free article] [PubMed] [Google Scholar]
- 2.Brain KL, Bennett MR. Calcium in the nerve terminals of chick ciliary ganglia during facilitation, augmentation, and potentiation. J Physiol (Lond) 1995;489:637–648. doi: 10.1113/jphysiol.1995.sp021079. [DOI] [PMC free article] [PubMed] [Google Scholar]
- 3.Brain KL, Bennett MR. Calcium transients evoked by action potentials in the somata of chick ciliary neurons. J Auton Nerv Syst. 1998;71:120–133. doi: 10.1016/s0165-1838(98)00066-6. [DOI] [PubMed] [Google Scholar]
- 4.Chang K, Berg DK. Dependence of circuit function on nicotinic acetylcholine receptors containing α7 subunits. J Neurosci. 1999;19:3701–3710. doi: 10.1523/JNEUROSCI.19-10-03701.1999. [DOI] [PMC free article] [PubMed] [Google Scholar]
- 5.Chiappinelli VA. Kappa-bungarotoxin: a probe for the neuronal nicotinic receptor in the avian ciliary ganglion. Brain Res. 1983;277:9–21. doi: 10.1016/0006-8993(83)90902-2. [DOI] [PubMed] [Google Scholar]
- 6.Choi DW. Excitotoxic cell death. J Neurobiol. 1992;23:1261–1276. doi: 10.1002/neu.480230915. [DOI] [PubMed] [Google Scholar]
- 7.Couturier S, Bertrand D, Matter J-M, Hernandez M-C, Bertrand S, Millar N, Valera S, Barkas T, Ballivet M. A neuronal nicotinic acetylcholine receptor subunit (α7) is developmentally regulated and forms a homo-oligomeric channel blocked by α-Btx. Neuron. 1990;5:847–856. doi: 10.1016/0896-6273(90)90344-f. [DOI] [PubMed] [Google Scholar]
- 8.Dryer S. Functional development of the parasympathetic neurons of the avian ciliary ganglion: a classic model system for the study of neuronal differentiation and development. Prog Neurobiol. 1994;43:281–322. doi: 10.1016/0301-0082(94)90003-5. [DOI] [PubMed] [Google Scholar]
- 9.Fan GY, Fujisaki H, Miyawaki A, Tsay RK, Tsien RY, Ellisman MH. Video-rate scanning two-photon excitation fluorescence microscopy and ratio imaging with cameleons. Biophys J. 1999;76:2412–2420. doi: 10.1016/S0006-3495(99)77396-0. [DOI] [PMC free article] [PubMed] [Google Scholar]
- 10.Feller MB. Spontaneous correlated activity in developing neural circuits. Neuron. 1999;22:653–656. doi: 10.1016/s0896-6273(00)80724-2. [DOI] [PubMed] [Google Scholar]
- 11.Harris KM. Structure, development, and plasticity of dendritic spines. Curr Opin Neurobiol. 1999;9:343–348. doi: 10.1016/s0959-4388(99)80050-6. [DOI] [PubMed] [Google Scholar]
- 12.Helmchen F, Svoboda K, Denk W, Tank DW. In vivo dendritic calcium dynamics in deep-layer cortical pyramidal neurons. Nat Neurosci. 1999;2:989–996. doi: 10.1038/14788. [DOI] [PubMed] [Google Scholar]
- 13.Jacob MH, Berg DK. The ultrastructural localization of α-bungarotoxin binding sites in relation to synapses on chick ciliary ganglion neurons. J Neurosci. 1983;3:260–271. doi: 10.1523/JNEUROSCI.03-02-00260.1983. [DOI] [PMC free article] [PubMed] [Google Scholar]
- 14.Jacob MH, Berg DK. The distribution of acetylcholine receptors in chick ciliary ganglion neurons following disruption of ganglionic connections. J Neurosci. 1988;8:3838–3849. doi: 10.1523/JNEUROSCI.08-10-03838.1988. [DOI] [PMC free article] [PubMed] [Google Scholar]
- 15.Jacob MH, Berg DK, Lindstrom JM. Shared antigenic determinant between the Electrophorus acetylcholine receptor and a synaptic component on chicken ciliary ganglion neurons. Proc Natl Acad Sci USA. 1984;81:3223–3227. doi: 10.1073/pnas.81.10.3223. [DOI] [PMC free article] [PubMed] [Google Scholar]
- 16.Koch C, Zador A. The function of dendritic spines: devices subserving biochemical rather than electrical compartmentalization. J Neurosci. 1993;13:413–422. doi: 10.1523/JNEUROSCI.13-02-00413.1993. [DOI] [PMC free article] [PubMed] [Google Scholar]
- 17.Levitan IB. It is calmodulin after all! Mediator of the calcium modulation of multiple ion channels. Neuron. 1999;22:645–648. doi: 10.1016/s0896-6273(00)80722-9. [DOI] [PubMed] [Google Scholar]
- 18.Liu Q-S, Berg DK. Actin filaments and the opposing actions of CaM kinase II and calcineurin in regulating α7-containing nicotinic receptors on chick ciliary ganglion neurons. J Neurosci. 1999a;19:10280–10288. doi: 10.1523/JNEUROSCI.19-23-10280.1999. [DOI] [PMC free article] [PubMed] [Google Scholar]
- 19.Liu Q-S, Berg DK. Extracellular calcium regulates the responses of both α3- and α7-containing nicotinic receptors on chick ciliary ganglion neurons. J Neurophysiol. 1999b;82:1124–1132. doi: 10.1152/jn.1999.82.3.1124. [DOI] [PubMed] [Google Scholar]
- 20.Malenka RC, Nicoll RA. Long-term potentiation—a decade of progress? Science. 1999;285:1870–1874. doi: 10.1126/science.285.5435.1870. [DOI] [PubMed] [Google Scholar]
- 21.Martin AR, Pilar G. An analysis of electrical coupling at synapses in the avian ciliary ganglion. J Physiol (Lond) 1964a;171:454–475. doi: 10.1113/jphysiol.1964.sp007390. [DOI] [PMC free article] [PubMed] [Google Scholar]
- 22.Martin AR, Pilar G. Presynaptic and postsynaptic events during post-tetanic potentiation and facilitation in the avian ciliary ganglion. J Physiol (Lond) 1964b;175:17–30. doi: 10.1113/jphysiol.1964.sp007500. [DOI] [PMC free article] [PubMed] [Google Scholar]
- 23.McNerney ME, Pardi D, Pugh PC, Nai Q, Margiotta JF. Expression and channel properties of α-bungarotoxin-sensitive nicotinic acetylcholine receptors on chick ciliary and choroid neurons. J Neurophysiol. 2000;84:1314–1329. doi: 10.1152/jn.2000.84.3.1314. [DOI] [PubMed] [Google Scholar]
- 24.Meriney SD, Pilar G, Ogawa M, Nunez R. Differential neuronal survival in the avian ciliary ganglion after chronic acetylcholine receptor blockade. J Neurosci. 1987;7:3840–3849. doi: 10.1523/JNEUROSCI.07-12-03840.1987. [DOI] [PMC free article] [PubMed] [Google Scholar]
- 25.Mermelstein PG, Bito H, Deisseroth K, Tsien RW. Critical dependence of cAMP response element-binding protein phosphorylation on L-type calcium channels supports a selective response to EPSPs in preference to action potentials. J Neurosci. 2000;20:266–273. doi: 10.1523/JNEUROSCI.20-01-00266.2000. [DOI] [PMC free article] [PubMed] [Google Scholar]
- 26.Milner LD, Landmesser LT. Cholinergic and GABAergic inputs drive patterned spontaneous motoneuron activity before target contact. J Neurosci. 1999;19:3007–3022. doi: 10.1523/JNEUROSCI.19-08-03007.1999. [DOI] [PMC free article] [PubMed] [Google Scholar]
- 27.Muller W, Connor JA. Dendritic spines as individual neuronal compartments for synaptic Ca2+ responses. Nature. 1991;354:73–76. doi: 10.1038/354073a0. [DOI] [PubMed] [Google Scholar]
- 28.Pilar G, Landmesser L. Ultrastructural differences during embryonic cell death in normal and peripherally deprived ciliary ganglia. J Cell Biol. 1976;68:339–356. doi: 10.1083/jcb.68.2.339. [DOI] [PMC free article] [PubMed] [Google Scholar]
- 29.Poage RE, Zengel JE. Kinetic and pharmacological examination of stimulation-induced increases in synaptic efficacy in the chick ciliary ganglion. Synapse. 1993;14:81–89. doi: 10.1002/syn.890140111. [DOI] [PubMed] [Google Scholar]
- 30.Rathouz MM, Vijayaraghavan S, Berg DK. Elevation of intracellular calcium levels in neurons by nicotinic acetylcholine receptors. Mol Neurobiol. 1996;12:117–131. doi: 10.1007/BF02740649. [DOI] [PubMed] [Google Scholar]
- 31.Schoepfer R, Conroy WG, Whiting P, Gore M, Lindstrom J. Brain α-bungarotoxin binding protein cDNAs and mAbs reveal subtypes of this branch of the ligand-gated ion channel gene superfamily. Neuron. 1990;5:35–48. doi: 10.1016/0896-6273(90)90031-a. [DOI] [PubMed] [Google Scholar]
- 32.Scott TRD, Bennett MR. The effect of ions and second messengers on long-term potentiation of chemical transmission in avian ciliary ganglia. Br J Pharmacol. 1993a;110:461–469. doi: 10.1111/j.1476-5381.1993.tb13833.x. [DOI] [PMC free article] [PubMed] [Google Scholar]
- 33.Scott TRD, Bennett MR. The effect of nitric oxide on the efficacy of synaptic transmission through the chick ciliary ganglion. Br J Pharmacol. 1993b;110:627–632. doi: 10.1111/j.1476-5381.1993.tb13857.x. [DOI] [PMC free article] [PubMed] [Google Scholar]
- 34.Segal M, Korkotian E, Murphy DD. Dendritic spine formation and pruning: common cellular mechanisms? Trends Neurosci. 2000;23:53–57. doi: 10.1016/s0166-2236(99)01499-x. [DOI] [PubMed] [Google Scholar]
- 35.Seguela P, Wadiche J, Dineley-Miller K, Dani JA, Patrick JW. Molecular cloning, functional properties, and distribution of rat brain α7: a nicotinic cation channel highly permeable to calcium. J Neurosci. 1993;13:596–604. doi: 10.1523/JNEUROSCI.13-02-00596.1993. [DOI] [PMC free article] [PubMed] [Google Scholar]
- 36.Shoop RD, Martone ME, Yamada N, Ellisman MH, Berg DK. Neuronal acetylcholine receptors with α7 subunits are concentrated on somatic spines for synaptic signaling in embryonic chick ciliary ganglia. J Neurosci. 1999;19:692–704. doi: 10.1523/JNEUROSCI.19-02-00692.1999. [DOI] [PMC free article] [PubMed] [Google Scholar]
- 37.Shoop RD, Yamada N, Berg DK. Cytoskeletal links of neuronal acetylcholine receptors containing α7 subunits. J Neurosci. 2000;20:4021–4029. doi: 10.1523/JNEUROSCI.20-11-04021.2000. [DOI] [PMC free article] [PubMed] [Google Scholar]
- 38.Svoboda K, Tank DW, Denk W. Direct measurement of coupling between dendritic spines and shafts. Science. 1996;272:716–719. doi: 10.1126/science.272.5262.716. [DOI] [PubMed] [Google Scholar]
- 39.Tsien RY, Bacskai BJ. Video-rate confocal microscopy. In: Pawley JB, editor. Handbook of biological confocal microscopy. Plenum; New York: 1995. pp. 459–487. [Google Scholar]
- 40.Ullian EM, McIntosh JM, Sargent PB. Rapid synaptic transmission in the avian ciliary ganglion is mediated by two distinct classes of nicotinic receptors. J Neurosci. 1997;17:7210–7219. doi: 10.1523/JNEUROSCI.17-19-07210.1997. [DOI] [PMC free article] [PubMed] [Google Scholar]
- 41.Vernallis AB, Conroy WG, Berg DK. Neurons assemble acetylcholine receptors with as many as three kinds of subunits while maintaining subunit segregation among receptor subtypes. Neuron. 1993;10:451–464. doi: 10.1016/0896-6273(93)90333-m. [DOI] [PubMed] [Google Scholar]
- 42.Williams BM, Tamburni MK, Schwartz Levey M, Bertrand S, Bertrand D, Jacob MH. The long internal loop of the α3 subunit targets nAChRs to subdomains within individual synapses on neurons in vivo. Nat Neurosci. 1998;1:557–562. doi: 10.1038/2792. [DOI] [PubMed] [Google Scholar]
- 43.Wilson Horch HL, Sargent PB. Perisynaptic surface distribution of multiple classes of nicotinic acetylcholine receptors on neurons in the chicken ciliary ganglion. J Neurosci. 1995;15:7778–7795. doi: 10.1523/JNEUROSCI.15-12-07778.1995. [DOI] [PMC free article] [PubMed] [Google Scholar]
- 44.Yuste R, Denk W. Dendritic spines as basic functional units of neuronal integration. Nature. 1995;375:682–684. doi: 10.1038/375682a0. [DOI] [PubMed] [Google Scholar]
- 45.Yuste R, Majewska A, Cash SS, Denk W. Mechanisms of calcium influx into hippocampal spines: heterogeneity among spines, coincidence detection by NMDA receptors, and optical quantal analysis. J Neurosci. 1999;19:1976–1987. doi: 10.1523/JNEUROSCI.19-06-01976.1999. [DOI] [PMC free article] [PubMed] [Google Scholar]
- 46.Zhang Z-W, Coggan JS, Berg DK. Synaptic currents generated by neuronal acetylcholine receptors sensitive to α-bungarotoxin. Neuron. 1996;17:1231–1240. doi: 10.1016/s0896-6273(00)80253-6. [DOI] [PubMed] [Google Scholar]