Abstract
Interaural time differences (ITDs) are an important cue for azimuthal sound localization. Sensitivity to this cue depends on temporal synchrony to the waveform (i.e., phase locking) that begins in the hair cells and is relayed to the neural comparators. The synchrony function is low-pass. Therefore, it is expected that neural tuning to ITDs will become narrower with frequency according to a 1/frequency function. To test this, we measured ITD tuning across frequency in neurons from the superior olivary complex, the dorsal nucleus of the lateral lemniscus, the inferior colliculus, the auditory thalamus, and the auditory cortex. For some neurons in each nucleus, the ITD tuning width did become systematically narrower by the expected 1/frequency relationship. However, in other neurons the ITD tuning width was nearly constant across frequency. Constant ITD tuning width was infrequently observed in neurons of the superior olivary complex but was common in neurons in structures above the superior olivary complex. The nearly constant ITD tuning was caused both by sharper ITD tuning at low frequencies and broader tuning at higher frequencies within the low-frequency band. Neurons with nearly constant tuning to ITDs may be the mechanism underlying the perception of ITDs in humans in which just-noticeable differences to changes in ITD decrease by less than the 1/frequency prediction.
Keywords: auditory neurophysiology, auditory pathways, interaural temporal disparities, sound localization, low-frequency hearing, low-frequency signals
An important cue for the azimuthal location of sound sources is the difference in the times of arrival of sounds at the two ears or interaural time differences (ITDs). The neural coding of ITDs begins in the superior olivary complex (SOC), where inputs from the two sides first converge. After this, the ITD information is sent to higher centers, e.g., the dorsal nucleus of the lateral lemniscus (DNLL), the inferior colliculus (IC), the auditory thalamus, and the auditory cortex.
The cochlea is arrayed according to frequency, and each of the major brain centers where ITD is encoded has a cochleotopic organization. Thus, the frequency of sounds is an important parameter that is likely to influence the manner in which ITDs are encoded. Indeed, critical to modern models is the mechanism by which ITD is integrated across frequency (Colburn, 1973; Stern and Colburn, 1978; Shackelton et al., 1992, 2000; Stern and Trahiotis, 1992; Trahiotis and Stern, 1994). Behaviorally, it is known that the resolution for detecting changes in the ITD increases with stimulus frequency (Klumpp and Eady, 1956;Zwislocki and Feldman, 1956). This result is expected because timing information initially derives from synchrony to the fine structure of the waveform (i.e., phase locking) in the auditory nerve. The degree of synchrony in the nerve is relatively constant with frequency up to ∼1 kHz and approximates a half-wave-rectified version of the input signal (Johnson, 1980; Palmer and Russell, 1986). Because of the constancy in the degree of synchrony with frequency, the absolute time over which firing can occur is increased at low compared with high frequencies (within the low-frequency band, i.e., up to ∼1 kHz in humans). This increase may account for the loss of sensitivity to changes in ITDs at low frequencies that is observed in humans.
However, if the loss of sensitivity at low frequencies were caused entirely by a constant degree of synchrony, the behavioral function would be expected to decline by 1/frequency (1/f) as the frequency is lowered. Instead, the actual decline is considerably <1/f. A possible reason is that synchrony beyond the auditory nerve is not constant with frequency, as has been shown recently for some neurons in the anteroventral cochlear nucleus (Joris et al., 1994b). However, the role of this transformation in the tuning of neurons to ITDs has not been examined, nor has an evaluation of ITD tuning as a function of frequency been undertaken. Thus, for this study we measured the tuning to ITDs as a function of frequency in neurons from several ascending structures of the brain, including the SOC, DNLL, IC, auditory thalamus, and auditory cortex. We report that many neurons above the level of the SOC show nearly constant ITD tuning widths with frequency and that on average the neural function closely parallels that for behavioral performance.
MATERIALS AND METHODS
Single and multiunit recording was performed in female Dutch-Belted rabbits (1.5–2.5 kg). Surgical and experimental procedures have been described previously (Kuwada et al., 1987;Batra et al., 1989) and will be only briefly outlined here.
Surgical procedures. All surgery was performed using aseptic techniques on rabbits with clean external ears. Under anesthesia (ketamine, 35 mg/kg, i.m.; xylazine, 5 mg/kg, i.m.), a square brass rod was anchored to the skull using screws and dental acrylic. Several days later, the animal was reanesthetized, and a small rectangular hole (∼3 × 4 mm) was made in the skull overlying the intended structure. The hole was covered with sterilized medical elastopolymer. At this time, custom ear molds were made for sound delivery.
Recording procedures and data collection. All recordings were conducted in a double-walled, sound-insulated chamber. The awake rabbit was placed in a body stocking from which its head protruded, seated in a padded cradle, and further restrained using nylon straps. The stocking and straps provided only mild restraint, their primary purpose being to discourage movements that might cause injury to the rabbit. The rabbit's head was fixed in a constant position by clamping to the surgically implanted brass rod. After the rabbit was secured, the elastopolymer covering was removed to expose the opening in the skull. To eliminate possible pain or discomfort during the penetration of the electrode, a topical anesthetic (lidocaine) was applied to the dura for ∼5 min and then removed by aspiration. With these procedures, rabbits remained still for a period of ≥2 hr, an important criterion for single-neuron recording. Typically, a rabbit participated in daily recording sessions over a period of 2–6 months. A session was terminated if the rabbit showed any signs of discomfort. The rabbit's comfort was a priority both for ethical reasons and because movements made it difficult to record from single neurons.
Extracellular recordings were made with glass-coated, platinum–tungsten microelectrodes (tip diameter of 1–2 μm; impedances of 10–30 MΩ). The action potentials of single neurons or small clusters of neurons (two to three neurons) were amplified 5,000–20,000 times, isolated with the aid of a time/amplitude window discriminator (BAK Electronics, Germantown, MD), and timed relative to the stimulus onset with an accuracy of 10 μsec. Recordings that consisted of more than a few relatively large spikes were not included. For the “small cluster” recordings, we set the amplitude trigger high and used a narrow time window. Consequently, the small cluster recordings were probably dominated by the response of a single unit.
Acoustic stimulation. Stimuli were generated by a two-channel digital stimulation system (Rhode, 1976) and delivered independently to the two ears through Beyer DT-48 earphones coupled to the custom-fitted ear molds to form a sealed system. Pure tones were gated on and off with linear rise and fall times of 4.0 msec. In some animals, the amplitude and phase of tones were calibrated before the first recording session in each animal, by means of a probe tube that extended ∼1 mm from the end of the sound tube. The sound tube extended to within ∼2.5 cm of the tympanum. This calibration was used to deliver tones (60 Hz to 40 kHz in 20 Hz steps) of specified amplitude and phase. In previous animals, the sounds used during the recordings were calibrated using a brass tube with dimensions similar to that of the ear canal. The sounds were corrected for amplitude and phase on the basis of a calibration done in the ear canal just before the animal was killed (see Batra et al., 1989).
Sensitivity to ITDs was primarily assessed using binaural-beat stimuli. For low-frequency sounds (<2.5 kHz), the binaural-beat stimulus was created by delivering tones to the two ears that differed by 1 Hz, which resulted in a continuously varying ITD that ranged over (±) a period of the tonal frequency (Kuwada et al., 1979).
Data analysis. We divided our sample into peak- and trough-like neurons on the basis of their characteristic phase (Fitzpatrick et al., 2000). The characteristic phase (CP) is defined as the y-intercept in plots of stimulus frequency versus mean interaural phase of the response (Yin and Kuwada, 1983). Our peak-like neurons had CPs from 0.0 to 0.25 cycles (i.e., the peaks of their delay curves across frequency aligned or nearly aligned at a particular ITD). The trough-like neurons had CPs from 0.25 to 0.5 cycles (i.e., the troughs of their delay curves across frequency aligned or nearly aligned at a particular ITD).
We used the width of ITD tuning at the 50% response level between the maximum and minimum responses as a measure of the tuning to ITDs. To calculate these 50% ITD tuning widths, a 20-bin period histogram was first converted to interaural time on the basis of the frequency of the stimulus. Twenty bins were empirically found to be optimal for achieving an accurate measure of the tuning width (i.e., adding more bins did not substantially influence the width) while maintaining a smooth enough curve that the width could be reliably measured. As a test of whether the curve was in fact smooth enough, the 50% width was calculated in two ways: first, by starting from the peak of response and then traveling down the curve on both sides until the points of 50% response were reached and, second, by starting from the trough of response on each side and traveling up the curves until the points of 50% response were reached. If the widths calculated from these two measures differed by >50%, the data were not used; otherwise the two measures were averaged.
After the ITD tuning width was determined for each frequency, the points were plotted as log frequency versus log width, and a regression line was computed. If the widths decreased by 1/frequency, the slope of the regression line was expected to be −1. The correlation of the regression line (r) was not a reliable test for linearity because it is affected by the slope of the line. A test that overcomes this problem compares the mean square error of the best-fit line with that obtained from a random simulation (Yin and Kuwada, 1983). If the mean square error was less than that obtained from the random sample at a significance level of 5%, the slope was included in the sample.
RESULTS
The recordings were of either single neurons or small clusters of neurons (two to three neurons). The illustrated examples are all from single neurons. The summary data are from pooled single neurons and clusters of neurons because no notable differences were found when multiple-neuron recordings were included. A total of 712 neurons were recorded. Of these, 47 (23 single) were from the SOC, 138 (57 single) were from the DNLL, 301 (186 single) were from the IC, 90 (48 single) were from the auditory thalamus, and 136 (73 single) were from the auditory cortex.
Neurons had different forms of ITD tuning across frequency
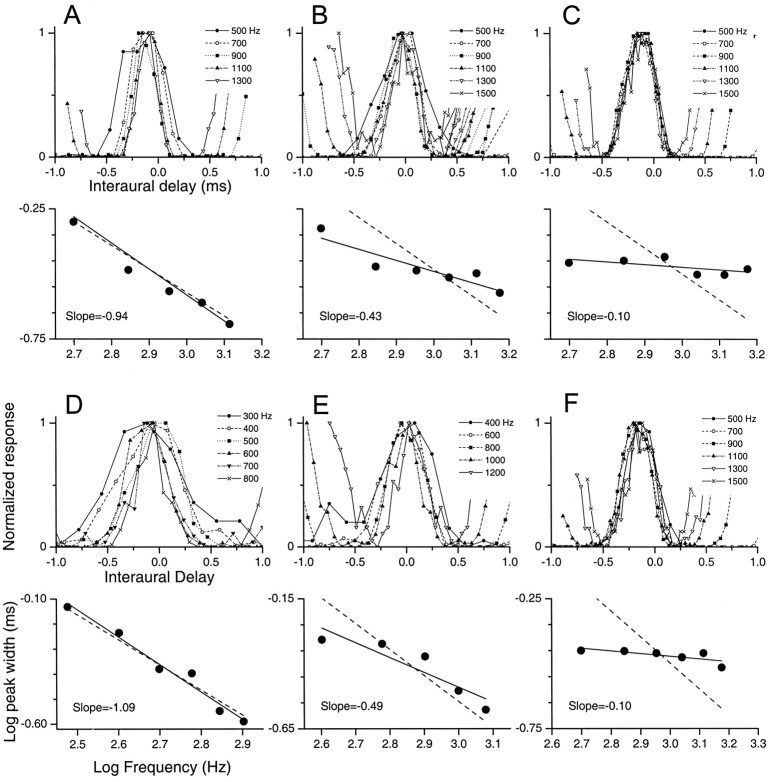
Some peak-like neurons displayed ITD tuning functions that followed a 1/f relationship (e.g., Fig.1A). In this example, the width of the ITD curves systematically increased as frequency was decreased (Fig. 1A, top panel). When the log width was plotted against log frequency (Fig.1A, bottom panel), the slope was nearly −1 (−0.94), indicating that this neuron followed a 1/f relationship.
Fig. 1.
Examples of different forms of ITD tuning for peak-like neurons. A–F, For each neuron, the top panel displays the ITD functions across frequency, and the bottom panel plots log frequency versus log peak width (solid lines). Dashed lines in bottom panels are the predicted 1/f function (slope = −1). Responses of three IC neurons are shown in A–C, and an SOC neuron, a DNLL neuron, and an auditory cortex neuron are shown inD–F, respectively. A, D, Some neurons decreased their peak widths with frequency according to a 1/f relationship. B, E, Others also decreased their peak width with frequency but by less than that predicted by a 1/f relationship. C, F, Finally, some neurons displayed near-constant peak width with frequency.
However, other peak-like neurons did not follow a 1/frelationship. For example, the neuron in Figure 1Bdisplayed ITD tuning widths that changed by <1/f(slope = −0.43), whereas others displayed nearly a constant ITD tuning width across frequency (Fig. 1C, slope = −0.10).
The responses in Figure 1A–C were recorded from neurons in the IC. A similar range of ITD tuning functions was seen at other brain levels (Fig. 1D–F). Figure1D shows an example of an SOC neuron in which the change in ITD tuning width across frequency closely followed a 1/f relationship. Figure 1E is an example from a DNLL neuron in which the ITD tuning width changed by <1/f, and Figure 1F is an example of a neuron from the auditory cortex in which the ITD tuning width was nearly constant across frequency.
Figure 2 compares the distribution of slopes of the log width versus log frequency for different structures along the auditory pathway. The primary difference in the distributions was that whereas in the SOC (Fig. 2E) there was approximately an equal number of neurons with slopes steeper or flatter than 1/f (dashed line, slope = −1.0), most neurons at higher levels (Fig. 2A–D) had slopes that were flatter than 1/f. Another major difference was that neurons with constant or near-constant tuning widths (slopes between −0.5 and 0.0) were almost absent in the SOC but were commonly observed at higher levels. These observations need to be tempered because of the small sample size of SOC neurons compared with that of the other structures.
Fig. 2.
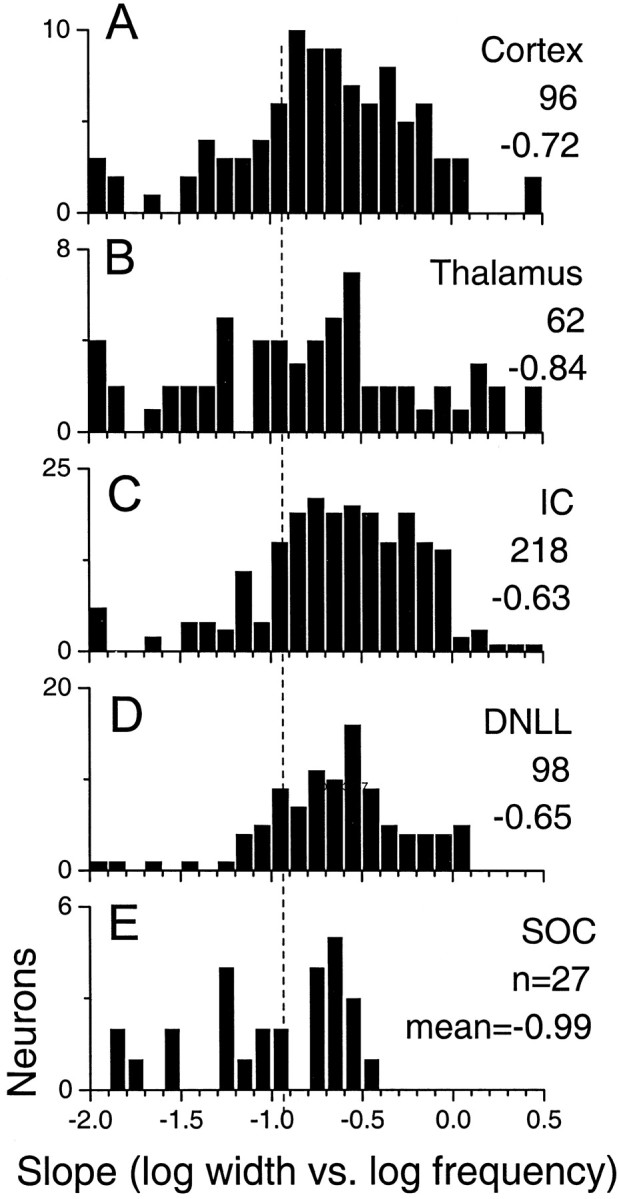
Distribution of the slopes of the log peak width versus log frequency function for peak-like neurons at different levels along the auditory pathway. The number of neurons and the mean slope for each level are indicated. The distributions, especially above the level of the SOC, are skewed to the right of a slope of −1 (dashed line), indicating that on average slopes are flatter than would be expected by a 1/frelationship.
Curiously, the mean slopes of the DNLL and IC were similar but then became slightly steeper at the thalamic and cortical levels. This change was primarily caused by an increase in the number of neurons in the thalamus and cortex with slopes that were steeper than 1/f. Thus, although the proportion of neurons with constant or near-constant tuning widths increased above the level of the SOC, the proportion of neurons with slopes steeper than 1/f also increased above the level of the IC. It is difficult to explain these changes. Perhaps neuron with slopes steeper or flatter than 1/f serve different functions. It is also possible that the steeper slopes were an artifact of behavioral state. Although our preparation is unanesthetized, the behavioral state of the animal is unknown. Thalamic and cortical neurons are especially vulnerable to behavioral state (e.g., alert or sleeping, anesthetized or unanesthetized).
What frequencies are associated with relatively constant ITD tuning?
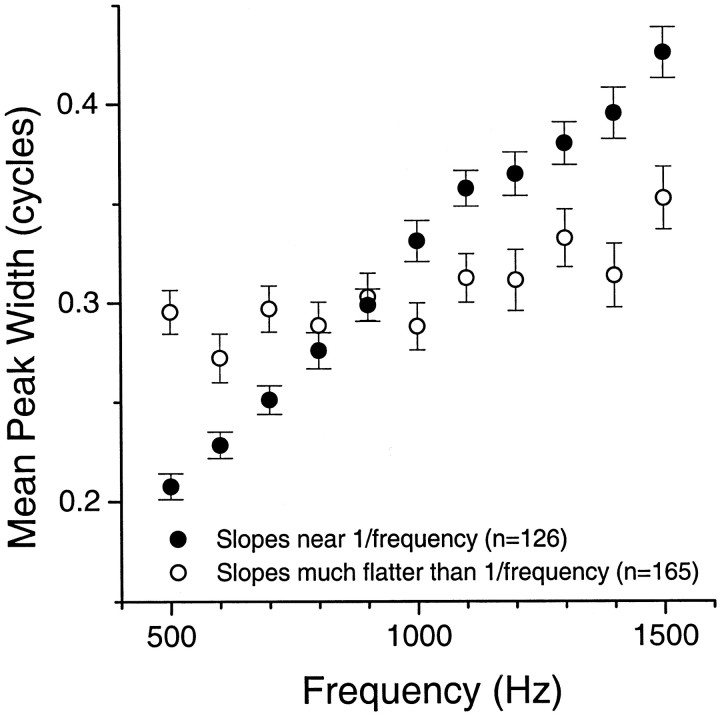
It is of interest whether the tendency toward constant ITD tuning widths across frequency is created via broader tuning to ITDs at higher frequencies or sharper tuning at lower frequencies. It appears that both occur. Figure 3 compares the average ITD tuning widths as a function of frequency for a group of neurons that displayed slopes near 1/f (i.e., slopes ±0.25 of −1) with that of another group that displayed constant or near-constant tuning width (i.e., slopes greater than −0.5). Each group was pooled from neurons in the DNLL, IC, auditory thalamus, and auditory cortex. Neurons from the SOC were excluded because there was only one with a slope greater than −0.5. Compared with neurons with slopes near 1/f, the ITD tuning widths were wider at higher frequencies (1000–1500 Hz) for neurons with constant or near-constant tuning widths and sharper at lower frequencies (500–800 Hz). Comparable results were obtained when each level was analyzed separately. Thus, nearly constant ITD tuning widths were caused by both a wider tuning at the upper end of the low-frequency band and a sharper tuning at lower frequencies. These results cannot be explained by differential frequency tuning of the two populations, because the magnitudes of response at each frequency for the two populations were not significantly different.
Fig. 3.
Mean peak widths in cycles as a function of frequency for two populations of neurons: those that had slopes (log width versus log frequency) that were near a 1/frelationship (i.e., ±0.25 of −1) and those that had slopes flatter than a 1/f relationship (greater than −0.5). Neurons were pooled from the DNLL, IC, auditory thalamus, and auditory cortex.
A mechanism for creating neurons with constant peak widths
Inhibitory mechanisms may play a role in maintaining constant peak widths across frequency (Fig. 4). Figure4A–L is a series of poststimulus time histograms, each showing the response to 1.1-sec-long tones in each ear at a frequency of 900 Hz at a different static ITD. As the static ITD was systematically changed, the response to the tone was suppressed below the spontaneous rate (dashed lines) at some ITDs (Fig.4A–C,G–I) and enhanced at others (Fig.4D–F,J–L). These differences resulted in a cyclic response to ITD (Fig. 4M, closed circles). When the ITD was suppressive, there was a response when the tone was turned off (Fig. 4A–C,G–I), and this off response was also cyclic with ITD (Fig. 4M,open circles). The suppression below the spontaneous rate at unfavorable ITDs along with an off response is consistent with an inhibitory input onto this IC neuron. Without this inhibition, it is likely that the peak width of the excitatory response would be broader.
Fig. 4.
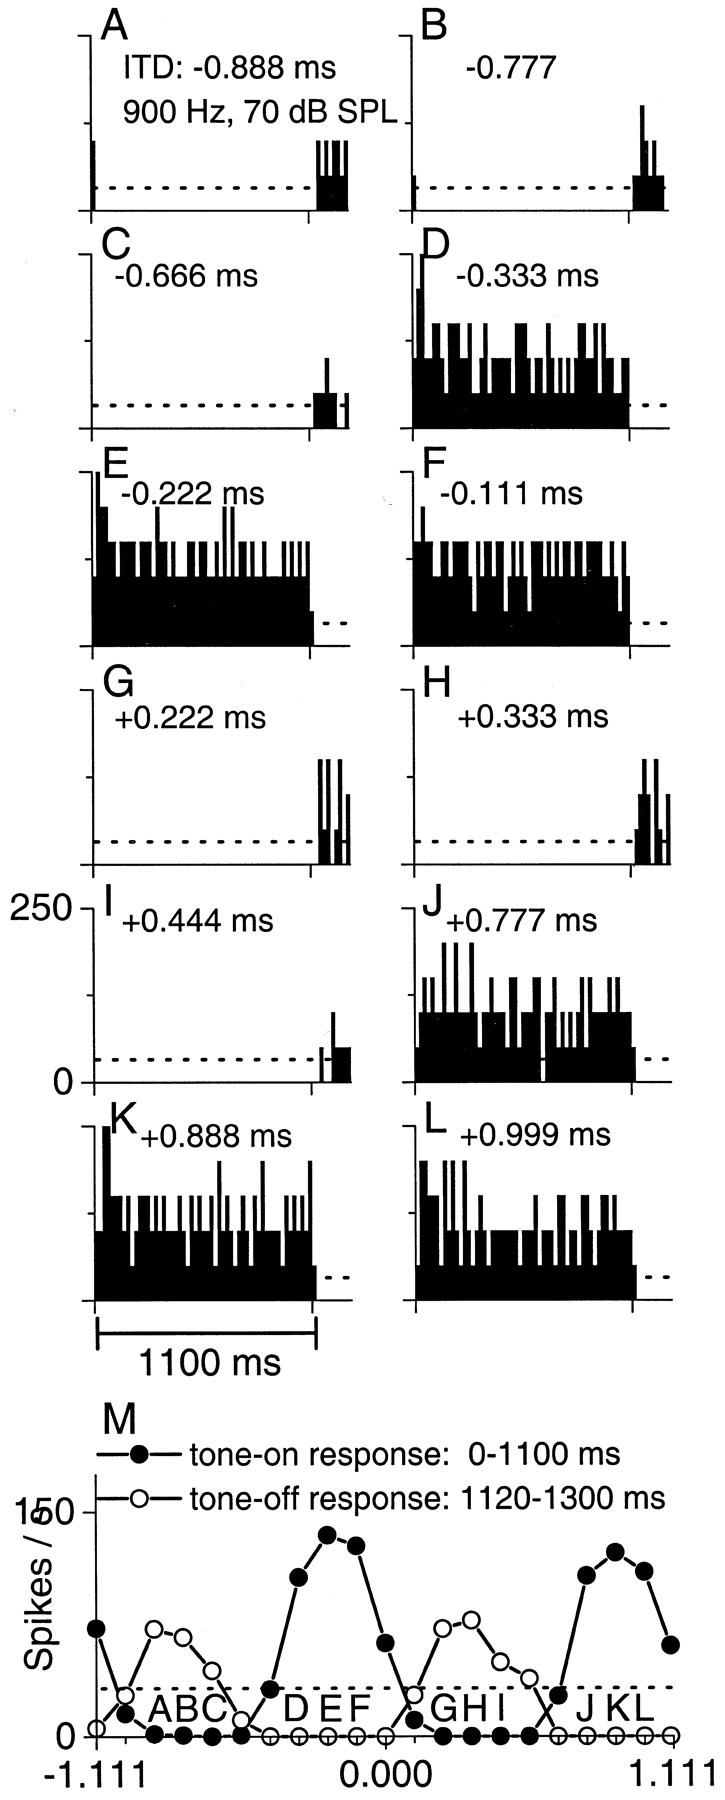
An IC neuron that shows excitatory–inhibitory interactions that may serve to create constant peak widths.A–L, Poststimulus time histograms to different static ITDs. The tones were 1100 msec long and were presented every 1300 msec.Dashed lines reflect the mean spontaneous activity.M, ITD functions plotted separately for the on response (filled circles, 100–1100 msec) and off response (open circles, 1120–1300 msec). Labeled responses refer to histograms. The rebound, off response, and suppression below the spontaneous rate at unfavorable ITDs suggest local inhibition. Because the inhibitory ITD function is out-of-phase and overlaps the excitatory ITD function, it could serve to decrease the peak width of an excitatory input. SPL, Sound pressure level.
Figure 5 plots the on and off response as a function of ITD at several stimulating frequencies for the neuron in Figure 4. The on response displays a near-constant ITD tuning width across frequencies (Fig. 5A). This neuron was the same as that shown in Figure 1C, so the constancy in peak widths across frequency was similar whether the change in ITD was dynamic (Fig. 1C) or static (Fig. 5A). When the peak portion of the on response was plotted with the off response (Fig.5B), the trough portions of the off response flanked and overlapped the borders of the peak response at all frequencies. The relation between the on and off functions was more clearly visualized when the on and off ITD functions were averaged separately across frequency (Fig. 5C). Here, the inhibition at unfavorable ITDs (inhibitory surround) was almost symmetrical about the excitation at favorable ITDs (excitatory center). In a simple scheme, the trough widths of the inhibitory surround should be constant across frequency to create peak responses of constant width. However, our estimates of the shape of the inhibitory surround are prone to error because this shape is solely based on the magnitude of the off response. Moreover, constant peak width also depends on the shape and magnitude of the excitatory peak before sharpening, the shape and magnitude of the inhibitory trough, and the threshold of the interaction. Nonetheless, it appears that for this neuron, constant ITD tuning width was created by an ever-increasing inhibitory surround as frequency was decreased.
Fig. 5.
The on and off ITD functions of the neuron in Figure 4 plotted for several frequencies. A, The normalized on ITD functions display a constant peak width across frequency. B, The normalized on and off ITD functions were plotted together. For clarity, only the peak portion of the on ITD functions were plotted. C, The on and off ITD functions in A and B were averaged separately to create a mean on and a mean off ITD function. Note that the inhibitory off ITD function centers around and flanks the excitatory on ITD function. In this way, constant peak widths across frequency could be created. contra, Contralateral; ipsi, ipsilateral.
Responses as a function of characteristic phase
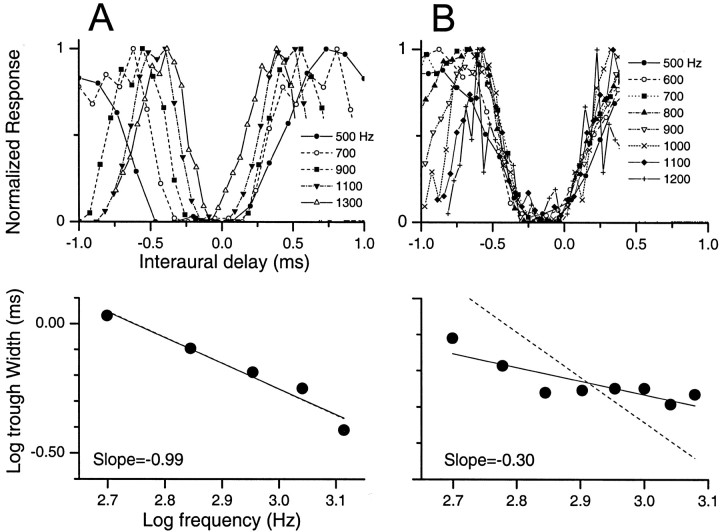
Until now we have considered only peak-like responses. We now consider neurons with trough-like responses. Recall that these are neurons with CPs between 0.25 and 0.5. Similar to some peak-like neurons (e.g., Fig. 1A,D), the width of ITD tuning across frequency in some trough-like neurons decreased by nearly 1/f (Fig.6A). In this example, the troughs align across frequency, and systematic changes can be observed in the trough widths. The slope of log frequency versus log trough width was very close to that predicted by a 1/frelationship.
Fig. 6.
Examples of different forms of ITD tuning for trough-like neurons. The organization is similar to that in Figure 1. A, An IC neuron that decreased its trough tuning widths with frequency according to a 1/frelationship. B, An IC neuron that displayed near-constant trough width with frequency.
However, in other trough-like neurons (e.g., Fig.6B), the widths of the troughs were nearly constant with frequency, analogous to the constant widths of some peak-like neurons (e.g., Fig. 1B,C,E,F). The slope of log frequency versus log trough width in this neuron (Fig.6B, bottom panel, slope = −0.30) was much less than that predicted by 1/f (slope = −1).
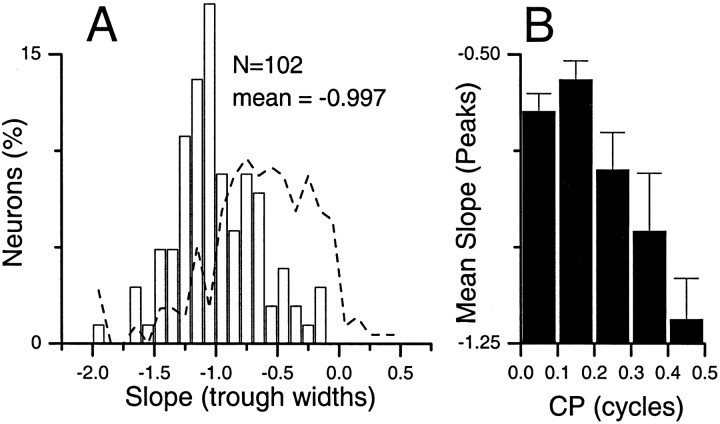
The distribution of slopes for trough-like neurons in the IC clustered around a slope of −1 (Fig.7A). Thus, despite the presence of some neurons such as that in Figure 6Bwith nearly constant trough widths, the widths on average were close to that predicted by a 1/f relationship. This is a marked contrast to peak-like neurons in the IC, where the slope for most neurons declined by much <1/f (Fig. 7A,dashed line). A similar distribution of slopes from trough-like neurons was seen at all other brain levels.
Fig. 7.
A, Distribution of the slopes of the log trough width versus log frequency function for trough-like neurons in the IC (open bars). The distribution of peak widths for peak-like neurons is shown for comparison (dashed line). B, Mean slopes of peak widths as a function of CP for neurons in the IC. Note that the slopes were flattest for peak-type neurons (i.e., CPs near 0 cycles) and steepest for trough-type neurons (i.e., CPs near 0.5 cycles).
The distributions described above are from groups of neurons that span wide ranges of CP, so that many intermediate-type neurons (CPs near ±0.25) are included. When these intermediate-type neurons were considered separately by plotting the results as a function of CP, a clear trend emerged. In Figure 7B, the average slopes of the peak widths are plotted as a function of CP for pooled neurons from the DNLL through the auditory cortex. The slopes were flattest for peak-type neurons (i.e., CPs near 0 cycles) and systematically increased with CP. For the slope of trough widths, the opposite trend occurred but over a smaller range (data not shown). Thus, it appears that there were systematic effects of CP on the changes of peak and trough widths with frequency and that the greatest difference from a 1/f relationship occurred for peak widths in peak-type neurons.
DISCUSSION
We have shown that in many neurons, especially above the level of the SOC, the tuning to ITDs tends toward constancy with frequency. In the following, we will first consider the degree to which the ITD tuning across brain levels is likely to be derived from central or peripheral processing. We will then discuss the functional implications of the results.
Neurons with nearly constant ITD tuning across frequency: central or peripheral processing?
There was an increase in the proportion of neurons with near-constant ITD tuning widths across frequency as information ascended from the SOC to midbrain levels. This suggests that the creation of such response properties occurs, at least in part, between the SOC and the midbrain. It is also likely that inhibitory mechanisms play a role in this central processing. In support of this, we showed an example of a neuron (Figs. 4, 5) in which inhibitory inputs in the IC appeared to create constant ITD tuning widths across frequency.
It is puzzling that neurons with constant or near-constant tuning widths show a broadening at higher frequencies (Fig. 3). A simple inhibitory mechanism cannot explain both a sharpening at lower frequencies and a broadening at higher frequencies. However, it is important to note that the difference in tuning width (expressed as a proportion of a cycle) between the two populations at high frequencies translates to a much smaller difference in absolute time than does the difference at low frequencies. Thus, in a functional sense, the sharpening at low frequencies may be the major contributor to the neural population that displays constant or near-constant tuning widths.
Our results from the SOC should be approached with some caution. The difficulty of recording from the SOC is well known, and we recorded many fewer neurons there than in the other brain levels. It is therefore necessary to examine evidence from previous studies to consider the possible contribution of sites peripheral to the SOC in creating neurons with relatively constant ITD tuning widths across frequency.
Although previous studies did not specifically examine the tuning to ITDs as a function of frequency, many examples of ITD tuning curves or synchronization functions across frequency exist. In most cases, these examples show the expected broader ITD tuning as the frequency is lowered. However, there are examples of neurons with ITD tuning widths that are nearly constant across frequency in the IC of the cat (Yin and Kuwada, 1983) and guinea pig (McAlpine et al., 1996). Thus, our results are not specific to the rabbit. One example from the cat medial superior olive [Yin and Chan (1990), their Fig. 15D] shows monaural synchronization functions that declined with frequency, which would be expected to yield a relatively constant ITD tuning width. However, the proportion of such neurons was not reported. Thus, the published evidence is scanty as to whether the transformation we observed between the SOC and higher levels is common across species.
There is evidence that at least some of the constancy we have described is caused by processing peripheral to the SOC. For example, in the auditory nerve there are several examples from individual fibers in which the synchrony declined with increasing frequency (Anderson, 1973). Unfortunately, the sample size is very small, so the generality of such functions is not known. The synchrony functions of bushy cells in the cochlear nucleus that provide inputs to the main nuclei in the SOC are generally reported to be comparable with those in the nerve (Goldberg and Brownell, 1969; Lavine, 1971; Rose et al., 1974; Bourk, 1976; Palmer and Russell, 1986; Rhode and Smith, 1986; Smith and Rhode, 1987; Blackburn and Sachs, 1989). However, much higher synchrony than that found in nerve fibers was reported in recordings from trapezoid body fibers, some of which when backfilled were found to be from bushy cells in the cochlear nucleus (Joris et al., 1994a). Another study (Joris et al., 1994b) showed that neurons with high characteristic frequencies (CFs) stimulated by low-frequency sounds often had even higher synchrony than did low-CF cells, and many of these had synchrony functions that declined with increasing frequency. We therefore examined our populations of neurons at each level to see whether high-CF cells (CFs > 2.5 kHz) were more likely to have constant ITD tuning across frequency than were low-CF cells. For each level, there was no significant difference between the two populations (t tests; p > 0.05). Thus, it seems unlikely that the CF of the fiber is a critical determinant in creating neurons with constant ITD tuning widths. However, the presence of neurons in the auditory nerve and cochlear nucleus that have synchrony functions that decline with frequency indicates that at least some of our results may be caused by processing peripheral to the SOC.
Functional importance of neurons with nearly constant ITD tuning across frequency
Differences between peak- and trough-type neurons
Most of the neurons in which ITD tuning width with frequency tended toward constancy were peak-like. In some trough-like neurons the change was in the other direction, with the trough widths tending toward constancy. In these neurons it is reasonable to assume that the processing emphasis was on the troughs rather than on the peaks. However, on average the trough-like neurons did not show a deviation from 1/f, whereas the peak-like neurons did. In addition, the effect of characteristic phase was systematic, such that on average neurons with CPs close to 0 cycles showed the strongest trend toward constancy of peak widths and the trend decreased as the CP approached 0.5. Thus, characteristic phase is an important factor in determining the degree to which a neuron is likely to deviate from 1/frequency.
Peak-like neurons are generally most active for small ITDs associated with sound sources near the midline, whereas trough-like neurons are generally inhibited by these small ITDs and are most active for larger ITDs (Fitzpatrick et al., 2000). Because behavioral studies testing the effect of frequency on the resolution of ITD sensitivity have used small ITDs (Klumpp and Eady, 1956; Zwislocki and Feldman, 1956), it is likely that the responses of peak-like neurons dominated the behavior. It is therefore unclear what role the difference in tuning with frequency between peak- and trough-like neurons may play in perception.
Correlation of neural and behavioral results
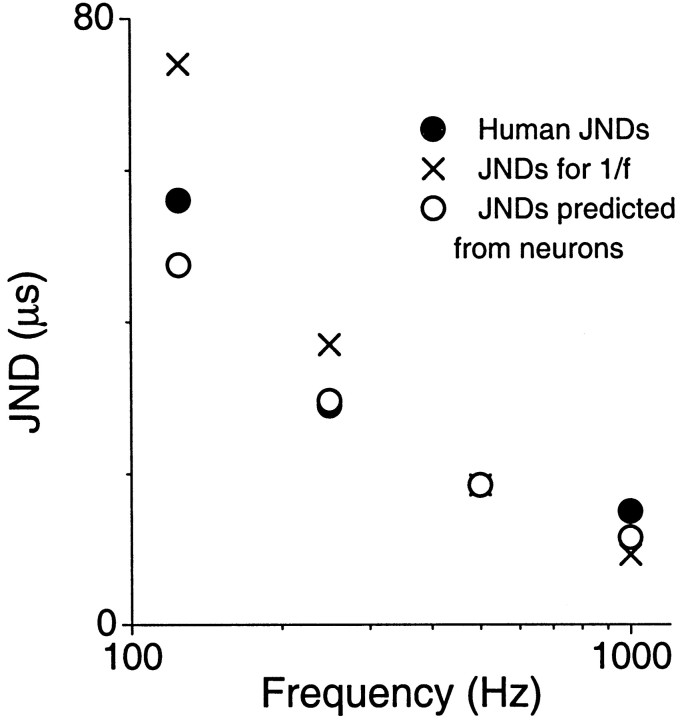
An expected behavioral consequence of peak-like neurons that tend toward constant ITD tuning widths is to reduce the effect of frequency on sound localization acuity. Figure 8shows that the just-noticeable differences (JNDs) from humans to ITDs in tones (closed circles) decrease with frequency. However, the change across frequency is much less than that predicted by a 1/f relationship (X symbols; note that the 1/f function is “anchored” to the JND function at 500 Hz to correspond with our finding that the tuning broadened at high frequencies and narrowed at low frequencies). The JND function closely resembles the function predicted from peak-like neurons recorded from the DNLL to cortex (open circles; also anchored to the JND function at 500 Hz). In fact, the slope of the log values of the human JND function is −0.64, which corresponds quite closely to the average slope of neurons (−0.68). We further compared the functions by calculating the between and within mean square errors and estimating the variance accounted for. We found that 72% of the variance was accounted for between the 1/f function and the behavioral function, 83% was accounted for between the 1/f function and the neural function, and 92% was accounted for between the behavioral and neural function. This again indicates that the neural and behavioral functions are more similar to each other than either is to the predicted 1/f function. Thus, neurons with nearly constant ITD tuning across frequency may be the substrate in reducing the effect of frequency on sound localization acuity.
Fig. 8.
Comparison of behavioral JNDs from humans to ITDs in tones of different frequencies (closed circles) with that predicted by a 1/frelationship (X symbols) and estimates based on our neural responses (open circles). Neural estimates were derived by assuming a slope of log JND versus log frequency of −0.68, to correspond to the average of peak-like neurons at levels above the SOC. The predicted JNDs were anchored to the measured JND at 500 Hz. The neural estimates correspond more closely to the behavioral function than to those predicted by a 1/f relationship.
Footnotes
This study was supported by National Institutes of Health Grants DC01366 and DC03948. We thank Lisa M. Fitzpatrick for technical assistance and Ranjan Batra, Talong Ju, and Robert Manfredi for computer programming.
Correspondence should be addressed to Dr. Douglas C. Fitzpatrick at the above address. E-mail: dcf@med.unc.edu.
REFERENCES
- 1.Anderson DJ. Quantitative model for the effects of stimulus frequency upon synchronization of auditory nerve discharges. J Acoust Soc Am. 1973;54:361–364. doi: 10.1121/1.1913585. [DOI] [PubMed] [Google Scholar]
- 2.Batra R, Kuwada S, Stanford TR. Temporal coding of envelopes and their interaural delays in the inferior colliculus of the unanesthetized rabbit. J Neurophysiol. 1989;61:257–268. doi: 10.1152/jn.1989.61.2.257. [DOI] [PubMed] [Google Scholar]
- 3.Blackburn CC, Sachs MB. Classification of unit types in the anteroventral cochlear nucleus: PST histograms and regularity analysis. J Neurophysiol. 1989;62:1303–1329. doi: 10.1152/jn.1989.62.6.1303. [DOI] [PubMed] [Google Scholar]
- 4.Bourk TR. Electrical responses of neural units in the anteroventral cochlear nucleus of the cat. Massachusetts Institute of Technology; Cambridge, MA: 1976. [Google Scholar]
- 5.Colburn HS. Theory of binaural interaction based on auditory-nerve data. I. General strategy and preliminary results on interaural discrimination. J Acoust Soc Am. 1973;54:1458–1470. doi: 10.1121/1.1914445. [DOI] [PubMed] [Google Scholar]
- 6.Fitzpatrick DC, Kuwada S, Batra R. Neural sensitivity to interaural time differences: beyond the Jeffress model. J Neurosci. 2000;20:1605–1615. doi: 10.1523/JNEUROSCI.20-04-01605.2000. [DOI] [PMC free article] [PubMed] [Google Scholar]
- 7.Goldberg JM, Brownell WE. Discharge characteristics of neurons in anteroventral and dorsal cochlear nuclei of cat. Brain Res. 1969;64:35–54. doi: 10.1016/0006-8993(73)90169-8. [DOI] [PubMed] [Google Scholar]
- 8.Johnson DH. The relationship between spike rate and synchrony in responses of auditory-nerve fibers to single tones. J Acoust Soc Am. 1980;68:1115–1122. doi: 10.1121/1.384982. [DOI] [PubMed] [Google Scholar]
- 9.Joris PX, Carney LH, Smith PH, Yin TCT. Enhancement of neural synchronization in the anteroventral cochlear nucleus. I. Responses to tones at the characteristic frequency. J Neurophysiol. 1994a;71:1022–1036. doi: 10.1152/jn.1994.71.3.1022. [DOI] [PubMed] [Google Scholar]
- 10.Joris PX, Smith PH, Yin TCT. Enhancement of neural synchronization in the anteroventral cochlear nucleus. II. Responses in the tuning curve tail. J Neurophysiol. 1994b;71:1037–1051. doi: 10.1152/jn.1994.71.3.1037. [DOI] [PubMed] [Google Scholar]
- 11.Klumpp RG, Eady HR. Some measurements of interaural time difference thresholds. J Acoust Soc Am. 1956;28:859–860. [Google Scholar]
- 12.Kuwada S, Yin TCT, Wickesberg RE. Response of cat inferior colliculus neurons to binaural beat stimuli: possible mechanisms for sound localization. Science. 1979;206:586–588. doi: 10.1126/science.493964. [DOI] [PubMed] [Google Scholar]
- 13.Kuwada S, Stanford TR, Batra R. Interaural phase sensitive units in the inferior colliculus of the unanesthetized rabbit. Effects of changing frequency. J Neurophysiol. 1987;57:1338–1360. doi: 10.1152/jn.1987.57.5.1338. [DOI] [PubMed] [Google Scholar]
- 14.Lavine RA. Phase-locking in response of single neurons in cochlear nucleus complex of cat to low-frequency tonal stimuli. J Neurophysiol. 1971;34:467–483. doi: 10.1152/jn.1971.34.3.467. [DOI] [PubMed] [Google Scholar]
- 15.McAlpine D, Jiang D, Palmer AR. Interaural delay sensitivity and the classification of low best-frequency binaural responses in the inferior colliculus of the guinea pig. Hear Res. 1996;97:136–152. [PubMed] [Google Scholar]
- 16.Palmer AR, Russell IJ. Phase-locking in the cochlear nerve of the guinea-pig and its relation to the receptor potential of inner hair-cells. Hear Res. 1986;24:1–15. doi: 10.1016/0378-5955(86)90002-x. [DOI] [PubMed] [Google Scholar]
- 17.Rhode WS. A digital system for auditory neurophysiological research. In: Brown P, editor. Current computer technology in neurobiology. Hemisphere; Washington, DC: 1976. pp. 543–567. [Google Scholar]
- 18.Rhode WS, Smith PH. Encoding timing and intensity in the ventral cochlear nucleus of the cat. J Neurophysiol. 1986;56:261–286. doi: 10.1152/jn.1986.56.2.261. [DOI] [PubMed] [Google Scholar]
- 19.Rose JE, Kitzes LM, Gibson MM, Hind JE. Observations on phase-sensitive neurons of anteroventral cochlear nucleus of the cat: nonlinearity of cochlear output. J Neurophysiol. 1974;37:218–253. doi: 10.1152/jn.1974.37.1.218. [DOI] [PubMed] [Google Scholar]
- 20.Shackelton TM, Meddis R, Hewitt MJ. Across frequency integration in a model of lateralization. J Acoust Soc Am. 1992;91:2276–2279. [Google Scholar]
- 21.Shackleton TM, McAlpine D, Palmer AR. Modelling convergent input onto interaural-delay-sensitive inferior colliculus neurones. Hear Res. 2000;149:199–215. doi: 10.1016/s0378-5955(00)00187-8. [DOI] [PubMed] [Google Scholar]
- 22.Smith PH, Rhode WS. Characterization of HRP-labeled globular bushy cells in the cat cochlear nucleus. J Comp Neurol. 1987;266:360–376. doi: 10.1002/cne.902660305. [DOI] [PubMed] [Google Scholar]
- 23.Stern RM, Colburn HS. Theory of binaural interaction based on auditory-nerve data. IV. A model for subjective lateral position. J Acoust Soc Am. 1978;64:127–140. doi: 10.1121/1.381978. [DOI] [PubMed] [Google Scholar]
- 24.Stern RM, Trahiotis C. The role of consistency of interaural timing over frequency in binaural lateralization. In: Cazals Y, Demany L, Horner K, editors. Auditory physiology and perception. Pergamon; New York: 1992. pp. 547–554. [Google Scholar]
- 25.Trahiotis C, Stern RM. Across-frequency interaction in lateralization of complex binaural stimuli. J Acoust Soc Am. 1994;96:3804–3806. doi: 10.1121/1.410570. [DOI] [PubMed] [Google Scholar]
- 26.Yin TCT, Chan JCK. Interaural time sensitivity in medial superior olive of cat. J Neurophysiol. 1990;64:465–488. doi: 10.1152/jn.1990.64.2.465. [DOI] [PubMed] [Google Scholar]
- 27.Yin TCT, Kuwada S. Binaural interaction in low-frequency neurons in inferior colliculus of the cat. III. Effects of changing frequency. J Neurophysiol. 1983;50:1020–1042. doi: 10.1152/jn.1983.50.4.1020. [DOI] [PubMed] [Google Scholar]
- 28.Zwislocki J, Feldman RS. Just noticeable differences in dichotic phase. J Acoust Soc Am. 1956;28:860–864. [Google Scholar]


