

Abstract
The underlying cause of neocortical involvement in temporal lobe epilepsy (TLE) remains a fundamental and unanswered question. Magnetic resonance imaging has shown a significant loss in temporal lobe volume, and it has been proposed that neocortical circuits are disturbed functionally because neurons are lost. The present study used design-based stereology to estimate the volume and cell number of Brodmann's area 38, a region commonly resected in anterior temporal lobectomy. Studies were conducted on the neocortex of patients with or without hippocampal sclerosis (HS). Results provide the surprising finding that TLE patients have significant atrophy of neocortical gray matter but no loss of neurons. Neurons are also significantly larger, dendritic trees appear sparser, and spine density is noticeably reduced in TLE specimens compared with controls. The increase in neuronal density we found in TLE patients is therefore attributable to large neurons occupying a much smaller volume than in normal brain. Neurons in the underlying white matter are also increased in size but, in contrast to other reports, are not significantly elevated in number or density. Neuronal hypertrophy affects HS and non-HS brains similarly. The reduction in neuropil and its associated elements therefore appears to be a primary feature of TLE, which is not secondary to cell loss. In both gray and white matter, neuronal hypertrophy means more perikaryal surface area is exposed for synaptic contacts and emerges as a hallmark of this disease.
Keywords: temporal lobe epilepsy, stereology, Brodmann's area 38, ectopia, cortical atrophy, neuronal hypertrophy, hippocampal sclerosis
Hippocampal sclerosis (HS) is the most frequently encountered pathologic abnormality in intractable epilepsy. There is however increasing evidence of more widespread temporal lobe pathology in HS patients (Nakasato et al., 1992;Sisodiya et al., 1995) and prevalent temporal lobe hypometabolism in patients with temporal lobe epilepsy (TLE) (Rausch et al., 1994). Moreover, magnetic resonance imaging (MRI) studies show a reduction in temporal lobe volume both ipsilateral and contralateral to the seizure focus (Lee et al., 1995, 1998; Marsh et al., 1997). Volume reduction is also independent of the presence of HS (Sisodiya et al., 1997), which indicates that it underlies a broader spectrum than mesial temporal disease alone.
Pathologic studies of TLE neocortex are dominated by those focused on readily detectable lesions and gross developmental abnormalities (Choi and Matthias, 1987; Haines et al., 1991; Raymond et al., 1995). There are far fewer investigations of subtle morphological abnormalities in the neocortex than in the hippocampus (Mathern et al., 1995), even though such studies might be expected to answer basic questions about epileptogenic activity originating outside the hippocampus and gross volume reductions in the temporal lobe.
A common view of cortical pathology in TLE is that of neuronal loss. This notion is based on reports of reduced numbers of inhibitory neurons (DeFelipe et al., 1993; Ferrer et al., 1994; Marco et al., 1996). These cells are generally small to medium in size and numerous, and, if lost, could be responsible for the volume reductions seen with MRI. However, those data conflict with other findings that failed to show a difference in overall neuronal density between TLE and control neocortex (Babb et al., 1984). Most of those investigations based their conclusions either on qualitative evaluations (DeFelipe et al., 1993;Ferrer et al., 1994, Marco et al., 1996; Spreafico et al., 1998) or semiquantitative measurements (Babb et al., 1984; Sisodiya et al., 1995; Emery et al., 1997; Marco and DeFelipe, 1997; Mitchell et al., 1999) that estimated cells in the two-dimensional plane. In studies of cortical abnormalities in other diseases, a methodological advance, i.e., design-based stereology, allows cells to be counted using three-dimensional probes and has proved highly successful in establishing whether neurons are lost (Everall et al., 1993;Pakkenberg, 1993; West et al., 1994; Selemon et al., 1998; Selemon and Goldman-Rakic, 1999).
For the present study, we expand on our previous work (Hardiman et al., 1988; Doherty et al., 1998, 2000) by using stereology to determine whether indeed there is a loss of neurons in TLE cortex. We further sought differences between HS and non-HS cases and whether subcortical neuronal ectopia (Hardiman et al., 1988; Raymond et al., 1995; Emery et al., 1997) plays a role in epilepsy-based dysplastic alterations. We elected to study neurons in Brodmann area 38, because this region is consistently removed in anterior temporal lobe resections as a treatment for intractable epilepsy but seldom exhibits sclerosis or other gross pathological changes.
Portions of this study have been published in abstract form (Bothwell et al., 1999).
MATERIALS AND METHODS
Patient selection. Eight patients (mean age, 31.0 ± 4.1 years; range, 10–48 years) undergoing surgery for medically intractable TLE were included in this study. Presurgical assessment consisted of detailed history and neurological examination, EEG monitoring, and neuropsychological testing. Neuroradiological studies included high-resolution MRI with special protocols to visualize the hippocampal formation, following the anatomical boundaries of Watson et al. (1992). For comparison, the temporal lobes from eight subjects (mean age, 39.1 ± 4.8 years; range, 17–51 years) with no history of neurological or psychiatric disorder were collected at autopsy within 24 hr of death (mean postmortem interval, 17.5 hr). Conventional, neuropathological examination did not reveal any sign of cerebral ischemia in any of the autopsy specimens. Informed consent was obtained from patients and families of controls according to the declaration of Helsinki. The Ethics Committee at Beaumont Hospital (Dublin, Ireland) approved the selection process and procedures.
Tissue preparation. Neocortical specimens obtained at surgery or autopsy were immediately immersion-fixed for 4 d at 4°C in a mixture of 4% paraformaldehyde in 0.1m phosphate buffer at pH 7.4. In surgical TLE cases, the neocortex available for study came from the temporal pole region and measured 38.0 ± 3.7 mm (mean anterior to posterior length), 32.5 ± 2.8 mm (mean inferior to superior height), and 15.0 ± 1.0 mm (mean depth). Pieces had a volumetric displacement ranging from 10 to 30 ml (mean volume, 16.0 ± 2.4 ml).
Figure 1 shows a typical slice through the temporal neocortex close to area 38. The anterior temporal pole was removed from tissue taken at autopsy in a manner that mimicked the surgical resections. Surgical and autopsy specimens were taken either from the left or right hemisphere (Table1). After fixation, the hippocampal formation and the entorhinal cortex were removed from the autopsy specimens by cutting between the entorhinal cortex medially and the fusiform gyrus laterally. This medial cut was produced through an angle of ∼120°. Both surgical and autopsy specimens were then cut according to stereological, multistage fractionator rules (Howard and Reed, 1998). Briefly, they were cut sequentially into 3-mm-thick coronal slices, labeled alphabetically from anterior to posterior (A, B, C, etc.), and after a random start, a systematic, random sample (1/3) was taken from the series to be used in the analysis (Fig.2A). The selected slices were further cut into blocks in an isotropic uniform random plane (Howard and Reed, 1998). The blocks were numbered and once again, a systematic, random sample of these (1/2 or 1/3) was taken. The selected blocks were cut serially at 50 or 70 μm on a Vibratome(TPI, St. Louis, MO), and, from these, a systematic, random series of sections was chosen (1/75). The sections were mounted on gelatin-coated slides, stained with cresyl violet, dehydrated, cleared, and coverslipped.
Fig. 1.

Photograph of a 3-mm-thick coronal slice retrieved at autopsy. The slice passes through the temporal lobe close to area 38 at the border with areas 21 and 28. COS, Collateral sulcus; EC, entorhinal cortex; FusG, fusiform gyrus; HF, hippocampal formation;ITG, inferior temporal gyrus; MTG, middle temporal gyrus; STG, superior temporal gyrus;SF, Sylvian fissure.
Table 1.
Age, sex, hemisphere of analyzed lobe, neuropathological details, and cause of death for individuals in this study
| Case | Age | Sex | Hemisphere | Pathology | Cause of death |
|---|---|---|---|---|---|
| N68 | 35 | M | R | Severe CG, severe HS, mild CD with subcortical ectopia | Living |
| N31 | 48 | F | R | Severe HS, superficial CG, moderate to severe subcortical ectopia | Living |
| N185 | 38 | M | R | Subpial [Chaslin's] gliosis, subcortical gliosis | Living |
| N939 | 28 | M | L | Moderate HS, Subpial [Chaslin's] gliosis, subcortical gliosis | Living |
| N155 | 27 | F | R | Subpial [Chaslin's] gliosis, perivascular gliosis in white matter, moderate astrocytic hyperplasia in hippocampus | Living |
| N24 | 10 | M | R | Moderate subpial [Chaslin's] gliosis, severe subcortical ectopia | Living |
| N914 | 32 | M | R | Severe CD, including neuronal cytomegaly, balloon cells and widespread subcortical ectopia | Living |
| N263 | 30 | F | L | Moderately severe HS, capillary telangiectasis in neocortex | Living |
| A167 | 50 | M | R | — | Pneumonia |
| A103 | 33 | M | R | — | Acute asthma |
| A102 | 17 | F | L | — | Renal hemorrhage |
| A98 | 43 | M | R | — | Asphyxiation |
| A95 | 51 | M | L | — | Cardiac arrest |
| A74 | 43 | F | L | — | Pulmonary embolism |
| A17 | 30 | M | L | — | Asphyxiation |
| A233 | 46 | M | L | — | Coronary disease |
CD, Cortical dysplasia; CG, cortical gliosis; HS, hippocampal sclerosis.
Fig. 2.
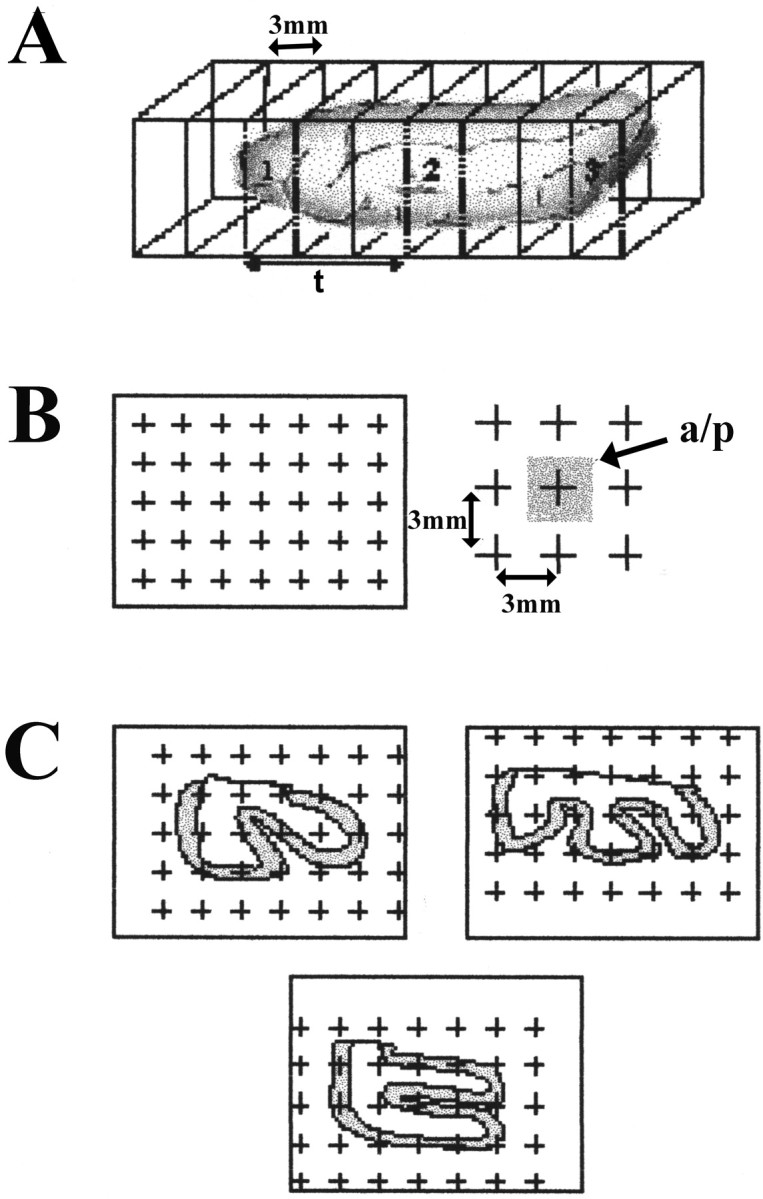
A schematic diagram illustrating the steps required to establish a reference volume. A, Slices, 3-mm-thick, are selected in a uniformly random manner (1/3).B, A grid with points, 3 mm apart and each associated with a known area (a/p) is laid over the face of each slice. C, Points are counted, and the area is calculated. The area associated with the gray or white matter is then multiplied by the thickness of the slice to estimate the reference volume.
Determination of anatomical boundaries and reference volume for stereology. Establishing a set of consistent anatomical criteria is essential for both the resected and control tissues used in the stereological analysis. Area 38, depicted on the cytoarchitectural map of the human cortex by Brodmann (Garey, 1994; Doherty et al., 1998), occupies the anterior pole of the temporal lobe. This area is present on lateral and medial as well as superior and inferior surfaces at the pole. The posterior limit of area 38 was distinguished from adjacent areas 21 and 28, on the basis of cytoarchitectonic criteria in normal human brain (Garey, 1994). Area 38 extended from slice A through slice H in both TLE and control lobes, and therefore, slices beyond H were not used in the analysis. The reference volume of both the gray and white matter of area 38 was estimated according to Cavalieri principles (Coggeshall, 1992). The reference volume was determined for each selected slice (Fig. 2A) by counting the number of points in a grid (Fig. 2B), that overlay the gray and/or white matter. The area associated with each point was known (Fig. 2C) and could then be multiplied by the thickness of each slice (3 mm) to estimate the volume of the reference space (Coggeshall, 1992; West, 1993).
Neuron counts. The optical fractionator was used to count neurons within the gray and white matter of area 38. After randomly selecting a starting point, 8–10 sections at equally spaced intervals along the extent of Brodmann area 38 were selected. Total neuronal number (N) was estimated from counts using the optical disector procedure (Sterio, 1984; West and Gundersen, 1990). Neurons were counted with the assistance of a semiautomatic system (StereoInvestigator, version 3.0; MicroBrightField, Brattleboro, VT). Video images were acquired on a Nikon (Tokyo, Japan) Labophot-2 microscope equipped with a CCD camera output to a high-resolution computer monitor. Movement of the stage to provide the systematic area offset was controlled through StereoInvestigator software driving a Ludl X-Y-Z motorized stage (Ludl Electronics Products, Hawthorn, NY). Boundaries to delimit the gray and white matter fields were drawn using a Plan 2× objective and subsequently sampled using a Plan 100× (1.3 NA) oil objective. A counting frame, 24 × 24 μm for the gray matter, and 50 × 50 μm for the white matter, with extended exclusion lines (Fig. 3A,B) and a disector height of 10 μm was used. A neuron was counted only if the nucleus lay within the disector area and did not intersect forbidden lines (Fig. 3B). Each cell was counted if the nucleus came into the focus as the optical plane moved through the height of the disector along the z-axis. Detailed descriptions of these techniques have been published elsewhere (Gundersen, 1986; Gundersen et al., 1988; West and Gundersen, 1990; Howard and Reed, 1998).
Fig. 3.
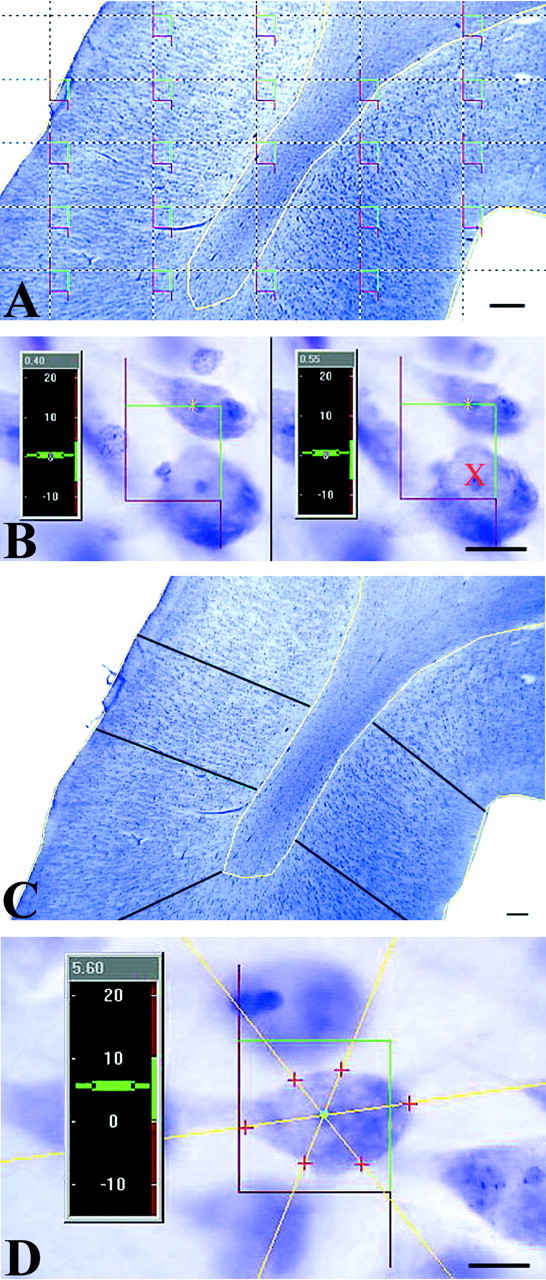
Illustrations of the methodology used to obtain estimates of total neuronal number, cortical depth, and somal volume. A, After outlining the region of interest inyellow, a grid with equidistant counting frames (red and green) is laid on the selected area. B, Using high magnification (100×, oil, 1.2 numerical aperture), a neuron is counted with the disector probe if the boundaries of its nucleus touch, lie within, or cross the green lines of a single counting frame. Cells are not counted (red X) if the nuclear envelope touches or crosses the red or forbidden lines. C, The depth of the gray matter is measured by estimating the mean cortical depth using a uniformly random placement of vertical lines, each of which is placed perpendicular to the pial surface. D,The somal volume of each cell is estimated using the nucleator. To do this, isotropic lines are generated from a central point in the nucleolus and extend through the somal boundary. The distance from the central point to the cell surface is measured, and because the depth of the tissue is known, the somal volume can be estimated. Scale bars: A, C, 100 μm; B,D, 10 μm.
The estimation of N was calculated using the fractionator formula (Howard and Reed, 1998). Briefly, N is the product of the neurons counted with the disectors, and the reciprocals of the fraction of the specimen sampled (ssf), the sectional area sampled (asf), and the section thickness sampled (tsf). The precision of the estimate for each case is expressed as the coefficient of error (CE), and for the group, by the mean coefficient of error (CEgroup). The density (Nv) was calculated as the sum of neurons counted with the optical disectors (ΣQ−), divided by the product of the sum of the disectors and the volume of the disector (Howard and Reed, 1998). Axial tissue shrinkage was corrected for density measurements by multiplying the height of the disector by the ratio of the sectioned thickness to the actual mean tissue thickness after the section was mounted on a slide and dehydrated (Peterson et al., 1999).
Estimates of tissue shrinkage. Three sets of measurements were taken to quantify shrinkage caused by fixation and histological procedures. First, the volumes of the surgically resected and autopsied lobes were measured by water displacement before and after being immersed in fixative. Second, shrinkage in the x- andy-axes was estimated using five sections from each specimen. The cross-sectional area (csa) of each section was measured using the Cavalieri method (Fig. 2) immediately after the sections were mounted but before they were completely dry. The measurement was repeated five times for each section. The overall mean csawas calculated. After the sections were stained and coverslipped, the same measurements were taken again, and a second, mean csawas calculated. These two estimates were then compared statistically. Finally, to estimate shrinkage along the z-axis (i.e., section compression), thickness was measured at four random points in each of five sections after staining. A mean actual section thickness was calculated and compared with the original sectioned thickness. The mean actual thickness was used to calculate density (Peterson et al., 1999). The probes used to measure total neuronal number, somal volume, and cortical ribbon width are independent of any change in section thickness caused by processing.
Estimation of cortical thickness. The thickness of the cortical ribbon was measured for each specimen. The width of gray matter was estimated in a uniformly, random manner by drawing 100 lines perpendicular to the pial surface and passing deep to the gray–white interface following the columnar arrangement of the neurons (Fig.3C). The first line was placed randomly at the start of the first section, and every line after that was drawn a uniform distance apart (1.5 mm). This intensive sampling was necessary to obtain both an unbiased and adequate representation of the cortical ribbon thickness and because of thickness differences between the gyri and sulci.
Estimating neuronal volume. The somal volume of each neuron sampled using the optical disector was calculated using the nucleator probe (Gundersen et al., 1988; Möller et al., 1990). Several isotropic lines, from randomly selected directions, were generated from a central point within the first nucleolus that came into focus within the height of the disector (Fig. 3D). The distance in each direction from the central point to the somal boundary was recorded (Fig. 3D). Although some cells clearly had more than one nucleolus, only one measurement was taken using the nucleolus that first came sharply into focus. The mean somal volume was estimated by:
where the ln refers to the summed distances from the sampling point within the nucleolus to the edge of the soma.
Neurons were divided into three groups based on their volume: small (<500 μm3 or <10 μm in diameter), medium (500–1325 μm3 or 10–15 μm in diameter), and large (>1325 μm3 or >15 μm diameter). The small-to-medium-sized cells generally belong to the inhibitory groups of neurons (Schiffmann et al., 1988) and tend to reside in layers II-IV; the large cells are the pyramidal neurons, which are excitatory and found in layers III-V (Somogyi et al., 1979).
Intracellular injection of neurons. Transverse slices measuring 150-μm-thick were cut (Fig. 1) from TLE and autopsy control material. Each slice was viewed with a Nikon Optiphot FN microscope equipped with extra long working distance objectives and epifluorescence. A silver wire connected to a constant current source (Digitimer Ltd, Welwyn Garden City, UK) was placed in a 4% aqueous solution of biotinylated Lucifer yellow (LY) (Molecular Probes, Eugene, OR) in a glass pipette. The pipette could be accurately guided into each slice using a motorized micromanipulator. Neurons in the cortical layers show some autofluorescence caused by lipofucsin granules (Einstein et al., 1993), and could therefore be impaled by a visually guided pipette. A positive holding current of 1–5 nA was reversed once the pipette had entered a cell and LY was released with a negative current of 1–3 nA over a period of 5–20 min. Electrode resistance was maintained between 80 and 250 MΩ (Meredith and Arbuthnott, 1993). After four to eight neurons were intracellularly filled with LY, the slice was incubated in an avidin–biotin complex for 90 min at room temperature and reacted in a 0.05% 3,3′-diaminobenzidine (DAB) with 1% ammonium nickel sulfate added. Slices were then mounted onto glass slides from a 0.2% gelatin solution, dehydrated, and coverslipped.
Statistical analysis. Values are expressed as mean ± SEM. The density and total number of neurons was compared between TLE cortex and controls for area 38, and separate comparisons were made for HS and non-HS specimens. Data were tested for normality using a one-sample Kolmogorov–Smirnov test. Results that met the criterion of a normal distribution were compared using a Student's ttest, and results with p values <0.05 were considered significant. Nonparametric comparisons used a Mann–WhitneyU test. In terms of neuron size, we tested the ratio of the number of neurons in each size group compared with the total with an unpaired t test.
RESULTS
Clinical and neuropathological assessment
Patients with drug-resistant TLE were deemed suitable candidates for surgery by virtue of their intractability (Ojemann, 1987) and the concordance of conventional presurgical evaluation procedures, including clinical, neurophysiological, neuropsychological, and qualitative imaging modalities. Conventional, neuropathological assessment showed that among the TLE cases, four of eight (50%) had HS, and the remainder did not (Table 1). Routine GFAP immunocytochemistry revealed glial proliferation in layers III-IV of tissue, especially in HS patients. The cortical tissue of all autopsy cases was normal in its cytoarchitectural appearance and glial dispersement.
Cortical volume
Tissue shrinkage was evaluated using several methods. Water displacement showed no change in lobe volume before or after 4 d of fixation for any specimen. In addition, Cavalieri estimates of thecsa revealed that shrinkage in x- andy-axes was <1% for all specimens. Standard histological processing, however, produced shrinkage in the z-axis of ∼70%. Although great, this amount of compression did not differ between specimens, and cell density measurements were corrected forz-axis depth in each case, according to the formula ofPeterson et al. (1999). Neither fixation parameters nor histological processing affected the volume of individual specimens.
Brodmann's area 38 can be recognized in Nissl sections as an agranular cortex. In comparison to adjacent areas 21 and 28 (Fig.4A,B), the most salient features of area 38 (Fig. 4C) include low numbers of granule cells in layers II and IV, numerous pyramidal cells in layers III-V, and an exceptionally wide layer 1. Routine diagnostic microscopic examination showed that in all but two TLE cases, the cortical layering was normal, but the gray matter appeared notably thinner when compared with tissue taken at autopsy (Fig. 4, compareC, D). The layers affected by thinning were III-VI. Furthermore, neurons in all layers of TLE cortex were visibly more tightly packed, larger, and rounder than those in controls (Fig.5, compare A,B withC,D).
Fig. 4.
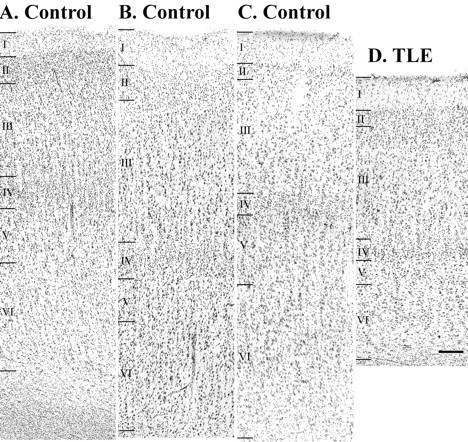
Photomicrographs of layers I-VI of temporal neocortex in controls (A–C). Pictured are Brodmann's area 28 (A), 21 (B), and 38 (C). Note the lack of granule cells in layers II, IV in area 38 (C). D, The same layers of area 38 in TLE neocortex; note the decrease in cortical width, particularly in layers III-VI, when compared with C. Scale bar, 100 μm.
Fig. 5.
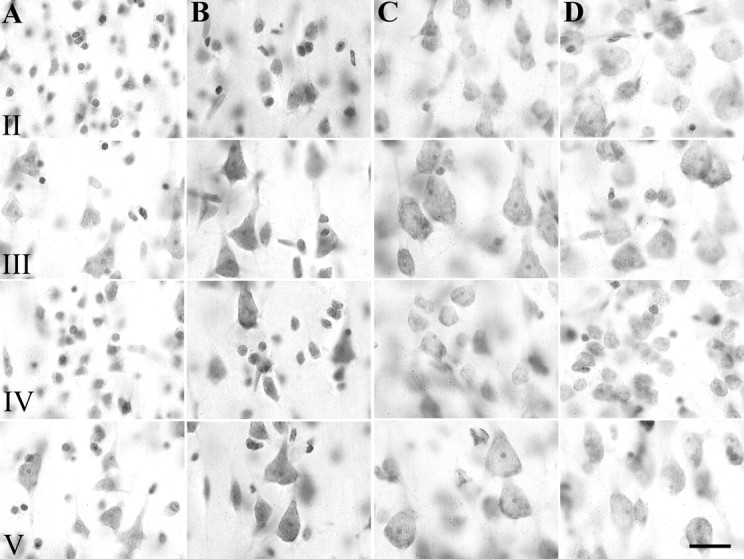
High-power photomicrographs of Nissl-stained sections from two autopsy cases (A, B) and two TLE cases (C, D). Note the differences in neuronal size and packing density in layers II, III, IV, and V between TLE neocortex (C, D) and control tissue (A, B). Scale bar, 20 μm.
Reference volumes, estimated for the full rostrocaudal extent of Brodmann's area 38 (Fig. 2), showed that TLE specimens were significantly smaller than those of controls (t test;F(3.73,14) = 0.022; p< 0.01). In addition, the volume of gray matter was reduced significantly (t test; F(4.28,14) = 1.238; p < 0.01) but that of the white matter was unchanged for TLE tissue when compared with controls. Because the accuracy of volume estimates could be confounded by hemispheric (right or left) or gender differences and by small differences in the extent of the surgical resection, we also measured the width of the cortical ribbon (Fig. 3C, gray matter depth) in two dimensions, according to stereological principles (Howard and Reed, 1998). Analysis confirmed a significant reduction (13.4%) in gray matter depth for the TLE group when compared with controls (Table2). Cortical width was reduced equally for HS and non-HS specimens, and the width of each was significantly thinner than that of controls (p < 0.0001; Mann–Whitney U test).
Table 2.
Detailed results for gray matter parameters including width of cortical ribbon, neuron number, density, and somal volume
| Autopsy controls | TLE patients | Cortical width (mm) | Neurons counted Q− | Disectors, P | CE | Total number N(×107) | Neuron density Nv(×104/mm3) | Somal volume (μm3) |
|---|---|---|---|---|---|---|---|---|
| A167 | 3.51 | 217 | 639 | 0.07 | 11.6 | 1.4 | 1989.3 | |
| A103 | 3.37 | 186 | 540 | 0.08 | 11.1 | 1.2 | 1459.2 | |
| A102 | 3.71 | 201 | 605 | 0.08 | 8.0 | 1.4 | 1295.9 | |
| A98 | 3.15 | 219 | 530 | 0.11 | 6.3 | 1.2 | 2374.2 | |
| A95 | 3.04 | 178 | 592 | 0.11 | 7.0 | 1.0 | 1527.7 | |
| A74 | 3.57 | 140 | 424 | 0.11 | 10.1 | 1.2 | 1304.4 | |
| A17 | 2.98 | 172 | 565 | 0.9 | 13.5 | 1.7 | 2097.6 | |
| A233 | 2.93 | 237 | 840 | 0.9 | 15.3 | 1.2 | 1522.7 | |
| Mean ± SE | 3.28 ± 0.03 | 172 | 526 | 0.8 | 10.3 ± 1.1 | 1.3 ± 0.8 | 1715.5 ± 30.9 | |
| N263 | 3.08 | 233 | 747 | 0.09 | 8.8 | 1.6 | 2549.0 | |
| N68 | 2.29 | 195 | 619 | 0.08 | 4.5 | 1.3 | 2365.1 | |
| N31 | 3.03 | 171 | 530 | 0.09 | 5.4 | 1.4 | 2272.4 | |
| N185 | 3.01 | 213 | 637 | 0.09 | 11.3 | 1.7 | 2556.2 | |
| N939 | 2.91 | 193 | 536 | 0.08 | 6.2 | 1.7 | 2329.9 | |
| N155 | 2.74 | 209 | 482 | 0.08 | 14.7 | 2.0 | 1788.8 | |
| N24 | 2.62 | 278 | 827 | 0.08 | 5.9 | 1.6 | 1825.1 | |
| N914 | 3.03 | 131 | 397 | 0.10 | 6.7 | 1.4 | 1871.0 | |
| Mean ± SE | 2.84 ± 0.032-165 | 203 | 597 | 0.08 | 7.9 ± 1.2 | 1.6 ± 0.08* | 2196.1 ± 37.82-160 |
p < 0.05 (Student's ttest; F(−2.56,14) = 0.147); significantly greater than controls.
F2-160: p < 0.001 (Mann, Whitney Utest); significantly greater than controls.
F2-165: p < 0.001 (Mann, Whitney Utest); significantly less than controls.
Qualitative observations of neocortical neurons
Examples of intracellularly labeled pyramidal cells in layer III from autopsy control and TLE neocortical specimens are seen in Figure 6, A andB. Successful fills were usually achieved in neurons near the surface of each slice and neurons in layers II, III, and/or V were filled in six different cases (controls, n = 3; TLE,n = 3). Neurons located superficially always had a few processes that would have extended above the slice surface had they not been truncated by the Vibratome knife. Nevertheless, most neurons appeared complete (Fig. 6). Each injected cell body in the control material had the typical, pyramidal shape, with primary dendrites that tapered rapidly away from the cell body (Fig. 6A). Perikarya in the TLE tissue appeared much larger and proximal dendrites, thicker and less tapered, than those in controls (Fig. 6, compare A, B). Spines were plentiful on all branches of dendrites in controls (Fig. 6A), whereas they were noticeably sparse on TLE neurons (Fig. 6B). Dendrites in control material branched often (Fig.6A), whereas those in the TLE cortex had few branches and had shafts with a beaded appearance (Fig.6B).
Fig. 6.
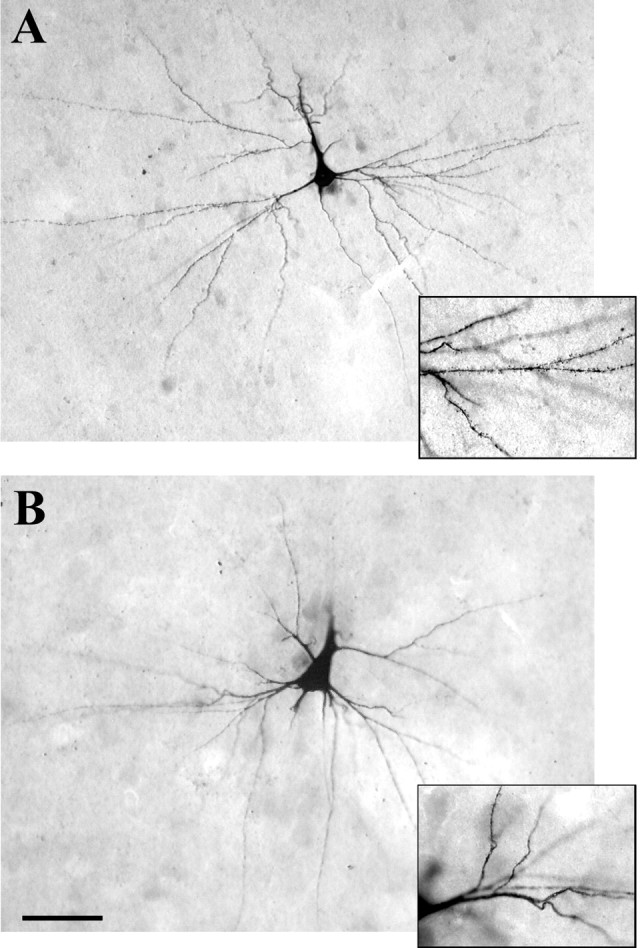
Layer III pyramidal neurons filled intracellularly with LY and reacted with DAB. A, A filled neuron in an autopsy control specimen has the typical pyramidal shape and numerous dendritic branches. The inset to theright shows the densely spiny covering that is typical of these dendrites. B, An intracellularly filled pyramidal cell in layer III of TLE neocortex. The large primary, dorsal dendrite appears to have been severed during the preparation of the slice. Note the large, rounded cell soma. The thick primary dendrites and low number of processes are typical of cells in TLE cortex. Theinset to the right shows swellings along the course of the dendrites and the sparse covering of spines. Scale bar, 25 μm.
Total neuron number and neuronal density
It was estimated that ∼100 million neurons are present in Brodmann's area 38 of the anterior temporal lobe (Table 2). Although the total number of neurons was reduced by 20% in TLE material (Fig.7A), it was not significantly lower than in controls (t test; p = 0.171). There was, however, a significant increase (22%) in neuronal density for the TLE group when compared with controls (Table 2, Fig.7B). Neither HS nor non-HS specimens had significantly fewer neurons in area 38 when compared with controls, but there was a trend toward a loss of neurons in the HS group (39.6%; t test,p = 0.056). Neuronal density for the non-HS group was increased significantly (28.8%; t test; p< 0.02) over controls, but not that for HS tissue (15.3% greater than controls). There was no difference between the HS and non-HS groups in neuronal density.
Fig. 7.

A, Total number of neurons in area 38 (gray matter) of control (CON) and TLE specimens.B, Density of neurons in area 38 (gray matter) expressed per cubic millimeter. Density is significantly increased in TLE neocortex as compared with controls (*p = 0.023;t test, F(−2.563,14) = 0.147). C, Mean somal volume (expressed as cubic micrometers) of neurons as estimated with the nucleator. Neurons in TLE cortex are significantly larger than those in control material (***p < 0.0001, Mann–Whitney Utest). D, Proportion of small (diameter, <10 μm), medium (diameter, 10–15 μm), and large (diameter, >15 μm) neurons in the gray matter of area 38 in control (CON) and TLE neocortex. The proportion that are medium-sized is significantly decreased (*p = 0.03;t test; F(−2.41,14) = 0.734), whereas that of large neurons is significantly increased (*p = 0.001, t test;F(−6.347,14) = 1.847) in TLE cortex when compared with controls.
In the white matter of control specimens, ∼1.2 million ectopic neurons were estimated to be present in Brodman's area 38, whereas in TLE specimens, the number was close to 1.5 million cells (Table3). Nevertheless, there was no significant difference either in the total number or density of ectopic cells in TLE cases when compared with controls (Table 3, Fig.8A,B), but there was a trend toward an increase in number (t test;p = 0.051) and density (t test;p = 0.08) in the TLE group.
Table 3.
Detailed results for white matter parameters including neuron number, density, and somal volume
| Autopsy controls | TLE patients | Neurons counted Q− | Disectors P | CE | Total number N(×106) | Neuron density NV(mm3) | Somal volume VS(μm3) |
|---|---|---|---|---|---|---|---|
| A167 | 61 | 867 | 0.14 | 1.44 | 640 | 972.1 | |
| A103 | 79 | 863 | 0.12 | 2.52 | 730 | 1453.6 | |
| A102 | 111 | 876 | 0.12 | 1.22 | 1230 | 991.6 | |
| A98 | 97 | 954 | 0.16 | 0.45 | 700 | 1006.4 | |
| A95 | 56 | 1079 | 0.14 | 0.43 | 420 | 1031.9 | |
| A74 | 59 | 865 | 0.14 | 1.82 | 550 | 1098.1 | |
| A17 | 102 | 991 | 0.11 | 0.93 | 1350 | 1805.2 | |
| A233 | 33 | 923 | 0.18 | 0.73 | 350 | 734.8 | |
| Mean ± SE | 75 | 927 | 0.14 | 1.19 ± 0.26 | 750 ± 130 | 1191.9 ± 34.1 | |
| N263 | 84 | 775 | 0.15 | 1.78 | 1300 | 3067.7 | |
| N68 | 48 | 988 | 0.14 | 0.84 | 440 | 2290.9 | |
| N31 | 121 | 963 | 0.14 | 0.94 | 1220 | 3380.6 | |
| N185 | 67 | 876 | 0.14 | 1.90 | 870 | 3122.5 | |
| N939 | 166 | 925 | 0.1 | 1.04 | 1950 | 2659.4 | |
| N155 | 79 | 756 | 0.11 | 2.96 | 1090 | 1779.1 | |
| N24 | 146 | 997 | 0.11 | 1.49 | 1640 | 2111.6 | |
| N914 | 70 | 915 | 0.13 | 1.33 | 730 | 2165.0 | |
| Mean ± SE | 98 | 900 | 0.13 | 1.54 ± 0.25 | 1160 ± 170 | 2629.0 ± 71.53-165 |
F3-165: p < 0.001 (Mann–WhitneyU test); significantly greater than controls.
Fig. 8.

A, Total number of neurons in the white matter of area 38 of control (CON) and TLE specimens. B, Density of neurons in the white matter as expressed per cubic millimeter. C, Mean somal volume (expressed as cubic micrometers) of neurons in the underlying white matter of area 38 is significantly larger in TLE neocortex than those in control material (***p < 0.0001, Mann–WhitneyU test). B, The proportion of neurons that are small or medium-sized is significantly reduced, whereas that of large cells is significantly increased in TLE white matter when compared with controls (small cells: **p < 0.05,t test, F(2.116,14) = 0.3858; medium-sized cells, ***p < 0.001,t test, F(3.727,14) = 0.022; large cells, ***p < 0.001, ttest, F(−4.036,14) = 7.599).
Neuronal size
Gray matter neurons were 28% larger in TLE cortex when compared with those in control tissue, a difference that was highly significant (Table 2, Fig. 7C). Individual neuronal volume (mean, 2391 μm3) in tissue from HS patients did not differ significantly from that (mean, 2011 μm3) in the non-HS cases. The mean cellular volume of each group (HS or non-HS) was significantly larger (Mann–Whitney U test; p < 0.01) than that of controls (mean, 1715 μm3). Somal volumes were also analyzed by size category, established on the basis of cell volume: small (<500 μm3), medium (500–1325 μm3), and large (>1325 μm3). The small- and medium-sized neurons were encountered more frequently in controls, whereas the largest cells were more prevalent in TLE tissue (Fig.7D). Small cells comprised ∼8% of all neurons in the controls but only 5% of those in the TLE cortex. Medium-sized cells made up the largest set of neurons overall and formed 61% of cortical neurons in controls but only 50% in TLE cases (Fig. 7D). There emerged a strong, but insignificant (t test;p = 0.09) trend toward a decrease in the proportion of small neurons, and there were significantly fewer medium-sized neurons in TLE material compared with controls (Fig. 7D). Large neurons made up 30% in the controls but 45% of the TLE total. The perikarya of large neurons occupied significantly more of the gray matter cellular volume (Fig. 7D), and they were significantly increased in density (t test;F(-3.103,14) = 2.389;p < 0.008) in TLE specimens when compared with controls.
Neurons in the white matter of TLE tissue were significantly larger by 55% (Table 3, Fig. 8C) when compared with ectopic neurons in the autopsy control material. When neurons were subdivided into small, medium, or large size categories, the proportion of small- and medium-sized cells were significantly reduced (Fig.8D), whereas the proportion of large cells was significantly increased in the TLE brains when compared with controls. The mean somal volume of ectopic neurons (3042 μm3) in the HS cases significantly exceeded that (2151 μm3) in the non-HS tissue (Mann–Whitney U test; p < 0.01) and that in controls (1192 μm3). The mean cellular volume of the non-HS group also significantly exceeded that in controls (Mann–Whitney U test; p < 0.01).
DISCUSSION
The pathologic substrates that subserve volume loss in the temporal lobe of patients with TLE are as yet unknown. Many studies have concluded that neuronal loss is responsible, but measurements in those reports relied on semiquantitative or qualitative assessments (DeFelipe et al., 1993, 1994; Spreafico et al., 1998; DeFelipe, 1999). As noted by others, potential bias can be introduced into such studies because the analysis requires assumptions about the size, shape, and orientation of neurons as well as the volume of the tissue (West and Gundersen, 1990; Skoglund et al., 1996; Morrison and Hof, 1997;West, 1999). In the present study, we used design-based stereology without such assumptions to address the question of whether there is a detectable loss of neurons in the neocortex of TLE patients. Our results provide new and surprising insights into cortical organization in TLE. Previously reported reduced temporal lobe volume (Lee et al., 1995, 1998; Marsh et al., 1997) is not accompanied by a loss of neurons, but instead, a significant increase in the “packing density” of cells, especially large neurons, as depicted in Figure9. Moreover, spine loss and reduced dendritic arbors, which have already been demonstrated for neocortical cells in human epilepsy (Isokawa and Levesque, 1991; Multani et al., 1994; Isokawa et al., 1997) and hippocampal neurons in experimental epilepsy (Drakew et al., 1996; Jiang et al., 1998), provide an explanation for neuropil reduction. Because it is the large neurons that comprise the greater proportion of cells, neuronal hypertrophy, not loss, is a major consequence of TLE. Because the number of neurons in the underlying white matter is not significantly elevated but also show the same unusual degree of hypertrophy, it appears that increased neuron size rather than number or density marks disease severity.
Fig. 9.
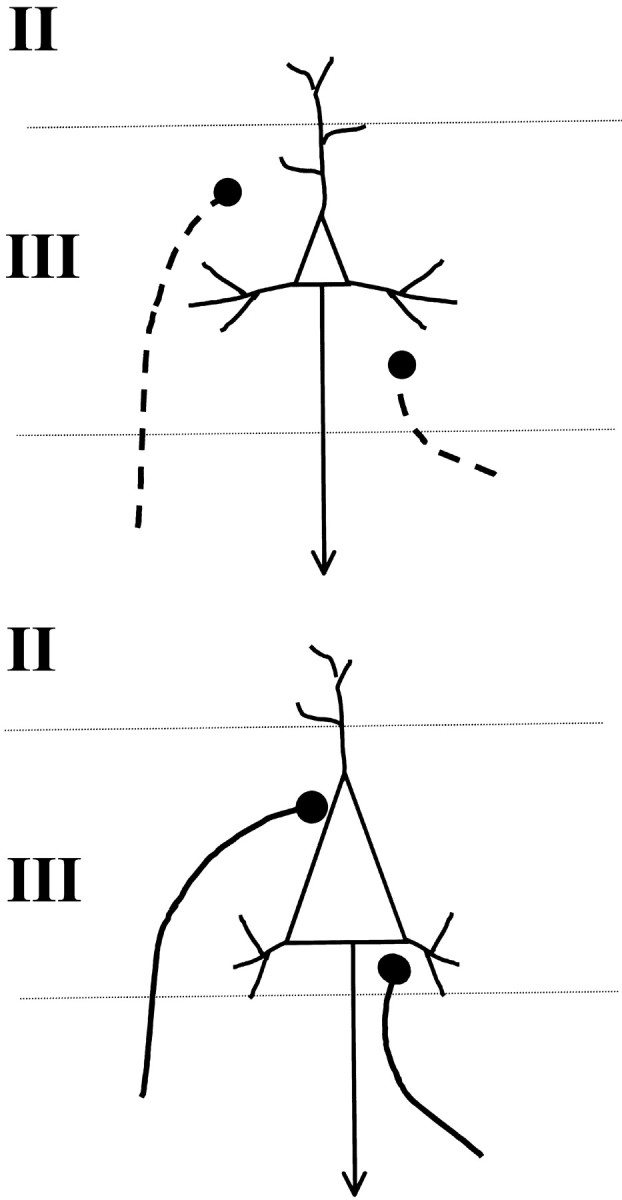
A schematic diagram illustrating the arrival of axons onto layer III neurons during normal development (top). Arriving terminals normally contact spines or distal dendrites. If neurons are hypertrophied and have lost dendrites and spines, as suggested in the bottom diagram, arriving axon terminals, many of which are excitatory, corticocortical connections, could be guided to synapse with the cell body instead.
Tissue variability
Postmortem delay for autopsy tissue was up to 24 hr, but because tissue was rapidly immersed in fixative subsequently, no significant change in neuronal morphology was detected (Ohm and Diekmann, 1994; Anderson et al., 1996). The fact that differences were obtained between HS and non-HS cases in relation to controls also means that our results reflect epilepsy-related, not fixation phenomena.
Problems associated with comparing surgically excised tissue with that obtained at autopsy are well known (Vinters et al., 1993; Multani et al., 1994). Not only are resected tissues obtained from a highly select group, but specimens can also vary in size. Surgically resected tissue is placed in fixative rapidly after removal, whereas autopsy material generally suffers histologically from postmortem delay (Vinters et al., 1993). This difference in handling could potentially affect tissue volume. Furthermore, although the reference space estimated for all specimens in the present study included the rostrocaudal extent of area 38, the superior part of some surgical specimens was not always complete. This also posed a potential problem for volume estimates. It was therefore imperative that the optical fractionator be used to count cells, because it is independent of tissue volume (West and Gundersen, 1990). The analysis of gray matter thickness, a two-dimensional measurement, was also independent of volume. Neuronal density is however expressed per unit volume (Braendgaard et al., 1990), but when taken together with other data obtained independent of volume, this estimate served to reinforce the other results (Table 2).
No neuronal loss in TLE neocortex
Quantitative MRI studies have now established that temporal lobe volume loss exceeds that for mesial structures alone in patients with TLE (Lee et al., 1995, 1998; Doherty et al., 2000). Our results suggest that the reduction in volume is independent of a change in neuronal number. Qualitative assessments of neocortical tissue in TLE cases have uncovered small regions depleted of parvalbumin immunoreactivity and reduced in synapses (DeFelipe et al., 1993; Marco and DeFelipe, 1997;Spreafico et al., 1998; DeFelipe, 1999). Although such analyses provide important explanations for the pathology accompanying seizures, they provide no direct evidence for cell loss. Our findings suggest that the loss of neuronal processes rather than cells is the major anatomical correlate of TLE, just as reduced neuropil in temporal lobe and prefrontal areas seems to form an anatomical basis for schizophrenia (Pakkenberg, 1993; Selemon et al., 1998; Arnold and Trojanowski, 1996; Selemon and Goldman-Rakic, 1999).
We also found no increased number of ectopic neurons in TLE cases, although there was an obvious trend toward more cells (Table 3). We did find that the neuronal size in TLE white matter was significantly greater than that in controls. The probability of counting a neuron is proportional to its volume (Morrison and Hof, 1997), and thus, in earlier studies, there was a great danger of overcounting large cells, especially in thin sections (Hardiman et al., 1988; Emery et al., 1997). This presumably provides some explanation for the discrepancy between our results and the findings of others.
Neuronal hypertrophy
The functional consequences of hypertrophy are not clear. Although viewed as a pathological event (Vogels et al., 1990; Neal et al., 1991;Everall et al., 1993), increased neuron size is not always associated with disease (Sie and Rubel, 1992). It is well accepted that cells enlarge if metabolic or transcriptional demands are increased. Thus, elevated neuropeptide production in hypothalamic nuclei is matched by increased neuronal size (Rance and Young, 1991; Abel and Rance 2000), and the growth of target zones for motor neurons is accompanied by perikaryal enlargement (Cameron et al., 1989; Heckmann and Binder, 1990). Sustained, elevated seizure activity could increase cell size, but it is more likely to be excitotoxic (Houser, 1992). Seizures increase biochemical markers for excitability (Kish et al., 1988;Sherwin et al., 1991; Isokawa and Levesque, 1991; Isokawa et al., 1997), upregulate ionotropic glutamate activity (Zilles et al., 1999), and produce cell loss in the hippocampal formation (Houser, 1992). Therefore, it is unlikely that the uniform increase in volume of neocortical neurons in TLE tissue is caused by epileptogenic activity.
Marín-Padilla (1997, 1999) has shown that cortical neurons enlarge prematurely in relation to perinatal injury. The enlargement seems to result from disrupted cortical differentiation at key times in development. Hypoxia, infection, and hemorrhage not only harm cells at the site of injury but also affect more distant neurons destined to form connections with cells in the damaged zone (Marín-Padilla, 1999). At birth, numerous uncommitted neurons lie between layers I and IV. These neurons continue to develop, form transient synaptic connections, and eventually connect to distant targets, if they survive the waves of apoptotic cell death associated with cortical differentiation (Allendoerfer and Shatz, 1994; Marín-Padilla, 1998). During development, target recognition involves two distinct steps, pathfinding and innervation, and growing axons must traverse considerable distances to reach their targets (Allendoerfer and Shatz, 1994). In the adult, association areas in temporal neocortex are tightly interconnnected with neurons in mesial structures (Burwell, 2000), which have long been known to be affected by seizure (Swanson, 1995; Houser, 1992, 1999; Sloviter, 1999). If damage to mesial structures, such as the entorhinal cortex (Du et al., 1993) or dentate gyrus (Houser, 1992) deprives distant neurons in temporal association areas, either directly or indirectly, of their targets, hypertrophy of neocortical cells may occur as a result. Enlargement would provide metabolic support for new, albeit, aberrant synapses. Because adhesion and extracellular matrix molecules can specify both the time of arrival and the cytoarchitectonic region of innervation (Allendoerfer and Shatz, 1994), cytoskeletal abnormalities could also contribute to anomalous connections. Furthermore, neurons may enlarge if they have undergone abnormal early stage migration or differentiation (Barth, 1987; McConnell, 1989; Vinters et al., 1993).
Increased perikaryal size of neocortical neurons would yield more surface area for synaptic input and should render cells more susceptible to discharge (Henneman, 1957). For mammalian motor neurons to maintain constant firing properties during growth, they must increase synaptic input (Heckmann and Binder, 1990). Because a relative constancy in synaptic interval appears to be maintained across the growing surface of most neurons (Smit et al., 2001), neocortical cells that increase their surface area could increase synaptic inputs during development, particularly if few dendrites and spines are available (present results). If arriving terminals are excitatory and contact the enlarged cell bodies, the likelihood of seizure would increase.
Conclusions
The cytological changes reported here for TLE patients are striking and unique and presumably occur below the threshold for identification during routine neuropathologic examination. We have documented an apparent loss in neuropil volume, but no coincident loss of neurons. We hypothesize a reduction in neuronal processes to accompany a documented increase in neuronal somal volume. If larger cells are associated with increased perikaryal innervation, especially from excitatory synapses, then neuronal hypertrophy could play an important role in the susceptibility of neocortical tissue to hyperexcitability and TLE.
Footnotes
This work was supported by a grant from the Health Research Board of Ireland (M.F., G.E.M.), an equipment grant from the Wellcome Trust and the Health Research Board of Ireland (G.E.M., M.F.), and DA07625 and DA00119 (S.A.D.). We acknowledge the Media Services Department at the Royal College of Surgeons in Ireland for valuable photographic assistance. We also thank Claire Nolan and Peter Stafford for helpful technical assistance.
Correspondence should be addressed to Dr. Gloria E. Meredith, Department of Basic Medical Science, University of Missouri-Kansas City, School of Medicine, 2411 Holmes Road, M3-C03, Kansas City, MO 64108. E-mail: meredithg@umkc.edu.
REFERENCES
- 1.Abel TW, Rance NE. Stereologic study of the hypothalamic infundibular nucleus in young and older women. J Comp Neurol. 2000;424:679–688. doi: 10.1002/1096-9861(20000904)424:4<679::aid-cne9>3.0.co;2-l. [DOI] [PubMed] [Google Scholar]
- 2.Allendoerfer KL, Shatz CJ. the subplate, a transient neocortical structure: its role in the development of connections between thalamus and cortex. Annu Rev Neurosci. 1994;17:185–218. doi: 10.1146/annurev.ne.17.030194.001153. [DOI] [PubMed] [Google Scholar]
- 3.Anderson AJ, Su JH, Cotman CW. DNA damage and apoptosis in Alzheimer's disease: colocalization with c-Jun immunoreactivity, relationship to brain area, and effect of postmortem delay. J Neurosci. 1996;16:1710–1719. doi: 10.1523/JNEUROSCI.16-05-01710.1996. [DOI] [PMC free article] [PubMed] [Google Scholar]
- 4.Arnold SE, Trojanowski JQ. Recent advances in defining the neuropathology of schizophrenia. Acta Neuropathologica. 1996;92:217–231. doi: 10.1007/s004010050512. [DOI] [PubMed] [Google Scholar]
- 5.Babb TL, Brown WJ, Pretorius J, Davenport C, Lieb JP, Crandall PH. Temporal lobe volumetric cell densities in temporal lobe epilepsy. Epilepsia. 1984;25:729–740. doi: 10.1111/j.1528-1157.1984.tb03484.x. [DOI] [PubMed] [Google Scholar]
- 6.Barth PG. Disorders of neuronal migration. Can J Neurol Sci. 1987;14:1–16. doi: 10.1017/s031716710002610x. [DOI] [PubMed] [Google Scholar]
- 7.Bothwell S, Nolan C, Farrell M, Phillips J, Staunton H, Doherty C, Meredith GE. Stereological estimate of neuronal density in the neocortex of patients with temporal lobe epilepsy. Soc Neurosci Abstr. 1999;25:603. doi: 10.1523/JNEUROSCI.21-13-04789.2001. [DOI] [PMC free article] [PubMed] [Google Scholar]
- 8.Braendgaard H, Evans SM, Howard CV, Gundersen HJ. The total number of neurons in the human neocortex unbiasedly estimated using optical disectors. J Microsc. 1990;157:285–304. doi: 10.1111/j.1365-2818.1990.tb02967.x. [DOI] [PubMed] [Google Scholar]
- 9.Burwell RD. The parahippocampal region: corticocortical connectivity. Ann NY Acad Sci. 2000;911:25–42. doi: 10.1111/j.1749-6632.2000.tb06717.x. [DOI] [PubMed] [Google Scholar]
- 10.Cameron WE, Fang H, Brozanski BS, Guthrie RD. The postnatal growth of motoneurons at three levels of the cat neuraxis. Neurosci Lett. 1989;104:274–280. doi: 10.1016/0304-3940(89)90588-0. [DOI] [PubMed] [Google Scholar]
- 11.Choi BH, Matthias SC. Cortical dysplasia associated with massive ectopia of neurons and glial cells within the subarachnoid space. Acta Neuropathol. 1987;73:105–109. doi: 10.1007/BF00693774. [DOI] [PubMed] [Google Scholar]
- 12.Coggeshall RE. A consideration of neural counting methods. Trends Neurosci. 1992;15:9–13. doi: 10.1016/0166-2236(92)90339-a. [DOI] [PubMed] [Google Scholar]
- 13.DeFelipe J. Chandelier cells and epilepsy. Brain. 1999;122:1807–1822. doi: 10.1093/brain/122.10.1807. [DOI] [PubMed] [Google Scholar]
- 14.DeFelipe J, Sola RG, Marco P, del Rio MR, Pulido P, Ramon y Cajal S. Selective changes in the microorganization of the human epileptogenic neocortex revealed by parvalbumin immunoreactivity. Cereb Cortex. 1993;3:39–48. doi: 10.1093/cercor/3.1.39. [DOI] [PubMed] [Google Scholar]
- 15.DeFelipe J, Huntley GW, del Rio MR, Sola RG, Morrison JH. Microzonal decreases in the immunostaining for non-NMDA ionotropic excitatory amino acid receptor subunits GluR 2/3 and GluR 5/6/7 in the human epileptogenic neocortex. Brain Res. 1994;657:150–158. doi: 10.1016/0006-8993(94)90962-8. [DOI] [PubMed] [Google Scholar]
- 16.Doherty CP, Meredith GE, Farrell M, Toland J, Staunton H. Radiological determination of the posterior limits of the temporal lobe for volumetric analysis. Brain Res Protoc. 1998;4:1–10. doi: 10.1016/s1385-299x(98)00053-1. [DOI] [PubMed] [Google Scholar]
- 17.Doherty CP, Fitzsimons M, Holohan T, Mohamed HB, Farrell M, Meredith GE, Staunton H. Accuracy and validity of stereology as a quantitative method for assessment of human temporal lobe volumes acquired by magnetic resonance imaging. Magn Reson Imaging. 2000;18:1017–1025. doi: 10.1016/s0730-725x(00)00185-5. [DOI] [PubMed] [Google Scholar]
- 18.Drakew A, Muller M, Gahwiler BH, Thompson SM, Frotscher M. Spine loss in experimental epilepsy: quantitative light and electron microscopic analysis of intracellularly stained CA3 pyramidal cells in hippocampal slice cultures. Neuroscience. 1996;70:31–45. doi: 10.1016/0306-4522(95)00379-w. [DOI] [PubMed] [Google Scholar]
- 19.Du F, Whetsell W, Abou-Khalil B, Blumenkopf B, Lothman E, Schwarcz R. Preferential neuronal loss in layer III of the entorhinal cortex in patients with temporal lobe epilepsy. Epilepsy Res. 1993;16:223–233. doi: 10.1016/0920-1211(93)90083-j. [DOI] [PubMed] [Google Scholar]
- 20.Einstein G, Farris D, Crain B. Investigating single neurons in human autopsy material. In: Meredith GE, Arbuthnott GW, editors. Morphological investigations of single neurons in vitro. Wiley; Chichester: 1993. pp. 105–127. [Google Scholar]
- 21.Emery JA, Roper SN, Rojiani AM. White matter neuronal heterotopia in temporal lobe epilepsy: a morphometric and immunohistochemical study. J Neuropathol Exp Neurol. 1997;56:1276–1282. doi: 10.1097/00005072-199712000-00002. [DOI] [PubMed] [Google Scholar]
- 22.Everall IP, Luthert PJ, Lantos PL. Neuronal number and volume alterations in the neocortex of HIV infected individuals. J Neurol Neurosurg Psychiatry. 1993;56:481–486. doi: 10.1136/jnnp.56.5.481. [DOI] [PMC free article] [PubMed] [Google Scholar]
- 23.Ferrer I, Oliver B, Russi A, Casas R, Rivera R. Parvalbumin and calbindin-D28k immunocytochemistry in human neocortical epileptic foci. J Neurol Sci. 1994;123:18–25. doi: 10.1016/0022-510x(94)90198-8. [DOI] [PubMed] [Google Scholar]
- 24.Garey LJ. Brodmann's localisation in the cerebral cortex. Smith-Gordon; London: 1994. [Google Scholar]
- 25.Gundersen HJG. Stereology of arbitrary particles. A review of unbiased number and size estimators and the presentation of some new ones, in the memory of William R. Thompson. J Microsc. 1986;143:3–45. [PubMed] [Google Scholar]
- 26.Gundersen HJG, Bagger P, Bendtsen TF, Evans SM, Korbo L, Marcussen N, Möller A, Nielsen K, Nyengaard JR, Pakkenberg B. The new stereological tools: disector, fractionator, nucleator, and point sampled intercepts and their use in pathological research and diagnosis. APMIS. 1988;96:857–881. doi: 10.1111/j.1699-0463.1988.tb00954.x. [DOI] [PubMed] [Google Scholar]
- 27.Haines JL, Short MP, Kwiatkowski DJ, Jewell A, Andermann E, Bejjani B, Yang CH, Gusella JF, Amos JA. Localization of one gene for tuberous sclerosis within 9q32–9q34, and further evidence for heterogeneity. Am J Human Genet. 1991;49:764–772. [PMC free article] [PubMed] [Google Scholar]
- 28.Hardiman O, Burke T, Phillips J, Murphy S, O'Moore B, Staunton H, Farrell MA. Microdysgenesis in resected temporal neocortex: incidence and clinical significance in focal epilepsy. Neurol. 1988;38:1041–1047. doi: 10.1212/wnl.38.7.1041. [DOI] [PubMed] [Google Scholar]
- 29.Heckman CJ, Binder MD. Neural mechanisms underlying the orderly recruitment of motoneurons. In: Binder MD, Mendell LM, editors. The segmental motor system. Oxford UP; New York: 1990. pp. 182–204. [Google Scholar]
- 30.Henneman E. Relation between size of neurons and their susceptibility to discharge. Science. 1957;126:1345–1346. doi: 10.1126/science.126.3287.1345. [DOI] [PubMed] [Google Scholar]
- 31. Houser CR. Morphological changes in the dentate gyrus in human temporal lobe epilepsy. The dentate gyrus and its role in seizures Ribak CE, Gall CM, Mody I. 1992. Epilepsy Res [Suppl] 7:223–234. [PubMed]
- 32.Houser CR. Neuronal loss and synaptic reorganization in temporal lobe epilepsy. Adv Neurol. 1999;79:743–761. [PubMed] [Google Scholar]
- 33.Howard CV, Reed MG. Unbiased stereology. Three-dimensional measurement in microscopy. BIOS Scientific; Oxford: 1998. [Google Scholar]
- 34.Isokawa M, Levesque MF. Increased NMDA responses and dendritic degeneration in human epileptic hippocampal neurons in slices. Neurosci Lett. 1991;132:212–216. doi: 10.1016/0304-3940(91)90304-c. [DOI] [PubMed] [Google Scholar]
- 35.Isokawa M, Levesque M, Fried I, Engel J., Jr Glutamate currents in morphologically identified human dentate granule cells in temporal lobe epilepsy. J Neurophysiol. 1997;77:3355–3369. doi: 10.1152/jn.1997.77.6.3355. [DOI] [PubMed] [Google Scholar]
- 36.Jiang M, Lee CL, Smith KL, Swann JW. Spine loss and other persistent alterations of hippocampal pyramidal cell dendrites in a model of early-onset epilepsy. J Neurosci. 1998;18:8356–8368. doi: 10.1523/JNEUROSCI.18-20-08356.1998. [DOI] [PMC free article] [PubMed] [Google Scholar]
- 37.Kish SJ, Dixon LM, Sherwin AL. Aspartic acid aminotransferase activity is increased in actively spiking compared with non-spiking human epileptic cortex. J Neurol Neurosurg Psychiatry. 1988;51:552–556. doi: 10.1136/jnnp.51.4.552. [DOI] [PMC free article] [PubMed] [Google Scholar]
- 38.Lee J, Reutens D, Dubeau F, Evans A, Andermann F. Morphometry in temporal lobe epilepsy. Magn Reson Imaging. 1995;13:1073–1080. doi: 10.1016/0730-725x(95)02015-l. [DOI] [PubMed] [Google Scholar]
- 39.Lee J, Andermann F, Dubeau F, Bernasconi A, MacDonald D, Evans A, Reutens D. Morphometric analysis of the temporal lobe in temporal lobe epilepsy. Epilepsia. 1998;39:727–736. doi: 10.1111/j.1528-1157.1998.tb01158.x. [DOI] [PubMed] [Google Scholar]
- 40.Marco P, DeFelipe J. Altered synaptic circuitry in the human temporal neocortex removed from epileptic patients. Exp Brain Res. 1997;114:1–10. doi: 10.1007/pl00005608. [DOI] [PubMed] [Google Scholar]
- 41.Marco P, Sola RG, Pulido P, Alijarde MT, Sanchez A, Ramon y Cajal S, DeFelipe J. Inhibitory neurons in the human epileptogenic temporal neocortex. An immunocytochemical study. Brain. 1996;119:1327–1347. doi: 10.1093/brain/119.4.1327. [DOI] [PubMed] [Google Scholar]
- 42.Marín-Padilla M. Development neuropathology and impact of perinatal brain damage. II: White matter lesions of the neocortex. J Neuropathol Exp Neurol. 1997;56:219–235. doi: 10.1097/00005072-199703000-00001. [DOI] [PubMed] [Google Scholar]
- 43.Marín-Padilla M. Cajal-Retzius cells and the development of the neocortex. Trends Neurosci. 1998;21:64–71. doi: 10.1016/s0166-2236(97)01164-8. [DOI] [PubMed] [Google Scholar]
- 44.Marín-Padilla M. Developmental neuropathology and impact of perinatal brain damage. III: Gray matter lesions of the neocortex. J Neuropathol Exp Neurol. 1999;58:407–429. doi: 10.1097/00005072-199905000-00001. [DOI] [PubMed] [Google Scholar]
- 45.Marsh L, Morrell M, Shear P, Sullivan E, Freeman H, Marie A, Lim K, Pfefferbaum A. Cortical and hippocampal volume deficits in temporal lobe epilepsy. Epilepsia. 1997;38:576–587. doi: 10.1111/j.1528-1157.1997.tb01143.x. [DOI] [PubMed] [Google Scholar]
- 46.Mathern GW, Babb TL, Pretorius JK, Leite JP. Reactive synaptogenesis and neuron densities for neuropeptide Y, somatostatin and glutamate decarboxylase immunoreactivity in the epileptogenic human fascia dentata. J Neurosci. 1995;15:3990–4004. doi: 10.1523/JNEUROSCI.15-05-03990.1995. [DOI] [PMC free article] [PubMed] [Google Scholar]
- 47.McConnell SK. The determination of neuronal fate in the cerebral cortex. Trends Neurosci. 1989;12:342–349. doi: 10.1016/0166-2236(89)90041-6. [DOI] [PubMed] [Google Scholar]
- 48.Meredith GE, Arbuthnott GW. The challenge of in vitro preparations for morphological investigations. In: Meredith GE, Arbuthnott GW, editors. Morphological investigations of single neurons in vitro. Wiley; Chichester: 1993. pp. 1–25. [Google Scholar]
- 49.Mitchell LA, Jackson GD, Kalnins RM, Saling MM, Fitt GJ, Ashpole RD, Berkovic SF. Anterior temporal abnormality in temporal lobe epilepsy: a quantitative MRI and histopathologic study. Neurology. 1999;52:327–336. doi: 10.1212/wnl.52.2.327. [DOI] [PubMed] [Google Scholar]
- 50.Möller A, Strange P, Gundersen HJ. Efficient estimation of cell volume and number using the nucleator and the disector. J Microsc. 1990;159:61–71. doi: 10.1111/j.1365-2818.1990.tb03019.x. [DOI] [PubMed] [Google Scholar]
- 51.Morrison JH, Hof PR. Life and Death of neurons in the aging brain. Science. 1997;278:412–419. doi: 10.1126/science.278.5337.412. [DOI] [PubMed] [Google Scholar]
- 52.Multani P, Myers RH, Blume HW, Schomer DL, Sotrel A. Neocortical dendritic pathology in human partial epilepsy: a quantitative Golgi study. Epilepsia. 1994;35:728–736. doi: 10.1111/j.1528-1157.1994.tb02503.x. [DOI] [PubMed] [Google Scholar]
- 53.Nakasato N, Levesque MF, Babb TL. Seizure outcome following standard temporal lobectomy: correlation with hippocampal neuron loss and extrahippocampal pathology. J Neurosurg. 1992;77:194–200. doi: 10.3171/jns.1992.77.2.0194. [DOI] [PubMed] [Google Scholar]
- 54.Neal JW, Pearson RCA, Cole G, Powell TPS. Neuronal hypertrophy in the pars reticulata of the substantia nigra in Parkinson's disease. Neuropathol Appl Neurobiol. 1991;17:203–206. doi: 10.1111/j.1365-2990.1991.tb00715.x. [DOI] [PubMed] [Google Scholar]
- 55.Ohm TG, Diekmann S. The use of Lucifer yellow and mini-ruby for intracellular staining in fixed brain tissue: methodological considerations evaluated in rat and human autopsy brains. J Neurosci Methods. 1994;55:105–110. doi: 10.1016/0165-0270(94)90046-9. [DOI] [PubMed] [Google Scholar]
- 56.Ojemann GA. Surgical therapy for medically intractable epilepsy. J Neurosurg. 1987;66:489–499. doi: 10.3171/jns.1987.66.4.0489. [DOI] [PubMed] [Google Scholar]
- 57.Pakkenberg B. Total nerve cell number in neocortex in chronic schizophrenics and controls estimated using optical disectors. Biol Psychiatry. 1993;34:768–772. doi: 10.1016/0006-3223(93)90065-l. [DOI] [PubMed] [Google Scholar]
- 58.Peterson DA, Dickinson-Anson HA, Leppert JT, Lee K-F, Gage FH. Central neuronal loss and behavioral impairment in mice lacking neurotrophin receptor p75. J Comp Neurol. 1999;404:1–20. doi: 10.1002/(sici)1096-9861(19990201)404:1<1::aid-cne1>3.0.co;2-#. [DOI] [PubMed] [Google Scholar]
- 59.Rance NE, Young WS. Hypertrophy and increased gene expression of neurons containing neurokinin-B and substance-P messenger ribonucleic acids in the hypothalami of postmenopausal women. Endocrinology. 1991;128:2239–2247. doi: 10.1210/endo-128-5-2239. [DOI] [PubMed] [Google Scholar]
- 60.Rausch R, Henry TR, Ary CM, Engel J, Jr, Mazziotta JAD. Asymmetric interictal glucose hypometabolism and cognitive performance in epileptic patients. Arch Neurol. 1994;51:139–144. doi: 10.1001/archneur.1994.00540140045013. [DOI] [PubMed] [Google Scholar]
- 61.Raymond AA, Fish DR, Sisodiya SM, Alsanjari N, Stevens JM, Shorvon SD. Abnormalities of gyration, heteropias, tuberous sclerosis, focal cortical dysplasia, microdysgenesis, dysembryoplastic neuroepithelial tumour and dysgenesis of the archicortex in epilepsy. Brain. 1995;118:629–660. doi: 10.1093/brain/118.3.629. [DOI] [PubMed] [Google Scholar]
- 62.Schiffmann S, Campistron G, Tugendhaft P, Brotchi J, Flament-Durand J, Geffard M, Vanderhaeghen JJ. Immunocytochemical detection of GABAergic nerve cells in the human temporal cortex using γ-aminobutyric acid antiserum. Brain Res. 1988;442:2270–2278. doi: 10.1016/0006-8993(88)91512-0. [DOI] [PubMed] [Google Scholar]
- 63.Selemon LD, Goldman-Rakic PS. The reduced neuropil hypothesis: a circuit based model of schizophrenia. Biol Psychiatry. 1999;45:17–25. doi: 10.1016/s0006-3223(98)00281-9. [DOI] [PubMed] [Google Scholar]
- 64.Selemon LD, Rajowska G, Goldman-Rakic P. Elevated neuronal density in prefrontal area 46 in brains from schizophrenic patients: application of a three-dimensional, stereologic counting method. J Comp Neurol. 1998;392:402–412. [PubMed] [Google Scholar]
- 65.Sherwin AL, Vernet O, Dubeau F, Olivier A. Biochemical markers of excitability in human neocortex. Can J Neurol Sci [Suppl] 1991;18:640–644. doi: 10.1017/s0317167100032868. [DOI] [PubMed] [Google Scholar]
- 66.Sie KCY, Rubel EW. Rapid changes in protein synthesis and cell size in the cochlear nucleus following eighth nerve activity blockade or cochlea ablation. J Comp Neurol. 1992;320:501–508. doi: 10.1002/cne.903200407. [DOI] [PubMed] [Google Scholar]
- 67.Sisodiya SM, Free SL, Stevens JM, Fish DR, Shorvon SD. Widespread cerebral structural changes in patients with cortical dysgenesis and epilepsy. Brain. 1995;118:1039–1050. doi: 10.1093/brain/118.4.1039. [DOI] [PubMed] [Google Scholar]
- 68.Sisodiya SM, Moran N, Free SL, Kitchen ND, Stevens JM, Harkness WF, Fish DR, Shorvon SD. Correlation of widespread preoperative magnetic resonance imaging changes with unsuccessful surgery for hippocampal sclerosis. Ann Neurol. 1997;41:490–496. doi: 10.1002/ana.410410412. [DOI] [PubMed] [Google Scholar]
- 69.Skoglund TS, Pascher R, Berthold C-H. Aspects of the quantitative analysis of neurons in the cerebral cortex. J Neurosci Methods. 1996;70:201–210. doi: 10.1016/s0165-0270(96)00119-7. [DOI] [PubMed] [Google Scholar]
- 70.Sloviter RS. Status epilepticus-induced neuronal injury and network reorganization. Epilepsia. 1999;[Suppl1] 40:34–41. doi: 10.1111/j.1528-1157.1999.tb00876.x. [DOI] [PubMed] [Google Scholar]
- 71.Smit WA, Velzing EH, Diegenbach PC, Roberts BL. Changing synaptic connections on cell bodies of growing identified spinal motoneurons of the eel, Anguilla. Anat Embryol. 2001;203:129–136. doi: 10.1007/s004290000149. [DOI] [PubMed] [Google Scholar]
- 72.Somogyi P, Hodgson AJ, Smith AD. An approach to tracing neuron networks in the cerebral cortex and basal ganglia. Combination of Golgi staining, retrograde transport of horseradish peroxidase and anterograde degeneration of synaptic boutons in the same material. Neuroscience. 1979;4:1805–1852. doi: 10.1016/0306-4522(79)90059-9. [DOI] [PubMed] [Google Scholar]
- 73.Spreafico R, Battaglia G, Arcelli P, Andermann F. Cortical dysplasia. An immunocytochemical study of three patients. Neurol. 1998;50:27–36. doi: 10.1212/wnl.50.1.27. [DOI] [PubMed] [Google Scholar]
- 74.Sterio DC. The unbiased estimation of number and sizes of arbitrary particles using the disector. J Microsc. 1984;134:127–136. doi: 10.1111/j.1365-2818.1984.tb02501.x. [DOI] [PubMed] [Google Scholar]
- 75.Swanson TH. The pathophysiology of human mesial temporal lobe epilepsy. J Clin Neurophysiol. 1995;12:2–22. [PubMed] [Google Scholar]
- 76.Vinters HV, De Rosa MJ, Farrell MA. Neuropathologic study of resected cerebral tissue from patients with infantile spasms. Epilepsia. 1993;34:772–779. doi: 10.1111/j.1528-1157.1993.tb00460.x. [DOI] [PubMed] [Google Scholar]
- 77.Vogels OJM, Broere CAJ, Nieuwenhuys R. Neuronal hypertrophy in the human supraoptic and paraventricular nucleus in aging and Alzheimer's disease. Neurosci Lett. 1990;109:62–67. doi: 10.1016/0304-3940(90)90538-k. [DOI] [PubMed] [Google Scholar]
- 78.Watson C, Andermann F, Gloor P, Jones-Gotman M, Peters T, Evans A, Olivier A, Melanson D, Leroux G. Anatomic basis of amygdaloid and hippocampal volume measurement by magnetic resonance imaging. Neurol. 1992;42:1743–1750. doi: 10.1212/wnl.42.9.1743. [DOI] [PubMed] [Google Scholar]
- 79.West MJ. New stereological methods for counting neurons. Neurobiol Aging. 1993;14:275–285. doi: 10.1016/0197-4580(93)90112-o. [DOI] [PubMed] [Google Scholar]
- 80.West MJ. Stereological methods for estimating the total number of neurons and synapses: issues of precision and bias. Trends Neurosci. 1999;22:51–61. doi: 10.1016/s0166-2236(98)01362-9. [DOI] [PubMed] [Google Scholar]
- 81.West MJ, Gundersen HJG. Unbiased stereological estimation of the number of neurons in the human hippocampus. J Comp Neurol. 1990;296:1–22. doi: 10.1002/cne.902960102. [DOI] [PubMed] [Google Scholar]
- 82.West MJ, Coleman PD, Flood DG, Troncoso JC. Differences in the pattern of hippocampal neuronal loss in normal ageing and Alzheimer's disease. Lancet. 1994;344:769–772. doi: 10.1016/s0140-6736(94)92338-8. [DOI] [PubMed] [Google Scholar]
- 83.Zilles K, Qü MS, Köhlings R, Speckmann E-J. Ionotrophic glutamate and GABA receptors in human epileptic neocortical tissue: quantitative in vitro receptor autoradiography. Neuroscience. 1999;94:1051–1061. doi: 10.1016/s0306-4522(99)00392-9. [DOI] [PubMed] [Google Scholar]