

Abstract
Retinal bipolar neurons transmit visual information by means of graded synaptic potentials that spread to the synaptic terminal without sodium-dependent action potentials. Although action potentials are not involved, voltage-dependent sodium channels may enhance subthreshold depolarizing potentials in the dendrites and soma of bipolar cells, as they do in other CNS neurons. We report here that voltage-dependent sodium currents are observed in a subset of bipolar neurons from goldfish retina. Single-cell reverse transcriptase-PCR identified four different sodium channel α subunits in goldfish bipolar cells, putatively corresponding to the mammalian voltage-gated sodium channels Nav1.1, Nav1.2, Nav1.3, and Nav1.6. The amount of sodium current was largest in cells with smaller synaptic terminals, which probably represent cone bipolar cells. Localization of sodium channel immunoreactivity in goldfish retina confirmed the expression of voltage-gated sodium channels in cone bipolar cells of both ON and OFF types. Both immunocytochemical and physiological evidence suggests that the sodium channels are localized to the soma and dendrites where they may play a role in transmission of synaptic signals, particularly in the long, thin dendrites of cone bipolar cells.
Keywords: retina, sodium channels, electrical excitability, retinal bipolar neurons, single-cell PCR, patch clamp
Although voltage-gated sodium channels are principally associated with action potentials, sodium channels may also play a role in the propagation and shaping of subthreshold signals. Even at densities insufficient to support action potentials, voltage-gated sodium channels can boost graded depolarizations, allowing more rapid propagation with less spatial decrement in amplitude than would otherwise occur during passive propagation (Taylor et al., 1995). For instance, dendritic and somatic sodium channels amplify voltage changes recorded in neuronal somata in response to excitatory synaptic inputs (Stuart and Sakmann, 1995;Lipowsky et al., 1996; Andreasen and Lambert, 1999).
A role for sodium channels in subthreshold signal propagation might be especially significant in the retina where many neurons do not produce sodium action potentials and rely instead on electrotonic spread of signals. In bipolar cells, for example, the relatively short transmission distance (<100 μm) from the dendrites to the synaptic terminal allows electrical signals to spread passively to the spiking amacrine and ganglion cells of the inner retina without mediation by action potentials. To determine whether voltage-gated sodium channels might contribute to signal transmission in bipolar cells, membrane currents of isolated bipolar neurons from goldfish retina were recorded under whole-cell patch clamp. Consistent with a recent report of voltage-dependent sodium currents in mammalian bipolar cells (Pan and Hu, 2000), a subset of goldfish bipolar cells expressed rapidly inactivating sodium currents that were blocked by tetrodotoxin (TTX). Expression of voltage-dependent sodium channels in bipolar cells was also confirmed by single-cell reverse transcriptase (RT)-PCR and immunocytochemistry. The sodium channels were found predominantly in the somatic–dendritic region of bipolar cells, which suggests that they may boost synaptic depolarization in response to illumination and thus potentiate signal propagation from the dendrites to the synaptic terminal.
MATERIALS AND METHODS
Cell dissociation. Bipolar neurons were dissociated from goldfish retina as described previously (Heidelberger and Matthews, 1992). After eyes were removed and hemisected, the remaining vitreous was removed by incubating eyecups in a solution of hyaluronidase (1100 U/ml) in saline consisting of (in mm): NaCl (102), KCl (2.5), MgCl2 (1), CaCl2 (0.5), glucose (10), and HEPES (10), pH 7.4. Retinas were then isolated, cut into approximately eight pieces, and digested in saline (as above) containing 2.7 mm cysteine and papain (15–30 U/ml; Fluka, Buchs, Switzerland). An individual piece was dissociated by mechanical trituration in a fire-polished Pasteur pipette and plated into a glass-bottomed recording chamber. Isolated bipolar cells were identified on the basis of their distinctive morphology, and recordings were made within 2 hr of dissociation.
Patch-clamp recordings. Whole-cell patch-clamp recordings were obtained using standard techniques. The standard pipette solution consisted of (in mm): Cs gluconate or Cs methanesulfonate (120), HEPES (10), TEA Cl (10), MgCl2 (3), Na2ATP (2), GTP (0.5), EGTA (0.1), pH 7.2. The external saline was the same as for digestion, except CaCl2 was increased to 2.5 mm. For experiments with sodium-free external solution, NaCl was replaced by choline Cl. TTX (10–1000 nm; Calbiochem, La Jolla, CA) was applied by local superfusion of the recorded cell via an application pipette placed near the cell.
Light microscope immunohistochemistry. Eyecups were fixed in 4% paraformaldehyde in 0.1 m phosphate buffer (PB; pH 7.4, 0.15 mm CaCl2) at 4°C for 15–60 min. Tissue was washed three times for 15 min in PB (with 5% glucose, pH 7.4, 0.15 mmCaCl2, 0.02% Na azide) and cryoprotected in 30% sucrose, 0.1 m PB at 4°C overnight. Isolated retinas were embedded in a gelatin–albumin mixture (3% gelatin, 30% egg albumin in distilled H2O) and quickly frozen in liquid nitrogen-cooled isopentane. Cryosections (12–14 μm thick) were placed on gelatin–chromium-coated slides, air-dried, and stored at −20°C.
Sections were washed three times for 10 min in PBS, pH 7.4, post-fixed for 5 min (fixative as described above), rinsed three times for 5 min, treated with 0.1% sodium borohydride (in PBS) 1–2 min, rinsed five times for 5 min (PBS), and blocked in 5% normal goat serum (NGS) in PBS/0.3% Triton X-100 for 20 min. Sections were incubated overnight in pan-specific polyclonal antibody against α subunits of voltage-dependent sodium channels (PanNaCh; 1:1000) (Dugandzija-Novakovic et al., 1995). This antibody is directed against an 18-residue portion of the intracellular linker connecting domains III and IV that is 100% conserved in all known voltage-dependent sodium channels in vertebrates. After being washed in PBS for 30 min, tissue was blocked again and incubated with secondary antisera [donkey-anti-rabbit-Cy3 (1:1000)] for 35 min at 37°C. For double labeling, sections were incubated overnight at 4°C in a mixture of PanNaCh (1:1000) and mouse anti-PKC (1:75; clone MC5; Amersham, Arlington Heights, IL) in PBS containing 0.3% Triton X-100 and 5% NGS. After being washed in PBS for 45 min, tissues were incubated in a mixture of the secondary antibodies: goat anti-mouse FITC (1:125) and donkey anti-rabbit Cy3 (1:1000). After a 30 min wash in PBS, slides were coverslipped with Vectashield (Vector Laboratories, Burlingame, CA) and stored at −20°C until viewed with an Olympus BH2 epifluorescence microscope. Sections were observed with filter sets that were optimized for FITC and Cy3 viewing. An additional FITC narrow-band pass filter (D535; Chroma Technology Corp., Brattleboro, VT) was inserted when viewing FITC to further ensure no crossover from the Cy3. Sections labeled for either FITC or Cy3 alone showed no evidence of crossover fluorescence when viewed or photographed with the alternate filter set. Fluorescence micrographs were obtained with a Kodak DC290 digital camera. Images were only adjusted for brightness and contrast in a linear manner. Control sections were prepared by both omitting the primary antibody and following overnight preadsorption of PanNaCh with peptide antigen used to generate the antisera.
RT-PCR analysis. Goldfish retinas were separated from hemisected eyes and rapidly frozen. Total RNA was extracted by the method of Cathala et al. (1983) and stored at −80°C under ethanol. Reverse transcription using Superscript II reverse transcriptase (Life Technologies, Gaithersburg, MD) was performed according to the manufacturer's protocol. In brief, 1–5 μg of total RNA was added to DEPC-treated water to a final volume of 11 μl. The solution was heated to 95°C for 5 min and then placed on ice. Random hexamer primers (3 μg) were added, and the mixture was incubated at 70°C for 10 min and then cooled on ice. After addition of 4 μl of 5× first-strand synthesis buffer, 2 μl of 0.1mDTT, 1 μl of dNTPs (10 mm each), 10 U of RNasin, and 200 U of Superscript II, the synthesis reaction was performed at 42°C for 1 hr. The RNA was then digested with RNase H (1.5 U) for 20 min at 37°C, followed by heating to 95°C for 5 min. RNasin was obtained from Eppendorf, and all other reagents were obtained from Life Technologies.
Conventional PCR was then performed using 2 μl of reverse transcribed cDNA in 50 μl of PCR buffer and reactants, using PlatinumTaq DNA polymerase (Life Technologies). The standard amplification protocol consisted of 95°C for 5 min, followed by 45 cycles of 95, 55, and 72°C for 1 min each, ending with 72°C for 4 min. Primers were designed that are predicted to amplify cDNA for all known neuronal sodium channels in vertebrates. The forward primer was 5′-GATYCTSCTCAGYAGTGG-3′, and the reverse primer was 5′-CATRATRTCCATCCAKCC-3′. These primers embrace the region from S1 to the pore region of domain III in sodium channel α subunits and produce an amplified product of ∼630 bp. cDNA products of the correct size were gel purified and subcloned into pGEM-T Easy cloning vector (Promega). Selected clones were sequenced on an automatic DNA sequencer. Sequences are available in GenBank under accession numbersAF372581 through AF372584.
For single-cell RT-PCR, cell contents were aspirated into a whole-cell patch pipette containing pipette solution made with RNase-free water (Ambion, Austin, TX). To prevent extraneous material from entering the patch pipette, a small amount of the cell was left outside the pipette to plug the tip. The pipette contents (∼1 μl) were then expelled into a siliconized 0.5 ml microfuge tube containing 10.5 μl of RNase-free water. We then added 4 μl of 5× first-strand synthesis buffer, 0.5 μl of 0.1 m DTT, 2 μl of RNasin (2 U/μl), 1 μl of dNTPs (10 mm each), and 1 μl of random hexamer primers (3 μg/μl). After incubation at room temperature for 10 min, 1 μl of Superscript II reverse transcriptase (200 U/μl) was added, and the cDNA synthesis was performed for 1 hr at 42°C. The RNase H treatment was omitted. All components were obtained from Life Technologies except RNasin, which was obtained from Eppendorf. Two rounds of PCR amplification were performed using the thermocycler protocol described above for analysis of sodium channels in whole retina. The first-round primers were the same as those used for whole-retina PCR analysis (see above). Second-round PCR primers were designed on the basis of the sequences of sodium channel cDNAs obtained from goldfish retinal RNA. For the second round, the forward primer was 5′-GCDYTGGCWTTTKRAGAYRTKTACATT-3′, and the reverse primer was 5′-CCARSRCCCACRTTRTCRAAGTT-3′. The expected size of the amplified cDNA from the second-round primers is 550–580 bp. Amplified products of the correct size were gel purified, subcloned in pGEM-T Easy, and sequenced.
Three control experiments were performed in parallel with each single-cell RT-PCR experiment. First, cell contents were aspirated, and all experimental steps were performed, except the reverse transcriptase enzyme was omitted. Second, we performed a sham cell collection in which a patch pipette was placed in the bath and a small amount of external fluid was aspirated instead of a cell. The pipette contents were then expelled, and all experimental steps were performed as for collected cells. Third, the two rounds of PCR were performed, but water was substituted for the reverse transcription reaction product in the first round. For all experiments included in the analysis, all three control experiments were negative for amplified PCR products of the expected size.
RESULTS
Voltage-dependent sodium current in bipolar neurons
Previous electrophysiological investigations of goldfish bipolar neurons have focused principally on large-terminal bipolar cells, corresponding to type Mb1 (Sherry and Yazulla, 1993). In the presence of potassium channel blockers, the membrane current of Mb1 bipolar cells in response to depolarizing voltage-clamp pulses consists exclusively of calcium current through L-type calcium channels (Heidelberger and Matthews, 1992; Tachibana et al., 1993). This inward calcium current exhibits little inactivation (von Gersdorff and Matthews, 1996). In the present experiments, we recorded from a variety of bipolar cell subtypes, in addition to Mb1 bipolar cells. We found that a subset of the non-Mb1 bipolar cells, to be identified below, possessed a prominent rapidly inactivating inward current at the onset of a depolarizing voltage clamp pulse, in addition to slowly inactivating inward current attributed to calcium influx (Fig.1A). Figure1B shows that the transient inward current was activated at voltages positive to −50 mV and reached a peak at ∼0 mV.
Fig. 1.

Transient inward current in retinal bipolar neurons. A, Whole-cell membrane current (upper trace) recorded in response to a voltage-clamp pulse from −70 to 0 mV (lower trace). Potassium channels were blocked by internal Cs and TEA. B, Current–voltage relation for the peak inward current in response to voltage-clamp pulses from a holding potential of −70 mV, same cell as A.
To determine whether the transient inward current represents influx of sodium ions through voltage-gated sodium channels, we tested the effect of removing external sodium ions on the response to depolarization. As shown in Figure 2A, replacing external sodium with choline reversibly abolished the early component of inward current on depolarization but had little effect on the sustained current. Similar results were observed in eight bipolar cells. In each case, the residual inward current in the presence of choline was consistent with activation of the sustained calcium current in isolation, which suggests that removal of external sodium eliminated the transient inward current. Thus, the transient current is carried by sodium ions.
Fig. 2.

Transient inward current is carried by TTX-sensitive sodium channels. A, Whole-cell membrane current in response to a voltage-clamp step from −70 to 0 mV, given at the arrow. The thick trace shows the current in normal external solution, the thin traceshows the response during superfusion with solution in which sodium ions were replaced with choline, and the gray traceshows recovery of the current after cessation of 0 Na+ superfusion. B, Whole-cell membrane current in response to a voltage-clamp step from −70 to −15 mV, given at the arrow. The thick traceshows the control response, the thin trace illustrates the response during superfusion with external solution containing 100 nm tetrodotoxin (TTX), and thegray trace shows current recorded 160 sec after removal of TTX.
Next, we tested the sensitivity of the sodium current to TTX, which blocks most types of voltage-sensitive sodium channels. Figure2B shows that local superfusion with external solution containing 100 nm TTX abolished the transient component of inward current, leaving only the sustained calcium current. Similar elimination of the transient current and sparing of the sustained current were observed in 11 cells with 100–1000 nm TTX. The transient component slowly recovered after TTX was removed. We conclude that the transient component of inward current arises from TTX-sensitive, voltage-gated sodium channels that open and then inactivate on depolarization.
The voltage dependence of inactivation of the sodium channels was examined by varying the holding potential. Sample responses are shown in Figure 3A, which illustrates membrane current in response to a voltage step to 0 mV from holding potentials of −40, −50, −70, and −90 mV. Results from several such experiments are summarized in Figure 3B. The voltage dependence of inactivation was well described by a Boltzmann relation, with inactivation being half complete at a holding potential of approximately −60 mV. Figure 3C shows the time course of recovery from inactivation at a holding potential of −70 mV (filled circles). The time course of recovery from inactivation changed only slightly when the holding potential was reduced from −70 to −60 mV during the recovery period (Fig.3C, triangles) or increased to −80 mV (Fig.3C, open circles). Recovery at −70 mV followed a double exponential time course with time constants of 12 and 80 msec. These time constants are similar to those reported for recovery of sodium channels from inactivation in mammalian bipolar cells (6 and 81 msec) (Pan and Hu, 2000).
Fig. 3.
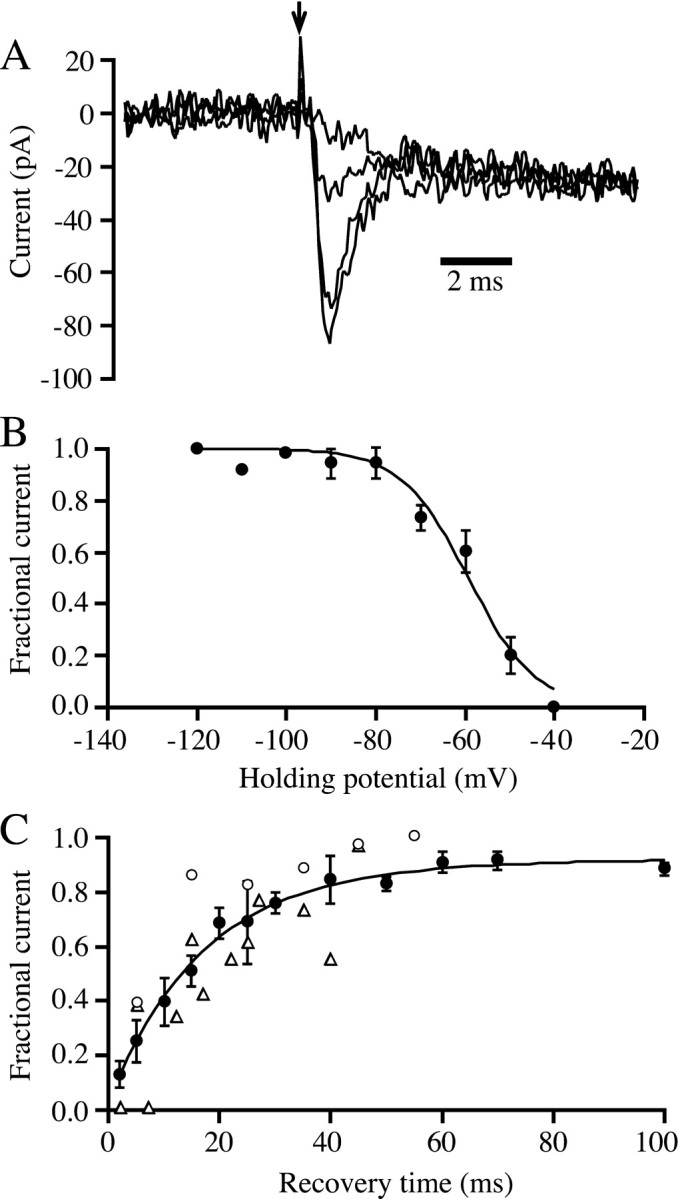
Inactivation of sodium channels. A, Whole-cell membrane currents in response to a voltage-clamp step from various holding potentials to 0 mV. The superimposed traces show responses with holding potentials of −40, −50, −70, and −90 mV. Holding potential was set manually and was maintained for tens of seconds before test pulses were applied. B, Voltage dependence of inactivation of sodium current. To compare results across cells, the peak inward current at each holding potential for each cell was normalized by dividing by the current at a holding potential of −120 mV. Each data point shows the average normalized current from three to five bipolar cells. The solid line was drawn according to a Boltzmann relation: fractional recovery = 1/(1 + exp((V −Vh)/c)), whereVh is the half-inactivating voltage (−59 mV) and c is the voltage change that produces an e-fold change in inactivation (7.5 mV). C, Recovery from inactivation. After inactivation by a 50 msec pulse to 0 mV, voltage was returned to −70 mV for various times, and recovery was tested by a second voltage-clamp step to 0 mV. The curve through the data points represents the best-fitting sum of two exponentials. The shorter time constant was 12 msec (weight = 0.75), and the longer time constant was 80 msec (weight = 0.25). Each data point (filled circles) shows the average from three to six cells. Current for each cell was normalized with respect to the control current before the inactivating prepulse. Thetriangles show results from two cells in which the holding potential during the recovery period was −60 mV, and theopen circles show results from a single cell at a holding potential of −80 mV.
Sodium current density in different morphological types of bipolar neurons
We next examined the morphology of bipolar neurons that had detectable sodium current to determine whether sodium channel expression was associated with an identifiable morphological feature. We found that the density of sodium current was largest in cells with the smallest synaptic terminals, as summarized in Figure4A. Voltage-gated sodium current was observed in 23 of 28 bipolar cells with synaptic terminals <5 μm in diameter and in 12 of 17 cells with intermediate terminals (5–10 μm diameter). In keeping with previous experiments that failed to detect sodium currents in the large-terminal bipolar cells of class Mb1 (Kaneko and Tachibana, 1985; Heidelberger and Matthews, 1992; Fan and Yazulla, 1999), sodium current was rarely observed in bipolar cells with synaptic terminals >10 μm in diameter. Only 1 of 11 cells with large terminals had detectable sodium current, and the peak amplitude of the current in that cell was only 14 pA. By comparison, the average peak current was 58 ± 8 pA in the 23 small-terminal cells that had detectable sodium current. The average current density in large-terminal cells was 0.16 ± 0.16 pA/pF, compared with 6.4 ± 1.3 pA/pF in cells with small terminals (n = 28) and 3.8 ± 0.8 pA/pF in cells with medium terminals (n = 17).
Fig. 4.

Sodium current amplitude as a function of cell morphology. A, Average sodium current density (peak current divided by cell capacitance) for different types of bipolar neurons, which were classified on the basis of diameter of the synaptic terminal. Synaptic terminal diameter is one index of cell type for goldfish bipolar neurons (Sherry and Yazulla, 1993). Error bars indicate the SEM. From the left, 28, 17, and 11 cells were averaged in each class. B, Average sodium current amplitude in bipolar cells lacking an axon (left,Soma only; n = 11), in cells with an axon but without a synaptic terminal (middle,Soma + axon; n = 13), and in cells with both axon and synaptic terminal (right, Soma + axon + terminal; n = 36).
In goldfish retina, bipolar cells with small synaptic terminals represent cone bipolar cells that receive synaptic inputs from cone photoreceptors only, whereas cells with large terminals are mixed bipolar cells that receive synaptic inputs from both rod and cone photoreceptors (Ishida et al., 1980; Sherry and Yazulla, 1993). Therefore, the cells with the highest sodium current density are likely to be cone bipolar cells.
Although the presence of sodium current correlated with the diameter of the synaptic terminal, electrophysiological evidence suggests that the sodium channels are not localized in the synaptic terminal and are instead found in the soma and dendrites of bipolar neurons. In addition to cells with intact synaptic terminals, we also recorded from bipolar cell somata lacking both axons and terminals and from cells with axons but no terminals. As shown in Figure 4B, the average amount of current was constant in cells with and without axons and synaptic terminals. This pattern suggests that the sodium current is localized to the somatic–dendritic region of the cell.
Immunocytochemical localization of sodium channels in bipolar cells
To provide further information about the expression of sodium channels in different types of bipolar neurons, we examined sodium channel immunoreactivity (NaCh-IR) in sections of goldfish retina using a pan-specific antibody that detects all known sodium channels of vertebrate neurons (PanNaCh) (Dugandzija-Novakovic et al., 1995). Figure 5A shows that PanNaCh-IR was prominent in small cell bodies in the inner nuclear layer (INL), where the somata of bipolar cells are found. PanNaCh-IR was also observed in a thin band in the outer plexiform layer (OPL), where the dendrites of bipolar cells are located. Additional PanNaCh-IR was located in a broad band in the inner plexiform layer (IPL), in cell bodies in the ganglion cell layer (GCL), and in bright spots in the proximal retina and optic fiber layer, which likely represent cross-sections of ganglion cell axons. All staining was abolished after preadsorption of the primary antiserum with peptide antigen (Fig.5B), indicating that the pattern in Figure 5A was specific.
Fig. 5.
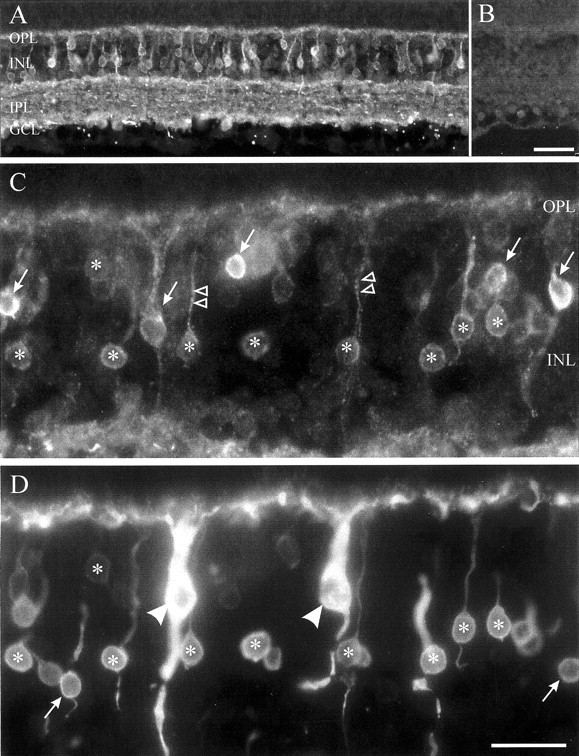
Immunocytochemical distribution of sodium channel immunoreactivity in the goldfish retina. A, Staining using a pan-specific sodium channel antibody was most prominent in small cell bodies in the INL, a thin band in the OPL, a broad band in the IPL, cell bodies in the GCL, and bright spots in the proximal retina and optic fiber layer, which likely represent cross-sections of optic nerve fibers. B, All staining was abolished after overnight preadsorption of the primary antiserum with peptide antigen.C, D, Double-labeling showed that PanNaCh-IR (C) was colocalized with PKC-IR (D; a marker for ON type bipolar cells) in small cell bodies in the INL (asterisks) that had dendrites directed to the OPL (C, double arrowheads). These double-labeled cells were ON type cone bipolar cells. The large PKC-IR mixed rod–cone bipolar cells, type Mb (D, arrowheads), were never PanNaCh-IR. In addition, PanNaCh-IR was found in apparent cone bipolar cells that were not PKC-IR (C, arrows), nor were all PKC-IR cone bipolar cells labeled with PanNaCh-IR (D,arrows). OPL, Outer plexiform layer;INL, inner nuclear layer; IPL, inner plexiform layer; GCL, ganglion cell layer. Scale bars, 25 μm.
The position and shape of the cell bodies of the PanNaCh-positive cells in the INL were suggestive of cone bipolar cells rather than mixed bipolar cells (Fig. 5A,C) (Sherry and Yazulla, 1993). The prominent staining in the cell bodies and in processes ascending into the OPL is consistent with sodium channel localization in the somata and dendrites of a subset of bipolar cells. Two examples of PanNaCh-IR in ascending dendrites are indicated bydouble arrowheads in Figure 5C. More rarely, PanNaCh-IR was also observed in processes descending to the IPL, which may represent bipolar cell axons. Thus, PanNaCh-IR is concentrated at the cell body and dendrites. This pattern is in accord with the results of electrophysiological experiments (Fig. 4), which also suggest that sodium channels are found in the somata and dendrites of cone bipolar cells.
Bipolar cells in vertebrate retinae are of ON and OFF types. In goldfish, both types consist of mixed rod–cone and pure cone bipolar cells. Antisera against protein kinase C (PKC) specifically stain all ON bipolar cells in teleost fish retina, including both mixed rod–cone and cone types, leaving OFF bipolar cells unstained (Suzuki and Kaneko, 1990). Therefore, to examine the distribution of sodium channels in ON and OFF bipolar cells, we used double labeling with PanNaCh-IR and PKC-IR (Fig. 5C,D), which served as a marker of ON bipolar cells. PKC-IR and PanNaCh-IR only partially overlapped in goldfish bipolar cells. Less than half (92 of 225; 41%) of all PanNaCh-IR bipolar cells were PKC-IR, which demonstrates that sodium channels are expressed in both ON (PKC-positive) and OFF (PKC-negative) bipolar cells. Among PKC-IR cone bipolar cells, 53% (92 of 174) were also positive for PanNaCh-IR (Fig. 5C,D,asterisks). PKC-IR mixed bipolar cells (Fig. 5D,arrowheads) were not PanNaCh-IR. Thus, among ON bipolar cells, sodium channel immunoreactivity was restricted to a subset comprising about half of the population of ON-type cone bipolar cells.
We have no other way to independently label OFF cone bipolar cells and thus to determine the fraction of OFF cone bipolar cells that express sodium channels. However, if we presume that there are approximately equal numbers of ON and OFF cone bipolar cells, we expect that the total number of OFF cone bipolar cells in our sampled region of retina should be ∼174, which is the number of ON (i.e., PKC-positive) cone bipolar cells. The actual number of PanNaCh-IR OFF cone bipolar cells in our sample was 133, which was estimated by subtracting the number of Pan–PKC double-labeled cells (92) from the total number of PanNaCh-IR cells (225). Thus, we suggest that sodium channels are expressed in nearly all OFF cone bipolar cells, but in only 50% of ON cone bipolar cells.
PanNaCh-IR was conspicuously absent from the large-terminal ON bipolar cells, which are brightly labeled with PKC-IR (Fig. 5D,arrowheads). Thus, the immunocytochemical pattern of sodium channel expression is consistent with the electrophysiological experiments, which demonstrated that large-terminal bipolar cells had negligible sodium current (Fig. 4A). It appears, then, that sodium channels are restricted to cone bipolar cells in which the channels are concentrated at the cell body and dendrites.
Molecular characterization of sodium channels in bipolar neurons
As a further test of the expression of voltage-gated sodium channels in bipolar cells, we examined whether sodium channel transcripts could be detected in single bipolar neurons using RT-PCR. Because sodium channel isoforms have not been characterized in goldfish, it was first necessary to establish which sodium channel subtypes are represented in mRNA extracted from goldfish retina. To provide this information, degenerate PCR primers were designed that are expected to amplify cDNA for all known vertebrate neuronal sodium channels. After RT-PCR, cDNAs of the expected size were gel isolated, subcloned, and sequenced. Nine of 30 sequenced clones had high homology with known sodium channel α subunits in database searches. Three distinct sodium channel subtypes were identified, and their predicted amino acid sequences are illustrated in Figure6A. The amino acid sequences of two of the subtypes, which we named gfNav1.2 and gfNav1.3, were 85% identical to each other, whereas the third subtype was 75–76% identical to the other two. gfNav1.2 is 77% identical to rat Nav1.2 and 79% identical to rat Nav1.3, whereas gfNav1.3 is 78 and 79% identical to rat Nav1.2 and Nav1.3, respectively. Thus, these two subtypes may represent the goldfish equivalents of Nav1.2 and Nav1.3. Because both predicted sequences were approximately equally similar to rat Nav1.2 and Nav1.3 in the cloned region, we assigned the names gfNav1.2 and gfNav1.3 arbitrarily to these two cDNAs.
Fig. 6.

Molecular identification of sodium channels in goldfish retina and in bipolar neurons. A, Predicted amino acid sequences for sodium channel α subunits identified by RT-PCR from mRNA extracted from goldfish retina. Thedots indicate residues at which all three α subunits are identical. Regions in which two or more residues are identical are shaded gray. Gaps are indicated bydashes. The asterisk indicates the location of an insertion representing a putative splice variant of gfNav1.2. The predicted amino acid sequence of the insertion is shown below. B, Agarose gel electrophoresis of sodium channel cDNAs obtained by RT-PCR from single bipolar neurons. Each numbered lane shows the result from a single cell. The molecular weight markers correspond to 300, 400, 500, 650, 850, and 1000 bp. The predicted size of the amplified cDNA for sodium channels is 530–550 bp. Lanes 3 and 11 show control cells in which the reverse transcriptase enzyme was omitted. In the remaining lanes, cDNA of the predicted size was detected in 5 of 10 bipolar cells.
Two forms of gfNav1.2 were encountered in cDNAs obtained from retinal mRNA, differing by the insertion of nucleotides coding for nine amino acid residues at the position indicated by theasterisk in Figure 6A. Splice variants are known to occur in other sodium channel α subunits (Schaller et al., 1992; Lu and Brown, 1998; Oh and Waxman, 1998). Thus, the observed variation in gfNav1.2 is likely the result of alternative splicing.
The amino acid sequence of the third sodium channel subtype obtained from retinal mRNA is 93% identical to the corresponding region of zebrafish Nav1.6 (accession number AAG18440) and 87% identical to rat Nav1.6 (accession numberAAC42059) (Schaller et al., 1995). Therefore, this subtype is likely to be the product of the equivalent gene in goldfish. Hence, we named the third subtype gfNav1.6. Nav1.2, Nav1.3, and Nav1.6 are known to be expressed at high levels in the CNS (Goldin, 2001). Therefore, the presence of the equivalent transcripts in goldfish retina is not surprising.
Armed with sequence information for the three sodium channel isoforms expressed in goldfish retina, we designed nested PCR primers suitable for a second round of amplification of sodium channel cDNAs in single-cell RT-PCR. The first-round primers for the single-cell studies were the degenerate primers used to characterize sodium channel messages in whole retinal mRNA. PCR products of the expected size were observed in 18 of 42 isolated bipolar cells, as illustrated by the examples shown in Figure 6B. By contrast, no cDNA was observed in 12 control cells in which the reverse transcriptase reaction was omitted (Fig. 6B). Similarly, no PCR products were observed in other control experiments in which the PCR reactions were performed without adding reverse transcribed cDNA in the first round of amplification.
Although the amount of contaminating genomic DNA from a single cell is expected to be negligible, we also tested the nested pairs of primers that were used in the single-cell experiments to determine whether they would produce amplified cDNA from goldfish genomic DNA. Under conditions that mimicked the single-cell RT-PCR conditions, no detectable cDNA of the correct size was observed from genomic DNA unless mRNA was also added before the reverse transcriptase reaction. Thus, we concluded that the cDNA detected from single bipolar neurons represents bona fide, reverse-transcribed mRNA transcripts and not contamination from amplification of genomic DNA.
The putative sodium-channel cDNAs obtained from single cells were subcloned and sequenced to confirm their identity as sodium channel α subunits and to determine which subtypes were present in bipolar cells. Of the 18 positive cells, 14 yielded sequences matching known sodium channel α subunits. All three of the sodium channel isoforms identified in retinal mRNA were observed in bipolar cells. gfNav1.6 was observed in three cells, whereas gfNav1.2 was found in seven cells (three having the long form and four the short form of gfNav1.2). gfNav1.3 was found in one cell. In addition, in three positive cells, sequencing revealed a fourth sodium-channel isoform that was not identified previously in the experiments on mRNA from intact retina. This fourth isoform was similar to gfNav1.2 and gfNav1.3, and so it likely represents the third member of the related trio of Nav1.1, Nav1.2, and Nav1.3 sodium channels found in mammalian brain. Thus, a variety of different sodium channel subtypes are apparently expressed in retinal bipolar neurons. When expressed heterologously, functional differences among the equivalent mammalian channel isoforms (Nav1.1, Nav1.2, Nav1.3, and Nav1.6) are subtle, especially in the presence of β subunits, and all four produce similar sodium currents that are sensitive to TTX (Goldin, 2001). By analogy with the mammalian channels, any of the isoforms identified in goldfish bipolar cells could in principle account for the physiologically observed sodium current.
DISCUSSION
Types of bipolar cells that express sodium channels
Molecular biological, immunocytochemical, and electrophysiological experiments demonstrate the presence of voltage-sensitive sodium channels in certain types of bipolar neurons from goldfish retina. Density of sodium current was largest in cells with small synaptic terminals (≤5 μm diameter) and negligible in cells with very large terminals (≥10 μm diameter). At least 15 morphological classes of bipolar cells have been identified in goldfish retina (Sherry and Yazulla, 1993). Bipolar cells with the largest terminals are mixed-input cells that receive synaptic inputs from both rod and cone photoreceptors (Ishida et al., 1980), whereas cells with small terminals represent various types of cone bipolar cells that receive inputs from cones only (Sherry and Yazulla, 1993). Thus, the bipolar cells that express the highest levels of voltage-dependent sodium channels are likely to be cone bipolar cells. Immunocytochemistry with a pan-specific antibody against vertebrate neuronal sodium channels directly demonstrated sodium channel immunoreactivity in cone bipolar cells. This pattern of sodium channel expression is consistent with results from mammalian retina in which sodium currents were observed in a subset of cone bipolar cells but not in rod bipolar cells (Pan and Hu, 2000).
By contrast, the large-terminal, mixed bipolar cells lack sodium channels, as demonstrated both electrophysiologically and immunocytochemically. Large-terminal bipolar cells in goldfish retina have short, thick dendrites (Ishida et al., 1980; Saito and Kujiraoka, 1982) (Fig. 5) that are well suited for passive propagation of synaptic signals without requiring amplification by voltage-dependent sodium channels. Cone bipolar cells, on the other hand, often possess long, thin dendrites (Saito and Kujiraoka, 1982; Sherry and Yazulla, 1993) (also see Fig. 5), and electrical signals propagating toward the cell body may be substantially attenuated in these thin processes. Thus, differences in dendritic structure may explain in part why sodium channels are expressed selectively in small-terminal bipolar cells.
Do sodium channels play a functional role in retinal bipolar cells?
We found that the average amount of sodium current was similar in cells with and without axons and terminals, suggesting that the channels are localized primarily in the soma and/or dendrites. Sodium channel immunoreactivity was also observed primarily in bipolar cell somata and dendrites. This pattern is consistent with a role for sodium channels in the propagation of synaptic signals in the somatodendritic compartment, as has been suggested in other cell types (Stuart and Sakmann, 1995; Lipowsky et al., 1996; Andreasen and Lambert, 1999), including retinal amacrine cells in goldfish (Watanabe et al., 2000). The low density of the channels and their strong inactivation at membrane potentials thought to occur in bipolar cells (−45 to −60 mV for ON cells) (Lasansky, 1992; Zenisek and Matthews, 1998; Protti et al., 2000) suggest that the sodium channels are unlikely to support action potentials in bipolar cells, especially under physiological conditions. Nevertheless, subthreshold potentiation of depolarizing responses might still occur. Potentiation of synaptic responses might be particularly effective if the channels are located preferentially in the dendrites, so that their density is higher than that estimated by dividing peak current by total cell capacitance (Fig.4A).
Sodium channel immunoreactivity was observed in both ON and OFF bipolar cells. ON cells depolarize in response to illumination, and sodium channels might then be expected to boost synaptic responses to light onset in a manner similar to that described in the depolarizing photoreceptors of honeybee (Coles and Schneider-Picard, 1989). OFF bipolar cells, on the other hand, hyperpolarize in response to illumination. A hyperpolarizing light response might allow recovery of sodium channels from inactivation and set the stage for potentiation of the depolarizing rebound of membrane potential at light offset in OFF bipolar cells. In both cell types, the contribution of sodium channels to a depolarizing response would likely depend strongly on the degree of preceding hyperpolarization, which would act to remove resting inactivation. Bipolar neurons possess calcium-activated potassium channels (Sakaba et al., 1997) that contribute to a hyperpolarizing rebound at the offset of depolarization (Protti et al., 2000). The membrane potential can reach −60 to −70 mV during this rebound period (Zenisek and Matthews, 1998; Protti et al., 2000), which is sufficiently negative to rapidly remove sodium channel inactivation (Fig. 3C).
The small amount of sodium current typically observed in bipolar cells raises the possibility that the channel expression may represent basal levels of sodium channel expression without true functional significance. In neurons that do not make sodium spikes, such as bipolar cells, transcription of sodium channel genes may not be completely inhibited, allowing a small amount of channel protein to reach the membrane although the channels play no role in electrical signaling. Although this interpretation cannot be ruled out, the fact that different morphological cell types expressed different levels of current (Fig. 4A) argues against nonspecific basal expression. The density of channels was highest in cells with small synaptic terminals, possibly representing cone bipolar cells, and very low in cells with the largest terminals. The essentially zero level of sodium current in large-terminal cells demonstrates that sodium channel expression can in principle be reduced to undetectable levels. The specificity of sodium channel expression in small-terminal cells suggests that sodium channels may indeed serve a functional role in particular classes of bipolar neurons.
Molecular identity of sodium channels expressed in goldfish bipolar cells
Several different α subunits of voltage-dependent sodium channels are expressed in mammalian retina (Fjell et al., 1997), including Nav1.1, Nav1.2, Nav1.3, and Nav1.6. We observed a similar diversity of sodium channel expression in goldfish retina, and transcripts putatively corresponding to Nav1.6, Nav1.2, and Nav1.3 were identified in experiments using RT-PCR of whole-retinal mRNA. The goldfish Nav1.2 and Nav1.3 sequences were approximately equally similar to both rat equivalents, and so it is unclear which of the two goldfish sequences actually corresponds to Nav1.2 and which corresponds to Nav1.3. An alternative possibility is that gfNav1.2 and gfNav1.3 actually represent duplicate forms of the same sodium channel gene, which may have arisen during the genome duplication thought to have occurred in teleosts after the evolutionary divergence of teleost and mammalian lineages (Woods et al., 2000). By contrast, the identification of the goldfish equivalent of Nav1.6 is relatively firm, based on similarity to rat Nav1.6 and to the zebrafish equivalent of Nav1.6 (accession number AAG18440).
Using in situ hybridization, Fjell et al. (1997) found evidence that multiple sodium channel isoforms are expressed in mammalian retinal ganglion cells. In our experiments, single-cell RT-PCR revealed a similar diversity of sodium channel types expressed in retinal bipolar neurons. Four different sodium channel α subunits were found, including all three α subunits identified in the retina. The fourth sodium channel type found in bipolar cells was not observed in analysis of retinal mRNA. This channel probably corresponds to the third member of the related mammalian sodium channels Nav1.1, Nav1.2, and Nav1.3. It is likely that we did not detect this fourth sodium channel α subunit in experiments on whole retina because the transcript is relatively rare and the number of sodium channel clones we sequenced was relatively small. All four of the mammalian channels that correspond to the types detected in goldfish bipolar cells produce rapidly inactivating currents with similar voltage dependence, and all four are sensitive to tetrodotoxin, as was the sodium current in bipolar cells. Thus, any or all of the molecularly identified channel types could account for the observed sodium current in bipolar cells.
Sodium channels in retinal bipolar neurons offer a new mechanism for modulating signal transmission from the photoreceptor cells of the outer retina to the amacrine and ganglion cells of the inner retina. The channels may increase the amplitude and/or speed of depolarizing synaptic responses within the dendrites and soma of bipolar cells, thus enhancing the fidelity of transmission through nonspiking bipolar cells.
Footnotes
This work was supported by National Institutes of Health Grants EY01682 (S.Y.) and EY03821 (G.M.). We thank Dr. Gail Mandel (Department of Neurobiology, SUNY, Stony Brook, NY) for advice in molecular biology and for sharing her laboratory facilities. Pan-specific sodium channel antibody was kindly provided by Dr. S. Rock Levinson (Department of Physiology, University of Colorado Health Sciences Center, Denver, CO).
Correspondence should be addressed to Dr. Gary G. Matthews, Department of Neurobiology and Behavior, Life Sciences Building, Room 550, SUNY, Stony Brook, NY 11794-5230. E-mail: Gary.G.Matthews@sunysb.edu
Dr. Zenisek's present address: Vollum Institute, Oregon Health Sciences University, 3181 SW Sam Jackson Park Road, Portland, OR 97201.
REFERENCES
- 1.Andreasen M, Lambert JD. Somatic amplification of distally generated subthreshold EPSPs in rat hippocampal pyramidal neurones. J Physiol (Lond) 1999;519:85–100. doi: 10.1111/j.1469-7793.1999.0085o.x. [DOI] [PMC free article] [PubMed] [Google Scholar]
- 2.Cathala G, Savouret JF, Mendez B, West BL, Karin M, Martial JA, Baxter JD. A method for isolation of intact, translationally active ribonucleic acid. DNA. 1983;2:329–335. doi: 10.1089/dna.1983.2.329. [DOI] [PubMed] [Google Scholar]
- 3.Coles JA, Schneider-Picard G. Amplification of small signals by voltage-gated sodium channels in drone photoreceptors. J Comp Physiol [A] 1989;165:109–118. doi: 10.1007/BF00613804. [DOI] [PubMed] [Google Scholar]
- 4.Dugandzija-Novakovic S, Koszowski AG, Levinson SR, Shrager P. Clustering of Na channels and node of Ranvier formation in remyelinating axons. J Neurosci. 1995;15:492–502. doi: 10.1523/JNEUROSCI.15-01-00492.1995. [DOI] [PMC free article] [PubMed] [Google Scholar]
- 5.Fan SF, Yazulla S. Suppression of voltage-dependent K+ currents in retinal bipolar cells by ascorbate. Vis Neurosci. 1999;16:141–148. doi: 10.1017/s0952523899161091. [DOI] [PubMed] [Google Scholar]
- 6.Fjell J, Dib-Hajj S, Fried K, Black JA, Waxman SG. Differential expression of sodium channel genes in retinal ganglion cells. Brain Res Mol Brain Res. 1997;50:197–204. doi: 10.1016/s0169-328x(97)00187-3. [DOI] [PubMed] [Google Scholar]
- 7.Goldin A. Resurgence of sodium channel research. Annu Rev Physiol. 2001;63:871–894. doi: 10.1146/annurev.physiol.63.1.871. [DOI] [PubMed] [Google Scholar]
- 8.Heidelberger R, Matthews G. Calcium influx and calcium current in single synaptic terminals of goldfish retinal bipolar neurons. J Physiol (Lond) 1992;447:235–256. doi: 10.1113/jphysiol.1992.sp019000. [DOI] [PMC free article] [PubMed] [Google Scholar]
- 9.Ishida AT, Stell WK, Lightfoot DO. Rod and cone inputs to bipolar cells in goldfish retina. J Comp Neurol. 1980;191:315–335. doi: 10.1002/cne.901910302. [DOI] [PubMed] [Google Scholar]
- 10.Kaneko A, Tachibana M. A voltage-clamp analysis of membrane currents in solitary bipolar cells dissociated from Carassius auratus. J Physiol (Lond) 1985;358:131–152. doi: 10.1113/jphysiol.1985.sp015544. [DOI] [PMC free article] [PubMed] [Google Scholar]
- 11.Lasansky A. Properties of depolarizing bipolar cell responses to central illumination in salamander retinal slices. Brain Res. 1992;576:181–196. doi: 10.1016/0006-8993(92)90679-4. [DOI] [PubMed] [Google Scholar]
- 12.Lipowsky R, Gillessen T, Alzheimer C. Dendritic Na+ channels amplify EPSPs in hippocampal CA1 pyramidal cells. J Neurophysiol. 1996;76:2181–2191. doi: 10.1152/jn.1996.76.4.2181. [DOI] [PubMed] [Google Scholar]
- 13.Lu CM, Brown GB. Isolation of a human-brain sodium-channel gene encoding two isoforms of the subtype III alpha-subunit. J Mol Neurosci. 1998;10:67–70. doi: 10.1007/BF02737087. [DOI] [PubMed] [Google Scholar]
- 14.Oh Y, Waxman SG. Novel splice variants of the voltage-sensitive sodium channel alpha subunit. NeuroReport. 1998;11:1267–1272. doi: 10.1097/00001756-199805110-00002. [DOI] [PubMed] [Google Scholar]
- 15.Pan ZH, Hu HJ. Voltage-dependent Na+ currents in mammalian retinal cone bipolar cells. J Neurophysiol. 2000;84:2564–2571. doi: 10.1152/jn.2000.84.5.2564. [DOI] [PubMed] [Google Scholar]
- 16.Protti DA, Flores-Herr N, von Gersdorff H. Light evokes Ca2+ spikes in the axon terminal of a retinal bipolar cell. Neuron. 2000;25:215–227. doi: 10.1016/s0896-6273(00)80884-3. [DOI] [PubMed] [Google Scholar]
- 17.Saito T, Kujiraoka T. Physiological and morphological identification of two types of on-center bipolar cells in the carp retina. J Comp Neurol. 1982;205:161–170. doi: 10.1002/cne.902050207. [DOI] [PubMed] [Google Scholar]
- 18.Sakaba T, Ishikane H, Tachibana M. Ca2+-activated K+ current at presynaptic terminals of goldfish retinal bipolar cells. Neurosci Res. 1997;27:219–228. doi: 10.1016/s0168-0102(97)01155-3. [DOI] [PubMed] [Google Scholar]
- 19.Schaller KL, Krzemien DM, McKenna NM, Caldwell JH. Alternatively spliced sodium channel transcripts in brain and muscle. J Neurosci. 1992;12:1370–1381. doi: 10.1523/JNEUROSCI.12-04-01370.1992. [DOI] [PMC free article] [PubMed] [Google Scholar]
- 20.Schaller KL, Krzemien DM, Yarowsky PJ, Krueger BK, Caldwell JH. A novel, abundant sodium channel expressed in neurons and glia. J Neurosci. 1995;15:3231–3242. doi: 10.1523/JNEUROSCI.15-05-03231.1995. [DOI] [PMC free article] [PubMed] [Google Scholar]
- 21.Sherry DM, Yazulla S. Goldfish bipolar cells and axon terminal patterns: a Golgi study. J Comp Neurol. 1993;329:188–200. doi: 10.1002/cne.903290204. [DOI] [PubMed] [Google Scholar]
- 22.Stuart G, Sakmann B. Amplification of EPSPs by axosomatic sodium channels in neocortical pyramidal neurons. Neuron. 1995;15:1065–1076. doi: 10.1016/0896-6273(95)90095-0. [DOI] [PubMed] [Google Scholar]
- 23.Suzuki S, Kaneko A. Identification of bipolar cell subtypes by protein kinase C-like immunoreactivity in the goldfish retina. Vis Neurosci. 1990;5:223–230. doi: 10.1017/s0952523800000298. [DOI] [PubMed] [Google Scholar]
- 24.Tachibana M, Okada T, Arimura T, Kobayashi K, Piccolino M. Dihydropyridine-sensitive calcium current mediates neurotransmitter release from bipolar cells of the goldfish retina. J Neurosci. 1993;13:2898–2909. doi: 10.1523/JNEUROSCI.13-07-02898.1993. [DOI] [PMC free article] [PubMed] [Google Scholar]
- 25.Taylor GC, Coles JA, Eilbeck JC. Conditions under which Na+ channels can boost conduction of small graded potentials. J Theor Biol. 1995;172:379–386. doi: 10.1006/jtbi.1995.0035. [DOI] [PubMed] [Google Scholar]
- 26.von Gersdorff H, Matthews G. Calcium-dependent inactivation of calcium current in synaptic terminals of retinal bipolar neurons. J Neurosci. 1996;16:115–122. doi: 10.1523/JNEUROSCI.16-01-00115.1996. [DOI] [PMC free article] [PubMed] [Google Scholar]
- 27.Watanabe S, Satoh H, Koizumi A, Takayanagi T, Kaneko A. Tetrodotoxin-sensitive persistent current boosts the depolarization of retinal amacrine cells in goldfish. Neurosci Lett. 2000;278:97–100. doi: 10.1016/s0304-3940(99)00903-9. [DOI] [PubMed] [Google Scholar]
- 28.Woods IG, Kelly PD, Chu F, Ngo-Hazelett P, Yan YL, Huang H, Postlethwait JH, Talbot WS. A comparative map of the zebrafish genome. Genome Res. 2000;10:1903–1914. doi: 10.1101/gr.10.12.1903. [DOI] [PMC free article] [PubMed] [Google Scholar]
- 29.Zenisek D, Matthews G. Calcium action potentials in retinal bipolar neurons. Vis Neurosci. 1998;15:69–75. doi: 10.1017/s0952523898151064. [DOI] [PubMed] [Google Scholar]