

Abstract
Cone pedicles, the output synapses of cone photoreceptors, transfer the light signal onto the dendrites of bipolar and horizontal cells. Cone pedicles contain between 20 and 45 ribbon synapses (triads) which are the release sites for glutamate, the cone transmitter. Several hundred postsynaptic dendrites contact individual cone pedicles, and we studied the glutamate receptors expressed and clustered at these contacts, particularly the AMPA receptor subunits.
Using immunocytochemistry and confocal imaging we were able to resolve individual triads within the cone pedicles by light microscopy. We studied their differences in L/M- and S-cones, and we counted the number of triads per pedicle across the retina. The presynaptic matrix protein bassoon, the synapse-associated membrane protein P84, and peanut agglutinin were used to specifically label synaptic ribbons, invaginating dendrites of horizontal cells and invaginating dendrites of ON-cone bipolar cells, respectively.
Pre- and post-embedding immunocytochemistry and electron microscopy were used to localize the AMPA receptor subunits at the cone pedicle base. They were aggregated at three different postsynaptic sites: at horizontal cell invaginating contacts, at bipolar cell flat contacts, and at desmosome-like junctions underneath the cone pedicles.
We also performed double-labeling experiments with the triad-specific markers and the antibodies against the AMPA receptor subunits. AMPA receptors were preferentially expressed by horizontal cells, and to a lesser extent by OFF-cone bipolar cells. We did not observe any cone-selective expression of AMPA receptor subunits postsynaptic to L/M- or S-cones, suggesting AMPA receptors are not the key to understanding trichromatic signaling in the primate retina.
Keywords: primate retina, cone pedicle, AMPA receptors, horizontal cells, bipolar cells, ribbon synapses
The cone pedicle provides multiple output synapses for the transfer of the light signal from the cones onto the bipolar and horizontal cells. Cone pedicles of the macaque monkey retina are 6–10 μm in diameter and accommodate, depending on the retinal location, up to 45 invaginating synapses (Missotten, 1965;Dowling and Boycott, 1966; Calkins et al., 1996; Chun et al., 1996). The invaginating synapses contain a presynaptic ribbon, two horizontal cell dendrites as lateral elements, and one or two bipolar cell dendrites as central elements. This arrangement is called triad. Bipolar cells also make flat contacts (basal junctions) with the cone pedicle base (Dowling and Boycott, 1966). Depending on their relative distance from the triads, flat contacts have been classified as triad-associated (TA) and nontriad-associated (NTA; Boycott and Hopkins, 1993; Hopkins and Boycott, 1997). Altogether, several hundred densely packed synaptic contacts cover the cone pedicle base (Missotten, 1965; Chun et al., 1996). Underneath the cone pedicle, at so called desmosome-like junctions, horizontal cell dendrites provide an additional layer of postsynaptic specializations (Haverkamp et al., 2000).
The cone transmitter is glutamate (Massey, 1990; Kalloniatis and Tomisich, 1999; Thoreson and Witkovsky, 1999), which is released at the ribbons that position the vesicles to the region of exocytosis (Rao-Mirotznik et al., 1995). From the release sites, glutamate has to diffuse for quite some distance to exert its effect at the three postsynaptic structures mentioned above: the invaginating and flat contacts and the desmosome-like junctions (Haverkamp et al., 2000).
Molecular cloning has revealed two major groups of glutamate receptors: ionotropic receptors and metabotropic receptors. Metabotropic receptors activate a second messenger signal cascade via a G-protein (Pin and Duvoisin, 1995).
Ionotropic receptors are integral membrane proteins, and the binding of glutamate results in the opening of nonselective cation channels (Dingledine et al., 1999). Ionotropic receptors are subdivided into AMPA receptors, kainate receptors, and NMDA receptors. In the present study we will concentrate on AMPA receptors and their expression in the outer plexiform layer (OPL) of the primate retina. AMPA receptors are tetrameric or pentameric ion channel complexes assembled from two or more of the four related glutamate receptor subunits GluR1, GluR2, GluR3, and GluR4.
The expression of AMPA receptors in the OPL has been studied in a variety of species by light and electron microscopic immunocytochemistry using subunit-specific antibodies. Invaginating horizontal cell processes, bipolar cell dendrites at basal junctions, and desmosome-like junctions were found to be labeled (Schultz et al., 1997; Vardi et al., 1998; Morigiwa and Vardi, 1999; Qin and Pourcho, 1999; Yazulla and Studholme, 1999; Gründer et al., 2000;Haverkamp et al., 2000). However, contrary to expectation, AMPA receptor labeling was also observed at invaginating bipolar cell dendrites (Vardi et al., 1998; Morigiwa and Vardi, 1999) and at bipolar cells making flat (Hack et al., 1999) and invaginating (Morigiwa and Vardi, 1999) contacts with rod spherules.
In the present study we first analyzed, with specific immunocytochemical markers and confocal light microscopy (LM), the number and distribution of ribbon synapses of individual cone pedicles. Antibodies against the cytomatrix protein bassoon (Brandstätter et al., 1999) were used to label the synaptic ribbons, antibodies against the synapse-associated membrane protein P84 (Mi et al., 2000) were applied to label the lateral elements of the triads, and peanut agglutinin was found to bind to the central elements of the triads. In the second part of this study we examined the expression of GluR1, GluR2, GluR2/3, and GluR4 at the cone pedicle using immunofluorescence and confocal microscopy. In the third part of this study we applied both pre- and post-embedding immunocytochemistry and electron microscopy (EM) to precisely localize the AMPA receptors at cone pedicles.
MATERIALS AND METHODS
Animals and tissue preparation. The retinas studied were from adult macaque monkeys, Macaca fascicularis, that were killed after electrophysiological experiments unrelated to those described here. All procedures were approved by the local animal care committee and were in accordance with the law for animal experiments issued by the German Government (Tierschutzgesetz). The animals were given a lethal dose of pentobarbitone, and the eyes were quickly removed. The posterior eyecup was immersion-fixed in 2 or 4% paraformaldehyde in 0.1 m phosphate buffer (PB), pH 7.4, for 10, 20, or 30 min. After fixation, the retinas were dissected from the eyecup and cryoprotected in graded sucrose solutions (10, 20, 30%). Retinal pieces were sectioned either vertically at 14 μm or horizontally at 40 μm using a cryostat.
For EM it was necessary to make a compromise between the preservation of the tissue and the protection of the antigenicity. The antisera used were very fixation-sensitive, and to maximize immunoreactivity, the tissue received only minimal fixation (2% paraformaldehyde, 30 min). After cryoprotection, the tissue was frozen and thawed several times, and vertical sections (60 μm) were cut using a vibratome, for pre-embedding immuno-EM. In the case of post-embedding immuno-EM, fixation in 4% paraformaldehyde for 30 min was found to result in good immunostaining.
Antisera. Antibodies against different glutamate receptor subunits were purchased from Chemicon (Temecula, CA) (rabbit anti-glutamate receptor 1, catalog #AB1504; rabbit anti-glutamate receptor 2, catalog #AB 1768; rabbit anti-glutamate receptor 2/3, catalog #AB 1506; and rabbit anti-glutamate receptor 4, catalog #AB 1508). A mouse anti-glutamate receptor 2 (clone 6C4, catalog #60671A) was purchased from PharMingen (San Diego, CA). The mouse monoclonal antibody against bassoon was purchased from StressGen Biotechnologies (Victoria, British Columbia, Canada). The mouse monoclonal antibody against Goα was obtained from Chemicon. The mouse monoclonal and rabbit polyclonal antibodies against P84 were kindly provided by Dr. C. Lagenaur (University of Pittsburgh, Pittsburgh, PA). The rabbit polyclonal antibody against the S-cone opsin was a kind gift of Dr. J. Nathans (Johns Hopkins University, Baltimore, MD).
Light microscopic immunocytochemistry. The antisera were diluted as follows: GluR1, 1:50; GluR2, GluR2/3, and GluR4, 1:100; bassoon, 1:5000; Goα, 1:500; S-cone opsin, 1:5000; P84 monoclonal, 1:5 and P84 polyclonal, 1:500, in PBS, pH 7.4, containing 3% normal goat serum (NGS), 1% bovine serum albumin (BSA), and 0.5% Triton X-100. Immunocytochemical labeling was performed using the indirect fluorescence method. After preincubation in PBS containing 10% NGS, 1% BSA, and 0.5% Triton X-100, the sections were incubated overnight in the primary antibodies followed by incubation (1 hr) in the secondary antibodies, which were conjugated either to Alexa TM 594 (red fluorescence) or Alexa TM 488 (green fluorescence) (Molecular Probes, Eugene, OR). Fluorescein peanut agglutinin (Vector Laboratories, Burlingame, CA) was used at a concentration of 0.5 mg/ml, and cryostat sections were incubated for 1 hr.
In double-labeling experiments, sections were incubated in a mixture of primary antibodies followed by a mixture of secondary antibodies.
Fluorescent specimens were viewed using a Zeiss Axiophot microscope equipped with a fluorescent filter set that was wedge-corrected, i.e., shifting from one filter to the other filter did not introduce spatial displacements. For the high-power fluorescence micrographs, a Plan-Neofluar 100×/1.3 objective was used. Black and white, 12 bit, digital images were taken with a cooled CCD camera (Spot 2; Diagnostic Instruments, Sterling Heights, MI). Using the Metaview Software (Universal Imaging, West Chester, PA) images taken with the red and the green fluorescence filters were pseudocolored and superimposed (see Figs. 4A–C, 5A–C, 6, 10D–F). Confocal micrographs were taken using a Zeiss LSM5 Pascal laser-scanning microscope and a Plan-Apochromat 63×/1.4 objective. High-resolution scanning was performed with 1024 × 1024 or 2048 × 2048 pixels. Single optical sections are shown in Figures 5D–F, 7A–D, and10A–C. Serial sections were also taken (z-axis step size, 0.48, 0.64, or 0.8 μm), and the stacks were subsequently collapsed into a single plane (see Figs.1D–G, four sections of 0.8 μm; 2A,B, eight sections of 0.48 μm; and 4D–F, three sections of 0.48 μm). The brightness and the contrast of the final images were adjusted using Adobe Photoshop 5.0.1.
Fig. 4.

Cone pedicles of the macaque monkey retina that were double-labeled for bassoon (red) and the synapse-associated protein P84 (green).A, Fluorescence micrograph of a vertical section through one cone pedicle and several rod spherules (arrowheads) immunostained for bassoon. B, Same section as inA, immunostained for P84. C, Superposition of A and B shows that bassoon and P84 are closely associated but not in precise register.D, Confocal, composed horizontal section through two cone pedicles and several rod spherules (arrowheads) that were immunolabeled for bassoon. E, Confocal horizontal section through the same pedicles as in D, immunostained for P84. F, Superposition ofD and E shows that the P84-labeled clusters (arrows) form the two lateral elements flanking the ribbons. Scale bar, 5 μm.
Fig. 5.

A–C, Cone pedicles of the macaque monkey retina that were double-labeled for bassoon (red) and for PNA (green). A, Composed fluorescence micrograph of a horizontal section that was immunostained for bassoon. Two cone pedicles and several rod spherules are labeled.B, The same two cone pedicles as in A but labeled with PNA. Comparison of A and Bshows that there is a close correspondence between the labeled structures. C, Superposition of A andB shows that every ribbon from A is associated with a green-labeled structure from B. Some of the green-labeled structures (encircled B) appear to bridge two ribbons. D–F, Confocal micrographs of a vertical section through the outer plexiform layer of a macaque monkey retina that was double-labeled for the G-protein Goα (red) and for PNA (green).D, Confocal micrograph of the invaginating dendrites of ON cone bipolar (arrows) and rod bipolar cells.E, Same section as in D, showing the PNA labeling of two cone pedicles. F, Superposition ofD and E shows that PNA decorates the dendritic tips of ON-cone bipolar cells. Scale bar:A–C, 5 μm; D–F, 8.5 μm.
Fig. 7.

Expression of AMPA receptor subunits at S-cone pedicles. All figures are confocal micrographs of vertical sections through three cone pedicles that were double-labeled for the blue cone opsin and the AMPA receptor subunits. The S-cone pedicles are in the center. A, GluR1; B, GluR2poly;C, GluR2/3; D, GluR4. All four subunits are expressed both at the S-cone pedicles and at the unlabeled M/L-cone pedicles. Scale bar, 5 μm.
Fig. 10.

Horizontal sections of cone pedicles that were double-labeled for bassoon (green) and for AMPA receptor subunits (red). A, The ribbons of an M/L-cone pedicle (left) and of an S-cone pedicle (right) are immunoreactive for bassoon in this composed confocal micrograph. B, GluR4-immunoreactive hot spots at the same pedicles as in A. C, superposition of A and B shows that most of the GluR4-labeled hot spots are in register with the ribbons.D, Composed fluorescence micrograph of two cone pedicles from more central retina. The ribbons of the M/L-cone pedicle (left) and of the S-cone pedicle (right) are labeled for bassoon. E, GluR1-immunoreactive hot spots at the same pedicles as in D. F, Superposition of D and E shows that only half of the GluR1-labeled hot spots are in register with the ribbons, and the other half is displaced from the ribbons. Scale bar, 5 μm.
Fig. 1.

Cone pedicles of the macaque monkey retina.A, Toluidine blue-stained semithin vertical section through six cone pedicles of the central retina. The three arrowheads point to rod sperules, and the two arrows point to the cone pedicle synaptic complex.B, Fluorescence micrograph of a vertical section through six cone pedicles of the central retina that were immunostained for bassoon. The arrowhead points to a rod spherule, and thearrows point to cone pedicles. C, Toluidine blue-stained semithin horizontal section through the cone pedicle layer of the central retina. D, Confocal horizontal section through the cone pedicles (clusters of puncta) and rod spherules (horseshoe-shaped) in peripheral retina. The retina was immunostained for bassoon. E, Confocal horizontal section through the cone pedicle layer close to the fovea. The retina was immunostained for bassoon. Two rod spherules are indicated bysmall arrows. F, One cone pedicle and several rod spherules from the peripheral retina immunostained for bassoon. The elongated ribbons in the cone pedicle and the horseshoe-shaped ribbons in the rod spherules light up.G, Two cone pedicles from the central retina immunostained for bassoon. The synaptic ribbons light up. Scale bar:F, G, 5 μm; D,E, 33.4 μm; A, B, 16.3 μm; C, 20.6 μm.
Preembedding immunoelectron microscopy. After blocking, vibratome sections were incubated for 4 d at 4°C in a primary incubation solution as used for LM but without Triton X-100. Detection of the immunostaining and microscopic analysis was performed as described previously (Sassoè-Pognetto et al., 1994).
Postembedding immunoelectron microscopy. The slam-freezing and cryosubstitution methods used in this study are a modification of those previously described (Baude et al., 1993). Briefly, small pieces of retina were slam-frozen onto a precooled copper block using a Reichert MM80 unit (Leica, Bensheim, Germany). The frozen specimens were then transferred to a cryosubstitution unit (Reichert AFS; Leica) and placed into a solution of 0.5% uranyl acetate (w/v) in 100% methanol at −90°C. After 36 hr, the temperature was increased stepwise to −30°C. The samples were then washed several times in precooled methanol and then progressively infiltrated with Lowicryl HM20 (Chemische Werke Lowi GmbH, Waldkraiburg, Germany) (1:1 Lowicryl to methanol, 90 min; 2:1 Lowicryl to methanol, 90 min; 100% Lowicryl, 90 min; 100% Lowicryl, overnight). Polymerization was achieved by exposure to UV light for 12 hr.
Ultrathin sections were cut and collected on Formvar-coated nickel grids. The sections were first incubated in 0.05 mTris-buffered saline (TBS), pH 7.6, for 15 min, followed by a blocking solution containing 10% NGS and TBS with 0.1% Triton (TBST) for 20 min. Sections were then incubated overnight in primary anti-GluR2/3 diluted 1:10 or anti-GluR4 diluted 1:5 in 1% NGS and TBST. After washing in TBS, sections were incubated for 2 hr in secondary anti-rabbit IgG conjugated to 10 nm gold (ICN Biomedicals, Aurora, OH) diluted 1:20 in 1% NGS and TBST. After further washing in TBS and PB, the sections were fixed for 5 min in 2% glutaraldehyde in PB, washed in distilled water, and counterstained with uranyl acetate and lead citrate. The grids were then viewed with a Zeiss (Oberkochen, Germany) EM10 electron microscope.
RESULTS
Light microscopical analysis of the cone pedicle synaptic complex
The cone pedicle diameter of the macaque retina varies between 6 μm close to the fovea and 10 μm in peripheral retina. Electron microscopic reconstructions of foveal and peripheral cone pedicles has revealed an average of 21 and 42 ribbons, respectively (Calkins et al., 1996; Chun et al., 1996). The spatial dimensions of the synaptic complex of the cone pedicle are at the limits of the resolution of light microscopy; however, by using fluorescent markers and confocal microscopy, we were able to reveal much of the structure of this complex synapse.
Figure 1A shows a conventional semithin vertical section through the cone pedicles close to the fovea. The arrows point to the synaptic complex at the cone pedicle base. Some rod spherules (arrowheads) are also visible, and they are found at an outer position with respect to the cone pedicles. A horizontal semithin section that cuts slightly obliquely through the cone pedicle layer close to the fovea is shown in Figure 1C. The cone pedicles are densely packed, and the multiple invaginations in the center of the pedicles are just resolved. The top left corner of the section already cuts through the plane of bipolar and horizontal cell processes underneath the cone pedicle.
The cytomatrix protein bassoon as a marker for photoreceptor ribbons
Our laboratory has recently shown that the presynaptic cytomatrix protein bassoon (tom Dieck et al., 1998) is highly concentrated at the ribbons, in both cone pedicles and rod spherules of the rodent retina (Brandstätter et al., 1999). A confocal vertical section through the cone pedicle layer of a macaque monkey retina that was immunostained for bassoon is shown in Figure 1B. Both the horseshoe-like ribbons of rod spherules (arrowhead) and the row of individual ribbons at the cone pedicle base (arrows) are apparent. The complete array of ribbons in rod spherules and cone pedicles is better resolved by the confocal sections through flat-mounted monkey retinas (Fig. 1D–G). The sections in Figure 1, E (low power) and G (high power), were from the central retina, where only few rod spherules are present (small arrows). Cone pedicles are small and contain on average 20 small ribbons. The sections in Figure 1, D(low power) and F (high power), are from more peripheral retina, and many horseshoe-shaped ribbons of rod spherules are found throughout this field. Ribbons of cone pedicles are smaller than those of rod spherules and are clustered within the individual cone pedicles. The average number of ribbons in peripheral retina is 45 per cone pedicle.
It has been reported from electron microscopic observations, that S-cone pedicles contain the same number of ribbons as L- and M-cones, although the S-cone pedicles appeared to be smaller, and the ribbons were found to be smaller (Ahnelt et al., 1990; Herr et al., 1995). We have confirmed this result by double labeling retinal horizontal sections for bassoon and for the S-cone opsin (Fig.2A–D). Two S-cone pedicles are labeled in Figure 2B, and their corresponding ribbons are marked by the arrows in Figure2A. The ribbons of the two S-cone pedicles are smaller and more densely packed than those of the surrounding pedicles. This becomes more obvious by comparing high-power micrographs showing an S-cone pedicle (Fig. 2D) and an L/M-cone pedicle (Fig. 2C). We counted the bassoon-labeled ribbons in labeled S-cone pedicles of midperipheral retina and found an average of 29.4 ± 2.8 (n = 23). In the same area M- and L-cone pedicles contained an average of 31.8 ± 3.4 (n = 35) ribbons, and there was no significant difference between the number of ribbons in M/L- and S-cones.
Fig. 2.
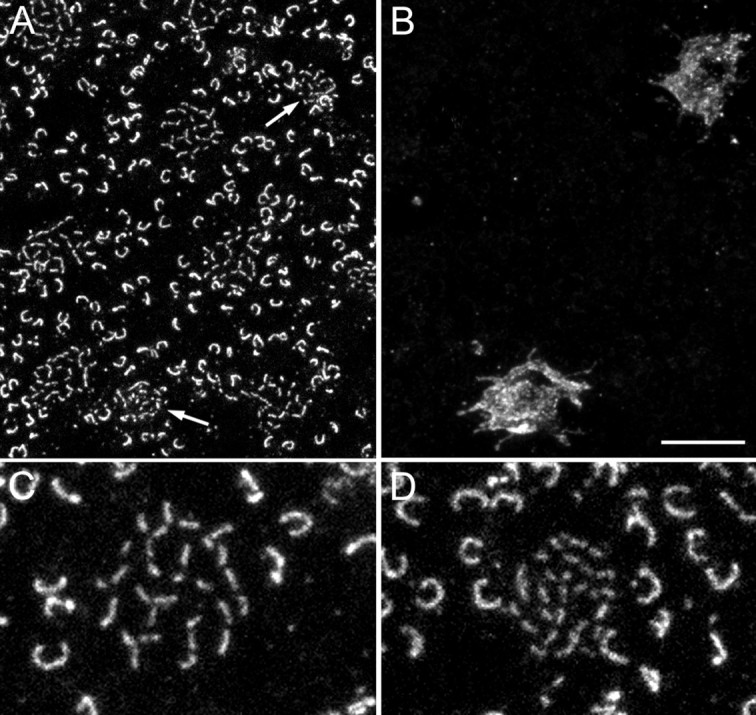
Comparison of S-cone pedicles and M/L-cone pedicles. A and B are confocal horizontal sections through the cone pedicles of a retina that was double-immunolabeled for bassoon (A) and for the S-cone opsin (B). The two S-cone pedicles that are labeled in B are indicated by thearrows in A. They have smaller ribbons than the surrounding M/L-cone pedicles. C, High-power confocal micrograph of an M/L-cone pedicle that was immunostained for bassoon. D, High-power confocal micrograph of an S-cone pedicle that was immunostained for bassoon. Scale bar:A, B, 10 μm; C,D, 5 μm.
Until now it was known that foveal cones contain fewer ribbons than peripheral cones (Calkins et al., 1996; Chun et al., 1996), however, it was not known whether this is a peculiarity of the fovea or whether there is a smooth transition from the fovea toward peripheral retina. From a series of confocal micrographs extending from the fovea toward peripheral temporal retina, we counted the number of ribbons per pedicle, the density of pedicles, and the pedicle size (Fig.3). There is a gradual increase in the number of ribbons per pedicle from 20 close to the fovea to ∼50 in peripheral retina (Fig. 3A). The density of pedicles decreased from a peak of 26,000/mm2 at 1 mm eccentricity to 2500/mm2 in peripheral retina (Fig. 3B). The pedicle area covered by ribbons increased from ∼16 μm2 close to the fovea to 35 μm2 in peripheral retina (Fig. 3B). We tested the hypothesis that the reduced number of ribbons in cone pedicles of the central retina is just a consequence of the smaller pedicle size. This appears to be the case, because dividing the number of ribbons by the cone pedicle area results in close to one ribbon per square micrometer over most of the retina. This suggests that 1 μm2 is the optimal size for a triad containing the presynaptic ribbon, the two lateral horizontal cell processes, and the central invaginating process.
Fig. 3.

The number of synaptic ribbons in cone pedicles of the macaque monkey retina. A, The abscissa represents the distance from the fovea (eccentricity), and the ordinate shows the number of ribbons per cone pedicle. They were counted in confocal horizontal sections through cone pedicles that were immunostained for bassoon. Each data point represents the average of at least 10 cone pedicles. The curve shows a polynomial fit to the data points. B, The abscissa represents the distance from the fovea (eccentricity). The left ordinate shows the density of the cone pedicles (pedicles per square millimeter). The right ordinate shows the cone pedicle area (in square micrometers) measured as the area occupied by the ribbons.
The synapse-associated membrane protein P84 as a marker for the lateral elements of ribbon synapses
After having analyzed the ribbons using LM, we next studied the lateral elements of the cone pedicle triads. It has recently been shown in the mouse retina that the synapse-associated membrane protein P84, a member of the Ig family, is localized to both plexiform layers (Mi et al., 2000). In the OPL, invaginating synapses of cone pedicles and rod spherules were labeled. We applied antibodies against P84 to the monkey retina and observed labeling only in the OPL, where the expression pattern was similar to that in the mouse retina (Mi et al., 2000). High-power micrographs of a vertical section that was double-labeled for bassoon and for P84 are shown in Figure4A–C. Bassoon labels the ribbons of one cone pedicle and of several rod spherules (Fig.4A). The cone pedicle and the rod spherules are also immunoreactive for P84 (Fig. 4B). Superposition of the two micrographs (Fig. 4C) shows that the labeling patterns are not identical. In the rod spherules (arrowheads) the red “horseshoe” surrounds the green horseshoe, and in the cone pedicle the red puncta (ribbons) are above the green label. Double-labeled sections of flat-mounted retinas were observed using a confocal microscope (Fig.4D–F). Ribbons of two cone pedicles and of a few rod spherules are immunostained for bassoon in Figure4D. The same pedicles and the rod spherules are also immunoreactive for P84 (Fig. 4E), however, many more smaller puncta fill the cone pedicles. The superposition of Figure 4,D and E, is shown in Figure 4F. Clearly, the bassoon-labeled ribbons (red) and the P84-labeled puncta (green) are not in register. The green puncta (Fig. 5F, arrows) are quite often found on both sides of the ribbons, and this is exactly the position of the horizontal cell dendrites that form the lateral elements of the ribbon synapses. Counting the number of green puncta and comparing it with the number of ribbons shows that there are on average twice as many green puncta. This supports their identification as lateral elements of the triads, because there are usually two horizontal cell processes at that position.
We also studied the localization of P84 by EM (see Fig.8A). In agreement with the results reported for the mouse retina (Mi et al., 2000), we observed label exclusively at the invaginating synapses. Gold particles decorated the membrane of the invaginating processes, however, it has not yet been decided whether P84 is inserted into the photoreceptor membrane surrounding the synaptic cavity, whether it covers the surface of the invaginating processes, or whether it is expressed at both the presynaptic and the postsynaptic membranes (Mi et al., 2000). The horizontal cell lateral elements are surrounded by the signal (see Fig. 8A, open arrowheads).
Fig. 8.
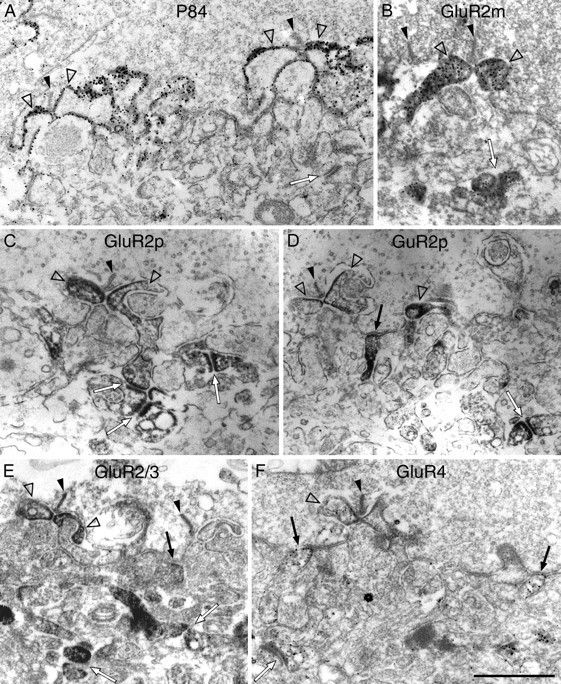
Electron micrographs of vertical sections through the synaptic complex of cone pedicles that were immunolabeled using the pre-embedding method. A, Two triads at the cone pedicle base are shown. The filled arrowheads point to the presynaptic ribbons, and the open arrowheads point to the lateral horizontal cell processes, which are surrounded by the label. The contacts between the horizontal cell dendrites and the cone pedicle are most prominently labeled for P84. B, Two ribbons at the cone pedicle base are marked by the filled arrowheads. Two GluR2m-immunoreactive invaginating processes of horizontal cells are marked by the two open arrowheads. Desmosome-like junctions underneath the cone pedicle are also labeled (arrow).C, One triad inserted into the cone pedicle base is shown (the filled arrowhead marks the ribbon). Two GluR2p-immunoreactive, invaginating horizontal cell dendrites are marked by open arrowheads. Three labeled desmosome-like junctions are marked by arrows. D, One ribbon (filled arrowhead) and three lightly labeled lateral horizontal dendrites (open arrowheads) can be seen on the left. In the center, a GluR2p-immunolabeled process (arrow) makes a typical flat contact at the cone pedicle base. A GluR2-immunolabeled desmosome-like junction is marked by an arrow in thebottom right corner. E, Two ribbons are marked by filled arrowheads, and two GluR2/3-immunolabeled horizontal cell dendrites are marked byopen arrowheads. A labeled flat contact at the cone pedicle base and two labeled desmosome-liked junctions are marked byarrows. F, One triad inserted into the cone pedicle base is shown in the center. One horizontal dendrite (open arrowhead) inserted into the triad and two bipolar cell dendrites contacting the cone pedicle base (arrows) are immunoreactive for GluR4. A desmosome-like junction (arrow in the bottom left corner) is also labeled. Scale bar, 1 μm.
Because parvalbumin (PV) labels both H1 and H2 horizontal cells (Wässle et al., 2000) we also observed sections that were double-labeled for P84 and PV by LM (data not shown). The PV-immunoreactive invaginating processes of horizontal cells coincided with the P84-immunolabled puncta, the latter being slightly larger. Both the light microscopic (Fig. 4) and the electron microscopic results (see Fig. 8A) suggest that P84 might be used as a marker that preferentially labels the lateral invaginating contacts at the photoreceptor ribbon synapses, both in cone pedicles and rod spherules.
Peanut agglutinin as a marker of the central portion of the cone pedicle triads
The lectin peanut agglutinin (PNA) binds to the plasma membrane of cone inner and outer segments and appears to be absent from rods (Blanks et al., 1988). Blanks et al. (1988) also briefly reported (their Fig. 3A) that PNA has a patchy distribution at the cone pedicle. We performed double-labeling experiments with PNA and bassoon (Fig. 5A–C). PNA labeled the inner and outer segments of cones (data not shown) and had a patchy distribution along the cone pedicle base (Fig. 5B). Superposition of bassoon and PNA labeling (Fig. 5C) shows that PNA patches are closely associated with, and largely overlap the bassoon-immunoreactive ribbon complex. This suggests that the PNA patches are in register with the central elements of the triads, the invaginating dendrites of ON-cone bipolar cells. To show this, we double-labeled vertical retinal sections for PNA and the G-protein Goα. It has been shown by Vardi (1998) that Goα labels ON-bipolar cells and their dendritic terminals inserted as central elements into the triads. A vertical section through the cone pedicle layer that was double-labeled for PNA and for Goα is shown in Figure 5D–F. The dendritic tips inserted into the cone pedicles (Fig. 5D) and the PNA patches (Fig.5E) are in register when the fluorescence micrographs are superimposed (Fig. 5F). This indicates that PNA patches are in register with the central elements of the triads. However, we do not know at present whether PNA labels the presynaptic or the postsynaptic membrane. In EM reconstructions of cone pedicles, our laboratory has shown that on average two ON-bipolar cell dendrites are inserted into the triads (Chun et al., 1996). They are close together, and it is not possible to separate them by light microscopy. Quite often the PNA patches are elongated, forming ridges that bridge several ribbons (Fig. 5A–C, ellipses). This appearance is also predicted from the EM reconstructions, where we observed several invaginating bipolar cell dendrites that were aligned with the ribbons (Chun et al., 1996, their Fig. 2D).
In conclusion, we have shown that confocal fluorescence microscopy can resolve astonishing details of the cone pedicle synaptic complex, so far only accessible by EM. Bassoon was found to be a reliable marker for the presynaptic ribbon complex. The synapse-associated membrane protein P84 preferentially labeled the lateral elements of the triads. PNA appears to be a marker more restricted to the central elements of the triads. Because the geometry of cone synapses is well known in the primate retina, we are now confident that we can use those stainings to obtain quantitative data in other mammalian retinas, such as rabbit or mouse, where the arrangement of the synapsing processes is less regular, without resorting to serial sectioning for the electron microscope. In the following we will use this technique to study the localization of AMPA receptors expressed at cone pedicles.
Localization of AMPA receptors at the cone pedicle base
Light microscopical studies
In a preceding study of monkey cone pedicles (Haverkamp et al., 2000), we have described the basic expression pattern of the AMPA receptor subunits GluR1–GluR4, and we have analyzed in detail their localization at the desmosome-like junctions. In the present study we concentrate on their localization at the triads and the flat contacts. A specific antibody for GluR1 was available. Two antibodies that recognize GluR2 were used, a monoclonal and a polyclonal. No specific antibody for GluR3 was available, only an antiserum that recognized both GluR2 and GluR3 could be applied. A specific antibody for GluR4 was also available.
The distribution of the GluR1, GluR2, GluR2/3, and GluR4 subunits in vertical sections through cone pedicles is shown in Figure6. The GluR1 clusters form a single band, whereas the other three subunits are aggregated in two bands 1.5 μm apart that are aligned with the cone pedicle bases (Fig.6A,C,E,G). These sections were also labeled for bassoon, and the superposition of the GluR and bassoon labeling is shown in Figure 6, B,D,F, and H. These show that the top band of the GluR2, GluR2/3, and GluR4 labeling is closely associated with the bassoon-labeled ribbons. The bottom band has been shown in our preceding study, to represent a clustering of the AMPA receptors at the desmosome-like junctions underneath the cone pedicle (Haverkamp et al., 2000). The band of GluR1 clusters (Fig.6A,B) does not coincide with the band of bassoon-labeled ribbons but is found slightly below the ribbons.
Fig. 6.

Cone pedicles of the macaque monkey retina that were double-labeled for the AMPA receptor subunits (red) and for bassoon (green). A, Composed fluorescence micrograph of a vertical section through two cone pedicles immunostained for GluR1. B, Same section as inA, superposition of the GluR1 (red) and bassoon (green) label. C, Two cone pedicles immunostained for GluR2 (poly). D, Same section as in C, superposition of the GluR2 (red) and bassoon (green) label. E, Two cone pedicles immunostained for GluR2/3. F, Same section as in E, superposition of the GluR2/3 (red) and bassoon (green) label.G, Two cone pedicles immunostained for GluR4.H, Same section as in G, superposition of GluR4 (red) and bassoon (green) label. Scale bar, 5 μm.
We first wanted to know whether these AMPA receptors are also expressed at the S-cone pedicles. It has been shown that S-cone pedicles are preferentially connected to H2-horizontal cells while making only sparse connections with H1-horizontal cells (Ahnelt and Kolb, 1994a,b;Dacey et al., 1996; Goodchild et al., 1996; Chan and Grünert, 1998). L- and M-cones have only sparse connections with H2-horizontal cells (Ahnelt and Kolb, 1994a,b; Dacey et al., 1996; Wässle et al., 2000). If there were a difference in the expression of AMPA receptors at the synapses of H1 and H2 horizontal cells with cone pedicles, this should show up preferentially at S-cone pedicles. We double-labeled sections for the S-cone opsin and for the GluR subunits (Fig. 7). The antiserum against the S-cone opsin labels not only the outer segment but the entire cone, including the cone pedicle (Goodchild et al., 1996). In all four micrographs of Figure 7 an S-cone pedicle in the center is flanked by two L/M cone pedicles. As mentioned before, S-cone pedicles are smaller, and their ribbons are shorter and more tightly packed.
Taking this into account, there seems to be no obvious difference in the expression of GluR1 (Fig. 7A), GluR2 (Fig.7B), GluR2/3 (Fig. 7C), and GluR4 (Fig.7D) between the S-cone pedicle in the center and neighboring L/M cones. This also holds true for the second row of AMPA receptors underneath the cone pedicle base that is associated with the desmosome-like junctions (Haverkamp et al., 2000). We also performed a more quantitative analysis (Table 1). We made five consecutive, vertical confocal sections through double-labeled S-cone pedicles and neighboring L/M cone pedicles. From these five sections, we counted the number of GluR1, GluR2, GluR2/3, and GluR4 clusters that coincided with the cone pedicle base. GluR1 was expressed in 16 clusters, and the other subunits were expressed in ∼20 clusters per cone pedicle. These counts were independent of the cone type (Table 1).
Table 1.
Comparison of the expression of AMPA receptor at S-cone and M/L-cone pedicles
| Cone type | Number of pedicles | Hot spots per pedicle | |
|---|---|---|---|
| GluR1 | S-cones | 13 | 16.2 ± 2.6 |
| M/L-cones | 22 | 16.1 ± 2.6 | |
| GluR2p | S-cones | 17 | 19.2 ± 1.7 |
| M/L-cones | 34 | 19.9 ± 2.3 | |
| GluR2/3 | S-cones | 14 | 21.4 ± 1.6 |
| M/L-cones | 33 | 22.4 ± 1.9 | |
| GluR4 | S-cones | 14 | 19.4 ± 3.1 |
| M/L-cones | 30 | 21.7 ± 2.6 |
The hot spots were counted from five subsequent confocal vertical sections through individual cone pedicles. A morphometric reconstruction was not performed.
Localization of the AMPA receptors by electron microscopy
Next, we studied the cell types that express the AMPA receptors at their contacts with the cone pedicle base by EM. Both pre-embedding and postembedding immunocytochemistry were applied. The pre-embedding method involves an amplification step, the avidin–biotin complex, and the diaminobenzidine (DAB) reaction, and is, therefore, more sensitive. However, because the DAB reaction product is diffusible, localization is less precise. The localization using postembedding immunocytochemistry is precise, because the secondary antibodies are marked with gold particles and bind directly to the first antibody. However, this method is not as sensitive as the pre-embedding method (for review, see Ottersen and Landsend, 1997;Nusser et al., 1998).
We will first discuss the labeling as revealed by the pre-embedding method (Fig. 8). Figure8B–D shows the localization of the GluR2 subunit using two different antibodies [monoclonal (m); polyclonal (p)]. In Figure 8B, the two lateral elements of the ribbon synapse and the two partners of the desmosome-like junction are strongly labeled. In Figure 8C, two lateral elements, several desmosome-like junctions, and one flat contact are labeled. In Figure 8D, one flat contact and one desmosome-like junction are strongly labeled, whereas two lateral elements are more weakly labeled. These results show that GluR2 is expressed in horizontal cell dendrites forming the lateral elements of the triads, at flat contacts of putative OFF-cone bipolar cells at the cone pedicle base and at desmosome-like junctions underneath the cone pedicle.
Figure 8E shows results from immunolabeling a cone pedicle with antibodies that recognize both the GluR2 and GluR3 subunits (GluR2/3). Two lateral elements, one flat contact, and two desmosome-like junctions appear to be labeled, suggesting that GluR2/3 is expressed in horizontal cell processes, in flat contacts of putative OFF-cone bipolar cells, and at desmosome-like junctions. This result is in agreement with recent reports of Morigiwa and Vardi (1999) in the monkey and Qin and Pourcho (1999) in the cat retina.
Figure 8F shows the localization of the GluR4 subunit at the cone pedicle. One lateral element, two flat contacts, and two desmosome-like junctions are labeled. Hence, GluR4 is also expressed in horizontal cell dendrites, at flat contacts of putative OFF-cone bipolar cells, and at desmosome-like junctions. Morigiwa and Vardi (1999) and Qin and Pourcho (2000) also reported that horizontal cell dendrites and OFF-cone bipolar cells express GluR4.
In our preceding study (Haverkamp et al., 2000) we have applied pre-embedding immunocytochemistry and EM to localize the GluR1 subunit. It was exclusively expressed at flat contacts made by putative OFF cone bipolar cells at the cone pedicle base. Such expression of GluR1 at flat contacts has also been found in the rodent retina (Hack et al., 1999).
Figure 9 shows results of the localization of GluR2/3 and GluR4 at the cone pedicle using postembedding immunocytochemistry and electron microscopy. Figure 9,A, B, D and E, shows typical triads with a presynaptic ribbon opposed to two lateral horizontal cell processes. As has been shown already in the earliest electron micrographs of the triads (Missotten, 1965; Dowling and Boycott, 1966) the two horizontal cells touch one another underneath the ribbon. The gold particles are aggregated precisely at this zone of contact between the two horizontal cell processes. In Figure 9,C and F, two desmosome-like junctions from underneath the cone pedicles are shown at high magnification. Both sides of the junction are decorated with gold particles, suggesting that AMPA receptors are expressed by both members of this junction (Haverkamp et al., 2000). These results show that the AMPA receptors, expressed by the horizontal cell dendrites inserted into the triads, are not distributed all over the invaginating processes, as one might deduce from the pre-embedding immunolabeling (Fig. 8), but are aggregated at the zone of contact between the two horizontal cell processes.
Fig. 9.
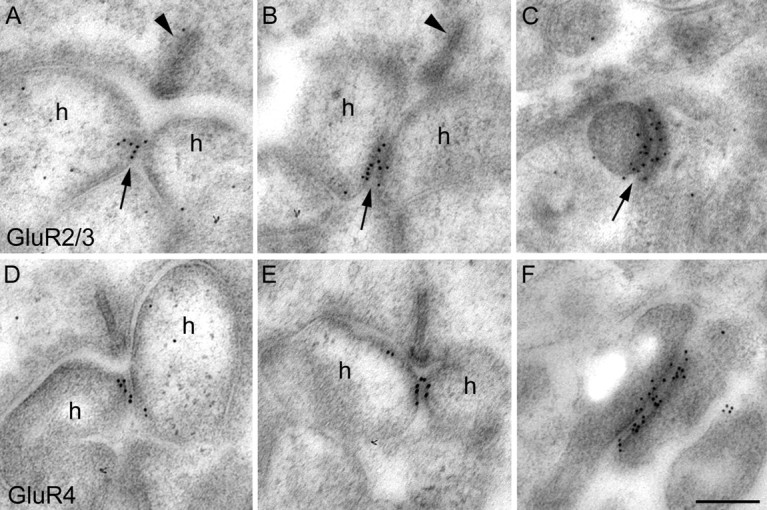
Electron micrographs of vertical sections through the synaptic complex of cone pedicles that were immunolabeled using the postembedding method. A, A typical triad with a presynaptic ribbon (arrowhead), two lateral horizontal cell dendrites (h), and a central invaginating process is shown. The contact zone between the two horizontal cell processes is immunolabeled for GluR2/3. B, Another triad is shown, and the contact zone of horizontal cell dendrites is labeled for GluR2/3. C, A desmosome-like junction from underneath the cone pedicle expresses GluR2/3 label at both sides of the junction. D, In this triad the GluR4 label is restricted to the contact zone of the horizontal cell dendrites.E, The contact zone of horizontal cell dendrites in this triad expresses GluR4 immunoreactivity. F, Both sides of this desmosome-like junction are labeled for GluR4. Scale bar, 0.2 μm.
Colocalization of the AMPA receptors and ribbon synapses
The aggregates of AMPA receptors at the junction of the two invaginating horizontal cell dendrites should also become apparent in the confocal light micrographs. However, because they are expressed at adjacent membranes, light microscopy will not be able to resolve the two aggregates, but will instead show a single cluster. In the horizontal view such AMPA receptor aggregates at horizontal cells should coincide with the bassoon-immunoreactive ribbons.
Figure 10A–C shows a horizontal section of monkey retina that was double-labeled for the GluR4 subunit and for bassoon. Two bassoon-labeled cone pedicles, one a putative S-cone pedicle containing 34 ribbons, and the other an L/M-cone pedicle containing 36 ribbons, are shown (Fig.10A). GluR4-immunoreactive hot spots form two bands underneath the cone pedicle (Fig. 6D), however, by the application of confocal microscopy it was possible to select the puncta in the top (outer) band (Fig. 10B). In the S-cone pedicle 35 such puncta were found, and in the L/M-cone pedicle 39 puncta were found. Superposition of the two micrographs in Figure10C shows that the great majority (90%) of the GluR4-immunoreactive puncta are in register with the ribbons, and only few puncta (10%) are not associated with the ribbons. The GluR4-immunoreactive clusters of the inner band, that have been shown to coincide with the desmosome-like junctions (Haverkamp et al., 2000), were not in register with the ribbons (data not shown). Comparable double-labeling experiments were also performed for the GluR2 and the GluR2/3 subunits, and the puncta in the outer band were also found in register with the ribbons. A more quantitative evaluation of a total of 24 cone pedicles (Table 2) showed: (1) there are always slightly more GluR2-, GluR2/3-, as well as GluR4-immunoreactive puncta than there are ribbons; (2) 88% of these puncta are in register with the ribbons; (3) only 12% do not coincide with the ribbon; (4) every individual ribbon is in register with a GluR2-, GluR2/3-, and GluR4-immunoreactive hot spot.
Table 2.
AMPA receptor expression at the cone pedicle
| Number of pedicles | Ribbons per pedicle | Contacts per pedicle | TA contacts per pedicle | NTA contacts per pedicle | |
|---|---|---|---|---|---|
| GluR1 | 11 | 36.3 ± 5 | 25 ± 5 | 12.8 ± 4.1 | 12.2 ± 4.6 |
| GluR2p | 4 | 33.5 ± 3.1 | 38.5 ± 2.6 | 33.5 ± 3.1 | 5 ± 0.8 |
| GluR2/3 | 8 | 33.4 ± 2.7 | 37.5 ± 3.9 | 33.4 ± 2.7 | 4.1 ± 1.9 |
| GluR4 | 12 | 31.8 ± 3.7 | 36.4 ± 4.1 | 31.8 ± 3.7 | 4.6 ± 1.4 |
| Sum | — | — | 137.4 | 111.5 | 25.9 |
Cone pedicles were double-labeled for basson and the respective AMPA receptor subunits. The number of ribbons, the total number of immunoreactive contacts (hot spots, clusters), the number of contacts that were in register with the ribbons (TA), and the number of contacts that were displaced from the ribbons (NTA) were counted from confocal horizontal sections.
The situation was different in horizontal sections that were double-labeled for GluR1 and bassoon (Fig.10D–F). Electron microscopy predicts that the GluR1 subunit is only found at flat contacts formed by OFF-cone bipolar cells at the cone pedicle base (Haverkamp et al., 2000). Reconstructions of Golgi-stained OFF bipolar cell cone contacts by EM (Boycott and Hopkins, 1993; Hopkins and Boycott, 1997) have shown that flat contacts can be separated into TA and NTA contacts. The TA flat contacts did not directly coincide with the ribbons, but were slightly displaced from the ribbons by the invaginating processes. The bassoon-immunoreactive ribbons (n = 27) of a putative S-cone pedicle and of an L/M cone pedicle (n = 30) are shown in Figure 10D. The GluR1-labeled hot spots are shown in Figure 10E, and they are found in both the S- and L/M-cone pedicles. The hot spots in the S-cone are more intensely labeled, and at low magnification the S-cone pedicles could be easily recognized by their more intense GluR1 immunofluorescence. Whether this reflects a higher expression of GluR1 in S-cones or an uneven penetration of the antibody to the slightly displaced S-cone pedicles, still has to be investigated. The superposition of bassoon and GluR1 labeling in Figure 10F shows that some GluR1-immunoreactive puncta are in close association with the ribbons, whereas others are not. Particularly in the S-cone pedicle there is not much coincidence between the red and green label. However, even those GluR1-immunoreactive (red) puncta that are associated with the ribbons are not precisely in register, compared with the GluR4 puncta in Figure10C. They are often displaced along the ribbons long axes. It is, therefore, possible in the confocal micrographs to classify flat contacts into TA and NTA contacts. A more quantitative evaluation of a total of 11 cone pedicles (Table 2) showed: (1) there are always more ribbons (n = 36.3 ± 5) than GluR1-immunoreactive puncta (n = 25 ± 5); (2) 52% of these puncta are triad-associated; (3) 48% are nontriad-associated; and (4) 65% of the ribbons are not associated with GluR1-immunoreactive hot spots.
We also performed double-labeling experiments for P84 and GluR1, GluR2, GluR2/3, and GluR4, as well as for PNA and the AMPA receptor subunits (data not shown), and we obtained the same results. These LM results allow several predictions to be made, with respect to the expression of AMPA receptors at cone pedicles. The GluR2, GluR2/3, and GluR4 subunits are in most cases precisely centered at the triads, and every triad is decorated by a hot spot of these three subunits. This would suggest that the GluR2, GluR2/3, and GluR4 subunits are preferentially expressed by horizontal cells.
The GluR1 subunit appears to be displaced from the ribbons, both vertically (Fig. 6E) and horizontally (Fig.10F). This, together with the EM results (Haverkamp et al., 2000), is strong evidence that the GluR1 subunit is preferentially expressed at the flat contacts made by OFF-cone bipolar cells. However, because there are only few GluR1-immunoreactive hot spots, this subunit will almost certainly be expressed only in a subset of OFF-cone bipolar cell contacts.
We have carefully compared the AMPA receptor expression of L/M and S-cone pedicles and have found that all four subunits are expressed at all cones pedicles. Differences in labeling intensity were observed for the GluR1 subunit.
DISCUSSION
Clustering of glutamate receptors at horizontal cell junctions
The most precise localization of transmitter receptors at synapses is obtained by postembedding immunocytochemistry and EM (Ottersen and Landsend, 1997; Nusser et al., 1998). In the case of conventional synapses of the CNS, this technique has revealed the clustering of glutamate receptors (GluRs) in the postsynaptic density. Molecular cloning has also shown that several scaffold proteins are involved with the aggregation of transmitter receptors (for review, seeHusi et al., 2000; Sheng and Kim, 2000; Walikonis et al., 2000).
The situation is not as clear in the case of the ribbon synapses. Several postsynaptic processes are opposed to the active zone at the ribbon. Some of them are in contact with the presynaptic terminals, others are some distance away. Glutamate released at the ribbon (Schmitz and Witkovsky, 1997) acts not only through direct synaptic contacts but also through diffusion to more remote GluRs (Rao-Mirotznik et al., 1995; Vandenbranden et al., 1996; Haverkamp et al., 2000).
Missotten (1965) noted that the two horizontal cell processes inserted into the triad and opposing the ribbon “present a small desmosome-like thickening at their contiguous plasma membrane”. He also described the desmosome-like junctions underneath the cone pedicle. Raviola and Gilula (1975) performed a freeze-fracture study of the monkey cone pedicle complex and found arrays of membrane particles at the interface between the horizontal cell dendrites within the triads. Raviola and Gilula (1975) also studied the desmosome-like junctions underneath the cone pedicle and found that they contained arrays of particles identical to the specialization that occurs at the interface between adjoining horizontal cell dendrites in the triads. We have shown in our preceding study (Haverkamp et al., 2000) that the desmosome-like junctions are between horizontal cell processes and that GluRs are clustered at both sides of the junction. We have also shown that the postsynaptic density protein SAP102 is aggregated at the desmosome-like junctions and at the invaginating dendrites. In the present study we have confirmed the aggregation of GluRs at the desmosome-like junctions by postembedding immunocytochemistry (Fig.9C,F). In addition we have demonstrated the clustering of GluRs at the horizontal cell junctions within the triads (Fig. 9A,B,D,E). Together, these results suggest that GluRs are prefererentially clustered at the junctions between two horizontal cell dendrites. We interpret such junctions as a pair of postsynaptic densities linked together in the same way as presynaptic and postsynaptic densities in conventional synapses (Irie et al., 1997;Huang et al., 2000; Scheiffele et al., 2000).
AMPA receptors of horizontal cells
Two horizontal cell lateral elements are inserted into every triad, and it is an attractive idea to postulate that one of them originates from an H1 cell, the other from an H2 cell, and that they express different subsets of glutamate receptors. Recently it became possible to study patches of peripheral monkey retina, where all H2 horizontal cells were stained by the injection of the tracer Neurobiotin (Dacey et al., 1996; Wässle et al., 2000). The L/M cone pedicles in such patches receive an average of 6.3 ± 1.9 (n = 30) invaginating processes from H2 horizontal cells. Cone pedicles of the peripheral retina contain 45 triads (Fig.3), hence an H2 horizontal cell process is only present in six or seven of the 45 triads. In 80% of the triads, both lateral elements are likely to originate from H1 horizontal cells.
Extrasynaptic labeling of horizontal cells in the cat retina showed that the GluR4 subunit is only expressed by A-type horizontal cells, whereas the GluR2/3 subunit is expressed by both A- and B-type horizontal cells (Morigiwa and Vardi, 1999; Qin and Pourcho, 1999). H2 cells of the primate retina are homologous to cat A-type horizontal cells (Sandmann et al., 1996; Wässle et al., 2000). H2 cells preferentially innervate S-cone pedicles (Chan and Grünert, 1998) and if, as in the cat retina, they specifically express the GluR4 subunit, S-cone pedicles should have a preponderance of GluR4 puncta. This does not appear to be the case, because both S-cones and L/M-cones displayed GluR4 hot spots at every bassoon-labeled ribbon (Fig.10A–C).
We also observed GluR2- and GluR2/3-labeled clusters at every bassoon-labeled ribbon. Our EM observations, in both the pre- and the post-embedding experiments (Figs. 8, 9), show that both horizontal cell processes inserted into the triads can express the same GluR subunit. We also did some preliminary experiments in which consecutive thin sections were immunolabeled for different AMPA receptor subunits and found that the same process can express at least the two subunits GluR2/3 and GluR4. All these results suggest that there may be no difference in the expression of the AMPA receptor subunits GluR2, GluR2/3, and GluR4 (1) between the two horizontal cell processes inserted into the triads, (2) between H1 and H2 horizontal cells, and (3) between different cone types.
AMPA receptors of OFF-cone bipolar cells
Four OFF cone bipolar cell types that make flat contacts at the cone pedicle base have been described in the primate retina: flat midget bipolar cells (FMB) (Kolb, 1970) and three diffuse bipolar cells (DB1, DB2, and DB3) (Boycott and Wässle, 1991).
Cone pedicles of the central retina are connected to one FMB cell that makes 76 TA and 20 NTA flat contacts (Hopkins and Boycott, 1997). In the case of DB1, DB2, and DB3 cells, there is evidence that every cone pedicle is connected to between two and three individuals of each type (Boycott and Wässle, 1991; Grünert et al., 1994). DB1 cells would thus occupy 25 contacts (15 TA and 10 NTA); DB2 cells, 60 contacts (30 TA and 30 NTA), and DB3 cells, 35 contacts (25 TA and 10 NTA) (Hopkins and Boycott, 1997). Adding up all the flat contacts made by these four OFF-cone bipolar cell types results in 216 contacts (146 TA and 70 NTA).
Adding up all GluR1, GluR2, GluR2/3, and GluR4-immunoreactive hot spots, found at NTA flat contacts, results in 25.9 clusters per cone pedicle (Table 2). AMPA receptors are comprised of four or five subunits. Homomeric receptors of only one type of subunit, or receptors assembled with subunits from other families (kainate, NMDA) do not occur as native receptors (Dingledine et al., 1999). Therefore GluR1, GluR2, GluR3, and GluR4 subunits must coassemble, and at the very least, pairs of receptor subunits will occur within the same hot spots. This rule reduces the number of AMPA receptor clusters at NTA flat contacts to only 13 per cone pedicle. The total number needed to serve all OFF cone bipolar cells (see above) is 75 NTA contacts. AMPA receptor hot spots are therefore, only expressed at 17% of the NTA contacts.
The same holds true for the TA contacts. If all 112 GluR subunit clusters that coincide with the ribbons (Table 2) were TA contacts, they could serve 56 flat contacts, which is only 49% of 141 TA contacts needed. However, as stated above, most of these clusters will be expressed on horizontal cell dendrites and not at bipolar cell flat contacts. These estimates suggest that AMPA receptors are only expressed at the minority of OFF cone bipolar cell cone contacts. Other GluRs, such as kainate receptors must be expressed at the majority of the flat contacts (Brandstätter et al., 1998; Morigiwa and Vardi, 1999; Haverkamp et al., 2000; Qin and Pourcho, 2000; Hack et al., 2001). Two possibilities may account for the few AMPA receptors expressed at flat contacts: only one of the four OFF cone bipolar cell types contacts cone pedicles through AMPA receptors, whereas the other three types express other GluRs. Alternatively, all four bipolar cell types receive mixed input: at some flat contacts they express AMPA receptors, at the majority of the contacts they express non-AMPA receptors. It has been shown in other parts of the CNS that one neuron can express both AMPA and non-AMPA receptors (kainate, NMDA) (Dingledine et al., 1999). However, recent electrophysiological studies of cone bipolar cells are in favor of the first possibility, the specific expression of AMPA receptors by a type of cone bipolar cell (DeVries and Schwartz, 1999; DeVries, 2000; Wu et al., 2000).
Footnotes
This work was supported by the Deutsche Forschungsgemeinschaft (SFB 269/B4) and by National Health and Medical Research Council Grant 980073 to U.G. We are grateful to Dr. B. Lee and Dr. Paul Martin for providing monkey eyes. We would like to thank M. Dumbsky, W. Hofer, and G. S. Nam for excellent technical assistance, Dr. F. Priesnitz for his help with confocal microscopy, I. Odenthal for typing the manuscript, and Krishna Ghosh for critically reading and improving the English text.
Correspondence should be addressed to Heinz Wässle, Max-Planck-Institut für Hirnforschung, Neuroanatomische Abteilung, Deutschordenstrasse 46, D-60528 Frankfurt am Main, Germany. E-mail: Waessle@mpih-frankfurt.mpg.de.
REFERENCES
- 1.Ahnelt PK, Kolb H. Horizontal cells and cone photoreceptors in primate retina: a Golgi-light microscope study of spectral connectivity. J Comp Neurol. 1994a;343:387–405. doi: 10.1002/cne.903430305. [DOI] [PubMed] [Google Scholar]
- 2.Ahnelt PK, Kolb H. Horizontal cells and cone photoreceptors in human retina: a Golgi-electron microscopic study of spectral connectivity. J Comp Neurol. 1994b;343:406–427. doi: 10.1002/cne.903430306. [DOI] [PubMed] [Google Scholar]
- 3.Ahnelt PK, Keri C, Kolb H. Identification of pedicles of putative blue-sensitive cones in the human retina. J Comp Neurol. 1990;293:39–53. doi: 10.1002/cne.902930104. [DOI] [PubMed] [Google Scholar]
- 4.Baude A, Nusser Z, Robert JDB, Mulvihill E, McIlhinmey RAG, Somogyi P. The metabotropic glutamate receptor (mGluR1α) is concentrated at perisynaptic membrane of neuronal subpopulations as detected by immunogold reaction. Neuron. 1993;11:771–787. doi: 10.1016/0896-6273(93)90086-7. [DOI] [PubMed] [Google Scholar]
- 5.Blanks JC, Hageman GS, Johnson LV, Spee C. Ultrastructural visualization of primate cone photoreceptor matrix sheaths. J Comp Neurol. 1988;270:288–300. doi: 10.1002/cne.902700209. [DOI] [PubMed] [Google Scholar]
- 6.Boycott BB, Hopkins JM. Cone synapses of a flat diffuse cone bipolar cell in the primate retina. J Neurocytol. 1993;22:765–778. doi: 10.1007/BF01181322. [DOI] [PubMed] [Google Scholar]
- 7.Boycott BB, Wässle H. Morphological classification of bipolar cells of the primate retina. Eur J Neurosci. 1991;3:1069–1088. doi: 10.1111/j.1460-9568.1991.tb00043.x. [DOI] [PubMed] [Google Scholar]
- 8.Brandstätter JH, Koulen P, Wässle H. Diversity of glutamate receptors in the mammalian retina. Vision Res. 1998;38:1385–1397. doi: 10.1016/s0042-6989(97)00176-4. [DOI] [PubMed] [Google Scholar]
- 9.Brandstätter JH, Fletcher EL, Garner CC, Gundelfinger ED, Wässle H. Differential expression of the presynaptic cytomatrix protein bassoon among ribbon synapses in the mammalian retina. Eur J Neurosci. 1999;11:3683–3693. doi: 10.1046/j.1460-9568.1999.00793.x. [DOI] [PubMed] [Google Scholar]
- 10.Calkins DJ, Tsukamot Y, Sterling P. Foveal cones form basal as well as invaginating junctions with diffuse ON bipolar cells. Vision Res. 1996;36:3373–3381. doi: 10.1016/0042-6989(95)00333-9. [DOI] [PubMed] [Google Scholar]
- 11.Chan TL, Grünert U. Horizontal cell connections with short wavelength-sensitive cones in the retina: a comparison between new world and old world primates. J Comp Neurol. 1998;393:196–209. [PubMed] [Google Scholar]
- 12.Chun MH, Grünert U, Martin PR, Wässle H. The synaptic complex of cones in the fovea and in the periphery of the macaque monkey retina. Vision Res. 1996;36:3383–3395. doi: 10.1016/0042-6989(95)00334-7. [DOI] [PubMed] [Google Scholar]
- 13.Dacey DM, Lee BB, Stafford DK, Pokorny J, Smith VC. Horizontal cells of the primate retina: cone specificity without spectral opponency. Science. 1996;271:656–659. doi: 10.1126/science.271.5249.656. [DOI] [PubMed] [Google Scholar]
- 14.DeVries SH. Bipolar cells use kainate and AMPA receptors to filter visual information into separate channels. Neuron. 2000;28:847–856. doi: 10.1016/s0896-6273(00)00158-6. [DOI] [PubMed] [Google Scholar]
- 15.DeVries SH, Schwartz EA. Kainate receptors mediate synaptic transmission between cones and “Off” bipolar cells in a mammalian retina. Nature. 1999;397:157–160. doi: 10.1038/16462. [DOI] [PubMed] [Google Scholar]
- 16.Dingledine R, Borges K, Bowie D, Traynelis SF. The glutamate receptor ion channels. Pharmacol Rev. 1999;51:7–61. [PubMed] [Google Scholar]
- 17.Dowling JE, Boycott BB. Organization of the primate retina: electron microscopy. Proc R Soc Lond B Biol Sci. 1966;166:80–111. doi: 10.1098/rspb.1966.0086. [DOI] [PubMed] [Google Scholar]
- 18.Goodchild AK, Chan TL, Grünert U. Horizontal cell connections with short-wavelength-sensitive cones in macaque monkey retina. Vis Neurosci. 1996;13:833–847. doi: 10.1017/s0952523800009093. [DOI] [PubMed] [Google Scholar]
- 19.Gründer T, Kohler K, Guenther E. Distribution and developmental regulation of AMPA receptor subunit proteins in rat retina. Invest Ophthalmol Vis Sci. 2000;41:3600–3606. [PubMed] [Google Scholar]
- 20.Grünert U, Martin PR, Wässle H. Immunocytochemical analysis of bipolar cells in the macaque monkey retina. J Comp Neurol. 1994;348:607–627. doi: 10.1002/cne.903480410. [DOI] [PubMed] [Google Scholar]
- 21.Hack I, Peichl L, Brandstätter JH. An alternative pathway for rod signals in the rodent retina: rod photoreceptors, cone bipolar cells, and the localization of glutamate receptors. Proc Natl Acad Sci USA. 1999;96:14130–14135. doi: 10.1073/pnas.96.24.14130. [DOI] [PMC free article] [PubMed] [Google Scholar]
- 22.Hack I, Frech M, Dick O, Peichl L, Brandstätter JH. Heterogeneous distribution of AMPA glutamate receptor subunits at the photoreceptor synapses of rodent retina. Eur J Neurosci. 2001;13:15–24. [PubMed] [Google Scholar]
- 23.Haverkamp S, Grünert U, Wässle H. The cone pedicle, a complex synapse in the retina. Neuron. 2000;27:85–95. doi: 10.1016/s0896-6273(00)00011-8. [DOI] [PubMed] [Google Scholar]
- 24.Herr SS, Tiv N, Klug K, Schein SJ, Sterling P. L-cones and M-cones in macaque monkey fovea make different numbers of synaptic contacts with OFF (but not ON) midget bipolar cells. Invest Ophthalmol Vis Sci. 1995;36:S511. [Google Scholar]
- 25.Hopkins JM, Boycott BB. The cone synapses of cone bipolar cells of primate retina. J Neurocytol. 1997;26:313–325. doi: 10.1023/a:1018504718282. [DOI] [PubMed] [Google Scholar]
- 26.Huang YZ, Won S, Ali DW, Wang Q, Tanowitz M, Du QS, Pelkey KA, Yang DJ, Xiong WC, Salter MW, Mei L. Regulation of neuregulin signaling by PSD-95 interacting with ErbB4 at CNS synapses. Neuron. 2000;26:443–455. doi: 10.1016/s0896-6273(00)81176-9. [DOI] [PubMed] [Google Scholar]
- 27.Husi H, Ward MA, Choudhary JS, Blackstock WP, Grant SGN. Proteomic analysis of NMDA receptor-adhesion protein signaling complexes. Nat Neurosci. 2000;3:661–669. doi: 10.1038/76615. [DOI] [PubMed] [Google Scholar]
- 28.Irie M, Hata Y, Takeuchi M, Ichtchenko K, Toyoda A, Hirao K, Takai Y, Rosahl TW, Südhof TC. Binding of neuroligins to PSD-95. Science. 1997;277:1511–1515. doi: 10.1126/science.277.5331.1511. [DOI] [PubMed] [Google Scholar]
- 29.Kalloniatis M, Tomisich G. Amino acid neurochemistry of the vertebrate retina. Prog Retin Eye Res. 1999;18:811–866. doi: 10.1016/s1350-9462(98)00036-6. [DOI] [PubMed] [Google Scholar]
- 30.Kolb H. Organization of the outer plexiform layer of the primate retina: electron microscopy of Golgi-impregnated cells. Philos Trans R Soc Lond B Biol Sci. 1970;258:261–283. doi: 10.1098/rstb.1970.0036. [DOI] [PubMed] [Google Scholar]
- 31.Massey SC. Cell types using glutamate as a neurotransmitter in the vertebrate retina. Prog Retin Res. 1990;9:399–425. [Google Scholar]
- 32.Mi ZP, Jiang P, Wenig WL, Lindberg FP, Narayanan V, Lagenaur CF. Expression of a synapse-associated membrane protein, P84/SHPS-1, and its ligand, IAP/CD47, in mouse retina. J Comp Neurol. 2000;416:335–344. [PubMed] [Google Scholar]
- 33.Missotten L. The ultrastructure of the human retina. Editions Arscia S.A; Brussels: 1965. [Google Scholar]
- 34.Morigiwa K, Vardi N. Differential expression of ionotropic glutamate receptor subunits in the outer retina. J Comp Neurol. 1999;405:173–184. doi: 10.1002/(sici)1096-9861(19990308)405:2<173::aid-cne3>3.0.co;2-l. [DOI] [PubMed] [Google Scholar]
- 35.Nusser Z, Lujan R, Laube G, Roberts JDB, Molnar E, Somogyi P. Cell type and pathway dependence of synaptic AMPA receptor number and variability in the hippocampus. Neuron. 1998;21:545–559. doi: 10.1016/s0896-6273(00)80565-6. [DOI] [PubMed] [Google Scholar]
- 36.Ottersen OP, Landsend AS. Organization of glutamate receptors at the synapse. Eur J Neurosci. 1997;9:2219–2224. doi: 10.1111/j.1460-9568.1997.tb01640.x. [DOI] [PubMed] [Google Scholar]
- 37.Pin J-P, Duvoisin R. Neurotransmitter receptors I. The metabotropic glutamate receptors: structure and functions. Neuropharmacology. 1995;34:1–26. doi: 10.1016/0028-3908(94)00129-g. [DOI] [PubMed] [Google Scholar]
- 38.Qin P, Pourcho RG. AMPA-selective glutamate receptor subunits GluR2 and GluR4 in the cat retina: an immunocytochemical study. Vis Neurosci. 1999;16:1105–1114. doi: 10.1017/s0952523899166100. [DOI] [PubMed] [Google Scholar]
- 39.Qin P, Pourcho RG. Immunocytochemical localization of kainate-selective glutamate receptor subunits in the cat retina. Invest Ophthalmol Vis Sci. 2000;41:S246. doi: 10.1016/s0006-8993(00)03162-0. [DOI] [PubMed] [Google Scholar]
- 40.Rao-Mirotznik R, Harkins AB, Buchsbaum G, Sterling P. Mammalian rod terminal: architecture of a binary synapse. Neuron. 1995;14:561–569. doi: 10.1016/0896-6273(95)90312-7. [DOI] [PubMed] [Google Scholar]
- 41.Raviola E, Gilula NB. Intramembrane organization of specialized contacts in the outer plexiform layer of the retina. J Cell Biol. 1975;65:192–222. doi: 10.1083/jcb.65.1.192. [DOI] [PMC free article] [PubMed] [Google Scholar]
- 42.Sandmann D, Boycott BB, Peichl L. The horizontal cells of artiodactyl retinae: a comparison with Cajal's descriptions. Vis Neurosci. 1996;13:735–746. doi: 10.1017/s0952523800008610. [DOI] [PubMed] [Google Scholar]
- 43.Sassoè-Pognetto M, Wässle H, Grünert U. Glycinergic synapses in the rod pathway of the rat retina: cone bipolar cells express the α1 subunit of the glycine receptor. J Neurosci. 1994;14:5131–5146. doi: 10.1523/JNEUROSCI.14-08-05131.1994. [DOI] [PMC free article] [PubMed] [Google Scholar]
- 44.Scheiffele P, Fan J, Choih J, Fetter R, Serafini T. Neuroligin expressed in nonneuronal cells triggers presynaptic development in contacting axons. Cell. 2000;101:657–669. doi: 10.1016/s0092-8674(00)80877-6. [DOI] [PubMed] [Google Scholar]
- 45.Schmitz Y, Witkovsky P. Dependence of photoreceptor glutamate release on a dihydropyridine-sensitive calcium channel. Neuroscience. 1997;78:1209–1216. doi: 10.1016/s0306-4522(96)00678-1. [DOI] [PubMed] [Google Scholar]
- 46.Schultz K, Goldman DJ, Ohtsuka T, Hirano J, Barton L, Stell WK. Identification and localization of an immunoreactive AMPA-type glutamate receptor subunit (GluR4) with respect to identified photoreceptor synapses in the outer plexiform layer of goldfish retina. J Neurocytol. 1997;26:651–666. doi: 10.1023/a:1018597811439. [DOI] [PubMed] [Google Scholar]
- 47.Sheng M, Kim E. The Shank family of scaffold proteins. J Cell Sci. 2000;113:1851–1856. doi: 10.1242/jcs.113.11.1851. [DOI] [PubMed] [Google Scholar]
- 48.Thoreson WB, Witkovsky P. Glutamate receptors and circuits in the vertebrate retina. Prog Retin Eye Res. 1999;18:765–810. doi: 10.1016/s1350-9462(98)00031-7. [DOI] [PubMed] [Google Scholar]
- 49.tom Dieck S, Sanmarti-Vila L, Langnaese K, Richter K, Kindler S, Soyke A, Wex H, Smalla K-H, Kämpf U, Fränzer J-T, Stumm M, Garner CC, Gundelfinger ED. Bassoon, a novel zinc-finger CAG/Glutamine-repeat protein selectively localized at the active zone of presynaptic nerve terminals. J Cell Biol. 1998;142:499–509. doi: 10.1083/jcb.142.2.499. [DOI] [PMC free article] [PubMed] [Google Scholar]
- 50.Vandenbranden CAV, Verweij J, Kamermans M, Müller LJ, Ruijter JM, Vrensen GFJM, Spekreijse H. Clearance of neurotransmitter from the cone synaptic cleft in goldfish retina. Vision Res. 1996;36:3859–3874. doi: 10.1016/s0042-6989(96)00134-4. [DOI] [PubMed] [Google Scholar]
- 51.Vardi N. Alpha subunit of Go localizes in the dendritic tips of ON bipolar cells. J Comp Neurol. 1998;395:43–52. [PubMed] [Google Scholar]
- 52.Vardi N, Morigiwa K, Wang T-L, Shi Y-J, Sterling P. Neurochemistry of the mammalian cone “synaptic complex”. Vision Res. 1998;38:1359–1369. doi: 10.1016/s0042-6989(98)00007-8. [DOI] [PubMed] [Google Scholar]
- 53.Walikonis RS, Jensen ON, Mann M, Provance DW, Jr, Mercer JA, Kennedy MB. Identification of proteins in the postsynaptic density fraction by mass spectrometry. J Neurosci. 2000;20:4069–4080. doi: 10.1523/JNEUROSCI.20-11-04069.2000. [DOI] [PMC free article] [PubMed] [Google Scholar]
- 54.Wässle H, Dacey DM, Haun T, Haverkamp S, Grünert U, Boycott BB. The mosaic of horizontal cells in the macaque monkey retina: with a comment on biplexiform ganglion cells. Vis Neurosci. 2000;17:591–608. doi: 10.1017/s0952523800174097. [DOI] [PubMed] [Google Scholar]
- 55.Wu SM, Gao F, Maple BR. Functional architecture of synapses in the inner retina: Segregation of bipolar cell axon terminals. J Neurosci. 2000;20:4462–4470. doi: 10.1523/JNEUROSCI.20-12-04462.2000. [DOI] [PMC free article] [PubMed] [Google Scholar]
- 56.Yazulla S, Studholme KM. Colocalization of shaker A-type K+ channel (Kv1.4) and AMPA-glutamate receptor (GluR4) immunoreactivities to dendrites of OFF-bipolar cells of goldfish retina. J Neurocytol. 1999;28:63–73. doi: 10.1023/a:1007015801586. [DOI] [PubMed] [Google Scholar]