

Abstract
We describe the effects of a recessive mutation on visual behavior, the electroretinogram (ERG), and photoreceptor structure in zebrafish. At 6 d post-fertilization (dpf), no optokinetic reflex could be elicited in no optokinetic response c(nrc) mutant animals under any test condition. The animals exhibited ERG responses at 5–7 dpf that were markedly abnormal and could be categorized into two groups. The first showed an initial negative a-wave followed by a delayed positive b-wave of small amplitude. Often a second ERG-like response was recorded after the initial b-wave. The second group showed only a large negative a-wave; an initial b-wave was not evident. In most recordings additional oscillatory waves varying in number, amplitude, and time course were observed. Multiple responses at the cessation of long-duration flashes were also observed. Light and electron microscopy revealed that the cone photoreceptor pedicles of nrcfish were highly abnormal. Although the appropriate number of synaptic ribbons formed in these terminals, they “floated” in the terminal, unassociated with postsynaptic processes or arciform densities. The few processes invaginating the nrc pedicles resembled those of horizontal cells. Invaginating bipolar cell processes were rare, but basal contacts were observed on pedicle surfaces. The severity of the mutation did not change between 6 and 8 dpf, showing that there is neither a delay in development nor a degeneration of the terminals; rather, nrc pedicle development appears arrested. Bipolar cell terminals in the inner plexiform layer made normal ribbon synapses; thus, the mutation appears to affect only the outer retina.
Keywords: retina, photoreceptors, ribbon synapses, electroretinography, electron microscopy, mutations, zebrafish
One approach to furthering our understanding of vertebrate visual mechanisms is to analyze animals with visual system mutations. Recessive mutations occur only rarely in nature, but zebrafish can be efficiently mutagenized and readily bred to homozygosity (Mullins et al., 1994; Solnica-Krezel et al., 1994). Furthermore, this vertebrate develops rapidly, has a relatively fast generation time, and possesses other characteristics that make it particularly suitable for mutagenesis screening.
Initial screens for recessive mutations in zebrafish focused on early development and searched for morphological abnormalities of the eyes and other organs (Malicki et al., 1996). However, many subtle and interesting recessive mutations lie at the molecular level and are not detectable in such screens; that is, the animals appear normal morphologically. To this end, we have developed a behavioral test to detect visually impaired zebrafish larvae at 5–7 d post-fertilization (dpf) (Brockerhoff et al., 1995). Stripes are passed in front of larvae to elicit the stereotyped visual tracking behavior of the optokinetic reflex (OKR). The eyes follow the stripes with a smooth pursuit movement, followed by a rapid saccade to return the eyes to their original position.
As a secondary screen, we routinely record the electroretinogram (ERG) from fish that fail to show a normal or any OKR. This field potential arises from the outer retina and provides information with regard to the functioning of the photoreceptors (a-wave) and second-order cells (b- and d-waves) (Dowling, 1987). So far we have described a mutant that shows a photoreceptor response, but no second-order cell activity, suggesting a defect in synaptic transmission in the outer retina (Brockerhoff et al., 1995), and a mutant that is red blind: it loses all of its red cones between 3 and 5 dpf (Brockerhoff et al., 1997). Other mutants that show an abnormal OKR have a normal ERG, suggesting that the mutation occurs proximal to the outer retina (Chung and Dowling, 1997).
Here we describe a mutant, no optokinetic response c(nrc), that appears to be completely blind. It shows no evidence of an OKR under any condition tested and displays an ERG that is always abnormal and often displays unique waveforms. Multiple b-waves and/or large oscillatory potentials are usually seen after the onset of the light, and multiple d-waves and/or oscillatory potentials occur at the cessation of a long (1.5 sec) stimulus. Histological analyses with both the light and electron microscope reveal abnormal photoreceptor terminals in the retinas of these animals. In brief, the development of the photoreceptor terminals appears arrested.
MATERIALS AND METHODS
Breeding and isolating mutant zebrafish. AB strain zebrafish, originally obtained from the University of Oregon (Westerfield, 1995), were maintained as an inbred stock in accordance with standard National Institutes of Health-approved protocols. The fish were reared on a 14/10 hr light/dark cycle in 28.5°C fish water containing 2 gm of Instant Ocean salts per gallon of distilled water supplemented with vitamins. Zebrafish were bred as described previously (Westerfield, 1995).
The nrc mutant (nrca14) was originally isolated in a mutagenesis screen in which N-ethyl-nitrosurea was used to induce DNA point mutations (Brockerhoff et al., 1997). Thenrc mutation segregates as a single recessive allele. It is maintained as a heterozygous stock. Heterozygous fish are mated with wild-type fish to transmit the mutation to the subsequent generation. We have maintained the mutation for several generations in this fashion.
The nrc mutant larvae were originally isolated at 4–7 dpf because of their failure to respond to the optokinetic test (Brockerhoff et al., 1995). For standard testing, 12–16 larvae in a Petri dish containing 4% methyl cellulose were placed inside a drum that had 18° black and white vertical stripes on the inside and rotated at 6 rpm. The drum was illuminated by incandescent room lights (1.64 μWatts/cm2, and every larva was examined with the drum moving in both directions.
The nrc zebrafish mutants die at ∼10–12 dpf, which is caused at least in part by starvation because they do not feed. Thus, for consistency, neither the mutants nor the wild-type siblings were fed before they were studied (up to 8 dpf). We observed no apparent morphological or physiological defects caused by lack of food in the wild-type larvae up to 8 dpf. After 8 dpf, both wild-type and mutant fish begin to look emaciated, and their retinas began to show some deterioration; for example, outer segments (OSs) were often swollen.
Electroretinography. Wild-type and nrc mutant zebrafish larvae (5–7 dpf) were dark-adapted for at least 2 hr before experimentation. They were anesthetized in 3-aminobenzoic acid methyl ester (100 μg/ml) in fish water (see above) for 1–2 min at room temperature until they stopped swimming. In dim red light, the larvae were placed on a piece of sponge so that one eye was on axis with the stimulus light beam, a 100 W halogen light with unattenuated intensity on the head that was 30,000 lux. The active electrode was a glass micropipette (tip diameter = 25–40 μm) filled with PBS with its tip placed on the cornea. The reference electrode was a chlorided silver wire in the recording chamber. The electrodes were connected to subsequent electronics by Ag-AgCl salt bridges. The ERGs were amplified by a high-gain (104×) amplifier (Axoprobe 1A, Axon Instruments, Foster City, CA), bandpass-filtered (0.18–40 Hz), and displayed on an oscilloscope. The responses were processed through an analog-to-digital converter, and a special purpose laboratory computer program was used for signal averaging and the generation of the stimulus. ERGs, elicited by short-duration (10–100 msec) or long-duration (300–1500 msec) photic stimuli were recorded, usually over a 6 log unit range of stimulus intensities achieved by inserting neutral density filters in the stimulus beam. Two to eight consecutively elicited ERGs were typically averaged.
Histological methods. Unless stated otherwise, zebrafish were fixed in the morning, 2–3 hr after the lights were turned on. Whole embryos and larvae were anesthetized in 4°C tank water and placed into primary fixative for 15 min at 4°C. The primary fix was made fresh daily and consisted of 1% paraformaldehyde, 1.6% glutaraldehyde, 0.15 mmCaCl2, and 3% sucrose in 0.06m phosphate buffer, pH 7.4. The tissue was rinsed and post-fixed in 2% osmium tetroxide in phosphate buffer for 0.5 hr at 4°C and 1.5 hr at room temperature. The tissue was rinsed again in the phosphate buffer and in 0.05 m maleate buffer, pH 5.9, before being processed in a solution of 2% uranyl acetate in maleate buffer. Specimens were dehydrated in a graded series of ethanol and immersed into propylene oxide for 20 min, before infiltration with Araldite/Epon resin. The tissue was cured for 72 hr at 60°C.
For light microscopy (LM), 0.5–1 μm sections were cut with glass knives on a microtome, mounted on microscope slides, and stained with an aqueous solution of 1% borax, 1% methylene blue chloride, and 1% azure II. The sections were protected by Permount and a coverslip and photographed under bright field on a Nikon Microphot-FX1 microscope. For electron microscopy (EM), 60–80 nm sections were mounted on slot grids, post-stained with lead citrate and saturated uranyl acetate, and viewed in a Hitachi transmission EM.
RESULTS
Optokinetic reflex testing
Homozygous nrc larvae did not track the drum stripes or show any type of behavioral response to a light–dark stimulus under the standard testing conditions. The mutant fish occasionally made spontaneous eye movements, indicating that they were able to move their eyes. Wild-type zebrafish larvae at 4–6 dpf are immobile for much of the time and lie on the bottom of the container. They do swim sporadically in a quick darting motion. The mutant zebrafish tended to be less mobile than their wild-type siblings; however, the swimming motions that they performed looked normal. In addition, both the wild-type and nrc larvae rapidly swam away when their sides were lightly touched with the blunt end of a pin. No obvious brain abnormalities were observed in the mutant fish. However, except for the pineal, which appeared normal in the nrc mutant, histological examination of various brain areas was not undertaken.
Because ERG responses were consistently observed in homozygousnrc larvae (see below), the OKR responses of 6 dpf larvae were systematically tested over a range of conditions to determine whether tracking could be elicited under any conditions. After being phenotypically identified by OKR testing using our standard conditions (see Materials and Methods), sibling wild-type and nrclarvae were allowed to recover in fish water for 15 min to 1 hr. (Although sibling larvae were labeled as “wild-type” based on their behavioral phenotype, this group includes animals that are either heterozygous or homozygous for the normal gene. We did not detect any behavioral or morphological variability within this group.) Four different wild-type and mutant larvae were studied under each testing paradigm, with standard conditions being maintained except for the altered condition. First, we tested whether slowing (3 rpm) or speeding (12 rpm) the drum would allow the fish to respond. Next, the animals were tested at various drum speeds with wide (36°) or thin (9°) stripes. Light intensity was also altered by using an adjustable white light source to illuminate the drum. The threshold for 6 dpf wild-type larvae to perform the test was determined to be 0.22 ± 0.03 μW/cm2. The OKR of the nrclarvae was then tested over a range of intensities. The light level was gradually raised from the wild-type threshold level to a light intensity 4 log units higher. The wild-type fish tracked the stripes under all testing conditions, whereas the nrc larvae never displayed an OKR. We also tested whether the animals would display a visual startle response by passing a shadow over them. Again, no evidence that the animals could respond behaviorally to a visual stimulus was obtained.
Electroretinography
ERGs recorded from the eyes of two 6 dpf larvae, an nrcmutant, and its wild-type sibling are shown in Figure1. The responses, elicited by short-duration (10 msec) light flashes, were recorded over 6 log units of stimulus intensity. In the wild-type eye (Fig.1A), the waveform was dominated by the corneal positive b-wave (vertical arrow) with an initial corneal negative a-wave occasionally discernible (upward slanted arrows). The amplitude of the b-wave increased as a function of flash intensity.
Fig. 1.

ERGs recorded from a wild-type (A) and nrc mutant (B) 6 dpf zebrafish larvae. The responses were elicited by 10 msec light flashes, and the intensity of successive flashes (from bottom to top) increased by 1 log unit. On the right of each record is indicated the log attenuation of the maximum intensity (30,000 lux) flash. A varying number (n = 2–8) of individual ERGs were computer averaged for each response shown. Zebrafish ERGs typically consist of an initial small a-wave (upward slanted arrows) followed by a pronounced b-wave (vertical arrows). This is observed in both the wild-type (A) andnrc mutant (B) ERGs, but note the additional ERG-like responses (asterisks) and slow oscillatory waves (downward slanted arrows) in the mutant ERG.
The ERG recorded from the nrc mutant was dramatically different from that of its wild-type sibling. Although clear a- and b-waves were observed at all stimulus intensities, a second response consisting of both an initial corneal negative wave followed by a larger corneal positive was seen (Fig. 1B,asterisks). These second responses closely resembled the initial a- and b-wave responses; it appeared that this retina was generating double a- and b-waves. In addition, prominent slow oscillations followed the second a- and b-waves at most stimulus intensities (i.e., at log I = −5, −4, and −2;downward slanted arrows).
Voltage-intensity curves for wild-type and nrc b-waves are given in Figure 2A. Each point represents data obtained from 4–11 wild-type fish and from 7–19 nrc fish. Compared with the b-wave of the wild-type siblings, the mean maximum amplitude of the mutant fish b-wave was smaller, and it saturated at a lower light intensity than did the wild-type b-wave response. Furthermore, the nrc mutants were on average approximately 1 log unit less sensitive to light than their normal siblings. Figure 2B shows mean implicit (stimulus to peak) times for the initial b-wave and the second b-wave-like response in nrc recordings as a function of stimulus intensity. These times are long compared with the implicit times of the initial b-waves in the wild-type retinas. For both wild-type and nrc mutant larvae, the b-wave implicit times decreased as a function of stimulus intensity. In the wild-type sibling, the mean implicit times ranged from ∼0.15 sec at threshold to 0.06 sec with bright-light stimuli, whereas for the nrcmutant, the average implicit time ranged from ∼0.25 at threshold to 0.12 sec with 4 log unit brighter stimuli. In other words, thenrc b-wave response to a light stimulus was much delayed as compared with the wild-type b-wave. The delay of the second response in the nrc recordings, on the other hand, increased as a function of stimulus intensity. The mean implicit time for the positive wave of the second b-wave increased from ∼0.35 sec at threshold to 0.70 sec with a 4 log unit brighter stimulus (Fig.1B).
Fig. 2.

A, A comparison of ERG b-wave amplitude as a function of stimulus intensity (voltage-intensity curves) for wild-type and nrc mutant fish. These data were obtained from 4–11 wild-type fish and 7–19 nrcfish. The × and ▿· data points are from Figure 1,A and B, respectively. The mutant b-wave was on average ∼1 log unit less sensitive to light, and its maximum amplitude was smaller than that of the wild-type b-wave.B, A comparison of implicit time (stimulus to peak) of the ERG b-wave as a function of stimulus intensity fornrc mutant and normal sibling larvae. These data were obtained from 2–13 wild-type and 4–21 nrc fish. The mean b-wave implicit time for the nrc mutant was almost twice as long as that for the normal siblings. Notice that the implicit time for the second ERG-like response increases tremendously as a function of intensity. The × data points are from Figure 1. The error bars in both A and B are SDs.
The waveforms of the ERGs recorded from nrc mutants were highly variable but could be categorized into two groups. In 63% of the mutants (group A; n = 32), the initial negative a-wave was followed by a positive b-wave (Fig.3B). In group B (37%;n = 19), only an initial prominent a-wave was recorded; the initial b-wave was absent (Fig. 3A). However, additional ERG-like responses and/or slow oscillations were invariably recorded in both groups. They followed the initial b-wave or the a-wave when the initial b-wave was absent. We further observed that the waveform and amplitude of the various responses varied considerably over time in the same preparation. Some of this variability was caused by noise; thus, two to eight consecutive ERGs were typically averaged.
Fig. 3.

ERG responses recorded from threenrc mutants at 6 dpf. A, Responses elicited a few minutes apart from the same animal with the same flash intensity (log I = 0), showing the variability of response waveform that was typically recorded over time.B, Responses from two other mutants, illustrating the variety of response waveforms recorded from different animals.
In 11 of 17 group A animals in which short-duration (10–50 msec) flashes were used, the initial ERG was followed by additional responses having features resembling the normal ERG, as in Figure1B. In some cases, the initial ERG response was missing, and only the second-ERG like response was recorded. In addition to a second ERG-like response, most traces showed three to five slow, positive oscillatory potentials. Typical variations in response to short (20–50 msec) flashes are shown in Figure 3. The responses shown in A were obtained with the same flash intensity a few minutes apart in the same preparation. In neither record is an initial b-wave-like response observed. Slow positive oscillations are observed in both records, particularly in the lower one in which the initial oscillations are somewhat faster and have some resemblance to b-waves. In Figure 3B, records are shown from two different fish in which the initial responses strongly resemble normal a- and b-waves. These responses are followed by a series of responses, some of which look like the initial ERG-like responses, others of which are slower and more oscillatory in nature.
In response to prolonged light flashes (1–2 sec), the ERG of wild-type zebrafish demonstrates a prominent OFF-response consisting mainly of a corneal positive d-wave. Preceding the d-wave, which like the b-wave is thought to originate from second-order retinal cells (see Discussion), is a small corneal negative wave of unknown origin. Innrc mutants, variations in the OFF-responses are also prominently seen. Indeed, OFF-responses in nrc mutants are often observed to be larger than the OFF-responses of wild-type fish and more prominent than the ON-responses recorded to the same flash. Figure 4 shows the responses of a mutant fish to a 1.5 sec flash of light over a range of intensities. At intermediate intensities (log I = −1, −2, and −3), small initial a- and b-wave-like responses (arrows) were followed by oscillatory potentials that gradually died away. At light offset (log I = −2 and −3), small OFF-responses, typical of a normal d-wave, were seen (arrows). However, large potential swings followed that were saw-tooth in nature and, in some cases, consisted of as many as three to seven potential saw-tooth swings. As with the ON-responses, the OFF-responses recorded fromnrc mutants varied among preparations and from flash to flash.
Fig. 4.

ERGs elicited with 1.5 sec light flashes from annrc mutant. Responses were recorded over 4 log units of intensity; log attenuation of the maximum flash intensity is indicated to the right of each trace. The initial ON b-wave and OFF d-wave (arrows) were small in amplitude. After both the b- and d-waves, additional waves were recorded. Often, as here, the additional waves that occurred after the d-wave in the mutant animals were as large or larger than those that occurred after the b-wave.
Histology
Low-power light microscopy revealed that the overall structure and size of the 6 dpf nrc retina is quite similar to that of the wild-type retina when viewed in transverse section. The lamination of the mutant retinas appears quite normal and consists of three nuclear and two plexiform layers. In addition, the pigment epithelium (PE) and the lens are comparable in appearance to those of wild-type retinas. At higher magnification, however, abnormalities can be detected with the light microscope in two areas of the nrc retina. First, there is an increase in the number of the lightly staining lipid droplets in the mutant PE; lipid droplets are only occasionally seen in the wild-type PE at this age. Second, the nrc outer plexiform layer (OPL) appears thin or even absent in places (Fig.5B, open arrows). This is strikingly different from the wild-type OPL in which a well defined layer of pedicles is easily distinguished (Fig. 5A,black arrows). The few pedicles observed by light LM in thenrc mutant also appeared abnormal (Fig. 5B,black arrow).
Fig. 5.

Light micrographs of 6 dpf zebrafish retinas shown in transverse sections. A, Short single cones and a population of distal cones are seen in the wild-type retina. Pedicles are obvious, lining the distal border of the OPL (black arrows). B, Short single cones and distal cones are also present in nrc retinas, and they generally appear normal as here. However, the OPL is thinner and appears missing in some areas (open arrows). The few recognizable pedicles look abnormal (black arrow). Excessive lipid droplets are present in the PE. In this section, horizontal cell profiles are not evident; however, in most sections, normal-appearing horizontal cell bodies are seen. Scale bar, 7 μm.
These abnormalities were examined further by EM. To ensure that corresponding regions of the eyes were studied, retinas were transversely cut to the depth of the optic nerve. Analysis was limited to the central third of the retinas, directly dorsal to the optic nerve. [This area is illustrated in Schmitt and Dowling (1999), their Fig. 8a, region “d”]. All LM and EM observations were made in this central retinal region. In the following description, nrefers to the number of fish studied. Several sections from both eyes of each fish were usually examined.
Photoreceptor outer segments, lipid droplets, and phagosomes
Cones in both the 6 dpf wild-type and nrc larvae (n = 8) had normal-appearing OSs made up of tightly packed laminae stacked into the characteristic cone shape. Normal appearing ellipsoid mitochondria (M) were found distally in the inner segments. These features are shown innrc retinas in Figure 6. Flat (tangential) sections through the photoreceptors of both wild-type and mutant cones showed that the connecting cilia and calycal processes of these cells were indistinguishable (n = 4; data not shown).
Fig. 6.

The distal portions of the nrccones look quite normal, having outer segments (OS) with tightly packed membrane disks and ellipsoid mitochondria (M). A, A large number of electron-lucent lipid droplets (D) are seen in the PE of the nrc retina. B, Numerous phagosomes (P) are also seen in thenrc PE. Scale bar, 1.5 μm.
As observed in LM sections, however, we frequently saw an increase in the number of lipid droplets in the PE, which appeared in the EM as electron-lucent structures (Fig. 6A). An increase in the number of phagosomes in the nrc PE was also observed (Fig. 6B). They appeared as whorls of membranes and frequently had an electron-lucent core. To quantify the differences between wild-type and mutant fish, the number of phagosomes and lipid droplets were counted in transversely cut retinas at a magnification of 8000×. Analysis was limited to sections with the optic nerve in the field of view for standardization purposes. Twenty nonadjacent sections from four wild-type and four nrcretinas were analyzed. The number of phagosomes and lipid droplets was reported as the number per 200 μm of PE. These quantitative data confirmed that there were significantly more lipid droplets (10.11 ± 1.20 vs 6.39 ± 0.91) and phagosomes (17.05 ± 0.87 vs 5.93 ± 0.80) per 200 μm of PE in the nrc fish as compared with wild-type animals (p > 0.05).
An increased number of lipid droplets and phagosomes are often seen in the PE of older animals, in light-damaged animals, and in certain retinal degenerative diseases (Zinn and Marmor, 1979). The fact that the nrc outer segments appear normal suggests that the PE in the nrc mutant may not phagocytose outer segment debris at a normal pace. Alternatively, the OSs in the nrc fish may be turning over at a faster rate. However, the fact that the outer and inner segments of the nrc photoreceptors appear quite normal suggests that the major defect in these animals lies elsewhere.
Photoreceptor terminals
The second abnormality evident in the mutant retina, namely abnormal or absent photoreceptor synapses, was also studied by electron microscopy, and our observations suggest that these abnormalities may underlie the severe behavioral and physiological deficits shown by thenrc fish.
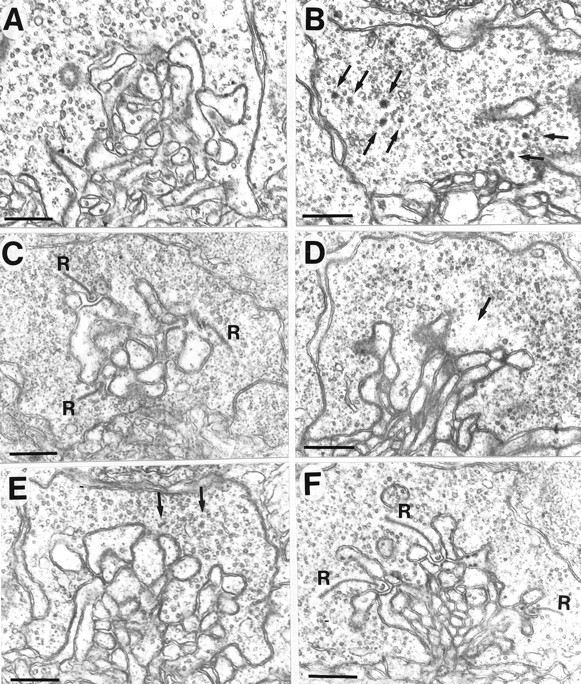
Cone pedicles of wild-type 6 dpf larval zebrafish typically contain several synaptic ribbons, which with associated arciform densities (Ladman, 1958) characterize the presynaptic features of the ribbon synapses (Stell, 1965) (Fig.7A,B). Postsynaptic processes typically invaginate into the pedicles in a single tight bundle and terminate adjacent to the ribbons in a triadic formation, although the triadic arrangement can often be difficult to discern. Horizontal cell processes flank the synaptic ribbons, whereas bipolar cell dendrites are located centrally in the triad (Stell, 1967;Stell et al., 1977; Saito, et al., 1985). This can be deduced because bipolar cell dendrites typically appear darker and smaller in EM sections than do horizontal cell processes. In the light-adapted state, the horizontal cell processes also extend out finger-like spinules with characteristic electron-dense patches on their tips (Wagner, 1980;Sakai and Naka, 1985), which also facilitates identification of horizontal cell processes (Fig. 7A, arrowheads). Synaptic vesicles typically surround the ribbons but are also found evenly distributed throughout the terminal.
Fig. 7.

A, In the wild-type retina, bipolar and horizontal cell processes invaginate the pedicle in a tight bundle (arrow). Horizontal cells (H) are easily recognized by their large size, electron-lucent cytoplasm, and characteristic densities (small arrowheads). Synaptic ribbons (R) are associated with the presynaptic membrane via an arciform density (curved arrow).B, Basal contacts (B) are found in wild-type cones between the ribbon synapses. Inset, Under high power, the basal contacts show fluffy cytoplasmic material on both sides of the junction and filaments that span the membranes. Synaptic vesicles (V) surround the synaptic ribbons (R). C, In thenrc retina, synaptic ribbons (R) in most of the pedicles appear to be floating in the cytoplasm, unassociated with an arciform density and the presynaptic membrane. Few postsynaptic processes invaginate the pedicles; however, when present, their large size and electron-lucent appearance suggest that they are horizontal cell processes (H). Many of these processes have small densities (arrowheads), characteristic of horizontal cell processes. Basal contacts are made onto bipolar cells at the base of the pedicle (B). Synaptic vesicles (V) often clump and fail to distribute evenly in the pedicle. However, they surround synaptic ribbons as they do in wild-type pedicles (small arrows). Scale bar, 0.5 μm.
Basal contacts between cone photoreceptors and bipolar cells are also seen in wild-type pedicles between the synaptic ribbon complexes (Dowling, 1974; Stell et al., 1977) (Fig. 7B,b). They are distinguished by an arc-like shape of the junction and fluffy cytoplasmic material on each side of the membranes (Fig. 7B, inset). In some cases, fine filaments can be distinguished running between the membranes. Basal junctions are most obvious in terminals that are cut at a slight tangent to the transverse orientation; even then, clear examples of the structures are distinguishable in only ∼5–10% of the pedicles.
Pedicles in the nrc mutant appear dramatically different from those in the wild-type retina. Two nrc pedicles with typical abnormal morphology are shown in Figure 7C. First, fewer postsynaptic processes appear to invaginate into thenrc terminals as compared with wild-type terminals. Furthermore, most of the processes that do enter the pedicle are large and electron lucent, characteristic of horizontal cell processes. As seen in the left pedicle, these processes also often have electron densities similar to the densities observed in horizontal cell spinules. Thus, most of the processes invaginating into thenrc pedicles appear to be horizontal cell processes; bipolar cell processes are rarely seen to invaginate into these terminals. However, basal contacts made along the vitreal surfaces of the pedicles in nrc retinas are observed (Fig. 7C,b), suggesting at least some synaptic contact between the nrc photoreceptors and bipolar cells.
Figure 7C also shows that although synaptic ribbons are plentiful in the mutant pedicles and have roughly the same length and appearance as in wild-type terminals, they usually appear to be “floating” in the cytoplasm. They are not in proximity to postsynaptic processes and are rarely associated with an arciform density and a presynaptic membrane. Synaptic vesicles frequently line up along the ribbons as they do in the wild-type retina, but they are usually not very evenly distributed throughout the terminal; rather, they often are arranged in clusters.
The pedicles shown in Figure 7C are representative of the great majority of terminals in the nrc retina. Normal photoreceptor terminals were never seen in the mutant retinas. In rare instances, a thin bundle of processes invaginated into thenrc terminals; however, there were far fewer processes in such a bundle than the number that typically projects into wild-type terminals. Occasionally the ribbons in nrc terminals appeared to be making a synapse. In virtually all such cases, however, only two postsynaptic processes were seen, and these appeared to be horizontal cell processes.
To extend our observations of a reduced number of invaginating process in nrc pedicles, flat (tangential) sections were cut through mutant retinas and compared with similar sections from wild-type retinas. The dotted line shown in Figure8A approximates the depth of the flat sections shown in Figure 8, B andC. In the wild-type pedicle, numerous processes are seen in the center of the terminal (Fig. 8B). Four ribbons encircle central bipolar cell dendrites and are flanked by large horizontal cell processes. The ribbons are closely apposed to the presynaptic membrane and are associated with arciform densities. Synaptic vesicles surround the ribbons and are evenly distributed throughout the terminal.
Fig. 8.
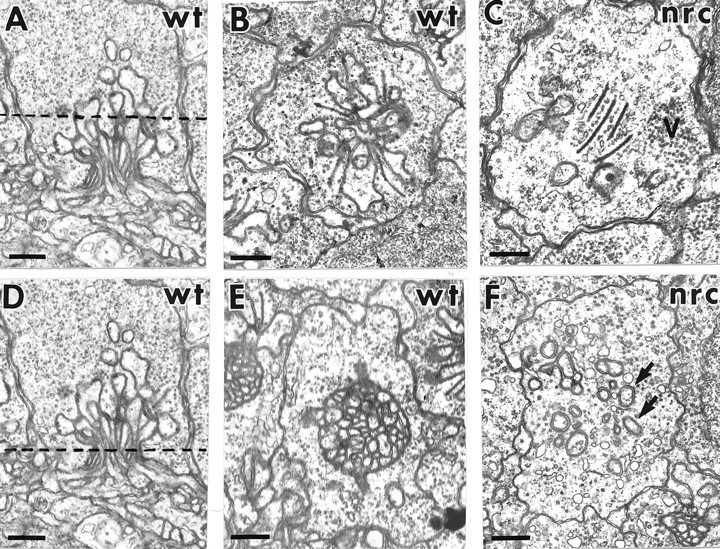
Flat (tangential) sections cut through wild-type and nrc pedicles. The dotted line shown in A approximates the depth of the sections shown inB and C. B, Numerous invaginated processes are seen in the center of the wild-type pedicle. Four ribbons encircle central processes and are flanked by large horizontal cell processes. They are associated with arciform densities. Synaptic vesicles line the ribbons and are evenly distributed in the terminal. C, An nrc pedicle sectioned at the same depth shows multiple ribbons in the center of the terminal. Few postsynaptic cell processes invaginate the pedicle, and they rarely appear to be in close apposition with the ribbons. Their large size suggests that they are horizontal cell processes. Vesicles surround the ribbons, but they also cluster in one area of the terminal (V). The dotted line shown in D approximates the depth of the flat sections shown in E and F. E, The secondary cells invaginate into the terminal in a very tight bundle in the wild-type terminal. F, In contrast, few processes invaginate into the nrc terminal, and those that do insert individually (arrows, F). Scale bar, 0.5 μm.
Pedicles from nrc retinas appear quite different when sectioned at the same depth (Fig. 8C). Few processes invaginate the terminals, and only occasionally do they appear to be in close apposition with the ribbons. Furthermore, the ribbons often line up in the center of the pedicle. Vesicles line the ribbons but also cluster in other areas of the pedicle. The large size of the few invaginating processes suggests that they are horizontal cell processes.
In Figure 8D, the dotted line traversing the wild-type terminal estimates the depth of the flat sections shown in Figure 8, E and F. In the wild-type terminal, the processes invaginating into the terminal do so in a very tight bundle (Fig. 8E). In contrast, few invaginating processes are seen in the nrc terminal, and the few processes observed appear to insert individually (Fig.8F).
We attempted to identify rod spherules in the 6 dpf zebrafish retina on the basis of criteria used to distinguish these terminals from pedicles in other species (Braekevelt, 1992). Cone pedicles are larger and more electron lucent, and they have more invaginating processes than do spherules. Rods typically have one ribbon per terminal, whereas cones have multiple ribbons. In the 6 dpf zebrafish retina, nearly all of the terminals have the characteristics of cone pedicles. Terminals having some of the characteristics of rod spherules were seen occasionally; however, without serial sectioning, we could not confirm that they were spherules. In the 6 dpf zebrafish retina, there are relatively few rods present in the central retina, probably accounting for the apparent paucity of rod spherules.
To determine whether other retinal synapses were affected by thenrc mutation, we studied synapses in the inner plexiform (IPL) layer of both mutant and wild-type retinas. Both conventional synapses, mostly made by amacrine cells, and ribbon synapses made by bipolar cells are found in this layer by 6 dpf. In contrast to the ribbon synapses in the OPL of the nrc retina, those in the IPL appeared to be normal (data not shown). Short synaptic ribbons in association with an arciform density, and two postsynaptic processes forming a dyad, were observed in IPL terminals in both wild-type andnrc retinas. Vesicles were evenly distributed in these terminals, and typical conventional synapses were also seen in the inner plexiform layer of both wild-type and mutant retinas.
Quantitation of the morphological features of nrc and wild-type pedicles
To quantify the nrc pedicle abnormalities, we studied 50 transversely sectioned pedicles from wild-type and mutant retinas at 6 dpf. Only pedicles with at least one ribbon in the field were included in the study, but otherwise the examined pedicles were consecutive. The results are shown in Table1. The number of ribbons per pedicle (row 3) was not statistically different between the wild-type and mutant populations; however, there was somewhat more variability in thenrc terminals (1.46 ± 0.54 vs 2.10 ± 0.93). We also conducted an ultrastructural analysis to assess the number of floating ribbons in the OPL terminals by recording how many ribbons were associated with an arciform density. Although 71% of wild-type ribbons had an associated arciform density in the plane of section (i.e., appeared to be making a synapse), only 14% of the mutant ribbons were so associated. These quantitative data confirm our qualitative observations.
Table 1.
Ultrastructural characteristics of cone pedicles fromnrc and wild-type retinas (6 and 8 dpf)
| Wild-type | nrc | |||
|---|---|---|---|---|
| Day 6 | Day 8 | Day 6 | Day 8 | |
| Pedicles | 50 | 50 | 50 | 50 |
| Synaptic ribbons | 73 | 75 | 105 | 86 |
| Ribbons/pedicle1-a | 1.46 ± 0.54 | 1.53 ± 0.65 | 2.10 ± 0.93 | 1.75 ± 0.88 |
| Ribbons with arciform density1-b,1-c | 71% | 67% | 14% | 17% |
No statistically significant difference between the four conditions (p = 0.05).
No difference between wild-type dpf 6 and 8 or nrc dpf 6 and 8 (p > 0.05).
Statistically significant difference between wild type and nrc at both ages (p < 0.05).
To test whether the nrc abnormality reflects a delay in pedicle development, we next compared pedicles from 6 dpf retinas with those from 8 dpf larvae. There were no statistically significant differences between the ultrastructural features at the two ages in wild-type animals. A similar number of ribbons were present in pedicles at the two ages (row 3; 1.46 ± 0.54 vs 1.53 ± 0.65), and the number of ribbons associated with the presynaptic membrane via an arciform density was very similar (row 4): 71% of ribbons at 6 dpf and 67% at 8 dpf had an arciform density in the plane of section, indicating that a similar number of ribbons were docked to the presynaptic membrane.
In mutant fish, there were also no statistical differences between the severity of the mutation at 6 and 8 dpf. For example, there were 2.10 + 0.93 synapses per pedicle in the 6 dpf mutant retinas and 1.75 + 0.88 in the 8 dpf retinas. There were also no statistically significant differences between the number of ribbons associated with an arciform density between the two ages (14 vs 17%). These data indicate that thenrc abnormality is “stable” in the sense that the older 8 dpf mutants are no better or worse than the 6 dpf mutants; no deterioration in terminal structure is occurring nor are the terminals still maturing between these ages.
Development of cone pedicles
To gain further insight into the nature of the morphological abnormalities in the nrc photoreceptor terminals, we studied the development of pedicles in wild-type animals. Cone pedicles from the dorsal–central retina were examined between 65 and 75 hr post-fertilization (hpf) (n = 4 at each age), the critical period for pedicle development in the zebrafish central retina. We observed that during pedicle development, postsynaptic processes first invaginate the terminals at ∼65 hpf (Fig.9A). Next, small densities, precursor to the synaptic ribbons, appear in the pedicles at ∼67 hpf (Fig. 9B) [in the rat, these have been called small round precursor bodies (srPBs) (Hermes et al., 1992)]. The densities then aggregate, being joined initially by filamentous material (Fig. 9,inset). By 69 hpf, some pedicles appear to be quite mature; short ribbons are apposed to postsynaptic processes via an arciform density (Fig. 9C, right pedicle). Most often the processes are arranged in a triadic structure; however, they occasionally form monads or dyads at the ribbons.
Fig. 9.

Cone pedicles in the developing wild-type retina.A, At 65 hpf, postsynaptic processes have invaginated into the pedicle (asterisks). B, By 67 hpf, srPBs can be seen in some terminals (arrow).C, At 69 hpf, some pedicles resemble the terminal on theleft, having invaginated postsynaptic processes and srPBs (arrows). Others resemble terminal 2 (right), having short synaptic ribbons that form triad synapses. Inset, Occasionally, srPBs are seen to be in the process of aggregating into synaptic ribbons with filaments joining them (arrowhead). Scale bar, 0.5 μm.
The time points given above estimate when the various ultrastructural features are first present. It is important to note, however, that terminal development is staggered. For example, in Figure 9Cthe pedicle on the right is quite mature, whereas the pedicle on the left has just begun to form synaptic ribbons and only displays srPBs. However, by 75 hpf all terminals in the central retina appeared mature. We did not see appreciable changes in the complexity of the central cone pedicles thereafter, suggesting that these synapses were relatively mature by this time.
Plasticity of OPL synaptic ribbons
To determine whether the synaptic ribbons in the nrcretinal photoreceptor terminals display normal behavior, we studied synaptic ribbons in wild-type and mutant retinas at various times during the day and night. In fish, synaptic ribbons typically disassemble into srBPs and disappear at night and then reform the next day (Wagner, 1973; Garcia et al., 1998). To see whether synaptic ribbons in wild-type zebrafish OPL show a difference between day and night, 6 dpf wild-type larvae were fixed in the dark 3 hr after the lights were normally turned off (1 A.M.; n = 6). In these retinas, many of the pedicles had no synaptic ribbons, as shown in Figure 10A. Occasionally, electron-dense structures characteristic of the srPBs seen in embryonic development were observed in the pedicles.
Fig. 10.
A, Wild-type larva (5.5 dpf) fixed 3 hr after lights were turned off at night (1 A.M.). Very few ribbons or srPBs were present in the terminals. B, Synaptic ribbons in nrc pedicles had disaggregated by 3 hr after lights were turned off (5.5 dpf; 1 A.M.). No long ribbons were seen in the pedicle; however, srPBs were present (arrows). C, E, Wild-type larva placed in constant dark on the evening of 5 dpf and fixed the following day at 11 A.M. or at 1 A.M. At 11 A.M. (C), numerous ribbons (R) were present. At 1 A.M. (E), the ribbons had disappeared and a few srPBs were observed (small arrows). D, F, Wild-type larva placed in constant light on the morning of 6 dpf and fixed at 1 A.M. or 11 A.M. the next day. D, At 1 A.M. the ribbons had disappeared; the small arrow points to a remaining srPB.F, At 11 A.M. the next day, long ribbons (R) were present associated with arciform densities. Scale bar, 0.5 μm.
To test whether this phenomenon was caused simply by dark adaptation, wild-type larvae were dark adapted for 3 hr in the middle of the day (noon to 3 P.M.) and fixed in the dark at 3 P.M. (n = 3). Full-length synaptic ribbons persisted in the terminals, anchored to the postsynaptic membrane with arciform densities. Furthermore, the ribbons were approximately the same length as those in siblings kept under normal lighting conditions (data not shown).
The above results suggest that the plasticity of ribbons in the zebrafish pedicles is a circadian phenomenon. To test this possibility, wild-type larvae were kept in constant darkness or constant light (n = 4). For constant dark experiments, wild-type larvae were raised under normal lighting conditions throughout the night at 5 dpf. After this, they were kept in constant darkness and fixed (in the dark) the next day at 11 A.M. or the following night at 1 A.M. We found that ribbons were present during the subjective day (11 A.M.) (Fig. 10C), but they had disintegrated into srPBs and had disappeared during subjective night (1 A.M.) (Fig.10E).
To test whether ribbon structure is maintained in constant light, wild-type larvae were raised in normal lighting conditions until 6 dpf. They were then kept in constant light and fixed during the night (1 A.M.) or the following day (11 A.M.). Although the ribbons did not completely disappear in all of the terminals in subjective night (1 A.M.), and srPBs were often present (Fig. 10D), the ribbons that were present the next subjective day (11 A.M.) were extremely long (Fig. 10F).
Finally, to examine whether synaptic ribbons in nrc pedicles maintain a similar cycle of disintegration and regeneration, we examined the pedicles in four mutant larvae that were fixed at 1 A.M., 3 hr after lights off. As was the case for wild-type terminals that were fixed at night, many of the nrc terminals had no synaptic ribbons present but instead showed many srPBs (Fig.10B). We conclude that the ribbons in nrcphotoreceptors behave as ribbons do in the wild-type retina and that they too are likely to be under circadian control.
DISCUSSION
The nrc mutant is characterized by a highly unusual ERG and abnormal, immature-appearing photoreceptor terminals. We think it likely that these two abnormalities are linked and, furthermore, that the failure of the nrc mutant animals to display an optokinetic reflex is caused by these outer retinal defects. In support of these conclusions is our observation that the inner plexiform layer of the nrc mutant is quite normal in appearance. Furthermore, the nrc mutants also show occasional spontaneous eye movements, suggesting that the mutant animals are capable of moving their eyes.
Electroretinography
In all ERG recordings from 5–7 dpf nrc fish, a corneal a-wave was present. The a-wave is generated primarily by the outer segments of the photoreceptors; hence nrc larvae possess functional photoreceptors, which correlates with our observations of normal-appearing outer and inner segments in nrc retinas. In wild-type larvae, the a-wave is often hard to discern (Fig.1A). Thus, a careful comparison of a-waves between wild-type and mutant fish is difficult. Our preliminary observations suggest that the latency of the nrc a-wave is slightly longer than that of the wild-type a-wave, but the differences are not significant, except perhaps at low stimulus intensities (<logI = −5). More recent work that evaluated the pharmacologically isolated a-wave suggests that phototransduction is normal in nrc photoreceptors, although there does appear to be a defect in photoreceptor light adaptation (Van Epps et al., 2001).
On the other hand, in all recordings the corneal b-wave was abnormal. The degree of abnormality varied from a reduction in amplitude and increase in the implicit time of the b-wave (60% of recordings; group A) to its total extinction (40% of recordings; group B). Whether there was an abnormal or absent initial b-wave, multiple b-wave-like potentials and/or slow oscillations varying in number, amplitude, and time course were almost always observed in the ERGs of nrcmutant fish. Highly abnormal OFF-responses, including multiple waves, were also typically recorded at the cessation of a long stimulus.
The abnormal photoreceptor terminals in the nrc mutant are believed to be mainly cone pedicles and are characterized by a paucity of invaginating processes. The few invaginating processes seen in the terminals appear to be horizontal cell processes. Synaptic ribbons were often seen floating in the terminals, unassociated with postsynaptic processes. Basal contacts onto presumed bipolar cell dendrites were observed; however, they were on the vitreal surfaces of the terminals and not within the terminals, as is the case for normal zebrafish pedicles.
How might the abnormalities observed in the nrcphotoreceptor terminals give rise to the unusual and variable ERG b-wave responses? The b-wave derives ultimately from the activity of ON-bipolar cells that in the normal retina receive their input mainly (but probably not exclusively) at the ribbon synapses. The synaptic ribbons are believed to serve as “conveyer belts,” ensuring fast continuous release of neurotransmitter from synaptic vesicles onto the ON-bipolar cells (Gray and Pease, 1971; von Gersdorf et al., 1996). Disruption of the ribbon synapse could lead to delays or even failure in the passing of information from the photoreceptors to the ON-bipolar cells. Such delays and failures could account for the reduced b-wave amplitudes and increased implicit times noted in the nrcmutant and the failure to generate an initial b-wave in some animals. Furthermore, even when a message is transmitted, there perhaps could be a lack of synchrony of the synapses in the same and different pedicles. This might give rise to the multiple b-waves and to the oscillations typically observed in the nrc ERG. It could also account for the variability of the responses. In support of these ideas, it has been shown that ERGs obtained from 3–4 dpf zebrafish larvae do not show a well defined b-wave but instead show large amplitude oscillations that resemble those seen in many nrc recordings (Seeliger et al., 1998). At 3–4 dpf, many of the photoreceptor terminals are still quite immature and show a number of floating ribbons similar to those observed in nrc terminals at 6–8 dpf. At least some of the variety of waveform, and perhaps the oscillations we observe in the nrc mutant, can be a reflection of the apparent immaturity of the terminals.
We also observe abnormalities in the ERG at the termination of a prolonged stimulus. In normal animals, the prominent response at the cessation of prolonged illumination is the d-wave, a corneal positive response that is believed in many species to derive from the OFF-bipolar cells (Gurevich and Slaughter, 1993). In zebrafish, the d-wave is selectively abolished when a specific antagonist to the OFF-bipolar cells is applied to the retina (Wong et al., 2000). OFF-bipolar cells appear to receive much of their synaptic input from basal synapses, which in the nrc mutant are present but mislocated. In the nrc mutant retina, basal synapses are found on the vitreal surface of the pedicles and not within the pedicles, as is the case in wild-type pedicles. The basal contacts seen in the nrc pedicles appeared quite normal, but their aberrant location could result in lack of synapse synchrony, leading to the variable and multiple potential changes observed in thenrc OFF-response.
Development of the zebrafish photoreceptor terminals
To gain insight into the nature of the morphological abnormality of nrc photoreceptor terminals, we examined the developing OPL in wild-type fish. Zebrafish pedicles develop like those in the chick and Xenopus in the following sequence: (1) postsynaptic processes first invaginate into the terminals, (2) srPBs and floating ribbons then appear, and (3) apposition of ribbons to the membrane finally occurs with the formation of mature-appearing synapses (Chen and Witkovsky, 1978). This differs from mammals, where (1) srPBs first appear, (2) ribbons then form and appose the membrane to form a synapse, and (3) postsynaptic processes then invaginate the terminal (Olney, 1968; Blanks et al., 1974; McArdle et al., 1977).
As in every species studied thus far, developing pedicles in the zebrafish have srPBs only during a short developmental period. This supports the view that these transient structures are a hallmark of developing photoreceptor terminals and other cells that produce synaptic ribbons, such as retinal bipolar cells and cells in the pineal gland (Smelzer et al., 1974; King and Dougherty, 1980). Our observation of the srPBs occasionally being joined together with filaments furthers the commonly held view that srPBs aggregate to form mature ribbons. This also supports the theory that ribbons are made from modular units (Usukura and Yamada, 1987).
During the development of photoreceptor terminal synapses in species such as the mouse and Xenopus, synaptic ribbons first form a dyad with two horizontal cell processes before a bipolar cell dendrite joins the complex, forming a triad (Blanks et al., 1974; Chen and Witkovsky, 1978). This sequential development suggests that horizontal cells mature before bipolar cells and correlates with studies showing that bipolar cells are the last retinal cells to be born and mature (Cepko et al., 1996; Schmitt and Dowling, 1999). Such a sequence in wild-type zebrafish could not be distinguished in this study, most likely because the zebrafish OPL matures too rapidly to see many dyads, which are transient developmental structures in the OPL. Although we saw a few apparent dyads in the developing wild-type retina, they occurred at the same frequency in 6 dpf and adult retinas. Thus, the few dyads we saw at 6 dpf could be attributable to section orientation; i.e., the section failed to pass through the central element of the triad.
Quantitative analysis of the ultrastructural features in 6 and 8 dpfnrc pedicles suggests that there is an arrest in development in the nrc terminals. Because there was no difference in the complexity of the nrc pedicles between these two ages, the pedicles appear not to have matured further during this time span. In addition, the nrc photoreceptor terminals showed no signs of degenerating, because they were no more abnormal at 8 dpf than at 6 dpf.
It may be that the arresting factor in the development of thenrc terminals is the failure of most processes, especially bipolar cell dendrites, to penetrate into the developing pedicles. Horizontal cells develop earlier than bipolar cells in wild-type retinas, and we do see invaginated horizontal cell processes in thenrc terminals, although in fewer numbers. Our data suggest that ribbon development is independent of the presence of invaginated postsynaptic process, because full-length ribbons are seen in thenrc terminals in normal numbers. We hypothesize that because most processes fail to invaginate the pedicles, ribbon synaptic complexes generally fail to form.
Dynamic properties of synaptic ribbons
As in other fishes, synaptic ribbons in zebrafish photoreceptors are very dynamic organelles (Wagner, 1973; Garcia et al., 1998). They form in the day and disaggregate at night. This phenomenon appears to be under the control of an endogenous clock (i.e., a circadian rhythm); ribbon dynamics continue in 24 hr of constant dark or light but are not altered by dark adaptation in the middle of the day. The site of the circadian control may reside in the retina. For example, Cahill (1996)has shown that cultured zebrafish retinas continue to produce melatonin under constant lighting conditions. Furthermore, this control may be provided by the photoreceptors themselves, which have been shown to have endogenous circadian activity in Xenopus (Cahill and Besharse, 1993).
As the ribbons degrade, small densities similar to the srPBs seen in development are observed, further suggesting that ribbons are formed from modular units. It is thought that ribbons may disintegrate in a two-phase process: first, ribbons fragment into pieces (srPBs) followed by a disassembly into structural units, as is the case for microtubules and actin filaments (Schmitz and Drenckhahn, 1993).
As yet, little is known about the molecular nature of the ribbons. They are made up predominately of proteins (Bunt, 1971), at least five in number (Schmitz et al., 1996), and a kinesin motor protein has recently been linked to the synaptic ribbons (Muresan et al., 1999). Exactly how ribbons are anchored to the presynaptic membrane is not clear, but this has long been thought to involve the arciform density (Ladman, 1958).
A piece of evidence suggesting that the nrc photoreceptors themselves are quite normal is that their synaptic ribbons are long during the day and that they disaggregate and disappear at night. If in zebrafish the photoreceptors contain a circadian clock, the fact that the nrc mutation does not alter the rhythmic turnover of the synaptic ribbons supports the notion that the mutant photoreceptors are relatively normal.
Phagosomes and lipid droplets in the nrc mutant
We observed an increase in the number of lipid droplets and phagosomes in the PE of nrc retinas in both our qualitative and quantitative studies. However, OSs in the nrc retina appear to reach approximately the same length and appear similar ultrastructurally to those of wild-type cones. Because the OSs are not grossly affected by the mutation, the increase in the number of lipid droplets and phagosomes may signal a defect in degradation processes within the PE. Alternatively, there could be an increase in the turnover of outer segments, so that it might take longer for the PE to degrade the additional number of phagosomes and turn over the lipids.
An increased number of phagosomes and lipid droplets is often seen in stressed retinas, unassociated with a genetic mutation. For example, intense light causes severe degradation of outer segments in albino rats, resulting in a massive increase of phagosomes in the PE (Grignolo et al., 1969). We have also seen an increase in these features in old (>1 year) zebrafish retinas (data not shown). This suggests that debris in the PE can provide a general clue that the retina is not healthy or is aging. Alternatively, the nrc gene product may have specific functions in both the OPL and the PE.
Candidate genes
A group of proteins that might be considered as putativenrc gene product candidates are those that make up the dystrophin glycoprotein complex (DGC). Several DGC proteins, including three dystrophin isoforms (full-length dystrophin, Dp260, and Dp71), utrophin (dystrophin-related protein), α- and β-dystroglycan, agrin, and laminin β2 have been localized to the photoreceptor terminals in the OPL of the retina (Woodford and Blanks, 1989; Schmitz and Drenckhahn, 1993; D'Souza et al., 1995; Montanaro et al., 1995;Drenckhahn et al., 1996; Kröger et al., 1996; Rodius et al., 1997; Ueda et al., 1997a; Libby et al., 1999). Furthermore, patients with Duchenne muscular dystrophy (DMD), dystrophic (mdxCV3) mice, and laminin β2 knock-out mice all show disturbances in the b-wave of their ERG (Cibis et al., 1993; Pillars et al., 1993, 1995; Fitzgerald et al., 1994;D'Souza et al., 1995; Libby et al., 1999). Of special relevance is the fact that under photopic conditions, DMD youngsters (2–5 years of age) show ERGs with multiple late oscillations (Cibis et al., 1993).
These proteins may scaffold the extracellular matrix between photoreceptors and bipolar cells, thereby controlling the invaginated morphology of the terminals and maintaining the ultrastructural configuration between the photoreceptors and bipolar cells in the OPL (Schmitz and Drenckhahn, 1997; Ueda et al., 1997a). Ueda and colleagues showed that dystrophin is associated with both the flat (OFF) and invaginating (ON) bipolar cells (Ueda et al., 1997b). Although the three dystrophin isoforms and α- and β-dystroglycan are highly expressed in the outer plexiform layer, they are sparse or absent in the inner plexiform layer in the retina (D'Souza et al., 1995;Montanaro et al., 1995; Drenckhahn et al., 1996).
Laminin β2 mutant mice show abnormalities both along the PE–OS border and also in the photoreceptor terminals. Brunken and colleagues (Libby et al., 1999) have shown that this protein is expressed in PE cells as well as in photoreceptor terminals, the two sites where there are abnormalities in the nrc mutant. Laminin β2 mutant mice do show some degeneration and shortening of photoreceptor outer segments, something not apparent in nrc retinas, although the increase of phagosomes and lipid droplets in the nrcdoes suggest some abnormality in the PE cells and/or in photoreceptor OS turnover. Furthermore, laminin β2 mice show a disruption of synaptic terminal organization similar to that observed in nrc mutants. Triadic ribbon complexes are seen only rarely in these mice, and instead, many floating ribbons are observed. When ribbon synapses are seen, they are usually dyadic in nature. As innrc zebrafish, the inner plexiform synapses are normal in the laminin β2 mice.
Footnotes
This research was supported by National Institutes of Health Grants EY00811 and EY00824 (J.E.D.), EY06693 and SO6GM08016 (A.B.L.), EY06762 (S.E.B.), and MH10916 (B.A.A.). Sabbatical year support from the Dean's Office of the College of Arts and Sciences, Howard University, was provided to A.B.L. We thank Drs. Alan Adolph and Ellen Schmitt for their help with the electrophysiology and histology, respectively, and for helpful comments on this manuscript. We thank Professor Robert Woollacott for help with and use of the Hitachi electron microscope.
Correspondence should be addressed to Dr. John E. Dowling, The Biological Laboratories, Harvard University, 16 Divinity Avenue, Cambridge, MA 02138. E-mail: dowling@fas.harvard.edu.
Dr. Lall's present address: Department of Biology, Howard University, Washington, DC 20059.
Dr. Brockerhoff's present address: Department of Biochemistry, University of Washington, Box 357350, Seattle, WA 98195.
REFERENCES
- 1.Blanks JC, Adinolfi AM, Lolley RN. Synaptogenesis in the photoreceptor terminal of the mouse retina. J Comp Neurol. 1974;156:81–94. doi: 10.1002/cne.901560107. [DOI] [PubMed] [Google Scholar]
- 2.Braekevelt CR. Retinal pigment epithelium fine structure in the velvet cichlid (Astronotus ocellatus). Anat Embryol. 1992;186:371–377. doi: 10.1007/BF00185987. [DOI] [PubMed] [Google Scholar]
- 3.Brockerhoff SE, Hurley JB, Janssen-Bienhold U, Neuhauss SCF, Driever W, Dowling JE. A behavioral screen for isolating zebrafish mutants with visual system defects. Proc Natl Acad Sci USA. 1995;92:10545–10549. doi: 10.1073/pnas.92.23.10545. [DOI] [PMC free article] [PubMed] [Google Scholar]
- 4.Brockerhoff SE, Hurley JB, Niemi GA, Dowling JE. A new form of inherited red-blindness identified in zebrafish. J Neurosci. 1997;17:4236–4242. doi: 10.1523/JNEUROSCI.17-11-04236.1997. [DOI] [PMC free article] [PubMed] [Google Scholar]
- 5.Bunt AH. Enzymatic digestion of synaptic ribbons in amphibian retinal photoreceptors. Brain Res. 1971;25:571–577. doi: 10.1016/0006-8993(71)90461-6. [DOI] [PubMed] [Google Scholar]
- 6.Cahill GM. Circadian regulation of melatonin production in cultured zebrafish pineal and retina. Brain Res. 1996;708:177–181. doi: 10.1016/0006-8993(95)01365-2. [DOI] [PubMed] [Google Scholar]
- 7.Cahill GM, Besharse JC. Circadian clock functions localized in Xenopus retinal photoreceptors. Neuron. 1993;10:573–577. doi: 10.1016/0896-6273(93)90160-s. [DOI] [PubMed] [Google Scholar]
- 8.Cepko CL, Austin CP, Yang X, Alexiades M, Ezzeddine D. Cell fate determination in the vertebrate retina. Proc Natl Acad Sci USA. 1996;93:589–595. doi: 10.1073/pnas.93.2.589. [DOI] [PMC free article] [PubMed] [Google Scholar]
- 9.Chen F, Witkovsky P. The formation of photoreceptor synapses in the retina of larval Xenopus. J Neurocytol. 1978;7:721–740. doi: 10.1007/BF01205147. [DOI] [PubMed] [Google Scholar]
- 10.Chung SC, Dowling JE. Isolation and characterization of a motion-sensitive defective mutant in zebrafish. Invest Ophthal Vis Sci. 1997;38:S619. [Google Scholar]
- 11.Cibis GW, Fitzgerald KM, Harris DJ, Rothberg PG, Rupani M. The effect of dystrophin gene mutations on the ERG in mice and humans. Invest Ophthal Vis Sci. 1993;34:3646–3652. [PubMed] [Google Scholar]
- 12.Dowling JE. Synaptic arrangements in the vertebrate retina: the photoreceptor synapse. In: Bennett MVL, editor. Synaptic transmission and neuronal interaction. Raven; New York: 1974. pp. 87–101. [Google Scholar]
- 13.Dowling JE. The retina: an approachable part of the brain. Harvard UP; Cambridge, MA: 1987. [Google Scholar]
- 14.Drenckhahn D, Holbach M, Ness W, Schmitz F, Anderson LVB. Dystrophin and the dystrophin-associated glycoprotein, β-dystroglycan, colocalize in photoreceptor synaptic complexes of the human retina. Neuroscience. 1996;73:605–612. doi: 10.1016/0306-4522(96)00069-3. [DOI] [PubMed] [Google Scholar]
- 15.D'Souza VN, Nguyen TM, Morris GE, Karges W, Pillers DA, Ray PN. A novel dystrophin isoform is required for normal retinal electrophysiology. Hum Mol Genet. 1995;4:738–842. doi: 10.1093/hmg/4.5.837. [DOI] [PubMed] [Google Scholar]
- 16.Fitzgerald KM, Cibis GW, Giambrone SA, Harris DJ. Retinal signal transmission in Duchenne muscular dystrophy: evidence for dysfunction in the photoreceptor depolarizing bipolar cell pathway. J Clin Invest. 1994;93:2425–2430. doi: 10.1172/JCI117250. [DOI] [PMC free article] [PubMed] [Google Scholar]
- 17.Garcia M, Guardiola JV, De Juan J. Plasticity of synaptic ribbon and synaptic vesicle density in teleost photoreceptor terminals. Invest Ophthal Vis Sci. 1998;39:S1058. [Google Scholar]
- 18.Gray EG, Pease HL. On understanding the organization of the retinal receptor synapses. Brain Res. 1971;35:1–15. doi: 10.1016/0006-8993(71)90591-9. [DOI] [PubMed] [Google Scholar]
- 19.Grignolo A, Orzalesi N, Castellazzo R, Vittone P. Retinal damage by visible light in albino rats. An electron microscope study. Ophthalmologica. 1969;157:43–59. doi: 10.1159/000305619. [DOI] [PubMed] [Google Scholar]
- 20.Gurevich L, Slaughter MM. Comparison of the waveforms of the ON bipolar neuron and the b-wave of the electroretinogram. Vision Res. 1993;33:2431–2435. doi: 10.1016/0042-6989(93)90122-d. [DOI] [PubMed] [Google Scholar]
- 21.Hermes B, Reuss S, Vollrath L. Synaptic ribbons, spheres, and intermediate structures in the developing rat retina. Int J Dev Neurosci. 1992;10:215–223. doi: 10.1016/0736-5748(92)90061-4. [DOI] [PubMed] [Google Scholar]
- 22.King TS, Dougherty WJ. Neonatal development of circadian rhythm in “synaptic” ribbon numbers in the rat pinealocyte. Am J Anat. 1980;157:335–343. doi: 10.1002/aja.1001570403. [DOI] [PubMed] [Google Scholar]
- 23.Kröger S, Horton SE, Honig LS. The developing avian retina expresses agrin isoforms during synaptogenesis. J Neurobiol. 1996;29:165–182. doi: 10.1002/(SICI)1097-4695(199602)29:2<165::AID-NEU4>3.0.CO;2-8. [DOI] [PubMed] [Google Scholar]
- 24.Ladman AJ. The fine structure of the rod bipolar synapse in the retina of the albino rat. J Biophys Biochem Cytol. 1958;4:459–466. doi: 10.1083/jcb.4.4.459. [DOI] [PMC free article] [PubMed] [Google Scholar]
- 25.Libby RT, Lavallee C, Balkema GW, Brunken WJ, Hunter DD. Disruption of laminin β2 chain production causes alterations in morphology function in the CNS. J Neurosci. 1999;19:9399–9411. doi: 10.1523/JNEUROSCI.19-21-09399.1999. [DOI] [PMC free article] [PubMed] [Google Scholar]
- 26.Malicki J, Neuhauss SCF, Schier AF, Solnica-Krezel L, Stemple DL, Strainier DYR, Abdelilah S, Zwartkruis F, Rangini Z, Driever W. Mutations affecting development of the zebrafish retina. Development. 1996;123:263–273. doi: 10.1242/dev.123.1.263. [DOI] [PubMed] [Google Scholar]
- 27.McArdle CB, Dowling JE, Masland RH. Development of outer segments and synapses in the rabbit retina. J Comp Neurol. 1977;175:253–274. doi: 10.1002/cne.901750302. [DOI] [PubMed] [Google Scholar]
- 28.Montanaro F, Carbonetto S, Campbell KP, Lindenbaum M. Dystrophin expression in the wild type and mdx mouse neural retina: synaptic colocalization with dystrophin, dystrophin-related protein but not laminin. J Neurosci Res. 1995;42:528–538. doi: 10.1002/jnr.490420411. [DOI] [PubMed] [Google Scholar]
- 29.Mullins MC, Hammerschmidt M, Haffter P, Nüsslein-Volhard C. Large-scale mutagenesis in the zebrafish: in search of genes controlling development in a vertebrate. Curr Biol. 1994;4:189–202. doi: 10.1016/s0960-9822(00)00048-8. [DOI] [PubMed] [Google Scholar]
- 30.Muresan V, Lyass A, Schnapp BJ. The kinesin motor KIF3A is a component of the presynaptic ribbon in vertebrate photoreceptors. J Neurosci. 1999;19:1027–1037. doi: 10.1523/JNEUROSCI.19-03-01027.1999. [DOI] [PMC free article] [PubMed] [Google Scholar]
- 31.Olney JW. An electron microscopic study of synapse formation, receptor outer segment development, and other aspects of developing mouse retina. Invest Ophthal Vis Sci. 1968;7:250–268. [PubMed] [Google Scholar]
- 32.Pillars DAM, Bulman DE, Weleber RG, Sigesmund DA, Musarelia MA, Powell R, Murphey WH, Westall C, Panton C, Becker LE, Worton RG, Ray PN. Dystrophin expression in the human retina is required for normal function as defined by electroretinography. Nat Genet. 1993;4:82–86. doi: 10.1038/ng0593-82. [DOI] [PubMed] [Google Scholar]
- 33.Pillars DAM, Weleber RG, Woodward WR, Green DG, Chapman VM, Ray RN. mdxCv3 mouse is a model for electroretinography of Duchenne/Becker muscular dystrophy. Invest Ophthal Vis Sci. 1995;36:462–466. [PubMed] [Google Scholar]
- 34.Rodius F, Claudepierre T, Rosas-Vargas H, Cisneroa B, Montanez C, Dreyfus H, Mornet D, Rendon A. Dystrophins in developing retina: Dp260 expression correlates with synaptic maturation. NeuroReport. 1997;8:2383–2387. doi: 10.1097/00001756-199707070-00056. [DOI] [PubMed] [Google Scholar]
- 35.Saito T, Kujiraoka T, Yonaha T, Chino Y. Reexamination of photoreceptor-bipolar connectivity patterns in carp retina: HRP-EM and Golgi-EM studies. J Comp Neurol. 1985;236:141–160. doi: 10.1002/cne.902360202. [DOI] [PubMed] [Google Scholar]
- 36.Sakai HM, Naka K-I. Synaptic organization of the cone horizontal cells in the catfish retina. J Comp Neurol. 1985;244:107–115. doi: 10.1002/cne.902450108. [DOI] [PubMed] [Google Scholar]
- 37.Schmitt EA, Dowling JE. Early retinal development in the zebrafish, Danio rerio: light and electron microscopic analyses. J Comp Neurol. 1999;404:515–536. [PubMed] [Google Scholar]
- 38.Schmitz F, Drenckhahn D. Distribution of actin in cone photoreceptor synapses. Histochemistry. 1993;100:35–40. doi: 10.1007/BF00268876. [DOI] [PubMed] [Google Scholar]
- 39.Schmitz F, Drenckhahn D. Dystrophin in the retina. Prog Neurobiol. 1997;53:547–560. doi: 10.1016/s0301-0082(97)00047-6. [DOI] [PubMed] [Google Scholar]
- 40.Schmitz F, Bechmann M, Drenckhahn D. Purification of synaptic ribbons, structural components of the photoreceptor active zone complex. J Neurosci. 1996;16:7109–7116. doi: 10.1523/JNEUROSCI.16-22-07109.1996. [DOI] [PMC free article] [PubMed] [Google Scholar]
- 41.Seeliger M, Neuhauss SCF, Kohler K, Zrenner E. Gansfeld electroretinography in the zebrafish (Danio rerio). Invest Ophthalmol Vis Sci. 1998;39:S975. [Google Scholar]
- 42.Smelzer GK, Ozanics V, Rayborn M, Sagun D. Retinal synaptogenesis in the primate. Invest Ophthal Vis Sci. 1974;13:340–361. [PubMed] [Google Scholar]
- 43.Solnica-Krezel L, Schier AF, Driever W. Efficient recovery of ENU-induced mutations from the zebrafish germline. Genetics. 1994;136:1401–1420. doi: 10.1093/genetics/136.4.1401. [DOI] [PMC free article] [PubMed] [Google Scholar]
- 44.Stell WK. Correlation of retinal cytoarchitecture and ultrastructure in Golgi preparations. Anat Rec. 1965;153:389–397. doi: 10.1002/ar.1091530409. [DOI] [PubMed] [Google Scholar]
- 45.Stell WK. The structure and relationship of horizontal cells and photoreceptor-bipolar synaptic complexes in goldfish retina. Am J Anat. 1967;121:401–424. doi: 10.1002/aja.1001210213. [DOI] [PubMed] [Google Scholar]
- 46.Stell WK, Ishida AT, Lightfoot DO. Structural basis for on- and off-center responses in the retina of the goldfish. Science. 1977;198:1269–1271. doi: 10.1126/science.201028. [DOI] [PubMed] [Google Scholar]
- 47.Ueda H, Baba T, Terada N, Kato Y, Tsukahara S, Ohno S. Dystrophin in rod spherules: submembranous dense regions facing bipolar cell processes. Histochem Cell Biol. 1997a;108:243–248. doi: 10.1007/s004180050164. [DOI] [PubMed] [Google Scholar]
- 48.Ueda H, Kato Y, Baba T, Terada N, Fujii Y, Tsukahara S, Ohno S. Immunocytochemical study of dystrophin localization in cone cells of mouse retina. Invest Ophthal Vis Sci. 1997b;38:1627–1630. [PubMed] [Google Scholar]
- 49.Usukura J, Yamada E. Ultrastructure of the synaptic ribbons in photoreceptor cells of Rana catesbeana revealed by freeze-etching and freeze-substitution. Cell Tissue Res. 1987;247:483–488. doi: 10.1007/BF00215740. [DOI] [PubMed] [Google Scholar]
- 50.Van Epps HA, Chong MY, Hurley JB, Brockerhoff SE (2001) Investigations of photoreceptor synaptic transmission and light adaptation in the zebrafish visual mutantnrc. Invest Ophthalmol Vis Sci, in press. [PubMed]
- 51.von Gersdorf H, Vardi E, Matthews G, Sterling P. Evidence that vesicles on the synaptic ribbon of retinal bipolar neurons can be rapidly released. Neuron. 1996;16:1221–1227. doi: 10.1016/s0896-6273(00)80148-8. [DOI] [PubMed] [Google Scholar]
- 52.Wagner H-J. Darkness-induced reduction of the number of synaptic ribbons in fish retina. Nature. 1973;246:53–55. doi: 10.1038/newbio246053a0. [DOI] [PubMed] [Google Scholar]
- 53.Wagner H-J. Light-dependent plasticity of the morphology of horizontal cell terminals in cone pedicles of fish retinas. J Neurocytol. 1980;9:573–590. doi: 10.1007/BF01205026. [DOI] [PubMed] [Google Scholar]
- 54.Westerfield M. The zebrafish book: a guide for the laboratory use of zebrafish, Ed 3. University of Oregon Press; Eugene, OR: 1995. [Google Scholar]
- 55.Wong KY, Cohen ED, Adolph AR, Dowling JE. The d-wave of the zebrafish ERG derives mainly from off-bipolar cell activity. Invest Ophthalmol Vis Sci. 2000;41:S628. [Google Scholar]
- 56.Woodford BJ, Blanks JC. Localization of actin and tubulin in developing and adult mammalian photoreceptors. Cell Tissue Res. 1989;256:495–505. doi: 10.1007/BF00225597. [DOI] [PubMed] [Google Scholar]
- 57.Zinn KM, Marmor MF. The retinal pigment epithelium. Harvard UP; Cambridge, MA: 1979. [Google Scholar]