

Abstract
GABA emerges as a trophic signal during rat neocortical development in which it modulates proliferation of neuronal progenitors in the ventricular/subventricular zone (VZ/SVZ) and mediates radial migration of neurons from the VZ/SVZ to the cortical plate/subplate (CP/SP) region. In this study we investigated the role of GABA in the earliest phases of neuronal differentiation in the CP/SP. GABAergic-signaling components emerging during neuronal lineage progression were comprehensively characterized using flow cytometry and immunophenotyping together with physiological indicator dyes. During migration from the VZ/SVZ to the CP/SP, differentiating cortical neurons became predominantly GABAergic, and their dominant GABAA receptor subunit expression pattern changed from α4β1γ1 to α3β3γ2γ3 coincident with an increasing potency of GABA on GABAA receptor-mediated depolarization. GABAA autoreceptor/Cl− channel activity in cultured CP/SP neurons dominated their baseline potential and indirectly their cytosolic Ca2+(Ca2+c) levels via Ca2+ entry through L-type Ca2+channels. Block of this autocrine circuit at the level of GABA synthesis, GABAA receptor activation, intracellular Cl− ion homeostasis, or L-type Ca2+ channels attenuated neurite outgrowth in most GABAergic CP/SP neurons. In the absence of autocrine GABAergic signaling, neuritogenesis could be preserved by depolarizing cells and elevating Ca2+c. These results reveal a morphogenic role for GABA during embryonic neocortical neuron development that involves GABAA autoreceptors and L-type Ca2+ channels.
Keywords: embryonic, rat, development, cortical, neuritogenesis, GABA, GAD, FACS
GABAergic-signaling components emerge and become widespread during the embryonic period of vertebrate CNS development, indicating possible developmental roles for GABA [for a recent monograph, see Barker and Lauder (1998)]. GABA and its synthetic enzymes, the two isoforms of glutamic acid decarboxylase (GAD65 and GAD67), appear throughout the embryonic rat neocortex together with GABAA receptor subunits, which form Cl− ion channels (Lauder et al., 1986;Van Eden et al., 1989; Cobas et al., 1991; Laurie et al., 1992; Poulter et al., 1992, 1993). During the development of embryonic neocortex, GABAergic cells are distributed in the ventricular/subventricular zone (VZ/SVZ) containing proliferating precursors and progenitors, where α4, β1, and γ1 GABAA receptor subunit transcripts and proteins are predominantly expressed (Ma and Barker, 1995, 1998), and in the cortical plate/subplate (CP/SP) region containing differentiating neurons, many of which exhibit α3, β3, and γ2 receptor subunit transcripts and proteins (Maric et al., 1997).
Electrical recordings of cells in embryonic cortical slice preparations have shown that GABA depolarizes cells by activating GABAA receptor/Cl−ion channels (LoTurco et al., 1995). The pharmacological properties of GABAA receptor-coupled Cl− currents recorded in VZ/SVZ neuronal progenitor cells and CP/SP differentiating neurons appear to change, with GABA being more potent in depolarizing the progenitor population (Owens et al., 1999). GABA added to cortical slice preparations differentially modulates neural cell proliferation in the VZ and SVZ (LoTurco et al., 1995; Haydar et al., 2000). In vitro, GABA also acts like a chemoattractant and directs the migration of postmitotic neurons from the VZ/SVZ to the CP/SP via GABAB receptors (Behar et al., 1996, 1998, 2000). In addition, GABA can both stimulate random motility in CP/SP neurons via GABAB receptor-coupled Ca2+ signals and attenuate their own movement via GABAAreceptor/Cl− channels, as neurons become arranged into primitive layers (Behar et al., 1998). Pharmacological activation of GABAAreceptor/Cl− channels expressed by growth cones fractionated from neurons in the developing cortex increases cytosolic Ca2+ levels via voltage-sensitive L-type Ca2+ channels (Fukura et al., 1996), which can lead to Ca2+-dependent phosphorylation of specific proteins (Ohbayashi et al., 1998). These latter results suggest a morphogenic role for GABA related to the physiology of neurite outgrowth among embryonic cortical neurons.
In this study, we investigated the cellular distributions of GABAergic-signaling components emerging at the end of neurogenesis in the embryonic rat neocortex and examined the functional role of GABA on neurite outgrowth after radial migration of neurons into the CP/SP. GABAergic-signaling components, including the expression of GAD65, GAD67, GABA, GABAA, and GABAB receptor subunits, and GABAergic signals at GABAAreceptor/Cl− channels emerged in the VZ at the earliest stages of neuronal lineage progression. In CP/SP neurons, autocrine GABAergic signals dominated their baseline membrane potential and cytosolic Ca2+ levels. This autocrine activity was critical to neurite outgrowth, because interruption of each component in the circuit markedly attenuated process formation and/or regeneration without altering cell survival.
Parts of this paper have been published previously (Maric et al., 1998a).
MATERIALS AND METHODS
Cell preparation
Experiments were performed on embryos recovered from timed-pregnant Sprague Dawley rats (Taconic, Germantown, NY) during the last half of gestation. The embryonic age was determined by comparing the crown–rump lengths of embryos with previously published values (Hebel and Stromberg, 1986). The day of conception was taken as embryonic day 1 (E1). All of the research was performed in compliance with the Animal Welfare Act and the Public Health Service policy on Humane Care and Use of Laboratory Animals and was approved by the National Institute of Neurological Disorders and Stroke Animal Care and Use Committee.
Most of the study was focused on developing neocortical cells at E19. To obtain access to neuronal subpopulations before and after radial migration, 350-μm-thick coronal sections of the brain at the level of the midposterior neocortex, which corresponded to coronal plates 9–12 (Altman and Bayer, 1995), were microdissected along the incipient white matter into a CP/SP region and a VZ/SVZ zone, and the tissues were then optimally dissociated into single-cell suspensions, as described previously (Maric et al., 1997, 2000b). The cells were subsequently washed and finally resuspended at a density of 2 × 10⁶ cells/ml in a normal physiological medium (NPM) consisting of (in mm): 145 NaCl, 5 KC1, 1.8 CaCl2, 0.8 MgCl2, 10 glucose, and 10 HEPES, pH 7.3 (osmolarity, 290 mOsm). During the initial cell preparation and under some experimental conditions, NPM was supplemented with 1 mg/ml bovine serum albumin (NPM/BSA), which was obtained from Sigma (St. Louis, MO).
Immunostaining protocols
Immunolabeling of surface and cytoplasmic epitopes was performed in Dulbecco's PBS (Quality Biologicals, Gaithersburg, MD) supplemented with 1 mg/ml BSA (PBS/BSA). Unless stated otherwise, PBS/BSA was also used as a diluent for the preparation of working stocks of all primary and secondary antibodies. All immunoreactions were performed at room temperature (RT).
Immunofluorescent labeling of surface epitopes. To discriminate among the developing cortical cells progressing along neuronal and glial cell lineages, we used a mouse monoclonal class IgM anti-A2B5 antibody (Boehringer Mannheim, Indianapolis, IN) and a mixture of tetanus toxin fragment C (TnTx; Boehringer Mannheim) and a mouse monoclonal class IgG2b anti-TnTx antibody (obtained from Dr. William Habig, Food and Drug Administration, Bethesda, MD), as described previously (Maric et al., 1999a, 2000b). Briefly, acutely dissociated cells in suspension were double-immunoreacted with 1 μg/ml anti-A2B5 and TnTx/anti-TnTx for 30 min and then washed in NPM, and the primary immunoreactions were visualized by immunostaining with 10 μg/ml phycoerythrin (PE)-conjugated goat anti-mouse IgM and PE/CY5-conjugated goat anti-mouse IgG2b antibodies (Caltag, South San Francisco, CA) for an additional 30 min.
Immunofluorescent labeling of cytoplasmic epitopes. To immunotype TnTx/A2B5-labeled populations further, we performed triple-staining protocols using antibodies specific for different components of the GABAergic-signaling pathway. These included rabbit polyclonal anti-GABA (Sigma) and two anti-GAD antibodies specific for GAD65 and GAD67 isoforms (obtained from Dr. David L. Martin, State University of New York, Albany, NY). In addition, the expression of 13 GABAA and 2 GABAB receptor subunits was investigated in the TnTx/A2B5-labeled subpopulations using specific antibodies generated against appropriate synthetic peptides or fusion proteins (sequences of targeted amino acid residues are depicted in parentheses). GABAA receptor antibodies included guinea pig polyclonals specific for α2 (1–9) and α3 (1–15) subunits (obtained from Dr. Jean-Marc Fritschy, University of Zurich, Zurich, Switzerland) and rabbit polyclonals specific for α1 (1–9), α4 (379–421), α5 (2–10), α6 (429–434), β1 (350–404), β2 (351–405), β3 (345–408), γ1 (324–366), γ2 (319–366), γ3 (322–372), and δ (1–44) subunits (obtained from Dr. Werner Sieghart, University Clinic for Psychiatry, Vienna, Austria); GABAB receptor antibodies included guinea pig polyclonals specific for R1 (both R1a and R1b isoforms) and R2 subunits (Chemicon, Temecula, CA). The characterization and specificity of the aforementioned antibodies have been described elsewhere (Benke et al., 1991, 1997; Buchstaller et al., 1991; Marksitzer et al., 1993; Martin and Rimvall, 1993; Mertens et al., 1993; Rimvall et al., 1993; Mossier et al., 1994; Todd et al., 1996; Sperk et al., 1997; Jones et al., 1998; Kaupmann et al., 1998; White et al., 1998; Durkin et al., 1999; Martin et al., 1999; Yung et al., 1999; Calver et al., 2000;Princivalle et al., 2000).
In short, the staining protocol was as follows. The cells were first surface labeled with anti-A2B5-PE and anti-TnTx-PE/CY5, then fixed in 4% paraformaldehyde (PF) for 30 min, washed three times in PBS/BSA, and immunolabeled with appropriate dilutions of anti-GABA, anti-GAD65, anti-GAD67, or one of the aforementioned GABAA or GABAB receptor subunit antibodies for 1 hr. The primary immunoreactions were visualized after a 30 min incubation with the appropriate fluorescein isothiocyanate (FITC)-conjugated donkey anti-rabbit or donkey anti-guinea pig IgG secondary antibodies (5–10 μg/ml; Jackson ImmunoResearch, West Grove, PA). Control immunoreactions, in which the primary and/or the secondary antibodies were omitted during the staining protocol, were also performed. Nonspecific staining of these antibodies was minimized by a 30 min blocking step in PBS containing 10% (v/v) normal rat serum and 10% (v/v) normal donkey serum (Jackson ImmunoResearch). The same solution was also used as a diluent during the incubation steps with primary and secondary antibodies.
Flow-cytometic detection of fluorescently labeled epitopes.Surface and cytoplasmic immunoreactions among TnTx/A2B5-labeled subpopulations in suspension were quantified in 100,000-cell samples using the FACSTAR+ flow cytometer (Becton Dickinson, Mountain View, CA), as detailed previously (Maric et al., 1999a, 2000b). Briefly, the FITC, PE, and PE/CY5 fluorescence signals were excited by an argon ion laser (model 2016; Spectra-Physics, Mountain View, CA) tuned to obtain 500 mW power at 488 nm, and the resulting fluorescence emissions were collected using bandpass filters set at 530 ± 30, 575 ± 25, and 670 ± 20 nm, respectively. Cell Quest Analysis software (Becton Dickinson) was used to quantify the fluorescence signal intensities among the immunolabeled subpopulations.
EM immunocytochemistry. The distribution of GABA immunoreactivity at the subcellular level was examined using an immunogold labeling protocol in conjunction with transmission electron microscopy. Acutely prepared CP/SP neurons were allowed to adhere on eight-well plastic chamber slides (Nunc, Naperville, IL) and were then cultured for 24 hr in Neurobasal medium supplemented with B27 additives (Life Technologies, Gaithersburg, MD). The cells were then fixed in 4% PF (EM grade; EMS, Ft. Washington, PA) for 30 min, washed three times in PBS, permeabilized with PBS/BSA/0.1% saponin (Sigma), which also served as the diluent for primary and secondary antibodies, and immunoreacted with 2 μg/ml rabbit anti-GABA antibody for 1 hr. The primary immunoreaction was visualized with 5 μg/ml goat anti-rabbit secondary antibody (Fab′ fragment) conjugated to a 1.4 nm gold particle (Nanoprobes, Stonybrook, NY), followed by a silver enhancement and EM processing steps as detailed previously (Tanner et al., 1996). Control cells excluded one of the following: (1) primary antibody, (2) secondary antibody, or (3) primary and secondary antibody.
Immunohistochemistry. In some experiments, E19 rat brains were fixed in 4% PF for 4 hr, cryoprotected in 30% sucrose for 3–5 d at 4°C, and frozen in liquid nitrogen-cooled isopentane (Fisher Scientific, Fair Lawn, NJ). Twenty-micrometer-thick coronal sections were cut using a Jung Frigocut cryostat (model 2800E; Leica, Nussloch, Germany) and then dried at RT for 1 hr and immunoreacted with appropriate dilutions of the aforementioned GABAAor GABAB receptor subunit-specific antibodies overnight. For immunohistochemistry, all antibodies were diluted in PBS containing 10% (v/v) normal rat serum and 10% (v/v) normal donkey serum, as described above, to prevent nonspecific binding. In control slides, the primary antibodies were substituted with diluent only. The sections were then incubated for 1 hr with biotinylated donkey antibodies against appropriate species (Jackson ImmunoResearch), which served as secondary immunoreagents. Finally, the cells were reacted for 1 hr with streptavidin-conjugated horseradish peroxidase (Jackson ImmunoResearch) and developed in 3-amino-9-ethyl carbazole (AEC) substrate (Sigma; 25 mg of AEC in 100 ml of acetate buffer) with 0.01% H2O2 for 10–15 min at RT. The slides were then coverslipped, and the sections were imaged under a transmission light microscope using the NIH Image software (developed at the National Institutes of Health and available on the Internet at http://rsb.info.nih.gov/nih-image/) on the Macintosh workstation.
Flow-cytometric recordings of calcium and potentiometric signals
E19 cells immunolabeled with TnTx-PE/CY5 and A2B5-PE were stained with either potentiometric or Ca2+indicator dyes to record their membrane potential or cytosolic Ca2+(Ca2+c) levels under resting baseline conditions in NPM and in response to various agonists, as described previously (Maric et al., 2000b). Briefly, to record membrane potential (MP), immunolabeled cells were resuspended at a density of 2 × 10⁶ cells/ml and stained with 200 nm bis-(1,3-dibutylbarbituric acid)trimethine oxonol (Molecular Probes, Eugene, OR) for 10 min at RT to allow complete equilibration of the negatively charged dye with cell plasma membranes before recording MP values. Alternatively, the immunolabeled cells were loaded with 100 nm fluo-3 AM, a Ca2+ indicator dye (Molecular Probes), for 20 min at RT and then washed to remove unincorporated dye and resuspended in NPM for 30 min to permit deesterification before recording Ca2+c levels. Both oxonol and fluo-3 were excited at 488 nm, and their fluorescence emissions were detected with a bandpass filter set at 525 ± 15 nm. In triple-staining experiments, the spectral overlap of fluo-3 or oxonol fluorescence emissions into the PE detection window and of PE fluorescence signals into the PE/CY5 detection window was electronically compensated at the preamplifier stage.
Modal values in the oxonol and fluo-3 fluorescence signal distributions were calibrated in terms of MP or [Ca2+]c using previously established protocols (Maric et al., 1998b,c, 1999a). Typically, resting MP and Ca2+c levels were randomly recorded from 100,000 TnTx/A2B5-immunoidentified cells at the rate of ∼2000 cells/sec. The modal (approximate mean in symmetrically distributed signals) MP or Ca2+c values expressed by different subpopulations were quantified by gating electronically on TnTx and/or A2B5 immunofluorescence signals. This combined surface-labeling-and-indicator-dye-recording strategy allowed us to profile the physiological properties of virtually all neocortical cell phenotypes (i.e., neural precursors, neuronal and neuroglial progenitors, and differentiating neurons) in suspension in a rapid and statistically complete manner (Maric et al., 2000b). TnTx/A2B5 labeling itself did not trigger detectable changes in either baseline membrane potential or Ca2+c (data not shown).
Dual video microscopic imaging of calcium and potentiometric signals
Dual-indicator dye digital video microscopic imaging of Ca2+c and membrane potential was performed on fields of 20–30 isolated cells cultured from the CP/SP, as detailed elsewhere (Maric et al., 2000b). Briefly, the cells were plated at a density of 2 × 10⁴ cells/cm2on poly-d-lysine-coated coverslips, which were photoetched with an α-numeric grid (Bellco Glass, Inc., Vineland, NJ), preglued to 35 mm tissue culture dishes (MatTek Corporation, Ashland, MA), and cultured for 24–48 hr in Neurobasal/B27 medium. At the end of culture, the cells were loaded with 2 μm fura-2 AM (Molecular Probes) for 1 hr at 37° C, washed in NPM, and stained for 10 min at RT with 500 nm oxonol. Because oxonol equilibrates dynamically according to the cell membrane potential, the dye was included in all recording solutions, which were delivered to the 150 μl recording chamber using gravity-driven perfusion at ∼2 ml/min.
The cells were imaged using the Attofluor RatioVision workstation (Atto Instruments, Rockville, MD) equipped with an Axiovert 135 inverted microscope (Carl Zeiss, Thornwood, NY) and an intensified ICCD camera (Atto Instruments). The indicator dyes were sequentially excited at 1 sec intervals with a 100 W mercury arc lamp filtered at 488 ± 5 nm for oxonol and at 334 ± 5 and 380 ± 5 nm for fura-2. Fluorescence emissions were acquired through a 510 nm dichroic mirror and a 520 nm long-pass filter set (Chroma Technology Corporation, Brattleboro, VT). Regions of interest (ROIs) were drawn electronically around individual cell bodies, and indicator dye fluorescence signals of each ROI were digitized with a Matrox image processing board and then plotted as line graphs using Attograph for Windows analysis software (Atto Instruments). Oxonol and fura-2 fluorescence signal distributions were calibrated in terms of MP or [Ca2+]c using previously established protocols (Maric et al., 1998c, 2000b).
After imaging, the field of recorded cells was photographed with a 35 mm camera using phase-contrast optics to reveal their location with respect to the underlying alphanumeric grid. The cells were then washed in NPM to remove the oxonol dye and then immunostained with anti-A2B5-PE, anti-TnTx-PE/CY5, and anti-GABA-FITC, as described above. In this way, the physiological properties of individual cells at membrane and cytoplasmic levels could be recorded simultaneously and then correlated with their differentiation state.
Electrophysiology
Before recording, the Neurobasal culture medium was replaced with Tyrode's solution containing (in mm): 145 NaCl, 5.4 KCl, 1.8 CaCl2, 0.8 MgCl2, 10 glucose, and 10 HEPES-NaOH, pH 7.4 (310 mOsm). Standard patch-clamp recordings (Hamill et al., 1981) were made with pipettes pulled in three stages from 1.5-mm-outer diameter glass capillary tubes (WPI, Sarasota, FL) with a computer-controlled pipette puller (BB-CH-PC; Mecanex; Geneva, Switzerland). These pipettes had a resistance of 3–5 MΩ when filled with internal solution composed of (in mm): 145 CsCl, 2 MgCl2, 0.1 CaCl2, 1.1 EGTA, 5 HEPES, 5 ATP (potassium salt), and 5 phosphocreatine, pH 7.2 (290 mOsm). Whole-cell currents were recorded with an L/M EPC-7 patch-clamp amplifier (Medical Systems Corporation, Greenvale, NY) at a gain of 5 mV/pA for whole-cell current and 100 mV/pA for single-channel current. Series resistance was compensated for >70%. Current signals were stored on videocassettes via a videocassette recorder and a VR-100 digital recorder (Instrutech) for later off-line digitization with Digidata 1200 (Axon Instruments, Foster City, CA) and analysis with Pclamp V6.0 (Axon Instruments) on a Pentium-based personal computer. All recordings were performed at RT (22–25°C) on a Nikon inverted microscope. For superfusing the cells, we used a perfusion system composed of a locally made controller and miniature electric solenoid valves (The Lee Company, Essex, CT) that allows fast switching (<200 msec complete solution exchange time) among different solutions (Liu et al., 1999). The perfusion rate (∼0.3–0.5 ml/min) was controlled by the air pressure applied to the solution reservoirs.
Pharmacology
We used both flow-cytometric and dual-imaging strategies to examine the emergence and characterize the properties of GABAergic-signaling components in entire populations and in single cells, respectively. Pharmacological experiments were performed by exposing the cells to GABA, muscimol, bicuculline (BIC), picrotoxin (PIC), baclofen, and/or saclofen (SAC) to reveal expression of GABAA/Cl−channels and GABAB/Ca2+channels. The cells were also exposed to furosemide, which blocks Cl− ion transport into cells, 3-mercaptopropionic acid (3-MPA), which blocks GAD activity, and nitrendipine (NTDP), which blocks voltage-dependent L-type Ca2+ channels. In some experiments, the cells were exposed to ionomycin, a Ca2+ ionophore, 6-cyano-7-nitroquinoxaline-2,3-dione (CNQX), and/or 2-amino-5-phosphonovaleric acid (APV), respective antagonists at ionotropic glutamate receptors of the AMPA/kainate or NMDA subtype, atropine and/or suramin, respective antagonists of muscarinic acetylcholine receptors and P2 purinoreceptors, and tetrodotoxin (TTX), a blocker of voltage-sensitive Na+channels. Muscimol and APV were obtained from Research Biochemicals (Natick, MA). All other reagents were purchased from Sigma. Some recordings were performed in NPM/BSA, which effectively reduced the effects of endogenous GABA signaling (see Results) and adequately stabilized the baseline cell properties during the experimental period. Otherwise, the recordings were performed in NPM. All experiments were conducted at RT.
RESULTS
GABAA receptor subunit expressions change with neuronal lineage development
We identified subpopulations of proliferating neural precursors, neuronal and neuroglial progenitors, and differentiating neurons in the embryonic rat neocortex using recently developed surface-labeling techniques (Maric et al., 2000b). Cells were identified on the basis of their surface expression of neuron-specific tetanus toxin (TnTx) and progenitor-selective A2B5 markers (Fig.1). Microdissection of the neocortex into VZ/SVZ and CP/SP regions further resolved the TnTx/A2B5-immunoidentified cells according to their anatomical location. Four cell phenotypes composed the VZ/SVZ (see Maric et al., 2000b): neural precursors not labeled with TnTx or A2B5 [TnTx−A2B5−, double-negative (DN)], neuroglial progenitors labeled only with A2B5 [single-positive for A2B5 (SP-A2B5)], and two subpopulations of neuronal progenitors, one that labeled with TnTx at low intensity (SP-TnTxlo) and the other that stained double-positive for both TnTx at low intensity and A2B5 (DP-TnTxlo). In contrast, two subpopulations of differentiating neurons predominated in the CP/SP region: neurons that were labeled with TnTx at high intensity (SP-TnTxhi) and neurons that were double-positive for both TnTx at high intensity and A2B5 (DP-TnTxhi).
Fig. 1.
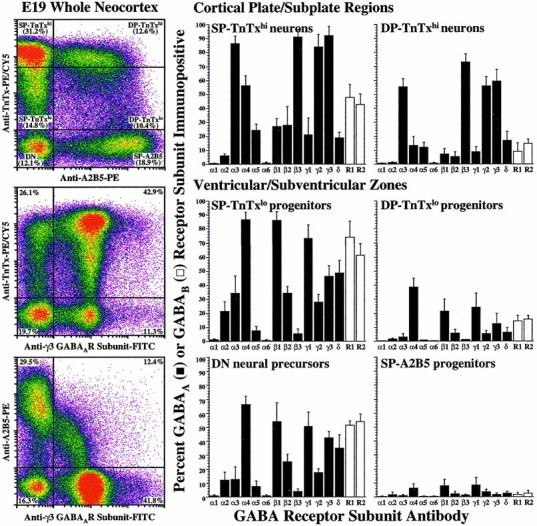
GABAA receptor subunits are differentially expressed during neuronal lineage progression. Using quantitative flow cytometry of TnTx/A2B5 surface-labeling patterns and intensities in conjunction with microdissection, we identified the E19 neocortical cells as neural precursors (DN), neuroglial (SP-A2B5) or neuronal (SP-TnTxlo or DP-TnTxlo) progenitors from the VZ/SVZ, or postmitotic/postmigratory differentiating neurons (SP-TnTxhi or DP-TnTxhi) from the CP/SP regions (Maric et al., 2000b). After surface phenotyping, the cells were fixed and processed for the expression of 13 GABAA receptor and 2 GABAB receptor subunits (see Materials and Methods).Left, As an example, the log–log dot density plots inpseudocolor show the TnTx/A2B5 labeling pattern characteristic of E19 neocortical cells and the distributions of the γ3 GABAA receptor subunit in the context of either surface label. Boundaries (crosshairs) between labeled and unlabeled cells and between cells expressing low and high levels of TnTx labeling (TnTxlo and TnTxhi) have been drawn empirically to quantify the percentages of cells in each subpopulation. Middle, Right, The bar graphs summarize the percentage (means ± SEM) of immunopositive cells in each subpopulation from three independent experiments. Approximately 35–65% of DN neural precursor cells in the VZ/SVZ express α4, β1, γ1, γ3, or δ GABAA receptor subunits (black bars) and both GABAB R1 and R2 receptor subunits (white bars), whereas SP-A2B5 neuroglial progenitors are virtually devoid of GABAA and GABABreceptors. Most SP-TnTxlo neuronal progenitors (75–90%) from VZ/SVZ express α4, β1, or γ1, whereas ∼50% exhibit γ3 or δ, and ∼30% are α3+, β2+, or γ2+. Many of these cells (60–75%) also express both GABAB receptor subunits. Some DP-TnTxlo neuronal progenitors (20–40%) express α4, β1, or γ1 subunits, and ∼15% express both GABAB subunits. Almost all SP-TnTxhineurons (85–95%) from the CP/SP are α3+, β3+, γ2+, or γ3+, as are many DP-TnTxhineurons (55–75%). Approximately half of the SP-TnTxhi neurons exhibit GABAB receptor subunits, whereas only few DP-TnTxhi neurons (∼10%) express GABAB receptors. None of the neocortical populations express α1 and α6 GABAA receptor subunits at E19.
After microdissection and surface phenotyping with TnTx and A2B5, the cells were fixed and immunostained for 13 GABAAreceptor (α1–6, β1–3, γ1–3, and δ) and 2 GABAB receptor (R1 and R2) subunits, and the resulting immunoreactions were quantified by flow cytometry. The data revealed changing patterns of GABAA receptor subunit expressions among the TnTx/A2B5-immunoidentified subpopulations, which were coincident with neuronal maturation (Fig.1). Approximately half of the TnTx−A2B5−neural precursor cells expressed immunodetectable α4, β1, γ1, or γ3 GABAA receptor subunits and both GABAB receptor R1 and R2 subunits. The expression of α4, β1, or γ1 subunits became quite widespread in >75% of SP-TnTxlo neuronal progenitors in the VZ/SVZ, 30–50% of which also exhibited α3, β2, γ2, γ3, or δ subunit immunoreactivity. The trio of α4, β1, and γ1 GABAA receptor subunits was the only one detected at significant levels in 20–40% of DP-TnTxlo neurons. However, as DP-TnTxlo progenitors became DP-TnTxhi differentiating neurons, after migration to the CP/SP region, the expression of α4, β1, or γ1 GABAA receptor subunits became significantly reduced, whereas the expression of α3, β3, γ2, or γ3 GABAA receptor subunits became predominant in most (55–75%) of these cells. The trio of α4, β1, and γ1 subunit expression was likewise quite reduced among SP-TnTxhi neurons in the CP/SP region compared with SP-TnTxlo neuronal progenitors in the VZ/SVZ. For example, α4 decreased from ∼90 to ∼55% in relative abundance, β1 decreased from ∼85 to ∼25%, and γ1 decreased from ∼75 to ∼20%. In addition, δ GABAA receptor subunit expression decreased from ∼50% in SP-TnTxlo neuronal progenitors to ∼20% in SP-TnTxhi neurons. Like DP-TnTxhi neurons, the great majority of SP-TnTxhi neurons (85–95%) were α3+, β3+, γ2+, or γ3+. Both GABABreceptor subunits were expressed by ∼50% of the SP-TnTxhi neurons. Neither α1 nor α6 subunits were immunodetectable in any subpopulation, whereas α5 subunit was expressed in a minor proportion (≤20%) of each TnTx+ subpopulation. SP-A2B5 neuroglial progenitors in the VZ/SVZ did not express GABAAand GABAB receptors.
These results demonstrate changing patterns of GABAA and relatively constant expressions of GABAB receptor subunit immunoreactivities during neuronal lineage progression. The expression of α4, β1, γ1, and δ GABAA receptor subunits decreased as neurons migrated from the VZ/SVZ to the CP/SP, where α3, β3, γ2, and γ3 GABAA receptor subunits predominated.
The changing GABAA receptor subunit expressions quantified during neuronal lineage progression led us to identify their distributions in the intact anatomy of the neocortex at E19. The anatomical distributions corresponded well to the results derived from quantitative flow-cytometric analyses of microdissected subpopulations. For example, subunits dominant among CP/SP dissociates (e.g., α3, β3, γ2) were readily detected in the CP/SP region with intense immunoreaction signals distributed among both cell bodies and radiating processes (Fig. 2). However, there was little, if any, detectable expression of these subunits in the VZ/SVZ. Subunits dominant among VZ/SVZ dissociates (e.g., α4, β1, γ1) were found primarily but not exclusively in the VZ (e.g., α4). The distributions of these GABAA receptor subunit proteins parallel those of the corresponding transcripts, as reported previously (Poulter et al., 1993; Ma and Barker, 1995). Together, these results identify the different anatomical distributions of cells with evolving GABAA receptor subunit expression patterns, which could form functional GABAAreceptor/Cl− channels.
Fig. 2.
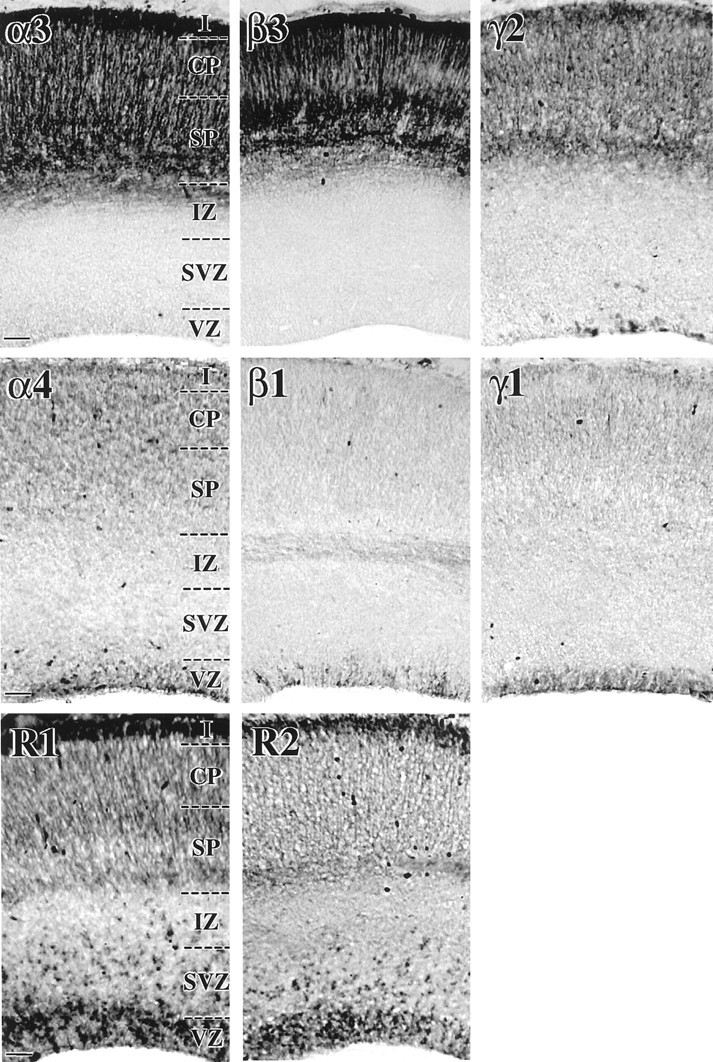
Differential anatomical distributions of GABAA and GABAB receptor subunits in the developing rat neocortex at the end of neurogenesis. Coronal sections (12 μm thick) of E19 rat neocortex were immunostained with antibodies specific for α3, α4, β1, β3, γ1, or γ2 subunits of the GABAA receptor and with antibodies specific for R1 or R2 subunits of the GABAB receptor, and the resulting immunoreactions were visualized with a peroxidase endpoint. The data show that α3 and β3 subunit immunoreactivities are confined almost exclusively to the subplate (SP), CP, and layer I, with cell bodies and radiating processes both intensely stained. The distribution of γ2 subunit immunoreactivity is also primarily restricted to these regions, but immunopositive cells can also be detected in the VZ and SVZ. In contrast, β1 and γ1 immunoreactivities are almost completely confined to cells in the VZ, although β1 expression is also evident in the intermediate zone and faint γ1 signals can be detected in the CP. The distribution of α4 subunit immunoreactivity is most intense in the VZ, with signals also present in the SP, CP, and layer I. GABAB receptor R1 and R2 subunit immunoreactivities show similar distributions in the VZ, SVZ, IZ, SP, CP, and layer I. Scale bars, 50 μm. IZ, Intermediate zone;SP, subplate.
In contrast to the more restricted distributions of the aforementioned GABAA receptor subunits, the anatomical distribution of GABAB receptor R1 and R2 subunits was relatively widespread throughout the developing neocortex at E19 (Fig. 2), with the immunoreactions for each subunit detected in the VZ/SVZ and CP/SP as well as on putative migrating neurons in the IZ. These findings indicate that these GABAB receptor subunits are expressed in both early and late stages of cortical neuron development. In addition, the immunohistochemical distribution of each GABAB receptor subunit in the E19 neocortex appeared to be quite similar, suggesting that these receptor subunits are coexpressed and probably constitute a heteromeric complex, which has been implicated in composing functional GABABreceptors in the CNS (Jones et al., 1998; Bowery and Enna, 2000; Couve et al., 2000). Functional GABAB receptors have been shown previously to mediate cortical neuronal migration from the VZ/SVZ to the CP/SP in rat neocortex over E17–E19 (Behar et al., 1996,1998, 2000).
GABAergic-signaling components emerge in parallel with GABA receptors
We examined the cellular distributions of other putative GABAergic-signaling components emerging during neuronal lineage progression including the expression of two GABA-synthesizing enzymes (GAD65 and GAD67) and GABA (Fig. 3). Approximately 55–60% of the DN precursors were either GAD65+ or GAD67+ (Fig.3A2,B2), whereas <10% of SP-A2B5 neuroglial progenitors were immunopositive for either GAD (Fig. 3A1,A2,B1,B2). Approximately 75–90% of the SP-TnTxloneuronal progenitors were either GAD65+ or GAD67+, making it likely that both enzymes were coexpressed in these cells. A minority of DP-TnTxlo progenitors and DP-TnTxhi neurons were GAD65+ (∼30 and ∼35%, respectively) or GAD67+ (∼18 and ∼15%, respectively), whereas the majority of SP-TnTxhi neurons were either GAD65+ (∼80%) or GAD67+ (∼65%). GABA was primarily confined to neural precursors (∼55%), SP-TnTxlo neuronal progenitors (∼75%), and differentiating SP-TnTxhi neurons (∼95%), while being almost completely absent among SP-A2B5 cells (Fig. 3C1,C2). These results indicate that all of the components necessary to generate autocrine and paracrine GABAergic signals at GABA receptors are expressed during neuronal lineage progression, particularly in SP-TnTx neurons (see below).
Fig. 3.

GAD65, GAD67, and GABA expression is restricted to neuronal lineage development. After microdissection and immunophenotyping with TnTx/A2B5, the cells were fixed and immunostained with antibodies specific for GAD65 (A1, A2), GAD67 (B1, B2), or GABA (C1, C2), and the immunoreactions were quantified by flow cytometry.A1–C1, The frequency histogram plots illustrate the highly contrasting immunoreactivities, with the percentage of immunopositive cells depicted in parentheses, between SP-A2B5 neuroglial progenitors in the VZ/SVZ (left) and differentiating SP-TnTxhineurons in the CP/SP (right). The Controlfrequency histogram represents the immunostaining reaction with secondary antibody in the absence of primary antibody.A2–C2, The bar graphs represent the percentage of immunopositive cells (means ± SEM from 3 independent experiments) in the six subpopulations studied. GAD65- and GAD67-immunoreactive cells exhibit quite similar distributions among the subpopulations, with the expression confined primarily to DN neural precursor cells and TnTx+neuronal progenitors and differentiating neurons. GABA-immunoreactive cells are also primarily confined to DN neural precursor cells and cells progressing along the neuronal lineage. More than 65% of SP-TnTxlo neuronal progenitors in the VZ/SVZ and ∼90% of SP-TnTxhi neurons in the CP/SP are GABAergic (C2).
GABA release is dependent on Ca2+ entry via L-type Ca2+ channels
The emergence of GABAergic neurons in the developing neocortex prompted us to investigate the possible mechanisms of GABA release from these cells. By using cell dissociation and TnTx/A2B5-labeling in conjunction with forward angle light scatter characteristics, a flow-cytometric property related to particle size (Fig.4A), we examined the GABA immunoreactivity from cellular and subcellular compartments after treatment with different pharmacological conditions. Subcellular elements expressed the same pattern of TnTx and A2B5 labeling that was expressed by cell bodies with a significant percentage exhibiting the same high level of TnTx-labeling intensity found with SP-TnTxhi neurons (Fig.4B), suggesting that these elements represented sheared-off processes or growth cones from these cells. These data are supported by previous observations, which showed that TnTx labels the surface of embryonic cortical neurons quite uniformly (Maric et al., 2000b) and that TnTx+GABA+growth cones are readily detected in short-term cultures of embryonic neurons (Vautrin et al., 2000). To test GABA release, TnTx/A2B5-labeled neocortical dissociates were treated for 15 min with increasing [K+]o to depolarize cells or ionomycin to elevate intracellular Ca2+. The cells and subcellular elements were then spun down, fixed in 4% PF, and processed for GABA immunostaining, and the resulting immunoreactivity was quantified by flow cytometry. Under control conditions in NPM, ∼90% of both SP-TnTxhi cell bodies and subcellular elements (putative growth cones) were GABA immunoreactive (Fig.4C,D). The percentages of GABA-immunopositive cells and growth cones decreased in parallel when K+o was elevated or ionomycin was added in NPM during the 15 min incubation (Fig.4C,D). Exposure to ionomycin led to an ∼90% decrease in GABA-immunopositive cell bodies and growth cones, demonstrating that most of the immunodetectable GABA was labile (Fig. 4C,D). Furthermore, the released GABA was not adherent to or taken up by other cells because decreases were also detected in the percentages of GABA+ cell bodies at earlier stages of lineage progression, whereas GABA− cells did not become GABA+ (D. Maric and J. L. Barker, unpublished observations). GABA+SP-TnTxlo neuronal progenitors were less sensitive to K+o-induced release, whereas GABA+TnTx−A2B5−neural precursors were the least sensitive and did not respond to 20 mm KCl (data not shown). However, ionomycin released ∼90% of the immunodetectable GABA in these subpopulations, indicating that the GABA emergent in the earlier stages of lineage progression was also labile.
Fig. 4.
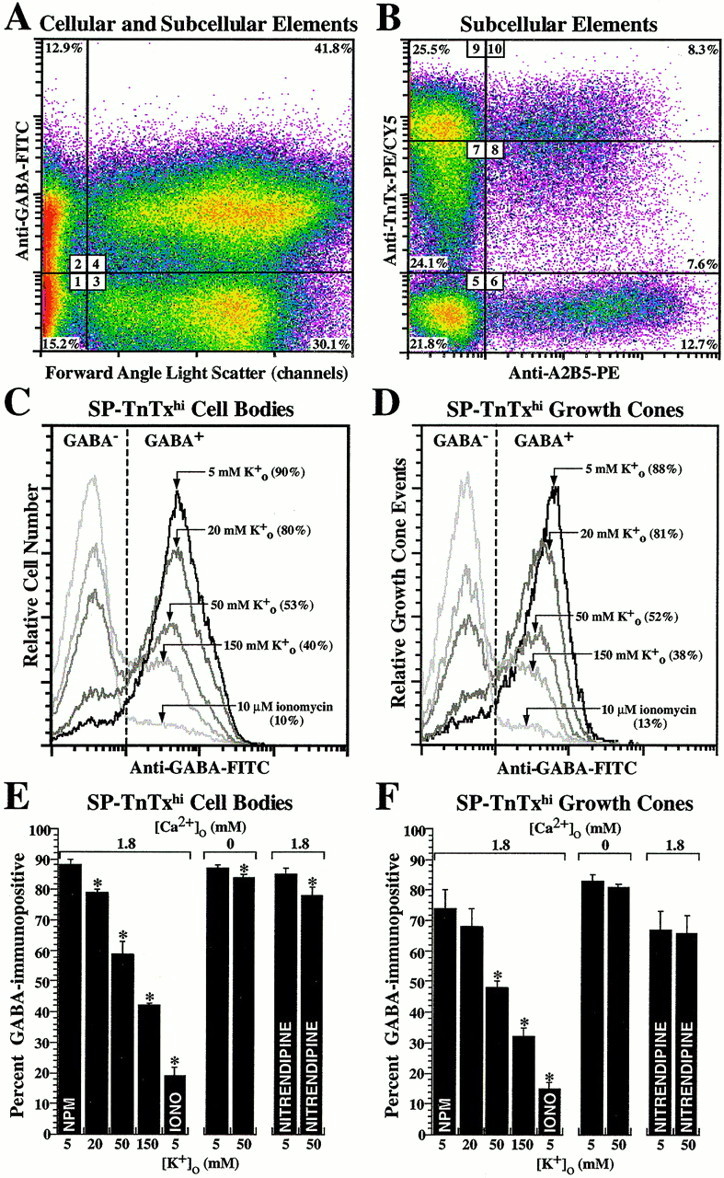
GABA release is modulated via activation of voltage-dependent Ca2+ channels. TnTx/A2B5-labeled neocortical dissociates were exposed to pharmacological conditions to induce GABA release and then fixed in PF, immunostained with anti-GABA antibody, and analyzed by flow cytometry for GABA-immunoreactive cellular and subcellular elements. A, Thepseudocolored dot density plot shows the GABA immunoreactivity under control conditions (dissociates suspended in NPM) as a function of forward angle light scatter (FALS), a flow-cytometric property related to particle size. As outlined by thecrosshairs, the data were quantified in relative percentages of GABA− (region 1) and GABA+ (region 2) subcellular elements with low FALS, in addition to GABA− (region 3) and GABA+ (region 4) cell bodies with high FALS. B, Logical electronic gating on the subcellular elements (A;regions 1, 2) revealed the TnTx/A2B5-labeling patterns and intensities (regions 5–10), which mirrored those characteristic of the six corresponding subpopulations of cortical cell bodies (Fig. 1). C, D, The frequency histogram plots under control (5 mmK+o) and experimental conditions illustrate the percentage of GABA+ cell bodies (C) and subcellular elements (putative growth cones; D) with TnTx/A2B5 immunophenotype that matched that of SP-TnTxhi neurons. E, F, Dissociates were exposed for 15 min to increasing [K+]o and to ionomycin (IONO), with or without Ca2+ in the recording medium, or to 10 μm nitrendipine before addition of K+. Increasing K+leads to decreasing percentages of GABA-immunopositive cell bodies (E) and growth cones (F) of SP-TnTxhi neurons, which become GABA-immunonegative, indicating complete GABA release from these compartments. Elevated K+o also produces a decrease in the modal fluorescence intensities (depicted by arrows;C, D) of the remaining GABA+cells and growth cones by ∼50%, indicating fractional GABA release from these subpopulations. Ionomycin eliminates the immunodetectable GABA from ∼90% of SP-TnTxhi cells and growth cones. The effects of K+ and ionomycin on GABA release are neutralized when dissociates are resuspended in Ca2+-free saline, whereas the effects of 50 mm K+ are blocked by nitrendipine. The bar graphs represent the percentage of GABA-immunopositive cells and growth cones (means ± SEM) from three independent experiments. Asterisks depict statistically significant differences (p < 0.05 or less) between experimental and resting (NPM) conditions for each corresponding population.
The Ca2+ dependency of evoked GABA release was evaluated by resuspending cells in Ca2+o-free saline and then exposing them to elevated K+o or ionomycin. Resuspension in Ca2+o-free saline did not affect the percentages of GABA+SP-TnTxhi cell bodies and growth cones but completely eliminated the changes induced by elevated K+o (Fig.4E,F) and ionomycin (data not shown). These results demonstrate that Ca2+ entry is necessary to release immunodetectable GABA and that intracellular Ca2+ release, which occurs in these cells in Ca2+-free saline when exposed to ionomycin (Maric et al., 2000a), is not effective.
We also studied the possible role of voltage-dependent L-type Ca2+ channels in Ca2+-dependent GABA release, because these channels become functionally expressed during neuronal lineage progression (Maric et al., 2000a). Nitrendipine, which blocks L-type Ca2+ channels, antagonized the GABA release by elevated K+oin both SP-TnTxhi cell bodies and growth cones (Fig. 4E,F), thus identifying voltage-dependent L-type Ca2+ channels as the primary pathway for Ca2+ entry triggering GABA release. Collectively, these results demonstrate that most of the GABA in cell bodies and growth cones of differentiating cortical neurons is labile and can be released via Ca2+ entry through L-type Ca2+ channels.
Functional responses to GABA increase during neuronal differentiation
To investigate the appearance and distribution of functional GABAergic signals during cortical cell development, CP/SP and VZ/SVZ dissociates were immunolabeled with TnTx/A2B5 and stained with potentiometric or calcium-sensitive physiological indicator dyes, before pharmacological experiments targeting GABAA and GABABreceptors were performed. Because differentiating neocortical neurons became progressively GABAergic (Fig. 3) and endogenous GABA signaling increasingly contributed to their baseline properties (see Figs. 6-9), we have empirically supplemented the NPM with BSA, which effectively reduced the contribution of endogenous GABA signaling (see Fig.9A), before testing the effects of exogenously applied GABA or GABA-mimetic agonists or antagonists. As expected from the distribution of GABA receptor subunits among phenotyped subpopulations (Fig. 1), both membrane potential and Ca2+c responses to exogenous GABA were primarily confined to cells undergoing neuronal differentiation (Fig. 5). GABA depolarized or elevated Ca2+c in only a fraction (10–15%) of the TnTx−A2B5−neural precursors and SP-A2B5 neuroglial progenitors from the VZ/SVZ (Fig. 5A1,A2,B1,B2). GABA responses increased in DP-TnTxlo neuronal progenitors, 25% of which depolarized (Fig. 5A2), but none elevated Ca2+c (Fig.5B2). In contrast, ∼50% of the SP-TnTxlo neuronal progenitors depolarized (Fig. 5A2) and ∼25% elevated Ca2+c (Fig.5B2) after exposure to GABA. Similarly, GABA depolarized ∼60% of the DP-TnTxhi neurons (Fig.5A2), while elevating Ca2+c in only ∼20% (Fig. 5B2). The most responsive population was detected among SP-TnTxhi neurons from the CP/SP, ∼90% of which were depolarized by GABA (Fig. 5A1,A2) and ∼55% of which responded with elevated Ca2+c (Fig.5B1,B2).
Fig. 6.

Autocrine activation of GABAAreceptor/Cl− channels by GABA dominates baseline conductance in differentiating GABAergic neurons. Whole-cell patch-clamp recording with a Cl−-filled pipette was used to maintain membrane potential at −80 mV in a representative CP/SP neuron, which had been cultured for 24 hr and was initially recorded in an unperfused plate. A1, The macroscopic baseline current signal exhibits random microscopic fluctuations until the recorded neuron is exposed to bicuculline, which depresses most of the ongoing Cl− channel activity and shifts the average current to a less negative value. A2, Histograms of signal amplitude accumulated over time reveal symmetrical distributions before and after bicuculline with the baseline current averaging approximately −8 pA (equivalent to ∼100 pS conductance). The dotted lines represent Gaussian fits to the baseline and signal distribution. A3, Spectral analysis of the bicuculline-sensitive current fluctuations reveals two exponentially distributed burst-length durations (∼3 and ∼100 msec) in Cl− channel activity, with the latter accounting for ∼80% of the power in the signal.B1, Superfusion of the plate eliminates the fluctuating baseline current signal, leaving random, spontaneous Cl− channel openings that do not summate. Exogenous application of 3 μm GABA evokes a sustained inward (negative) current response of approximately −30 pA superimposed with fluctuations. B2, Spectral analysis reveals two exponentially distributed burst-length durations with values that are virtually identical to those calculated from the baseline signal.
Fig. 7.

Spontaneous GABAAautoreceptor/Cl− channel activity recorded in the whole-cell mode in superfused CP/SP neurons. The neurons were cultured for 24 hr and clamped in the whole-cell mode with Cl−-filled pipettes while being continuously superfused with fresh saline. A, Bicuculline (100 μm; open horizontal bars) included in the superfusing saline rapidly and reversibly blocks the majority of Cl− channel openings (downward-going deflections in the top trace). The all-or-none activity is displayed at a faster time base in the bottom trace. B1, Bicuculline (arrow) blocks the spontaneous Cl− channel activity in another CP/SP neuron. B2, There are two exponential distributions in the open channel activities (τ1, ∼0.9 msec; τ2, ∼4.6 msec). B3, The amplitude histogram of the channel activity is nearly symmetrical with a single well defined mode at −1.3 pA.
Fig. 8.

Autocrine GABAergic signaling at GABAA receptor/Cl− channels polarizes CP/SP neurons near −50 mV and sustains Ca2+c levels in neurons with K+-dependent Ca2+cresponses. Dual-imaging of oxonol and fura-2 was used to study the membrane potential and Ca2+c levels of CP/SP neurons cultured for 24 hr, which were immunolabeled with TnTx and A2B5 post hoc to discriminate between SP-TnTx and DP-TnTx phenotypes. The intensities of immunolabeling reactions were quantified from digitally captured images of TnTx and A2B5 fluorescence using NIH Image software. TnTxlo and TnTxhi populations were discriminated by digitally thresholding the TnTx fluorescence at 50% maximal intensity. The potentiometric (top) and Ca2+c (bottom) signals recorded simultaneously from two representative neurons of SP-TnTxlo (red traces) and SP-TnTxhi (blue traces) phenotype were calibrated according to previously established protocols (Maric et al., 2000b). While being continuously superfused with NPM, both populations of neurons remain polarized near −50 mV, and both are hyperpolarized in 100 μm BIC (solid horizontal bar) by 25–30 mV in a reversible manner. Elevating [K+]o (open horizontal bars) from 5 to 20 mm does not alter membrane potential, whereas 50 and 150 mm depolarize both neurons to approximately −30 and ∼0 mV, respectively. Simultaneous imaging of Ca2+c levels reveals that Ca2+c levels remain stable in the SP-TnTxlo neuron at ∼90 nm throughout the experiment. In the SP-TnTxhi neuron, baseline Ca2+c is higher (∼250 nm), and in bicuculline, it decreases and then recovers with a time course that closely parallels the coincident changes in membrane potential. Elevating [K+]o to 20 mmdoes not increase Ca2+c, whereas 50 and 150 mm K+o increase Ca2+c to 450 and 800 nm, respectively.
Fig. 9.
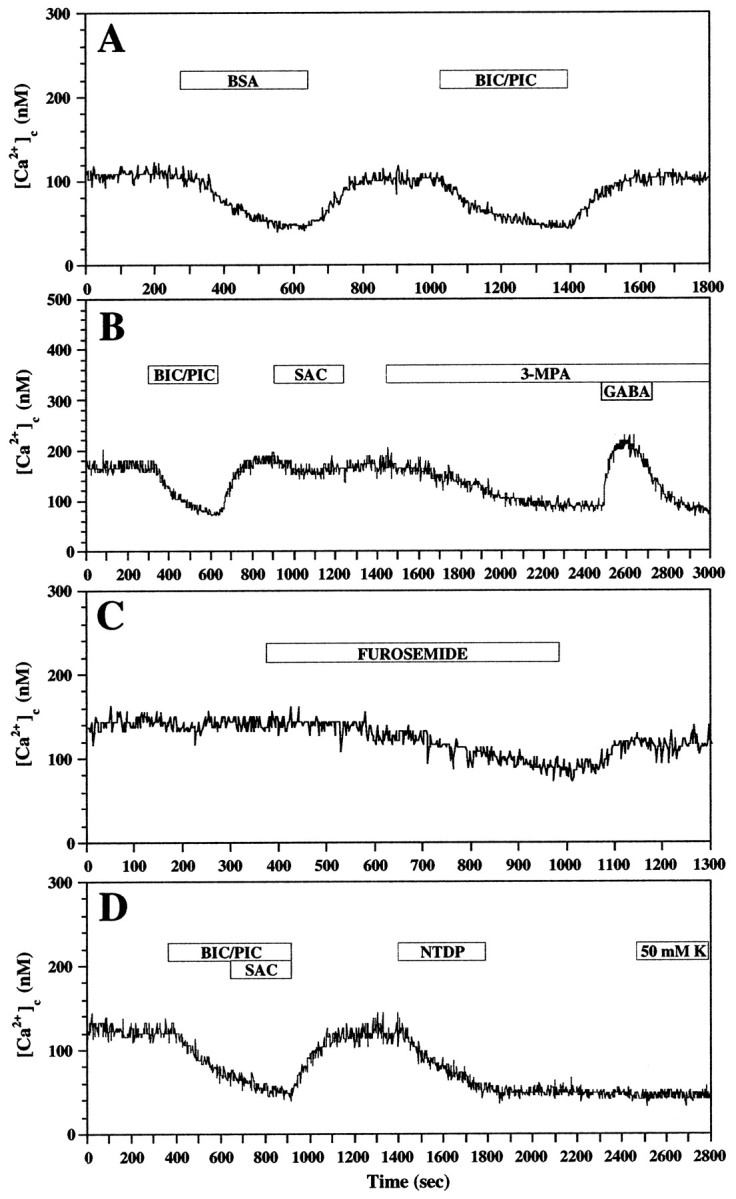
GAD-derived GABA acting at GABAA and GABAB receptors sustains Ca2+c levels in CP/SP neurons via L-type Ca2+ channels. Ca2+ imaging with fura-2 was performed on SP-TnTxhi neurons, which were cultured for 24 hr and immunoidentified post hoc. The cells were continuously superfused with NPM before and during pharmacological manipulation (indicated by open horizontal bars). A, Exposure to BSA (1 mg/ml) mimics the depressant effects of 100 μm BIC and 100 μmPIC on baseline Ca2+c levels both in monoexponential time courses and the extent of depression and recovery.B, SAC (100 μm), the GABABreceptor antagonist, also depresses baseline Ca2+c levels but less effectively than BIC/PIC. Inclusion of 3-MPA (1 mm), which blocks GAD synthesis of GABA, slowly and persistently decreases baseline Ca2+c levels but does not prevent the Ca2+c response to 10 μmGABA. C, Furosemide (1 mm), which blocks Na-K-2Cl cotransporter activity, slowly decreases Ca2+c, which partially recovers during washing. D, NTDP (10 μm), which blocks voltage-dependent L-type Ca2+ channels, decreases Ca2+c with the same time course and to the same extent as does the combination of BIC/PIC/SAC, but the effects persist and prevent any Ca2+c response to 50 mmK+o, implicating L-type Ca2+ channels in sustaining baseline Ca2+c levels.
Fig. 5.

Distribution of pharmacological responses to GABA during neuronal lineage progression parallels the expression of GABAA receptor subunits. Cells dissociated from the CP/SP and VZ/SVZ were labeled with TnTx/A2B5 and stained with oxonol or fluo-3. Changes in membrane potential and Ca2+c to exogenous application of GABA or GABA mimetics were quantified in phenotyped subpopulations using flow cytometry. Before the pharmacological application of varying concentrations (10−8–10−4m) of GABA, muscimol, or baclofen, the cells were first resuspended in NPM/BSA to reduce the contribution of endogenous GABA signaling (Fig. 9A). A1, B1, Typical resting oxonol and fluo-3 fluorescence signal distributions from ∼10,000 SP-A2B5 neuroglial progenitors from the VZ/SVZ and SP-TnTxhi differentiating neurons from the CP/SP (thin-line frequency histograms) and their corresponding distributions after peak changes in membrane potential and Ca2+c recorded within 2 min after application of 10 μm GABA (thick-line frequency histograms) are illustrated. The raw data illustrate the highly contrasting results, with the percentage of responding cells shown in parentheses. A2, B2, The bar graphs represent the percentage of total cells (means ± SEM from 3 independent experiments) depolarizing or increasing Ca2+c in response to asymptotic concentrations of GABA (≥10 μm) in the six subpopulations studied. Few DN neural precursor cells or SP-A2B5 neuroglial progenitors respond to GABA. In contrast, GABA depolarizes the great majority of SP-TnTxhi neurons from their modal resting potential of −80 to −45 mV at the peak response (A1). The proportion of cells exhibiting depolarizing responses to GABA increases progressively among cells undergoing neuronal lineage progression (A2). Both SP-TnTx+ subpopulations contain more responding neurons than do the DP-TnTx+ counterparts. Few SP-A2B5 progenitors or DN precursor cells increase Ca2+c in response to GABA (B1, B2), whereas more than half the SP-TnTxhi neurons respond, with most peaking at ∼400 nm Ca2+c(B1). Cells expressing GABA-induced Ca2+c responses are primarily confined to the TnTx-labeled subpopulations (B2).C1, Dose–response curves of muscimol-induced depolarization were performed in low-Cl− saline, in which 145 mm NaCl was substituted with an equimolar concentration of Na isethionate (Sigma), to amplify Cl−-dependent depolarization. The results show that consistently more cells depolarize under these conditions compared with those depolarized by GABA in normal Cl−-containing saline (A2). C2, Pharmacological properties of GABAA receptors change systematically during neuronal lineage development, with EC50 values progressively decreasing as TnTx labeling intensifies. SP-TnTxlo and SP-TnTxhisubpopulations contain the greatest number of responding cells and exhibit the lowest EC50 values. Hill coefficients remain relatively constant during neuronal differentiation.
Virtually all of the depolarizing responses to GABA were mimicked by the GABAA receptor agonist muscimol and blocked by either bicuculline or picrotoxin (data not shown; but see Figs.6-9), indicating a direct involvement of GABAAreceptor/Cl− channels in the phenomenology. Elevation in Ca2+c levels induced by GABA was for the most part antagonized by bicuculline, picrotoxin, and nitrendipine (data not shown; but see Fig. 9), suggesting a mechanism involving Ca2+ entry via L-type voltage-dependent Ca2+ channels, which were putatively activated by GABA-induced depolarization. Baclofen did not produce detectable changes in either membrane potential or Ca2+c (data not shown), implying either that the function of GABABreceptor/Ca2+ channels might have been compromised during acute cell preparation or that the activation of these receptors nominally contributes to membrane potential or Ca2+c at this stage of cortical neuron development. Relatively modest contributions of GABAB receptor/Ca2+channels to Ca2+c levels were indeed shown in cell cultures of migrating and differentiating cortical neurons after recovery from dissociation (see Behar et al., 1996) (see Fig. 9B).
To test the potency of muscimol at GABAAreceptors, the cells were resuspended in low Cl−-containing saline to maximize detection of Cl−-dependent depolarizing responses. Under these conditions, muscimol depolarized more cells in each subpopulation studied (Fig. 5C1, C2) than GABA (or muscimol) did in the saline-containing normal Cl−o (Fig.5A2), with most cells depolarizing to −15 mV rather than to −45 mV (data not shown). These optimized experimental conditions show that all of the depolarizing responses are Cl− ion dependent and that some cells depolarized by GABA in normal saline likely went undetected with this strategy. Systematic dose–response studies under these optimized conditions showed that ≥10 μm concentrations of muscimol were asymptotic in depolarizing up to 46% of TnTx−A2B5−neural precursor cells and up to 35% of DP-TnTxlo neuronal progenitors, whereas ≤5 μm concentrations were asymptotic in depolarizing the great majority of cells in all other neuronal subpopulations. The EC50 values decreased from micromolar to submicromolar as TnTx labeling intensified in differentiating neurons, whereas Hill coefficients remained relatively constant ranging from 1.4 to 1.8 (Fig. 5C2). The increase in agonist potency may be related to the evolving GABAA receptor subunit compositions and receptor densities.
Electrophysiology of GABAAautoreceptor/Cl− channel activity in CP/SP neurons
The concerted expression of GABAergic-signaling components and the presence of releasable GABA at the level of cell bodies and growth cones of differentiating cortical neurons led us to investigate the effects of endogenous GABA on membrane properties of these cells. We used patch-clamp techniques to optimize the recording of Cl−-dependent currents in acutely cultured CP/SP neurons under unperfused and superfused conditions. Without perfusion, all differentiating neurons (n = 8), which were recorded in the whole-cell mode and clamped at negative potentials, exhibited fluctuating baseline current signals, which were reduced after diffusion of bicuculline into the unperfused bath (Fig.6A1). Spectral analysis showed that the bicuculline-sensitive fluctuating baseline signal could be fitted by two Lorentzian terms, indicating two exponential distributions in the burst-length durations of the randomly activated Cl− channels (Fig.6A3). Continuous superfusion of the recorded neurons with fresh saline rapidly eliminated most of the baseline current signal and associated fluctuations (Fig. 6, compare B1,A1), creating a steady DC level with spontaneous intermittent openings of Cl− channels whose frequency was not sufficient to generate a summating current signal.
After superfusion, application of micromolar GABA typically evoked an inward Cl− current response superimposed with random fluctuations in all recorded neurons, which, after spectral analysis, involved the same pair of exponentially distributed burst-length durations found with the endogenous baseline signal recorded in the absence of superfusion (Fig. 6, compareB2,A3).
All of the continuously superfused CP/SP neurons recorded in a whole-cell mode exhibited a residual level of Cl− channel activity. This activity was rapidly and reversibly eliminated by bicuculline (Fig.7A) and reversed polarity at 0 mV (∼ECl) (data not shown). Quantitative analyses revealed single Cl−channel levels of activity in all superfused neurons (Fig.7B) with the unitary properties of GABA-activated Cl− channels. The residual Cl− channel activity most likely reflected autocrine activation of GABAAautoreceptor/Cl− channels by GABA at the undersurface of the neuron, which was not as accessible to superfusion as the upper surface. The bicuculline sensitivity of both the endogenous baseline macroscopic current signal and the microscopic Cl− channel activity persisting during superfusion, together with the close similarities in the burst-length durations estimated for the summating Cl−channel activity composing the baseline and GABA-activated macroscopic currents, strongly suggests that the baseline signal is dominated by GABA-induced activation of GABAAautoreceptor/Cl− channels, which evolves from a surface-accessible compartment.
Autocrine GABAergic signaling tonically elevates Ca2+c levels
We also investigated the effects of endogenous GABA on potentiometric and Ca2+ signaling in differentiating cortical neurons using a noninvasive optical strategy. We used a dual video microscopic-imaging technique to record simultaneously membrane potential and Ca2+c levels of acutely cultured CP/SP neurons. After imaging, the neurons were immunoidentified with TnTx and A2B5 labeling. The analysis was focused on neurons with the SP-TnTx phenotype because most of them were GABAergic at the beginning of culture, although DP-TnTx neurons increasingly became GABAergic after 24 hr of culture (data not shown). The great majority (>80%; n = 32) of SP-TnTxhi neurons, which were continuously superfused with NPM, exhibited baseline membrane potentials of approximately −50 mV (Fig. 8,top). Bicuculline rapidly and reversibly hyperpolarized these cells from −50 mV to near −80 mV. In addition, bicuculline rapidly and reversibly depressed baseline Ca2+c levels in those SP-TnTxhi neurons that coexpressed significant levels of voltage-dependent Ca2+ entry, which was identified by stepwise depolarization with elevated KCl (Fig. 8, bottom). The time courses in potential and Ca2+c changes were nearly superimposable despite the disparities in the response times of the two dyes, indicating that the two parameters were closely linked. The much slower response time of the potentiometric dye (∼60 sec) compared with that of fura-2 (∼1 sec) suggests that the rate of hyperpolarization induced by bicuculline governed the rate of decrease in Ca2+c level. Putatively less-differentiated CP/SP neurons with the SP-TnTxlo phenotype, which constituted ≤15% of the cultured cells, exhibited relatively low baseline Ca2+c levels (<100 nm) and were insensitive to the hyperpolarizing effects of bicuculline. In addition, these neurons did not respond to stepwise increases in [K+]o despite being depolarized to the same membrane potentials as SP-TnTxhi neurons with bicuculline-sensitive baseline Ca2+c levels (Fig. 8). Interestingly, most SP-TnTxhi neurons that had differentiated in culture for 24 hr were depolarized by 20 mm KCl to approximately the same potential and generated approximately the same baseline Ca2+c level that was recorded in 5 mm K+. Thus, the autocrine GABAergic signaling at GABAAreceptor/Cl− channels dominated the baseline properties of these cells over the 5–20 mm range of [K+]o.
To investigate the possible mechanisms underlying autocrine GABAergic regulation of baseline Ca2+c in SP-TnTxhi neurons, we performed pharmacological experiments targeting the contribution of endogenous GABA synthesis, GABAA and GABAB receptors, intracellular Cl− ion homeostasis, and voltage-dependent L-type Ca2+ channels. In addition, the accessibility of endogenous GABA was tested in the presence of albumin serum proteins (i.e., BSA), which purportedly act as natural carriers for a wide spectrum of signaling molecules in vivo. Superfusion with BSA closely mimicked the depressant effects of bicuculline and picrotoxin on Ca2+c levels both in terms of time course of decrease and recovery and extent (Fig.9A). Both phases could be approximated by monoexponential time courses, which were ∼2 min for the decreasing phase and ∼1 min for recovery. In one representative experiment, Ca2+c levels in 30 SP-TnTxhi neurons averaged 97 ± 4 nm (mean ± SEM) during superfusion before BSA, 52 ± 4 nm after the effect of BSA had asymptoted, 99 ± 6 nm in recovery, 59 ± 5 nm after bicuculline and picrotoxin, and 105 ± 6 nm after another recovery. These results demonstrated the persistence and robustness of autocrine GABAergic signaling at GABAAreceptor/Cl− channels under continuous superfusion in saline. Previously, we reported that BSA stabilized the resting potentials of virtually all dissociated cortical cells and cultured CP/SP neurons near or at the equilibrium potential for K+ ions and lowered Ca2+c levels to ∼100 nm or less (Maric et al., 1998c, 2000b). Although the mechanisms of the effects of BSA are as yet unclear, it may be important physiologically during cortical development.
Superfusion with saclofen, a GABAB receptor antagonist, depressed baseline Ca2+c levels in ∼60% of 32 SP-TnTxhi neurons studied (Fig.9B). However, this decrease in Ca2+c level was relatively modest (19 ± 3 nm;n = 20) compared with the effects of antagonists at GABAA receptor/Cl−channels, which decreased Ca2+c levels by 55 ± 5 nm in the same neurons. Superfusion of these neurons with 3-MPA, which blocks GAD-derived synthesis of GABA, decreased baseline Ca2+clevels to an extent similar to that of bicuculline/picrotoxin, when compared in the same experiment. For example, bicuculline/picrotoxin depressed Ca2+c levels in 37 neurons by 52 ± 4 nm, whereas 3-MPA decreased Ca2+c by 58 ± 3 nm (Fig. 9B). However, the time course of the depressant effect of 3-MPA was delayed rather than immediate and gradual compared with that of either GABA receptor antagonists and, unlike them, not rapidly reversible. Ca2+c levels only partially recovered after 10–20 min of superfusion in saline free of 3-MPA. The depressant effects of 3-MPA on baseline Ca2+c did not interfere with the Ca2+c response evoked by exogenous GABA (Fig. 9B), indicating that its effects did not involve activation either of GABAA receptors by GABA or of the downstream components necessary for elevating Ca2+c. Therefore, the GABAergic contribution to baseline Ca2+c levels requires constitutive synthesis of GABA, which is released to act in an autocrine manner at both GABAA and GABAB receptors.
We also used furosemide, which blocks Na-K-2Cl cotransporter activity, to demonstrate the critical importance of the physiological Cl− gradient in the contribution of GABA to baseline Ca2+c levels. Furosemide decreased Ca2+c levels in all of the 26 SP-TnTxhi neurons studied by 43 ± 5 nm with a delayed and gradual time course (Fig. 9C), similar to that recorded with 3-MPA (Fig.9B). These effects were partially reversible over 5–10 min.
Nitrendipine, which blocks voltage-dependent L-type Ca2+ channels, decreased Ca2+c levels of SP-TnTxhi neurons with a time course similar to that recorded with GABAA receptor antagonists, indicating that baseline Ca2+c levels involved Ca2+o entry via L-type Ca2+ channels, which were opened by the depolarization resulting from the autocrine activation by GABA of GABAA receptor/Cl−channels (Fig. 9D). In 27 neurons studied, nitrendipine decreased their baseline Ca2+c by 57 ± 5 nm and blocked evokable Ca2+ entry mediated by K+-induced depolarization.
In a parallel series of experiments, we investigated the possible contribution of ionotropic glutamate receptors and voltage-dependent Na+ channels to tonic Ca2+c signaling of SP-TnTxhi neurons, because these forms of excitability are increasingly expressed in differentiating cortical neurons (Maric et al., 2000b). Superfusion with CNQX and APV, respective antagonists at the AMPA/kainate and NMDA receptors, and TTX, a blocker of voltage-sensitive Na+ action potentials, did not affect baseline Ca2+c levels of the 26 neurons recorded in NPM, whereas all exhibited sensitivity to bicuculline and picrotoxin (data not shown). Taken together, these results indicated that GABAergic signaling via GABAAautoreceptor/Cl− channels dominates the baseline properties of differentiating embryonic cortical neurons independently of the other expressed forms of membrane excitability.
Autocrine GABAergic signaling is critical to neurite outgrowth
The emergence of functional GABAergic-signaling components among differentiating CP/SP neurons and their capacity to release GABA from both cell body and growth cone compartments suggested that some form(s) of GABAergic signaling may occur during neurite outgrowth. We therefore investigated the possible physiological roles of GABAergic signaling during the earliest stages of neuronal process formation and regeneration. CP/SP neurons were cultured for 2–9 d in Neurobasal/B27 medium, which permitted optimal neurite outgrowth and recovery from dissociation. Over the first 48 hr, the majority of neurons developed well differentiated processes (Fig.10A1), with an average total neurite length of 36 ± 3 μm (mean ± SEM;n = 30), and exhibited abundant GABA immunoreactivity (Fig. 10A2). Addition of 3-MPA to block GABA synthesis at the beginning of culture produced approximately a 70% reduction in neurite outgrowth (Fig. 10B1), resulting in an average neurite length of 12 ± 1 μm (mean ± SEM;n = 25) and a threefold reduction of GABA immunoreactivity (Fig. 10B2). This effect was not caused by cytotoxicity, because comparable numbers of neurons survived in 3-MPA-treated preparations as did in control cultures (data not shown).
Fig. 10.
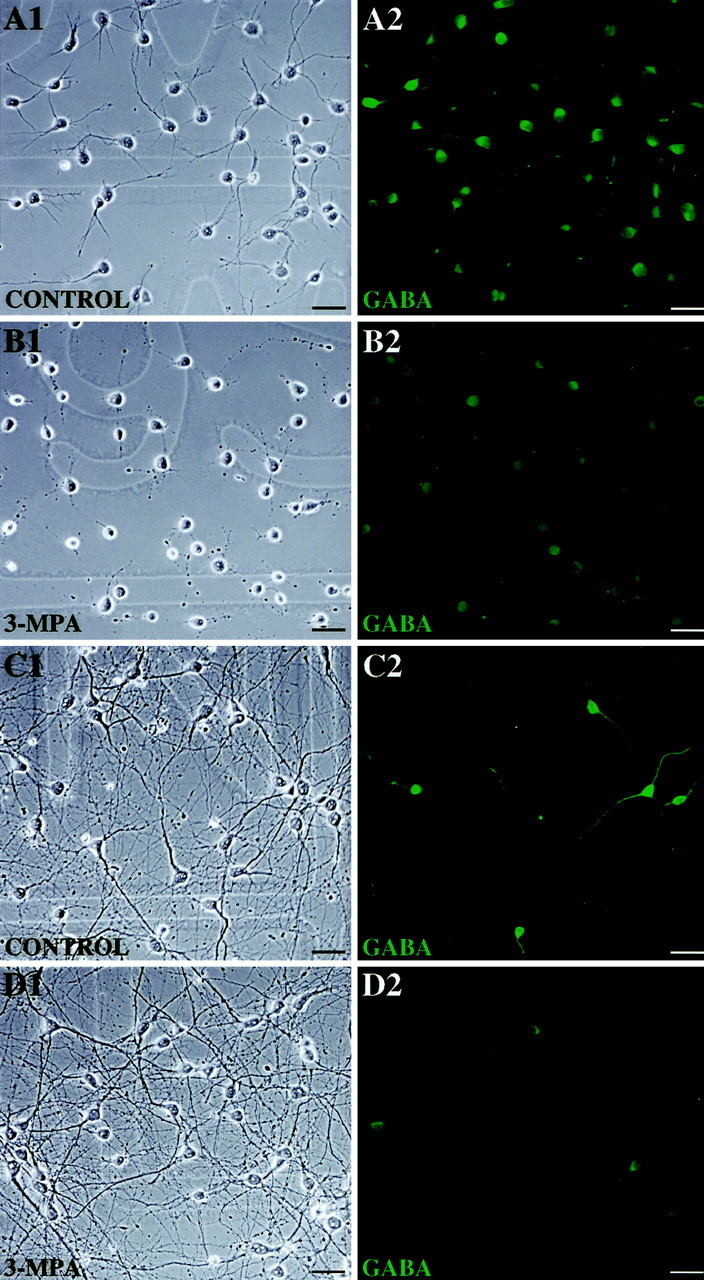
GAD-derived GABA is critical to neurite outgrowth in CP/SP neurons, but its expression and modulatory effects are transient. CP/SP neurons were cultured for 2 or 9 d in Neurobasal/B27 medium (control). Some preparations were treated with 100 μm 3-MPA for 48 hr before termination of culture. The cells were then fixed in PF and processed for anti-GABA immunofluorescence staining, which was arbitrarily quantified using the Attofluor RatioVision acquisition software (Atto Instruments). The total length of neurites was calculated from phase-contrast images using the NIH Image Analysis software. To examine cell viability and cytotoxic effects of 3-MPA, companion plates were processed separately with a live/dead staining kit (Molecular Probes). A1, Under control conditions all neurons exhibit extensive process formation with each neuron forming more than one process.A2, Virtually all of the neurons are GABA immunopositive (green fluorescence), as are many of their processes. B1, After 3-MPA treatment, most of the neurons survive after 2 d in culture (as confirmed from live/dead staining in the companion plate; data not shown) but extend much shorter processes. B2, Few of these neurons exhibit detectable GABA immunoreactivity, as would be expected from the 3-MPA-induced inhibition of GAD-derived GABA synthesis.C1, After 9 d in culture in control preparations, the neurite outgrowth has been primarily completed, and all neurons form integrated networks of processes. C2, At this stage, <20% of the neurons are GABA immunopositive.D1, Addition of 100 μm 3-MPA for 48 hr before the end of culture does not have detectable effects on cell morphology. D2, However, the GABA immunoreactivity of the remaining GABAergic neurons is significantly reduced by 3-MPA. Scale bar, 20 μm.
During initial neurite outgrowth over the first 24–48 hr, Ca2+c levels quantified in neurons under control conditions and in cultures treated with 3-MPA revealed steady baselines of 126 ± 9 nm(n = 30) and 45 ± 3 nm(n = 31), respectively. Bicuculline and picrotoxin decreased Ca2+c by 56 ± 6 nm in these neurons under control conditions but only by 3 ± 3 nm in 3-MPA-treated neurons. Together, these results indicate that 3-MPA effectively attenuated synthesis of GABA by GAD, thus reducing levels of immunodetectable GABA in most neurons. These effects of 3-MPA practically eliminated the indirect contribution to baseline Ca2+c levels. A reduced complement of L-type Ca2+ channels persisted in the neurons exposed to 3-MPA, as manifested by a nearly twofold increase in Ca2+c(to 81 ± 4 nm) after exposure to 50 mm KCl, which is markedly less than the peak Ca2+c response to 50 mm KCl in CP/SP neurons cultured in control conditions. This reduction in peak Ca2+c response to KCl may reflect the marked attenuation in neurite outgrowth and membrane surface area where functional L-type Ca2+channels could have become incorporated.
By 9 d in culture, neurite formation was primarily completed (Fig.10C1), and the number of GABAergic neurons markedly decreased (Fig. 10C2). Furthermore, the facilitating effect of GAD-derived GABA on process formation became nominal, because the remaining GABAergic neurons, which exhibited extensive neurite outgrowth after 9 d in culture, did not show detectable sensitivity to 3-MPA (Fig. 10D1), even after a marked reduction in GABA synthesis (Fig. 10D2). These findings suggest that GAD-derived GABA was not required to maintain neurite outgrowth after outgrowth was completed.
In a parallel set of experiments, we also selectively blocked other components, which we identified in the autocrine GABAergic-signaling circuit, to reveal their possible roles in neurite outgrowth (Fig.11). Mean total neurite length obtained under control conditions after 48 hr of culture in Neurobasal/B27 medium (37 ± 3 μm; n = 31) was effectively reduced with bicuculline (20 ± 2 μm; n = 40), picrotoxin (17 ± 2 μm; n = 43), furosemide (11 ± 1 μm; n = 42), or nitrendipine (12 ± 1 μm; n = 51), although comparable numbers of neurons consistently survived in three independent experiments of each condition as did in the control (data not shown). Furosemide and nitrendipine closely mimicked the effects of 3-MPA in reducing total neurite outgrowth by ∼70% (Fig. 11E,F), whereas bicuculline and picrotoxin were slightly less effective, attenuating total neurite outgrowth by ∼50% (Fig.11B,C).
Fig. 11.
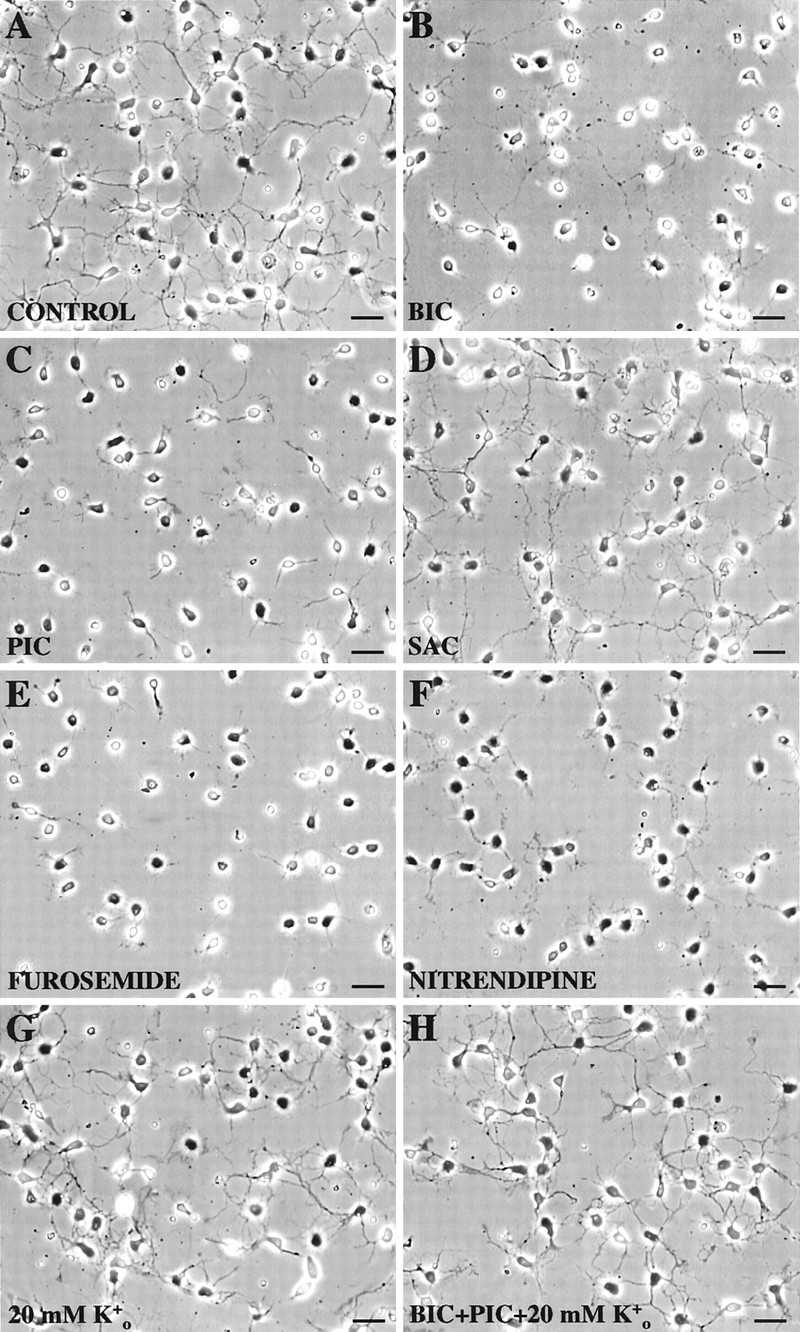
Autocrine GABAergic signaling is critical to neurite outgrowth, but it can be mimicked using KCl depolarization. CP/SP neurons were cultured for 48 hr under control or experimental conditions. The cells were then fixed, and their neurite length was quantified as described in Figure 10. A, Under control conditions in Neurobasal/B27 medium, all neurons project one or more neurites. B–F, Inclusion of either 100 μmBIC (B), 100 μm PIC (C), 100 μm furosemide (E), or 10 μm nitrendipine (F) in the culture medium over 48 hr effectively attenuates neurite outgrowth in the majority of neurons, as illustrated in representative fields, whereas 100 μm SAC (D) has no significant effects. G, H, Inclusion of 20 mm KCl preserves neurite outgrowth in neurons whose GABAAreceptor/Cl− channels have been blocked by 100 μm bicuculline and 100 μm picrotoxin (H), whereas 20 mm KCl by itself has no significant effects on neurite outgrowth (G) compared with control. Live/dead staining (see legend of Fig. 10) in the companion plates of each of the above conditions did not show significant differences in cell viability (data not shown). Scale bar, 20 μm.
The possible contribution of GABABreceptor-coupled functions to neurite outgrowth was investigated by incubating CP/SP neurons in saclofen, which modestly decreased baseline Ca2+c levels (Fig.9B). Saclofen had no significant effects on neurite outgrowth (36 ± 3 μm; n = 68) compared with that of control (Fig. 11A,D). Furthermore, exposure to CNQX, APV, atropine, suramin, and/or TTX did not alter baseline Cac2+ levels of CP/SP neurons or affect neurite outgrowth of these cells (data not shown).
Taken together, these pharmacological results implicate GABAA receptor/Cl−channels, Cl− cotransporter activity, and L-type Ca2+ channels in the autocrine GABAergic circuit that facilitates the initial stages of process formation and/or regeneration. However, after 7 d or more in culture when neurite outgrowth had become quite extensive and many neurites made visible contact with each other, pharmacological interruption of the circuit for 24–48 hr had no apparent effects on either Ca2+c levels or morphology (data not shown, but the results resembled those in Fig.10C1,D1). In addition, GABA immunoreactivity gradually disappeared from most neurons over 7 d, beginning at the cell body and then continuing at the process level and ending at the terminals (data not shown, but see Fig. 10C2). Thus, the autocrine GABAergic signaling decreased progressively as CP/SP neurons differentiated extensive neurites.
Neurite outgrowth can be preserved in the absence of GABAergic signaling by activating L-type Ca2+ channels
We interrupted autocrine GABAergic signaling at GABAA receptor/Cl−channel activation and then depolarized CP/SP neurons by adding 20 mm KCl to the growth medium, because this approximated the Ca2+c level sustained by autocrine GABAergic signaling after 24–48 hr in culture (see Fig. 8). Neurons exposed to both bicuculline and picrotoxin exhibited the same degree of attenuation in process formation (data not shown) as seen with either alone (Fig. 11B,C). Inclusion of 20 mm KCl in the medium along with bicuculline and picrotoxin preserved process formation and/or regeneration (Fig.11H), with the mean neurite length (35 ± 3 μm; n = 40) and cellular morphologies closely approximating those evident in control (Fig. 11A) or in control plus 20 mm KCl (Fig. 11G), in which the mean neurite length amounted to 37 ± 3 μm (n = 31) and 39 ± 3 μm (n = 49), respectively. Degrees of neuritogenesis similar to those seen in control were found when 20 mm KCl was included with either 3-MPA or furosemide (data not shown), but not with nitrendipine, the outcome of which resembled that in Figure11F, presumably because the nitrendipine blocked Ca2+ entry via activated L-type Ca2+ channels (see Fig. 9D). These results indicate that activation of L-type Ca2+ channels is the critical downstream mechanism for promoting neurite outgrowth in CP/SP neurons.
GABAergic signaling during neurite outgrowth does not involve vesicular release
To investigate further the mechanisms of GABA release, we examined the subcellular distribution of GABA in differentiating CP/SP neurons during the period of neurite recovery after dissociation. The cells were cultured for 24 hr and examined for GABA expression using an immunogold reaction followed by silver enhancement and electron microscopy. The results typically revealed nonuniform distributions of GABA in the cytoplasm of the cell bodies and growth cones, with some clustering of the immunoreaction product apparent in subplasmalemmal regions (Fig. 12). There was little evidence of GABA compartmentalization in vesicles. Discrete small vesicular organelles arranged near the surface membrane, which are characteristic of those containing GABA at well developed synapses of fast-transmitting neurons, were noticeably absent. Thus, the autocrine GABAergic-signaling circuit expressed by embryonic CP/SP neurons does not appear to involve vesicular exocytosis. Instead, alternate mechanisms of GABA release, including those that involve GABA transporters, may play a role, and elucidating them will be the goal of future investigations.
Fig. 12.
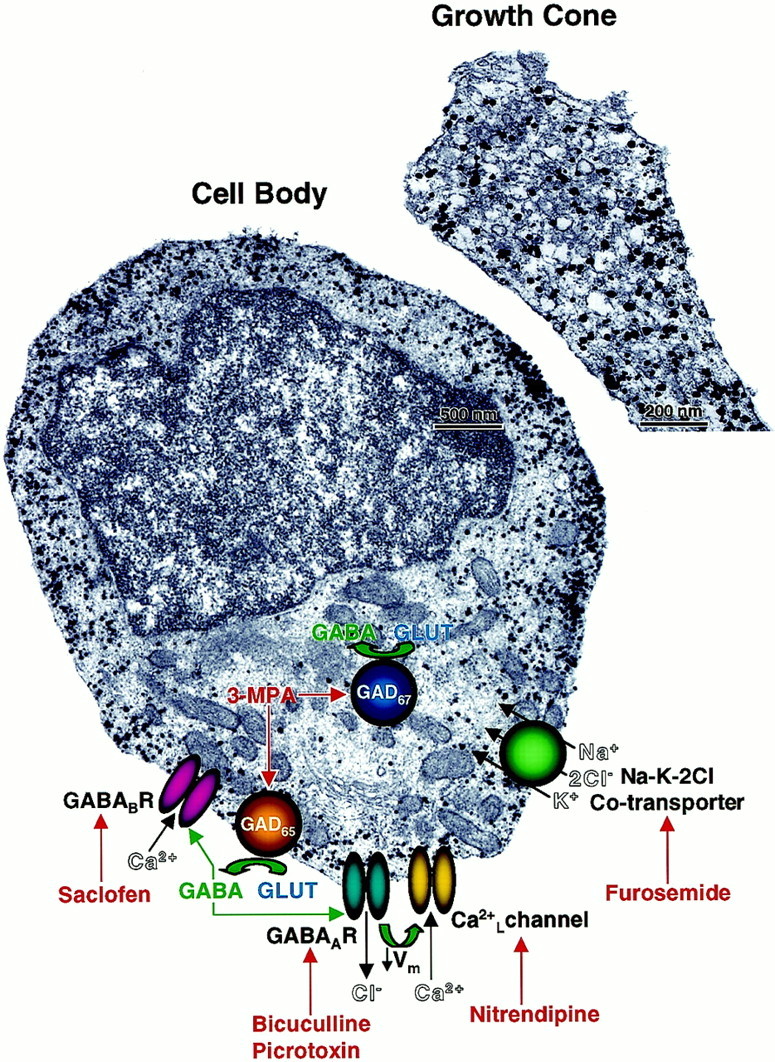
Subcellular distribution of GABA and a model of GABAergic-signaling pathways in a differentiating CP/SP neuron. CP/SP neurons were cultured for 24 hr in Neurobasal/B27 and then fixed in PF and processed for immunoelectron microscopy using colloidal gold-conjugated anti-GABA antibody followed by silver enhancement (see Materials and Methods for details). GABA immunoreaction (black particles) is nonuniformly distributed throughout the cytoplasm of the cell body with clusters evident in subplasmalemmal spaces. Similar distribution of GABA immunoreaction and the absence of transmitter-containing vesicles are observed in the growth cones of these neurons. Superimposed on the image of the cell body is a model summarizing the different components identified in this study, which compose the autocrine GABAergic circuit mediating the early phase of neurite outgrowth. GLUT,l-glutamate; Ca2+L, voltage-dependent L-type Ca2+ channel.
DISCUSSION
Salient findings
In this study we investigated the morphogenic role of GABA during neuronal differentiation in the rat embryonic neocortex. GABAergic-signaling components, including the expression of GAD65, GAD67, GABA, GABAA, and GABAB receptor subunits, and GABAergic signals at GABAAreceptor/Cl− channels emerged at the earliest stages of neuronal lineage progression in the VZ/SVZ. After radial migration to the CP/SP, the majority of differentiating neurons exhibited autocrine GABAergic signals, which dominated their baseline membrane potential and indirectly their Ca2+c levels via Ca2+ entry through L-type Ca2+ channels. This autocrine GABAergic circuit was critical to neurite outgrowth, because interruption of its individual components including GABA synthesis, GABAA receptor activation, intracellular Cl− ion homeostasis, or L-type Ca2+ channel activation markedly attenuated neurite outgrowth in most GABAergic neurons. In the absence of the autocrine GABAergic signaling, neuritogenesis of these cells could be preserved by K+o-induced depolarization of their plasma membranes and activation of L-type Ca2+ channels, suggesting that Ca2+ entry is the critical factor in sustaining neurite outgrowth of these cells.
GABAergic signaling at GABAA autoreceptors emerges among most postmitotic cortical neurons during neurogenesis and dominates their membrane potential
We have shown previously that, during neocortical development, the majority of postmitotic neurons are polarized at negative potentials, primarily according to a K+ ion gradient (Maric et al., 1998c), and that most of these cells express GABAA receptors and depolarize to GABA via Cl−-dependent and bicuculline- and/or picrotoxin-sensitive mechanisms (Maric et al., 2000b). To study these mechanisms pharmacologically, using exogenous applications of GABAA receptor agonists and antagonists, we found it necessary to supplement all recording solutions with 1 mg/ml BSA, because it effectively eliminated the contribution of endogenous GABAergic signaling from differentiating neurons and thus stabilized baseline membrane potentials for the duration of the experiments. In this study, however, we have also focused our investigation on the physiological roles of endogenous GABA on neuronal development and have therefore omitted BSA from the recording solutions. As expected, omission of BSA depolarized and elevated Ca2+c levels in many differentiating CP/SP neurons, virtually all of which were GAD+ and GABA+. These effects could be predominantly attenuated by the GABAAreceptor/Cl− channel antagonists bicuculline and picrotoxin, by furosemide, which blocks Cl− ion transport into cells, and by 3-MPA, which blocks GAD activity.
The autocrine GABAergic signaling primarily involved spontaneous, random openings of GABAAreceptor/Cl− channels, whereas the contribution of GABAB receptors was minor. Baseline properties dominated by GABA in embryonic CP/SP neurons gradually disappeared after 7 d in culture consistent with a transient role for autocrine signaling during neurite outgrowth (Maric and Barker, unpublished observations). GABAergic baseline signals involving GABAA receptors have been recorded previously both in cultured embryonic hippocampal neurons (Valeyev et al., 1993, 1998) and in early postnatal hippocampal neurons in slices (Ben-Ari et al., 1989). The slice experiments demonstrated that bicuculline-sensitive GABAergic baselines disappear at the end of the first postnatal week as hyperpolarizing GABAergic transient signals emerge.
Spectral analysis revealed that most Cl− channel openings involved estimated burst-length durations of ∼100 msec, similar to those estimated for GABA-induced Cl− currents in newly adherent embryonic cortical neurons without processes (Serafini et al., 1998). Thus, the same channel properties predominate both before and during neurite outgrowth. The similarities in the kinetics of baseline and GABA-activated channels strongly suggest that (1) GABA rather than other substances mediates the baseline Cl− channel activity and (2) submicromolar to micromolar concentrations in solution mimic the intensity of the autocrine GABAergic signal. Superfusion eliminated the baseline current, demonstrating that it was mediated by GABA equilibrating in a surface-accessible compartment, which is consistent with results in embryonic hippocampal neurons (Valeyev et al., 1993,1998; Vautrin et al., 2000). Channel activity during superfusion most likely reflected autocrine signaling at the neuronal surface apposing the coverslip, which would be less accessible to superfusion and similar to the interstitial space. Hence, low numbers of randomly activated GABAAautoreceptor/Cl− channels were sufficient to dominate resting potentials of most embryonic CP/SP neurons in vitro. We have shown previously that exogenous activation of low numbers (<5) of GABAAreceptor/Cl− channels in intact embryonic hippocampal neurons could exert shifts in their membrane potential by 5–10 mV (Maric et al., 1999b).
GABAA receptor subunit expression patterns change as postmitotic neurons migrate from the VZ/SVZ to the CP/SP region
Our data demonstrated that the potency of muscimol at GABAA receptor/Cl−channels increased during neuronal lineage progression. This increase may be related to the developmentally changing subunit patterns and their intrinsic properties and/or to receptor densities. In this regard, approximately the same percentages of TnTx−A2B5−precursor cells and SP-TnTxlo and DP-TnTxlo neuronal progenitors depolarized as expressed α4, β1, or γ1 subunits, whereas a great majority of both SP-TnTxhi and DP-TnTxhi differentiating neurons depolarized, which was comparable with those that expressed either α3, β3, γ2, or γ3 subunits. Thus, the predominant GABAA receptor subunits, α4, β1, and γ1 in precursors and progenitors or α3, β3, γ2, and γ3 in differentiating neurons, are probably coexpressed and form functional Cl− channels.
The potentiometric results can be compared with an electrophysiological study on GABAA receptor-mediated signaling using whole-cell recording (Owens et al., 1999). The authors found that (1) all of the embryonic cortical cells sampled exhibited functional GABAA receptors and (2) EC50 values for activating macroscopic Cl− currents shifted from ∼5 μm in VZ cells to ∼28 μm in CP neurons, whereas Hill coefficients decreased from ∼2 to ∼1. The authors also reported that isolated VZ cells exhibited few functional GABAA receptor/Cl−channels (<5). Thus, the phenotyped VZ/SVZ subpopulations studied here likely express limited numbers of functional GABAA receptor/Cl−channels. However, these could dominate membrane potential and, indirectly, Ca2+c levels, thereby affecting neuronal progenitor proliferation (LoTurco et al., 1995). The EC50 values measured electrophysiologically among VZ and CP neurons contrast with those found using potentiometry, which shifted from approximately micromolar in VZ/SVZ cells to submicromolar in CP/SP neurons. The Hill coefficient in CP neurons also differed from that determined potentiometrically, which remained ∼2. These differences could be related to the different recording strategies and endpoints and/or to the sample sizes, which are relatively limited in patch-clamp studies. Furthermore, if GABAAreceptor/Cl− channels are regulated by soluble components of signal transduction pathways in the cytoplasm [for review, see Moss and Smart (1996)], then these components could be diluted in whole-cell recordings and thus conceivably alter GABAA receptor affinity. Perforated-patch recordings would show whether this helps to explain the differences in the pharmacological parameters derived from electrical and optical recordings.
GABAergic signaling at GABAAautoreceptor/Cl− channels expressed by CP/SP neurons mediates neurite outgrowth via activation of L-type Ca2+ channels
Block of the autocrine GABAergic-signaling circuit attenuated neurite outgrowth in most, but not all, GABAergic CP/SP neurons. These results are consistent with reports implicating GABAA receptor/Cl−channels in the process formation of neurons cultured from different CNS regions and species (Michler, 1990; Barbin et al., 1993; Bird and Owen, 1998). However, both facilitatory and inhibitory effects of GABA on neurite outgrowth have been reported, depending on cell type and culture conditions. HPLC studies showed that growth cones fractionated from the postnatal rat cortex release endogenous GABA spontaneously before the emergence of synaptic vesicle-related proteins and that this release is increased after superfusion with Ca2+o-free saline and enhanced still further by 25 mm KCl (Taylor et al., 1990). The mechanisms underlying release of endogenous GABA from postnatal growth cones and the regulatory role of extracellular Ca2+ in this process have yet to be elucidated. In our experiments, GABA release from embryonic CP/SP neuronal cell bodies and growth cones was Ca2+ dependent. These results suggest a positive feedback loop in the autocrine circuit with Ca2+-dependent GABA release activating Ca2+ entry via L-type Ca2+ channels and promoting GABA release. The loop most likely involves Ca2+-dependent regulation of GAD activities because constitutive synthesis of GABA was necessary to sustain activity in the autocrine circuit.
GABA release from axonal growth cones of embryonic mouse hypothalamic neurons has also been detected electrically (Gao and van den Pol, 2000), and exogenously applied GABA has been shown to elevate Ca2+c in these growth cones via bicuculline- and furosemide-sensitive mechanisms (Obrietan and van den Pol, 1996). Bicuculline also decreased ambient Ca2+c levels in hypothalamic neurons, which had been cultured for 6 d. This was attributed to blockade of synaptically released GABA acting at GABAA receptors. The results of the present study reveal that the autocrine GABAergic circuit operates during the earliest stages of neurite outgrowth before functional synapses form. The intracellular pathway(s) that couples autocrine GABAergic signaling to neurite outgrowth likely involves Ca2+-dependent activation of (1) protein kinase C with subsequent phosphorylation of GAP-43 and Myristoyl alanine-rich protein kinase C substrate proteins (Fukura et al., 1996) and (2) degradation of spectrin and release of α-actinin by calpain (Ohbayashi et al., 1998), which have both been identified as targets of GABAergic signaling in growth cones fractionated from the embryonic and early postnatal rat cortex. The dynamics regarding the complex interplay among the different components at membrane and cytoplasmic levels during neurite outgrowth and how the circuit is developmentally regulated remain to be elucidated.
Footnotes
We acknowledge Dr. Jung-Hwa Tao-Cheng and Virginia A. Tanner at the National Institute of Neurological Disorders and Stroke Electron Microscopy Facility (National Institutes of Health, Bethesda, MD) for providing their invaluable technical expertise and training in EM immunocytochemistry.
Correspondence should be addressed to Dr. Dragan Maric, Laboratory of Neurophysiology, National Institute of Neurological Disorders and Stroke, National Institutes of Health, Building 36, Room 2C-02, Bethesda, MD 20892. E-mail: maricd@ninds.nih.gov.
REFERENCES
- 1.Altman J, Bayer SA. Atlas of prenatal rat brain development. CRC; Boca Raton, FL: 1995. [Google Scholar]
- 2.Barbin G, Pollard H, Gaïarsa JL, Ben-Ari Y. Involvement of GABAA receptors in the outgrowth of cultured hippocampal neurons. Neurosci Lett. 1993;152:150–154. doi: 10.1016/0304-3940(93)90505-f. [DOI] [PubMed] [Google Scholar]
- 3.Barker JL, Lauder JM. GABA as a trophic signal: perspectives in developmental neurobiology, Vol 5. Overseas Publishers Association; Selangor Darul Ehsan, Malaysia: 1998. [Google Scholar]
- 4.Behar TN, Li YX, Tran HT, Ma W, Dunlap V, Scott C, Barker JL. GABA stimulates chemotaxis and chemokinesis of embryonic cortical neurons via calcium-dependent mechanisms. J Neurosci. 1996;16:1808–1818. doi: 10.1523/JNEUROSCI.16-05-01808.1996. [DOI] [PMC free article] [PubMed] [Google Scholar]
- 5.Behar TN, Schaffner AE, Scott CA, O'Connell C, Barker JL. Differential response of cortical plate and ventricular zone cells to GABA as a migration stimulus. J Neurosci. 1998;18:6378–6387. doi: 10.1523/JNEUROSCI.18-16-06378.1998. [DOI] [PMC free article] [PubMed] [Google Scholar]
- 6.Behar TN, Schaffner AE, Scott CA, Greene CL, Barker JL. GABA receptor antagonists modulate postmitotic cell migration in slice cultures of embryonic rat cortex. Cereb Cortex. 2000;10:899–909. doi: 10.1093/cercor/10.9.899. [DOI] [PubMed] [Google Scholar]
- 7.Ben-Ari Y, Cherubini E, Corradetti R, Gaiarsa JL. Giant synaptic potentials in immature rat CA3 hippocampal neurones. J Physiol (Lond) 1989;416:303–325. doi: 10.1113/jphysiol.1989.sp017762. [DOI] [PMC free article] [PubMed] [Google Scholar]
- 8.Benke D, Cicin-Sain A, Mertens S, Mohler H. Immunochemical identification of the alpha 1- and alpha 3-subunits of the GABAA-receptor in rat brain. J Recept Res. 1991;11:407–424. doi: 10.3109/10799899109066418. [DOI] [PubMed] [Google Scholar]
- 9.Benke D, Michel C, Mohler H. GABA(A) receptors containing the alpha4-subunit: prevalence, distribution, pharmacology, and subunit architecture in situ. J Neurochem. 1997;69:806–814. doi: 10.1046/j.1471-4159.1997.69020806.x. [DOI] [PubMed] [Google Scholar]
- 10.Bird M, Owen A. Neurite outgrowth-regulating properties of GABA and the effect of serum on mouse spinal cord neurons in culture. J Anat. 1998;193:503–508. doi: 10.1046/j.1469-7580.1998.19340503.x. [DOI] [PMC free article] [PubMed] [Google Scholar]
- 11.Bowery NG, Enna SJ. Gamma-aminobutyric acid(B) receptors: first of the functional metabotropic heterodimers. J Pharmacol Exp Ther. 2000;292:2–7. [PubMed] [Google Scholar]
- 12.Buchstaller A, Fuchs K, Sieghart W. Identification of alpha 1-, alpha 2- and alpha 3-subunit isoforms of the GABAA-benzodiazepine receptor in the rat brain. Neurosci Lett. 1991;129:237–241. doi: 10.1016/0304-3940(91)90470-e. [DOI] [PubMed] [Google Scholar]
- 13.Calver AR, Medhurst AD, Robbins MJ, Charles KJ, Evans ML, Harrison DC, Stammers M, Hughes SA, Hervieu G, Couve A, Moss SJ, Middlemiss DN, Pangalos MN. The expression of GABA(B1) and GABA(B2) receptor subunits in the CNS differs from that in peripheral tissues. Neuroscience. 2000;100:155–170. doi: 10.1016/s0306-4522(00)00262-1. [DOI] [PubMed] [Google Scholar]
- 14.Cobas A, Fairen A, Alvarez BG, Sanchez MP. Prenatal development of the intrinsic neurons of the rat neocortex: a comparative study of the distribution of GABA-immunoreactive cells and the GABAA receptor. Neuroscience. 1991;40:375–397. doi: 10.1016/0306-4522(91)90127-a. [DOI] [PubMed] [Google Scholar]
- 15.Couve A, Moss SJ, Pangalos MN. GABA(B) receptors: a new paradigm in G protein signaling. Mol Cell Neurosci. 2000;16:296–312. doi: 10.1006/mcne.2000.0908. [DOI] [PubMed] [Google Scholar]
- 16.Durkin MM, Gunwaldsen CA, Borowsky B, Jones KA, Branchek TA. An in situ hybridization study of the distribution of the GABA(B2) protein mRNA in the rat CNS. Brain Res Mol Brain Res. 1999;71:185–200. doi: 10.1016/s0169-328x(99)00182-5. [DOI] [PubMed] [Google Scholar]
- 17.Fukura H, Komiya Y, Igarashi M. Signaling pathway downstream of GABAA receptor in the growth cone. J Neurochem. 1996;67:1426–1434. doi: 10.1046/j.1471-4159.1996.67041426.x. [DOI] [PubMed] [Google Scholar]
- 18.Gao X-B, van den Pol AN. GABA release from mouse axonal growth cones. J Physiol (Lond) 2000;523(3):629–637. doi: 10.1111/j.1469-7793.2000.t01-1-00629.x. [DOI] [PMC free article] [PubMed] [Google Scholar]
- 19.Hamill OP, Marty A, Neher E, Sakmann B, Sigworth FJ. Improved patch-clamp techniques for high-resolution current recording from cells and cell-free membrane patches. Pflügers Arch. 1981;391:85–100. doi: 10.1007/BF00656997. [DOI] [PubMed] [Google Scholar]
- 20.Haydar TF, Wang F, Schwartz ML, Rakic P. Differential modulation of proliferation in the neocortical ventricular and subventricular zones. J Neurosci. 2000;20:5764–5774. doi: 10.1523/JNEUROSCI.20-15-05764.2000. [DOI] [PMC free article] [PubMed] [Google Scholar]
- 21.Hebel R, Stromberg MW. Anatomy and embryology of the laboratory rat. Biomed Verlag; Worthsee, Germany: 1986. [Google Scholar]
- 22.Jones KA, Borowsky B, Tamm JA, Craig DA, Durkin MM, Dai M, Yao WJ, Johnson M, Gunwaldsen C, Huang LY, Tang C, Shen Q, Salon JA, Morse K, Laz T, Smith KE, Nagarathnam D, Noble SA, Branchek TA, Gerald C. GABAB receptors function as a heteromeric assembly of the subunits GABAB R1 and GABAB R2. Nature. 1998;396:674–679. doi: 10.1038/25348. [DOI] [PubMed] [Google Scholar]
- 23.Kaupmann K, Malitschek B, Schuler V, Heid J, Froestl W, Beck P, Mosbacher J, Bischoff S, Kulik A, Shigemoto R, Karschin A, Bettler B. GABAB-receptor subtypes assemble into functional heteromeric complexes. Nature. 1998;396:683–687. doi: 10.1038/25360. [DOI] [PubMed] [Google Scholar]
- 24.Lauder JM, Han VKM, Henderson P, Verdoorn T, Towle AC. Prenatal ontogeny of the GABAergic system in the rat brain: an immunocytochemical study. Neuroscience. 1986;19:465–493. doi: 10.1016/0306-4522(86)90275-7. [DOI] [PubMed] [Google Scholar]
- 25.Laurie DJ, Wisden W, Seeburg PH. The distribution of thirteen GABAA receptor subunit mRNAs in the rat brain. III. Embryonic and postnatal development. J Neurosci. 1992;12:4151–4172. doi: 10.1523/JNEUROSCI.12-11-04151.1992. [DOI] [PMC free article] [PubMed] [Google Scholar]
- 26.Liu QY, Schaffner AE, Barker JL. Electrophysiological studies on receptors in vitro. In: Boulton AA, Baker GB, Bateson AN, editors. Neuromethods, Vol 34. Humana; Totowa, NJ: 1999. pp. 37–318. [Google Scholar]
- 27.LoTurco JJ, Owens DF, Heath MJS, Davis MBE, Kriegstein AR. GABA and glutamate depolarize cortical progenitor cells and inhibit DNA synthesis. Neuron. 1995;15:1287–1298. doi: 10.1016/0896-6273(95)90008-x. [DOI] [PubMed] [Google Scholar]
- 28.Ma W, Barker JL. Complementary expressions of transcripts encoding GAD67 and GABAA receptor α4, β1, and γ1 subunits in the proliferative zone of the embryonic rat central nervous system. J Neurosci. 1995;15:2547–2560. doi: 10.1523/JNEUROSCI.15-03-02547.1995. [DOI] [PMC free article] [PubMed] [Google Scholar]
- 29.Ma W, Barker JL. GABA, GAD and GABAA receptor α4, β1, and γ1 subunits are expressed in the late embryonic and early postnatal neocortical germinal matrix and coincide with gliogenesis. Microsc Res Tech. 1998;30:398–407. doi: 10.1002/(SICI)1097-0029(19980301)40:5<398::AID-JEMT6>3.0.CO;2-N. [DOI] [PubMed] [Google Scholar]
- 30.Maric D, Maric I, Ma W, Lahojuji F, Somogyi R, Wen X, Sieghart W, Fritschy JM, Barker JL. Anatomical gradients in proliferation and differentiation of embryonic rat CNS accessed by buoyant density fractionation: alpha 3, beta 3 and gamma 2 GABAA receptor subunit co-expression by post-mitotic neocortical neurons correlates directly with cell buoyancy. Eur J Neurosci. 1997;9:507–522. doi: 10.1111/j.1460-9568.1997.tb01628.x. [DOI] [PubMed] [Google Scholar]
- 31.Maric D, Maric I, Sieghart W, Fritschy J-M, Barker JL. Physiological properties of GABAergic neurons in the embryonic rat cortex are dominated by GABAA receptor/Cl− channel activity. Soc Neurosci Abstr. 1998a;24:794. [Google Scholar]
- 32.Maric D, Maric I, Barker JL. Buoyant density gradient fractionation and flow cytometric analysis of embryonic rat cortical neurons and progenitor cells. Methods. 1998b;16:247–259. doi: 10.1006/meth.1998.0682. [DOI] [PubMed] [Google Scholar]
- 33.Maric D, Maric I, Smith SV, Serafini R, Hu Q, Barker JL. Potentiometric study of resting potential, contributing K+ channels and the onset of Na+ channel excitability in embryonic rat cortical cells. Eur J Neurosci. 1998c;10:2532–2546. doi: 10.1046/j.1460-9568.1998.00284.x. [DOI] [PubMed] [Google Scholar]
- 34.Maric D, Maric I, Barker JL. Flow cytometric strategies to study CNS development. In: Boulton AA, Baker GB, editors. Neuromethods, Vol 33. Humana; Totowa, NJ: 1999a. pp. 287–318. [Google Scholar]
- 35.Maric D, Maric I, Wen X-L, Fritschy J-M, Sieghart W, Barker JL, Serafini R. GABAA receptor subunit composition and functional properties of Cl− channels with differential sensitivity to zolpidem in embryonic rat hippocampal cells. J Neurosci. 1999b;19:4921–4937. doi: 10.1523/JNEUROSCI.19-12-04921.1999. [DOI] [PMC free article] [PubMed] [Google Scholar]
- 36.Maric D, Maric I, Barker JL. Developmental changes in cell calcium homeostasis during neurogenesis of the embryonic rat cerebral cortex. Cereb Cortex. 2000a;10:561–573. doi: 10.1093/cercor/10.6.561. [DOI] [PubMed] [Google Scholar]
- 37.Maric D, Maric I, Chang Y-H, Barker JL. Stereotypic physiological properties emerge during early neuronal and glial lineage development in the embryonic rat neocortex. Cereb Cortex. 2000b;10:729–747. doi: 10.1093/cercor/10.8.729. [DOI] [PubMed] [Google Scholar]
- 38.Marksitzer R, Benke D, Fritschy JM, Trzeciak A, Bannwarth W, Mohler H. GABAA-receptors: drug binding profile and distribution of receptors containing the alpha 2-subunit in situ. J Recept Res. 1993;13:467–477. doi: 10.3109/10799899309073673. [DOI] [PubMed] [Google Scholar]
- 39.Martin DL, Rimvall K. Regulation of gamma-aminobutyric acid synthesis in the brain. J Neurochem. 1993;60:395–407. doi: 10.1111/j.1471-4159.1993.tb03165.x. [DOI] [PubMed] [Google Scholar]
- 40.Martin SC, Russek SJ, Farb DH. Molecular identification of the human GABABR2: cell surface expression and coupling to adenylyl cyclase in the absence of GABABR1. Mol Cell Neurosci. 1999;13:180–191. doi: 10.1006/mcne.1999.0741. [DOI] [PubMed] [Google Scholar]
- 41.Mertens S, Benke D, Mohler H. GABAA receptor populations with novel subunit combinations and drug binding profiles identified in brain by alpha 5- and delta-subunit-specific immunopurification. J Biol Chem. 1993;268:5965–5973. [PubMed] [Google Scholar]
- 42.Michler A. Involvement of GABA receptors in the regulation of neurite outgrowth in cultured embryonic chick tectum. Int J Dev Neurosci. 1990;8:463–472. doi: 10.1016/0736-5748(90)90078-g. [DOI] [PubMed] [Google Scholar]
- 43.Moss SJ, Smart TG. Modulation of amino acid-gated ion channels by protein phosphorylation. Int Rev Neurobiol. 1996;39:1–52. doi: 10.1016/s0074-7742(08)60662-5. [DOI] [PubMed] [Google Scholar]
- 44.Mossier B, Togel M, Fuchs K, Sieghart W. Immunoaffinity purification of gamma-aminobutyric acid A (GABAA) receptors containing gamma 1-subunits. Evidence for the presence of a single type of gamma-subunit in GABAA receptors. J Biol Chem. 1994;269:25777–25782. [PubMed] [Google Scholar]
- 45.Obrietan K, van den Pol AN. Growth cone calcium elevation by GABA. J Comp Neurol. 1996;372:167–175. doi: 10.1002/(SICI)1096-9861(19960819)372:2<167::AID-CNE1>3.0.CO;2-1. [DOI] [PubMed] [Google Scholar]
- 46.Ohbayashi K, Fukura H, Inoue HK, Komiya Y, Igarashi M. Stimulation of L-type Ca2+ channel in growth cones activates two independent signaling pathways. J Neurosci Res. 1998;51:682–696. doi: 10.1002/(SICI)1097-4547(19980315)51:6<682::AID-JNR3>3.0.CO;2-7. [DOI] [PubMed] [Google Scholar]
- 47.Owens DF, Liu X, Kriegstein AR. Changing properties of GABAA receptor-mediated signaling during early neocortical development. J Neurophysiol. 1999;82:570–583. doi: 10.1152/jn.1999.82.2.570. [DOI] [PubMed] [Google Scholar]
- 48.Poulter MO, Barker JL, O'Carroll AM, Lolait SJ, Mahan LC. Differential and transient expression of GABAA receptor alpha-subunit mRNAs in the developing rat CNS. J Neurosci. 1992;12:2888–2900. doi: 10.1523/JNEUROSCI.12-08-02888.1992. [DOI] [PMC free article] [PubMed] [Google Scholar]
- 49.Poulter MO, Barker JL, O'Carrol AM, Lolait SJ, Mahan LC. Coexistent expression of GABAA receptor β2, β3, and γ2 subunits messenger RNAs during embryogenesis and early postnatal development of the rat central nervous system. Neuroscience. 1993;53:1019–1033. doi: 10.1016/0306-4522(93)90486-y. [DOI] [PubMed] [Google Scholar]
- 50.Princivalle A, Regondi MC, Frassoni C, Bowery NG, Spreafico R. Distribution of GABA(B) receptor protein in somatosensory cortex and thalamus of adult rats and during postnatal development. Brain Res Bull. 2000;52:397–405. doi: 10.1016/s0361-9230(00)00256-2. [DOI] [PubMed] [Google Scholar]
- 51.Rimvall K, Sheikh SN, Martin DL. Effects of increased gamma-aminobutyric acid levels on GAD67 protein and mRNA levels in rat cerebral cortex. J Neurochem. 1993;60:714–720. doi: 10.1111/j.1471-4159.1993.tb03206.x. [DOI] [PubMed] [Google Scholar]
- 52.Serafini R, Maric D, Maric I, Ma W, Fritschy JM, Zhang L, Barker JL. Dominant GABAA receptor/Cl− channel kinetics correlate with the relative expressions of α2, α3, α5 and β3 subunits in embryonic rat neurones. Eur J Neurosci. 1998;10:334–349. doi: 10.1046/j.1460-9568.1998.00022.x. [DOI] [PubMed] [Google Scholar]
- 53.Sperk G, Schwarzer C, Tsunashima K, Fuchs K, Sieghart W. GABA(A) receptor subunits in the rat hippocampus I: immunocytochemical distribution of 13 subunits. Neuroscience. 1997;80:987–1000. doi: 10.1016/s0306-4522(97)00146-2. [DOI] [PubMed] [Google Scholar]
- 54.Tanner VA, Ploug T, Tao-Cheng JH. Subcellular localization of SV2 and other secretory vesicle components in PC12 cells by an efficient method of preembedding EM immunocytochemistry for cell cultures. J Histochem Cytochem. 1996;44:1481–1488. doi: 10.1177/44.12.8985140. [DOI] [PubMed] [Google Scholar]
- 55.Taylor J, Docherty M, Gordon-Weeks PR. GABAergic growth cones: release of endogenous GABA precedes the expression of synaptic vesicle antigens. J Neurochem. 1990;54:1689–1699. doi: 10.1111/j.1471-4159.1990.tb01223.x. [DOI] [PubMed] [Google Scholar]
- 56.Todd AJ, Watt C, Spike RC, Sieghart W. Colocalization of GABA, glycine, and their receptors at synapses in the rat spinal cord. J Neurosci. 1996;16:974–982. doi: 10.1523/JNEUROSCI.16-03-00974.1996. [DOI] [PMC free article] [PubMed] [Google Scholar]
- 57.Valeyev AY, Cruciani RA, Lange GD, Smallwood VS, Barker JL. Cl− channels are randomly activated by continuous GABA secretion in cultured embryonic rat hippocampal neurons. Neurosci Lett. 1993;155:199–203. doi: 10.1016/0304-3940(93)90707-r. [DOI] [PubMed] [Google Scholar]
- 58.Valeyev AY, Schaffner AE, Skolnick P, Dunlap VS, Wong G, Barker JL. Embryonic rat hippocampal neurons and GABAA receptor subunit-transfected non-neuronal cells release GABA tonically. J Membr Biol. 1998;164:239–251. doi: 10.1007/s002329900409. [DOI] [PubMed] [Google Scholar]
- 59.Van Eden CG, Mrzljak L, Voorn P, Uylings HBM. Prenatal development of GABAergic neurons in the neocortex of the rat. J Comp Neurol. 1989;289:213–227. doi: 10.1002/cne.902890204. [DOI] [PubMed] [Google Scholar]
- 60.Vautrin J, Maric D, Sukhareva M, Schaffner AE, Barker JL. Surface-accessible GABA supports tonic and quantal synaptic transmission. Synapse. 2000;37:38–55. doi: 10.1002/(SICI)1098-2396(200007)37:1<38::AID-SYN5>3.0.CO;2-C. [DOI] [PubMed] [Google Scholar]
- 61.White JH, Wise A, Main MJ, Green A, Fraser NJ, Disney GH, Barnes AA, Emson P, Foord SM, Marshall FH. Heterodimerization is required for the formation of a functional GABA(B) receptor. Nature. 1998;396:679–682. doi: 10.1038/25354. [DOI] [PubMed] [Google Scholar]
- 62.Yung KK, Ng TK, Wong CK. Subpopulations of neurons in the rat neostriatum display GABABR1 receptor immunoreactivity. Brain Res. 1999;830:345–352. doi: 10.1016/s0006-8993(99)01442-0. [DOI] [PubMed] [Google Scholar]