

Abstract
One Hertz stimulation of afferents for 15 min with constant interstimulus intervals (regular stimulation) can induce long-term depression (LTD) of synaptic strength in the neocortex. However, it is unknown whether natural patterns of low-frequency afferent spike activity induce LTD. Although neurons in the neocortex can fire at overall rates as low as 1 Hz, the intervals between spikes are irregular. This irregular spike activity (and thus, presumably, irregular activation of the synapses of that neuron onto postsynaptic targets) can be approximated by stimulation with Poisson-distributed interstimulus intervals (Poisson stimulation). Therefore, if low-frequency presynaptic spike activity in the intact neocortex is sufficient to induce a generalized LTD of synaptic transmission, then Poisson stimulation, which mimics this spike activity, should induce LTD in slices. We tested this hypothesis by comparing changes in the strength of synapses onto layer 2/3 pyramidal cells induced by regular and Poisson stimulation in slices from adult visual cortex. We find that regular stimulation induces LTD of excitatory synaptic transmission as assessed by field potentials and intracellular postsynaptic potentials (PSPs) with inhibition absent. However, Poisson stimulation does not induce a net LTD of excitatory synaptic transmission. When the PSP contained an inhibitory component, neither Poisson nor regular stimulation induced LTD. We propose that the short bursts of synaptic activity that occur during a Poisson train have potentiating effects that offset the induction of LTD that is favored with regular stimulation. Thus, natural (i.e., irregular) low-frequency activity in the adult neocortex in vivo should not consistently induce LTD.
Keywords: long-term depression, visual cortex, Poisson stimulation, adult guinea pig, synaptic plasticity, spike variability, cortical reorganization
The alteration of synaptic strengths by patterns of neuronal activity is thought to be a mechanism via which information is stored in the CNS. The ability to experimentally induce long-term potentiation (LTP) and long-term depression (LTD) in many different regions of the brain lends support to this hypothesis (Tsumoto, 1992; Bear and Malenka, 1994; Linden, 1994). Both LTP and LTD can be induced by relatively brief, specific patterns of afferent activity and can persist for days in vivo (Bliss and Gardner-Medwin, 1973; Dudek and Bear; 1992; Mulkey and Malenka, 1992;Froc et al., 2000). Consequently, these phenomena are widely studied as models for information storage by synapses; however, a direct causal link between LTP- and/or LTD-like synaptic strength changes and behavioral learning has yet to be demonstrated. Indeed, it is not clear whether patterns of activity that induce LTP and LTD occur during learning or, for that matter, even mimic in vivo neuronal activity (but see Dobrunz and Stevens, 1999; Paulsen and Sejnowski, 2000). This is of particular concern in the case of protocols used to induce LTD, which usually consist of long trains of relatively low-frequency stimulation (LFS), with constant intervals between stimuli. Such regular spike activity over prolonged epochs is not observed in vivo (Softky and Koch, 1993; Shadlen and Newsome, 1998; Stevens and Zador, 1998).
One Hertz stimulation with constant interstimulus intervals for 15 min (regular stimulation) can reliably induce LTD in the hippocampus and neocortex of young animals (Mulkey and Malenka, 1992; Dudek and Bear, 1993; Wagner and Alger, 1995; Dudek and Friedlander, 1996a). Accordingly, there is support for the view that LFS may mimic physiological activity during development, and thus, a process like LTD may contribute to the structural refinement of cortical circuits (Katz and Shatz, 1996; Rittenhouse et al., 1999). In the adult animal, it has been hypothesized that LFS-like activity may encode certain types of memories or contribute to forgetting (Tsumoto, 1993; Bear, 1999). For example, LFS-induced LTD could contribute to the functional reorganization of cortical circuits that has been observed (cf.Buonomano and Merzenich, 1998; Hamdy et al., 1998; Polley et al., 1999) in the adult sensory neocortex. However, in many studies LTD is not as readily induced by 1 Hz protocols in adult cortical structures as in developing cortex, as assessed by the frequency of induction (Thiels et al., 1994; Errington et al., 1995; Wagner and Alger, 1995; Abraham et al., 1996; Dudek and Friedlander, 1996a; Kirkwood et al., 1997; Staubli and Scafidi, 1997) and/or the magnitude of depression when LTD does occur (Mulkey and Malenka, 1992; Dudek and Bear, 1993). Thus, it is important to know whether prolonged low-frequency spike activity of a neuron in the intact adult brain is sufficient to consistently induce LTD of the synaptic connections between that neuron and its postsynaptic targets. If this does occur, then LFS that mimics natural spike activity should induce LTD at neocortical synapses. Spike activity of individual neurons at overall frequencies as low as 1 Hz has been observed in vivo (Gilbert, 1977; McAdams and Maunsell, 1999); however, the intervals between individual spikes are irregular (Softky and Koch, 1993; Shadlen and Newsome, 1998;Stevens and Zador, 1998). Stimulus patterns with Poisson-distributed intervals between stimuli (Poisson stimulation) have been used to approximate the irregular spiking that occurs in vivo in studies in which short-term synaptic depression (Abbott et al., 1997;Tsodyks and Markram, 1997; Varela et al., 1997, 1999) and ongoing spike activity (Berger et al., 1988) were examined. However, the ability of low-frequency Poisson stimulation to induce LTD has not been tested.
To address these issues, we recorded field potentials (FPs) and postsynaptic potentials (PSPs) from individual neurons in layer 2/3 of primary visual cortex in slices from adult guinea pigs. We compared synaptic plasticity induced by regular stimulation at 1 Hz with that induced by Poisson stimulation at 1 Hz. We find that regular stimulation at 1 Hz induces LTD of FPs and intracellularly recorded, EPSPs but not of single-cell, compound PSPs (composed of inhibitory and excitatory components). However, Poisson stimulation at 1 Hz does not induce a net LTD as assessed by FPs, EPSPs, or compound PSPs.
MATERIALS AND METHODS
Slice preparation. Slices were prepared as described previously (Harsanyi and Friedlander, 1997). Albino guinea pigs, aged postnatal days 40–65, were deeply anesthetized with ether, and their brains were quickly removed and placed in chilled (4°C) artificial CSF (ACSF). A section of tissue containing primary visual cortex was blocked, and coronal slices (400 μm) were cut from this block in chilled ACSF with a vibroslicer (Campden Instruments, London, UK). Slices were transferred to an interface-type recording chamber and maintained for >1.5 hr before the start of experiments. During this period, the temperature of the ACSF perfusing the slices was slowly increased from room temperature to 35°C. The composition of the ACSF was (in mm): 124 NaCl, 4 KCl, 1.5 MgSO4, 2.5 CaCl2, 1.25 KH2PO4, 26 NaHCO3, and 10 dextrose, saturated with 95% O2 and 5% CO2 to maintain pH at 7.4. The flow rate of the ACSF was 1–2 ml/min.
Electrophysiological techniques. Compound (comprised of excitatory and inhibitory components) PSPs were recorded with sharp microelectrodes from pyramidal cells in layer 2/3 of primary visual cortex in response to stimulation with bipolar stimulating electrodes placed in layer 4. Pyramidal cells were identified by their characteristic firing properties (McCormick et al., 1985; Connors and Gutnick, 1990). In addition, a subset of cells was confirmed as pyramidal by morphological identification after biocytin labeling (see Histology). In 38 of 47 experiments, FPs, from an area horizontally adjacent (within 500 μm) to the intracellular recording, and intracellular PSPs were recorded simultaneously in response to the same stimulation (Fig. 1A). Recording micropipettes were pulled from glass capillary filaments (1.5 mm outer diameter; 0.86 mm inner diameter; A-M Systems, Carlsborg, WA) with a horizontal puller (Sutter Instruments, San Rafael, CA). For FP recordings, pipettes were filled with 1.0 m NaCl and had resistances from 1 to 3 MΩ. For intracellular recordings, pipettes were filled with 2.0 m potassium acetate, with pH adjusted to 7.1, and had resistances from 80 to 180 MΩ. In some experiments, intracellular recording electrodes were filled with the chloride channel blocker 4,4′-dinitro-stilbene-2,2′-disulfonic acid (DNDS; 500 μm), dissolved in 1.0 mcesium acetate, which was allowed to diffuse into the cell after impalement. DNDS was dissolved in distilled water to a concentration of 10 mm for stock solutions and kept in the dark at all times.
Fig. 1.

Arrangement of electrodes and examples of patterns of stimulation used to induce changes in synaptic strength.A, Intracellular PSPs and field potentials induced by layer 4 stimulation were recorded simultaneously in layer 2/3.B, Left, One Hertz stimulation with constant intervals between stimuli is shown. Right, One Hertz stimulation with Poisson-distributed intervals between stimuli is shown. Raw data at a time scale at which stimulus artifacts can be clearly discriminated are shown. C, Segments fromB are displayed at a time scale that allows the relationship of individual PSPs to be observed. Hyperpolarizing voltage deflections after the PSP during regular stimulation are responses to 50 pA current injection that was used to monitor input resistance.D, Interstimulus interval histograms are presented for both patterns. Bin size (50 msec) and total count (900 stimuli) are the same for each case. Arrowheads indicate the mean interval of 1 sec for both patterns. Notice that the Poisson stimulation pattern contains short bursts, which allow direct voltage interactions between individual PSPs (see C), and also long periods between stimuli (see B).stim, Stimulation.
Stimulation was driven by a Master 8 pulse generator (50 μsec; A.M.P.I., Jerusalem, Israel), and the intensity (12–80 μA) was adjusted to evoke PSPs of an amplitude (5–11 mV) 30–35% of that required to reach the action potential threshold. When simultaneous FPs and PSPs were recorded, the amplitudes of FPs ranged from 0.16 to 1.5 mV at these stimulation intensities. Stimuli were presented at 0.1 Hz during a baseline period in which the average amplitude of PSPs was stable for at least 10 min. In cases in which DNDS and Cs+ (DNDS-Cs) were included in the recording pipette, IPSPs were monitored at depolarized membrane potentials until they were abolished or greatly attenuated (generally 10–30 min; see Fig. 5B,C), and then baseline data were collected. After the baseline period, 1 Hz stimulation was delivered for 15 min (900 stimuli) with either regular or Poisson-distributed intervals between individual stimuli (Fig.1B–D). After the conditioning train, 0.1 Hz stimulation was resumed, and responses were collected for at least 28 min. Poisson stimulation patterns were generated from a customized script (Spike2; Cambridge Electronic Design, Cambridge, UK) and were unique for each experiment.
Fig. 5.

The variable degree of synaptic plasticity induced by 1 Hz stimulation may result from variable recruitment of inhibition.A, The inhibitory component of compound PSPs is variable. Top, Average traces(n = 5) illustrate a PSP at its resting Vm (−85 mV; left) and at a depolarized potential (−77 mV; middle), and the two traces are superimposed (right). Holding the cell at a slightly depolarized potential with DC current injection unmasks a prominent inhibitory component.Bottom, A different PSP is shown at its resting Vm (left), at −66 mV (middle), and superimposed (right). This PSP contains a less prominent inhibitory component than does the PSP shown above despite the cell being held at a more depolarized potential. B, Diffusion of DNDS-Cs from the recording pipette blocks synaptic inhibition onto that cell. Average PSPs (n = 5) from the same cell show that, at the resting membrane potential, the PSP is increased in amplitude and broadened 30 min after impalement. C, Robust inhibition evident at depolarized potentials immediately after impalement is blocked by DNDS-Cs 30 min later. All traces inB and C are from the same cell. Times shown above or below thetraces are after impalement.
Data acquisition and analysis. Field potential and intracellular recordings were obtained with a Neuroprobe 1600 (A-M Systems) and an Axoclamp 2A amplifier (Axon Instruments, Foster City, CA) in bridge mode, respectively. Data were digitized at 4 kHz and collected on a personal computer using Spike2 software (Cambridge Electronic Design). Input resistances (Rin) of the cells were initially determined with step-current injections (±0.1–0.3 nA; 100 msec) through the recording micropipette and subsequently checked during the control period before and after application of the conditioning protocol by application of −0.05 nA, 100 msec hyperpolarizing pulses. The Rin also was monitored during the application of the regular (but not the Poisson) 1 Hz conditioning trains with −0.05 nA, 100 msec hyperpolarizing pulses delivered after the evoked PSP returned to baseline. The possibility of temporal interaction during short interstimulus intervals precluded application of the Rin test pulses during application of the Poisson conditioning protocol. We considered it unlikely that the Rin test pulses delivered during the regular 1 Hz conditioning protocol affected the results because (1) Rin did not change throughout the conditioning, (2) Emfully recovered to the resting level 750 msec before the next synaptic stimulation, (3) the small magnitude of the brief (100 msec) hyperpolarizing Rin test pulses (<2 mV from Emrest) that were completed 800 msec before the next synaptic stimulation would not affect membrane conductances such as removing inactivation (Connor and Stevens, 1971:Cahabla, 1984; Jung et al., 1997; Mickus et al., 1999; Smith and Ashford, 2000), and (4) the difference in LTD outcome between the regular versus Poisson stimulation that occurred with intracellular recording, where Rin test pulses were used (see Results), was consistent with the difference in LTD outcome between the regular versus Poisson stimulation that occurred with field potential recording, where Rin test pulses were not used. The resting membrane potential was calculated as the difference in the DC potential after electrode withdrawal and the steady-state membrane potential during the baseline period. Only recordings with stable resting membrane potential, input resistance, and baseline period were included in the analysis. In 22 neurons from which compound PSPs were recorded, the mean values (± SD) of the resting membrane potential and apparent input resistance were 80.8 ± 3.1 mV and 32.3 ± 7.1 mΩ, respectively. An additional 29 PSPs were recorded with DNDS and Cs+ in the micropipette to block the GABAAreceptor-mediated Cl− and GABAB receptor-mediated K+ conductance, respectively. In four experiments with DNDS-CS in the recording electrode, a hyperpolarizing PSP was still observed at depolarized holding potentials an hour after the recording commenced, suggesting a pronounced inhibitory component to the PSP, and these recordings were discarded. The input resistance of the remaining 25 cells (mean ± SD, 34.4 ± 9.7 mΩ) was not significantly different from that of the cells without DNDS-Cs; however, the resting membrane potential (mean ± SD, 70.0 ± 5.0 mV) was significantly different (p < 0.0001). This depolarizing shift in the resting membrane potential probably reflects the block of tonic inhibition by DNDS and the block of K+ currents by Cs+. In agreement with its characterization as a reversible, fast-flicker-type, open channel blocker, DNDS did not completely block the early IPSP in all 25 recordings used in this study. In some cases there appeared to be a residual inhibitory component to the depolarizing PSP at depolarized holding potentials.
PSPs and FPs were analyzed off-line, and peak amplitudes, initial slopes, and half-width measured at half-height (half-width) for the PSP were calculated using customized software. The peak amplitude was calculated as the difference in the average of points taken in a 1.25 msec window centered on the point of greatest voltage deflection from baseline during the response compared with that in a 1.25 msec window during the baseline. Measures of peak amplitude are presented, because the proximity of the stimulating and recording electrodes resulted in the contamination of initial slopes by stimulus artifacts in some cases. However, when the calculation of initial slopes was possible, no significant differences were found in this metric as compared with peak amplitude in evaluating changes in synaptic strength.
Changes in synaptic strength were quantified as percentage changes in the average peak amplitude of 30 consecutive PSPs centered at 25 min after conditioning relative to the average peak amplitude of the last 30 baseline responses. A criterion of a ±10% change from baseline of the peak amplitude was used to categorize recordings from individual experiments as potentiated (LTP) or depressed (LTD). In all cases, this change was significant (p < 0.01) when assessed with paired t tests. Group data are presented as the mean ± SEM unless otherwise indicated. The significance of group data was evaluated with two-tailed Student's t tests with a criterion level set at 0.05 for significant LTD or LTP. Possible correlations were evaluated with the Pearson correlation coefficient. Fischer's exact test was used for analysis of contingencies.
Histology. In some experiments, cells were filled with biocytin to verify that recordings were from pyramidal cells in layer 2/3. Microelectrodes were filled with 2% biocytin (in 2.0m potassium acetate), which was allowed to diffuse out of the pipette during and after the recording. After overnight immersion in 4% paraformaldehyde and 0.5% glutaraldehyde in 0.1 mphosphate buffer, the tissue was reimbedded in albumin and gelatin and sectioned at 100 μm on a vibratome. Sections were incubated in an avidin–biotin–horseradish peroxidase complex (Vector Laboratories, Burlingame, CA) and then reacted with 0.3% hydrogen peroxide and diaminobenzidine (50 mg in 100 ml of 0.05 mTris buffer). The tissue was counterstained with cresyl violet. Eleven cells that were recovered all had pyramidal morphologies and were in layer 2/3 (data not shown).
RESULTS
Field potentials
LTD of FPs induced by regular stimulation at 1 Hz in layer 4 has been characterized previously in layer 2/3 of the adult rat visual cortex (Kirkwood et al., 1993; Kirkwood and Bear, 1994b). In agreement with those studies, we find that LTD of FPs in layer 2/3 can be induced by regular stimulation at 1 Hz in layer 4 of the adult guinea pig visual cortex (Fig.2A,B, example). Regular stimulation induced LTD in 10 of 19 experiments. The mean percentage change in the peak amplitude of all 19 FPs evaluated at 25 min after conditioning was significantly depressed from baseline (−9 ± 3%; p < 0.01; Fig. 2C). When just the 10 FPs that depressed were considered, the mean change from baseline was −17 ± 4%. In contrast, Poisson stimulation at an overall rate of 1 Hz did not induce LTD in the majority of experiments (Fig.3A,B, example). LTD was induced in only 4 of 18 experiments by Poisson stimulation, whereas the mean percentage change induced by Poisson stimulation was not different from baseline (0 ± 3%; Fig. 3C). When just the four FPs that depressed were considered, the mean change from baseline was −14 ± 2%. The change in synaptic strength induced by the different stimulation patterns was significantly different (p < 0.05) at 25 min after conditioning (Fig.3C). This difference is further illustrated in the cumulative probability plot (Fig. 3D). Note that LTP is induced by Poisson stimulation in 5 of 18 cases, but by regular stimulation in only 1 of 19 cases. Thus, the lack of a net LTD in the Poisson stimulation group is attributable to two factors—fewer cases of depression and an increased likelihood of potentiation. Therefore, unlike regular stimulation at 1 Hz, Poisson stimulation at 1 Hz does not induce net LTD of FPs.
Fig. 2.

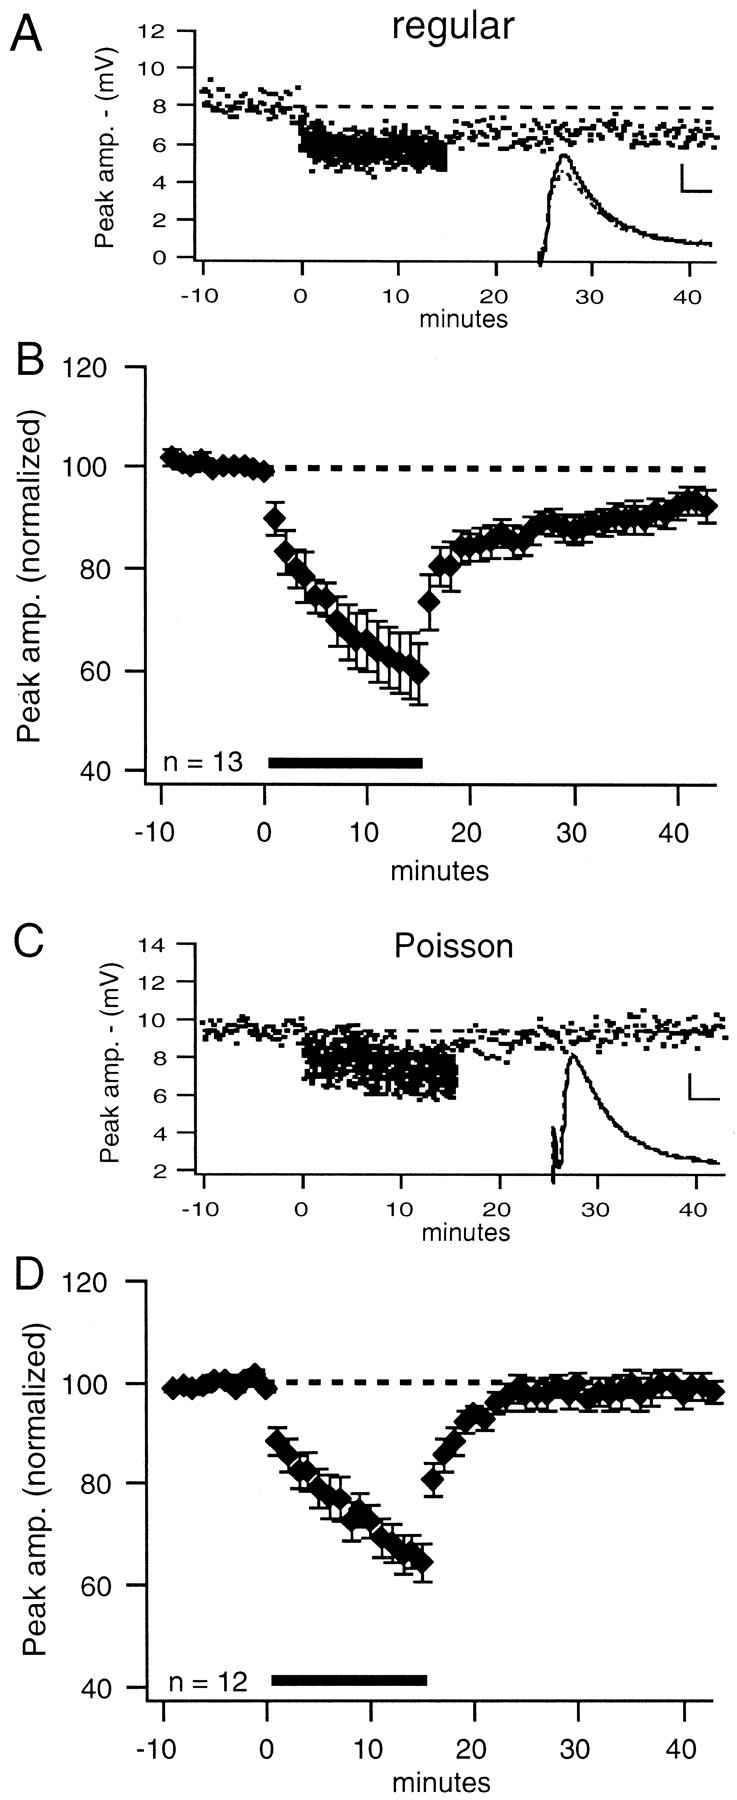
Regular stimulation at 1 Hz induces LTD of FPs.A, Average FP waveforms from a representative example illustrate LTD. FP and PSP waveforms in all figures are averages of 30 responses taken at the end of the baseline period (solid line) and at 25 min after conditioning (dashed line). B, Plot of peak amplitude over time shows stable LTD for FP illustrated in A. Dashed horizontal lines are the baseline average in all figures.C, Group average (± SEM) shows that regular stimulation at 1 Hz induces LTD (−9 ± 3%; p < 0.01) of FPs. The solid horizontal bar indicates 1 Hz conditioning stimulation in all figures. Each point is the average of six responses during the baseline period and 60 responses during the conditioning period in all figures.amp., Amplitude.
Fig. 3.

Poisson stimulation at 1 Hz does not induce LTD of FPs. A, Average FP waveforms from a representative example show no change in synaptic strength. B, Plot of peak amplitude over time shows recovery to baseline for FP illustrated in A. C, Group averages (± SEM) indicate that Poisson stimulation (open diamonds) does not induce LTD (0 ± 3%; n = 18) of FPs. The regular group (filled diamonds) is significantly different (p < 0.05) from the Poisson group at 25 min after conditioning. D, Cumulative probability plot shows the difference between Poisson and regular groups in the percentage change from baseline of the amplitude of FPs at 25 min after conditioning. Symbols in cumulative probability plots are the same as those in the corresponding peak amplitude plot in all figures. Dashed vertical lines are 90 and 110% of baseline in all figures.
Intracellular PSPs
The effects of 1 Hz stimulation on the peak amplitude of intracellularly recorded PSPs were evaluated in 22 neurons and found to be variable for both Poisson and regular conditioning trains. Six examples of responses [three each with regular (Fig.4A–C, left) and Poisson (Fig. 4A–C, right) stimulation] are illustrated. These examples reflect the range of individual responses to 1 Hz conditioning observed at 25 min after conditioning, from LTD (Fig. 4A), to no change (Fig.4B), to LTP (Fig. 4C). LTD was induced in 4 of 11 cells by the regular stimulation (−16 ± 3%;n = 4) and in 2 of 11 cells by the Poisson stimulation (−13 ± 1%; n = 2). No change at 25 min occurred in 3 of 11 cells after regular stimulation and in 5 of 11 cells after Poisson stimulation. LTP was induced in 4 of 11 cells by regular stimulation and in 4 of 11 cells by Poisson stimulation. Group averages reflect that neither regular (+1 ± 6%;n = 11) nor Poisson (+8 ± 7%; n= 11) stimulation induced a net LTD of synaptic strength as evaluated by intracellular recordings of PSPs (Fig. 4D). Although there was no significant difference in the average percentage change induced by Poisson and regular patterns of stimulation at all time points after conditioning, regular stimulation did tend to induce more synaptic depression than did Poisson stimulation. This is evident from the fact that 8 of 11 cells were significantly depressed by regular stimulation during the first 5 min after conditioning, whereas only 4 of 11 cells were significantly depressed by Poisson stimulation during this period. Indeed, the outcome after Poisson stimulation tended toward LTP. A cumulative probability plot (Fig.4E) of the percentage change at 25 min after conditioning illustrates the variability of outcomes in intracellular recordings induced by both patterns of 1 Hz stimulation.
Fig. 4.

Neither Poisson nor regular stimulation induces net LTD of compound intracellular PSPs; however, the sign, magnitude, and duration of changes in synaptic strength are variable across recordings. A, Representative examples show that regular (left) and Poisson (right) patterns of stimulation could induce LTD. Insets, Average PSP waveforms are shown. Calibration: 2 mV, 10 msec. B, In some recordings, a transient depression that recovered to baseline was induced. C, In some cases, a slow-developing LTP occurred. D, Group averages (± SEM) illustrate that neither regular (filled diamonds; +1 ± 6%;n = 11) nor Poisson (open diamonds; +8 ± 7%; n = 11) stimulation induced LTD in intracellular recordings. E, Cumulative probability plot of the percentage changes from baseline of the peak amplitude of the intracellular PSPs at 25 min after conditioning is shown.
What is the source of the variability in changes in synaptic strength?
The variable nature of synaptic plasticity induced by both patterns of stimulation (Fig. 4) was an unexpected outcome of this experiment. Because of this outcome and the proposed role of synaptic inhibition in gating the induction of synaptic plasticity in cortical structures (Artola et al., 1990; Bear et al., 1992; Kirkwood and Bear, 1994a; Wagner and Alger, 1995), we asked whether differential recruitment of inhibition in different recordings could explain the variable effects of 1 Hz stimulation on the intracellular PSPs. If synaptic inhibition can account for the variability in outcomes, there should be different relative inhibitory contributions to PSPs recorded from different cells. One method for evaluating this is to reveal the inhibitory component of the PSP by passing current through the recording electrode to depolarize the membrane potential of the cell during evoked synaptic activity. As the membrane potential of the cell becomes more depolarized, inhibitory components of the compound PSP are unmasked. The amount of inhibition present in each case was not quantified, but a distinct qualitative difference was seen in the contribution of inhibition to the PSP in different recordings. Two examples are shown in Figure5A. The top example shows recordings from a cell with a large underlying IPSP contributing to the compound PSP. This compound PSP was slightly potentiated (+6%) by regular 1 Hz conditioning. Alternatively, the bottomexample shows recordings from a cell with a small underlying IPSP contributing to the compound PSP. Regular 1 Hz conditioning induced LTD (−14%) in this recording. This suggests a role for inhibition in the variability of synaptic plasticity induced by 1 Hz stimulation. To test this idea directly, we compared synaptic plasticity induced by the different patterns of stimulation when synaptic inhibition onto the recorded cell was blocked. Furthermore, using the half-width as a measure of the inhibitory component of each PSP, we plotted the data from the control and DNDS-Cs groups as EPSPs and compound PSPs (containing strong inhibitory and excitatory components) to understand better the role played by inhibition.
The role of inhibition during 1 Hz conditioning
One Hertz conditioning during intracellular blockade of inhibition
A difficulty in blocking inhibition in neocortical slices with bath-applied antagonists is that evoked activity can generate epileptiform discharges. To circumvent this problem we used intracellular blockade of inhibition onto the recorded cell with DNDS-Cs, while leaving inhibition in the slice intact (Dudek and Friedlander, 1996a,b). DNDS is a reversible, fast-flicker-type, open channel blocker of GABAA receptor-mediated Cl− channels, whereas Cs+ blocks a number of K+ conductances, including that mediated by the GABAB receptor. An advantage to this method is that direct effects of inhibition onto the cell of interest can be distinguished from effects of inhibition that may occur throughout the circuit.
In this study, DNDS-Cs blocked the GABAA and GABAB conductances, as assessed by injecting bias current to unmask inhibitory components, in 25 recordings. The effectiveness of DNDS-Cs in blocking early and late IPSPs was evident in the increased magnitude and breadth of PSPs at rest and the reversal of hyperpolarizing PSPs seen at depolarized holding potentials after DNDS-Cs diffused into the cell. An example PSP at its resting membrane potential is shown immediately after impalement and 30 min later after the full effects of DNDS-Cs in Figure 5B. Note that the half-width of this PSP increased markedly after the diffusion of DNDS-CS. This same PSP is shown at a depolarized membrane potential that reveals an IPSP in Figure 5C. After the diffusion of DNDS-Cs into the cell the IPSP is no longer evident.
LTD was induced by regular stimulation in 6 of 13 cells when inhibition was blocked by DNDS-Cs. An example of LTD induced by regular stimulation during blockade of inhibition is shown in Figure6A. Overall, net LTD was induced by regular stimulation when inhibition was blocked (−7 ± 3%; p < 0.02; Fig.6B). When just the six cells that significantly depressed were considered, the magnitude of depression was −16 ± 2%. LTD was not induced by Poisson stimulation (0 of 12 cells) when inhibition was blocked. An example of the characteristic change in synaptic strength seen under these conditions is presented in Figure6C. There was no net change in synaptic strength when Poisson stimulation was used and inhibition was blocked (−1 ± 2%; Fig. 6D). Therefore, regular stimulation, but not Poisson stimulation, induces net LTD at excitatory synapses (when the inhibitory component of the compound PSP is blocked by DNDS-Cs). Another effect of DNDS-Cs was that the induction of LTP by both patterns of stimulation was almost eliminated. Although LTP was induced in 8 of 22 cells (both patterns pooled) under control conditions, it was only induced in 1 of 25 cells (both patterns pooled) when inhibition was blocked by DNDS-Cs (p < 0.01, Fischer's exact test).
Fig. 6.
LTD of intracellular PSPs is induced by regular, but not Poisson, stimulation when inhibition onto that cell is blocked.A, In this representative example with DNDS-Cs in the pipette, regular stimulation induced LTD. B, Group data plots show that, when inhibition is blocked with DNDS-Cs, regular stimulation induces LTD (−7 ± 3%; p < 0.02; n = 13). C, In this representative example with DNDS-Cs in the pipette, Poisson stimulation did not induce LTD. D, Poisson stimulation in the presence of DNDS-Cs does not induce significant depression (−1 ± 2%; n = 12). Insets, Average PSP waveforms are shown. Calibration: 2 mV, 10 msec.
Analysis of half-width
Although these results clearly indicate that LTD can be induced by regular, but not Poisson, stimulation when inhibition is blocked, there were no significant differences between the control and DNDS-Cs groups for either stimulation pattern at 25 min after conditioning. We suggest that the reason for this is that cells in the control and DNDS-Cs groups overlap with respect to the contribution of inhibition to the PSP (see Fig. 7A). There are two reasons why this may occur. (1) DNDS-Cs does not completely block inhibition in some cells but rather attenuates it, and 2) some PSPs in the control group exhibit a very weak or absent inhibitory component. These cells are probably much like some cells in the DNDS-Cs group in terms of the inhibitory component of the PSP.
Fig. 7.

Induction of LTD depends on stimulus pattern and presence of inhibition. A, Histogram shows overlap of half-widths for control (black-outlined vertical bars) and DNDS-Cs (gray-filled vertical bars) groups.Curves (black and gray, respectively) are Gaussian fits to the data. B, Graphs show the percentage change from baseline of the PSP at 25 min plotted versus the half-width of the baseline PSP in control solution.Left, With regular stimulation, narrow PSPs are more likely to be potentiated, whereas broad PSPs are more likely to be depressed. Right, With Poisson stimulation, there is not a significant correlation between the half-width of the baseline PSP and the induction of LTP or LTD. Lines are linear fits to the data. C, The graph displays the data when PSPs with a half-width >8 msec from the control group (see Fig. 4) are pooled with those of the DNDS-Cs group to form an EPSP group and a compound PSP (CPSP) group (half-width < 8 msec). Regular stimulation induces LTD (−9 ± 3%; p< 0.005; n = 16) of the EPSP group (filled diamonds) but not of theCPSP group (open diamonds; 8 ± 6%;n = 8). The EPSP group is significantly different (p < 0.005) from the CPSPgroup. D, The cumulative probability plot reveals the difference between groups for regular stimulation. E, Poisson stimulation does not induce LTD of either the EPSP (−1 ± 3%; n = 15) or the compound PSP (+12 ± 8%;n = 8) groups. F, The cumulative probability plot shows that the EPSP and compound PSP groups are not significantly different. ns, Not significant.
One way to evaluate the contribution of inhibition to compound PSPs is with the half-width measure of the PSP. This measure should reflect the relative contribution of inhibitory potentials to the PSP on the basis of the assumption that a robust inhibitory component will sharpen the PSP resulting in a small half-width, whereas a weak inhibitory component will allow a broader PSP resulting in a large half-width (Peng and Frank, 1989; Turner, 1990; Turner and Wheal, 1991). Indeed, we find a significant difference (p < 0.01,t test) in the mean half-width in our control (7.2 ± 0.5 msec; n = 22) and DNDS-Cs (9.2 ± 0.5 msec;n = 25) groups. Figure 7A illustrates that there is an overlap of the DNDS-Cs and control groups with respect to their half-widths, suggesting that some PSPs in the control group have weak or absent inhibitory components. To determine the relationship between the amount of inhibition recruited and changes in synaptic strength, we correlated the mean half-width (last 30 responses) of the baseline PSPs with the percentage change in PSP amplitude at 25 min after conditioning. The percentage change in the amplitude of PSPs at 25 min is correlated (r = −0.603; p< 0.05) with their half-width during the baseline period when the regular 1 Hz conditioning protocol is used (Fig. 7B). Broad PSPs, reflecting weak inhibition, are depressed, whereas narrow PSPs, reflecting stronger inhibition, are potentiated or do not change. Note that there is a threshold at ∼8 msec that demarcates these two effects and that also is a lower bound for the range of overlap of half-widths between the control group and the DNDS-Cs group (see Fig.7A). There is not a correlation (r = −0.084) between the half-width and changes in synaptic strength when Poisson patterns are used (Fig. 7B), suggesting that Poisson stimulation renders the outcome (LTD or LTP) less sensitive to inhibition.
To delineate more clearly between PSPs with a weak and strong inhibitory component, we pooled those cells from the control group with half-widths >8 msec with the cells from the DNDS-Cs group. This allowed us to compare an EPSP group (inhibition weak or absent; the DNDS-Cs group + 6 cells from the control group) and a compound PSP group (inhibition strong; the 16 remaining cells from the control group) for each pattern of stimulation. When the groups are compared in this way, LTD of the EPSP group is induced (−9 ± 3%;n = 16; p < 0.005), and there is a significant difference (p < 0.005) in the effects of the conditioning protocol between the EPSP group and the compound PSP group (+8 ± 6%; n = 8) when regular stimulation is used (Fig. 7C). This difference is evident in the cumulative probability plot (Fig. 7D) where the presence of strong inhibition shifts the outcome away from LTD and toward LTP. With Poisson stimulation however, LTD does not occur, regardless of the presence or absence of a strong inhibitory component to the PSP, and the groups do not differ (p = 0.09; EPSPs = −1 ± 3%; n = 15; compound PSPs = +12 ± 8%; n = 8; Fig. 7E). In agreement with the lack of correlation between the half-width and the change in synaptic strength seen when Poisson stimulation is used, the cumulative probability plot (Fig. 7F) reveals that changes in synaptic strength induced by Poisson stimulation are not as tightly regulated by inhibition. The only difference between the compound PSP and EPSP groups with Poisson stimulation is that the magnitude of potentiation is increased when inhibition is strong. Thus, differences in long-term changes in synaptic strength induced by Poisson and regular patterns of stimulation occur at excitatory synapses (i.e., when the inhibitory component of the PSP is weak). When the inhibitory component of the PSP is strong, the change in synaptic strength induced by 1 Hz stimulation tends toward potentiation, regardless of stimulation pattern.
Relationship of intracellular PSPs to field potentials
Simultaneously recording FPs and PSPs in the same slice allowed us to evaluate whether changes in synaptic strength similar to those assessed by intracellular recordings occurred in the volume of tissue surrounding the recorded cell. In agreement with previous results (Kirkwood and Bear, 1994a,b; Castro-Alamancos et al., 1995; Hess and Donoghue, 1996), we found a significant correlation between changes in synaptic strength assessed with simultaneously recorded FPs and PSPs recorded both with control filling solution (r = 0.774;p < 0.001, pooled Poisson and regular groups) and with DNDS-Cs (r = 0.881; p < 0.0001, pooled Poisson and regular groups) in the electrode (Fig.8). However, there is a difference between PSPs recorded with control filling solution and with DNDS-Cs in the electrode as they relate to FPs. The changes in the magnitude of FPs were remarkably similar to the changes in the magnitude of EPSPs (compare Figs. 3C,D, 7, EPSP data), whereas, overall, FPs exhibited greater depression than did PSPs recorded with control filling solution in the electrode (compare Figs. 3C,4D). This point is clearly illustrated in Figure 8 in which simultaneously recorded FPs and PSPs in control or DNDS-Cs filling solutions are plotted. In 13 of 14 control cases (Fig.8A) the magnitude of the FP normalized to the baseline after conditioning was less than that of the PSP normalized to baseline, whereas with DNDS-CS (Fig. 8B) the normalized magnitude of FPs was equally likely to be greater than (n = 12) or less than (n = 12) the normalized magnitude of the PSP. Thus, FPs are equivalent to EPSPs (i.e., with inhibition onto the cell blocked or absent) as a measure of synaptic plasticity induced by 1 Hz stimulation. This is consistent with evidence from current source density analysis and pharmacological experiments (Borroni et al., 1991; Bear et al., 1992) that suggests that FPs recorded in layer 2/3 of the neocortical slice preparation are predominately a measure of excitatory synaptic transmission.
Fig. 8.
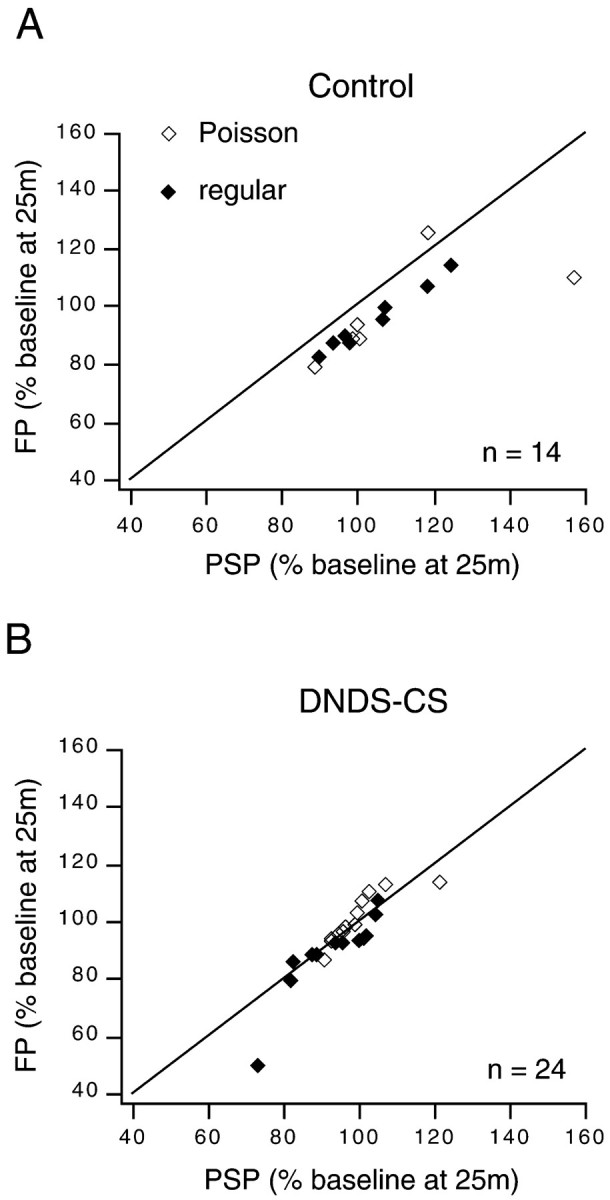
Field potentials and PSPs with inhibition blocked are similar measures of synaptic plasticity induced by 1 Hz stimulation. A, With control filling solution, the percentage of the baseline at 25 min after conditioning for the FP is less than that of the simultaneously recorded PSP in 13 of 14 experiments. B, With DNDS-Cs in the pipette, the percentage of the baseline at 25 min after conditioning for a FP is equally likely to be less than (n = 12) or greater than (n = 12) that of the simultaneously recorded PSP. Changes in FPs and simultaneous PSPs are significantly correlated for both groups. Dashed lines indicate unity.
DISCUSSION
We examined the role that the timing of synaptic activity plays in the induction of LTD in the adult visual cortex by comparing changes in synaptic strength induced by regular and Poisson patterns of afferent stimulation at the same mean 1 Hz rate. Poisson stimulation was used to mimic the irregular spike activity that occurs in vivo. When FP recordings were used to assess synaptic strength, conventional regular stimulation reliably induced LTD (see also Kirkwood et al., 1993; Kirkwood and Bear, 1994b). However, when synaptic strength was assessed at the individual cell level, regular 1 Hz stimulation did not reliably induce LTD. LTD could occur at individual cells, but these examples were counterbalanced by cases in which LTP was induced. Some of this individual cell variability can be accounted for by the presence of a significant component of synaptic inhibition in the compound PSP, because LTD was reliably induced when inhibition was absent (see also Dudek and Friedlander, 1996a). The major finding in this study, however, is that Poisson stimulation did not induce LTD of synaptic strength whether assessed at the individual cell or FP level, regardless of the presence of synaptic inhibition.
Role of temporal contiguity of stimuli in plasticity—the calcium hypothesis
What differences occur during regular and Poisson stimulation that result in LTD being induced by only the regular pattern? The critical parameter for determining long-term changes in synaptic strength must be the temporal relationship of individual stimuli, because the number of stimuli (900) and the time over which they are presented (15 min) are the same for each pattern. Periodic epochs of high-frequency synaptic activity interspersed with quiescent periods >1 sec occur during Poisson stimulation (see Fig. 1B–D). We suggest that this pattern of stimulation results in a spatiotemporal profile of postsynaptic intracellular [Ca2+] that is sufficiently different from that produced by regular stimulation to account for the differing abilities of the patterns to induce LTD.
It has been shown in both the hippocampus and neocortex that a moderate increase in postsynaptic intracellular [Ca2+] during the activation of a population of synapses favors the induction of LTD at those synapses, whereas a more substantial increase triggers the induction of LTP (Yasuda and Tsumoto, 1996; Hansel et al., 1997; Yang et al., 1999). These observations are the basis for the hypothesis that the postsynaptic [Ca2+] at the dendritic spine is the primary determinant of the polarity of modification of synaptic strength during the activation of a synapse (Lisman, 1989;Artola and Singer, 1993). Implicit in this hypothesis, and supported by empirical evidence, is that there exists a crossover point or threshold spatiotemporal concentration of intracellular calcium at which no net change in the synaptic strength of a population of synapses occurs (Bienenstock et al., 1982; Artola and Singer, 1993; Bear, 1995, 1996). We suggest that during Poisson stimulation, epochs occur during which intracellular postsynaptic calcium increases to levels that are not reached during regular stimulation. These brief periods of high calcium would push the polarity of the modification of synaptic strength toward LTP and, thus, toward the crossover point for the population of synapses. The consistent intervals of regular stimulation would result in a calcium concentration that does not reach the peaks that occur during Poisson stimulation but that would stabilize at a moderate level during the conditioning train and preferentially induce LTD at the majority of activated synapses.
Induction of LTD or LTP by 1 Hz stimulation and the influence of inhibition
We found that LTD was more likely to be induced by regular stimulation when there was a weak inhibitory component to the PSP, whereas, in the cases in which inhibition was strong, LTP could be induced. When Poisson stimulation was used, the outcome was not dependent on inhibition. This is evident from two observations: (1) the significant correlation that occurs between the half-widths of the PSPs and the percentage change at 25 min with regular stimulation, but not with Poisson stimulation (see Fig. 7B), and (2) the significant difference between the EPSP and compound PSP groups after regular stimulation, but not after Poisson stimulation (see Fig.7C–F). An analysis of the induction of LTP in this experiment provides insight into one possible reason for the differential influence of inhibition when Poisson and regular stimulation are used. Overall, LTP induction was more likely (p < 0.05, Fischer's exact test) when there was a robust inhibitory component of the intracellularly recorded PSP (44% or 7 of 16 cases, both patterns pooled) as compared with cases in which postsynaptic inhibition was blocked or an inhibitory component of the PSP was not evident from the half-width measure (6% or 2 of 31 cases, both patterns pooled). There are three possible explanations for this result: (1) depression of the direct inhibitory component of the compound PSP, (2) depression of excitatory synaptic transmission onto inhibitory interneurons that innervate the recorded cell, or (3) excitatory synapses onto the recorded cell that are potentiated by 1 Hz stimulation in the presence of postsynaptic inhibition. There are reports of activity-dependent plasticity at both excitatory synapses onto inhibitory cells and inhibitory synapses (Marty and Llano, 1995;Komatsu, 1996; McMahon and Kauer, 1997; Laezza et al., 1999). Potentiation of excitatory transmission with synaptic inhibition intact seems at odds with reports that inhibition blocks or attenuates LTP at excitatory synapses in the visual cortex (Artola et al., 1990; Bear et al., 1992; Kirkwood and Bear, 1994a). However, in these previous experiments, brief epochs of high-frequency stimulation, not 1 Hz stimulation, were used to induce LTP.
The FP data should provide clues for discriminating between these alternative mechanisms because FPs are predominately a measure of excitatory synaptic transmission in the neocortical slice preparation (Borroni et al., 1991; Bear et al., 1992) (see Fig. 8). Thus, if the potentiation that is induced by our protocol with synaptic inhibition present results from a depression of inhibitory currents, FPs should not be potentiated. Conversely, if FPs are potentiated, it would imply that excitatory synaptic transmission can be potentiated by 1 Hz stimulation in the presence of inhibition. We found that LTP was induced by Poisson stimulation in 5 of 18 FP recordings, but in only 1 of 19 FP recordings in which regular stimulation was used (p = 0.09, Fischer's exact test). Thus, when predominately excitatory synaptic transmission is evaluated separately (either as FP recordings or as intracellularly recorded PSPs in which postsynaptic inhibition is absent), LTP is induced by regular 1 Hz stimulation in only 3% (1 of 35) of cases (1 of 19 FP; 0 of 16 EPSP), but it is induced by Poisson stimulation in 21% (7 of 33) of cases (5 of 18 FP; 2 of 15 EPSP; p < 0.03, Fischer's exact test). These results are consistent with a depression of inhibitory synaptic transmission underlying the potentiation that can be induced by regular 1 Hz stimulation. Conversely, Poisson stimulation at 1 Hz can potentiate excitatory synaptic transmission in layer 2/3. The brief bursts of high-frequency activity that occur during Poisson stimulation allow temporal summation of PSPs, resulting in a greater depolarization over a longer epoch of time (see Fig. 1C). In this way, bursts of activity may overcome the hyperpolarizing effects of inhibition and induce LTP at excitatory synapses (see previous section for discussion of the possible role of calcium). Furthermore, Poisson stimulation may be less likely to induce depression of inhibitory synaptic transmission.
Functional implications of Poisson patterns of stimulation
In addition to the visual cortex, LTD has been induced by regular LFS in other neocortical regions in the adult (Castro-Alamancos et al., 1995; Chen et al., 1996; Hess and Donoghue, 1996; Cho et al., 2000;Froc et al., 2000). Thus, the sustained low-frequency spike activity of a neuron in the adult cortex could be sufficient to depress the synapses that a cell makes with its postsynaptic targets. However, on the basis of our results, prolonged 1 Hz activity only induces LTD when that activity is regular. Such prolonged regular activity is unlikely to occur in vivo (Softky and Koch, 1993; Shadlen and Newsome, 1998; Stevens and Zador, 1998). Thus, unless additional constraints are imposed, the standard experimental protocol for LTD induction (prolonged regular 1 Hz stimulation) does not appear to have physiological significance for the sustained downregulation of synaptic strength, at least in the mature visual cortex at supragranular synapses. However, prolonged low-frequency synaptic activity in vivo might induce LTD if, for example, that activity covaried with specific states of postsynaptic activity that are determined by other inputs to the cell [i.e., membrane potential of the postsynaptic cell (Artola et al., 1990; Frégnac et al., 1994; Ngezahayo et al., 2000), temporal correlation with postsynaptic spikes (Markram et al., 1997; Linden, 1999), and/or activity of neuromodulators (Kirkwood et al., 1999; Manahan-Vaughn and Braunewell, 1999; Kojic et al., 2000)].
Prolonged periods of low-frequency activity in populations of afferents may play a specialized role in the structural refinement of cortical circuits during development (Katz and Shatz, 1996; Rittenhouse et al., 1999). An example of structural refinement in the visual cortex is the development of ocular dominance columns (Hubel and Wiesel, 1970;Friedlander and Martin, 1989), which may be initiated by a failure to achieve persistent, temporally correlated presynaptic activity and postsynaptic depolarization (Bienenstock et al., 1982;Blais et al., 1999; Hata et al., 1999). It has been proposed that homosynaptic LTD (Bienenstock et al., 1982; Blais et al., 1999;Rittenhouse et al., 1999) is a primary event leading to the long-term structural and functional changes in synapses that occur as a consequence of imbalanced binocular interactions during the critical period. Indeed, LTD induced by regular stimulation in the young animal is more robust than that induced in the adult (Mulkey and Malenka, 1992; Dudek and Bear, 1993; Wagner and Alger, 1995). Therefore, it remains to be seen whether periods of “Poisson-like” low-frequency activity are more likely to induce LTD in the immature visual cortex.
It is important to note that Poisson stimulation at 1 Hz is capable of inducing LTD at some individual synaptic connections. This is evident from the fact that a small-magnitude LTD was induced by Poisson stimulation in some recordings. However, among the population of cells studied, these cases were counterbalanced by examples in which Poisson stimulation induced LTP, resulting in no net change in synaptic strength across the group. These counterbalanced changes in synaptic strength that occur across slices in this experiment imply that changes in the strength of individual synapses within a network of neurons can occur, while the overall synaptic drive onto an individual cell remains relatively constant. In the case of compound PSPs in which regular stimulation is used that induces LTD of both the excitatory and inhibitory synapses, information could be stored at both types of synapses while overall synaptic drive remains constant. This is consistent with models that incorporate synaptic plasticity as a mechanism to store information (Bienenstock et al., 1982; Bear, 1995;Miller, 1996). An important theoretical constraint in such models is that a homeostasis of synaptic activity must be maintained while information is encoded at individual synapses. In this regard, the depression of synaptic strengths is almost certainly a necessary and integral mechanism via which information is stored in adult cortical structures. However, the patterns of activity that induce long-term synaptic depression are different at different types of synapses (Tsumoto, 1992; Bear and Malenka, 1994; Linden, 1994; Marty and Llano, 1995) and probably at different times (because of the history of presynaptic activity, the voltage state of the postsynaptic cell, the activity of neuromodulators, etc.) at the same synapses (Artola et al., 1990; Frégnac et al., 1994; Abraham and Bear, 1996; Markram et al., 1997; Kirkwood et al., 1999; Linden, 1999; Manahan-Vaughn and Braunewell, 1999; Kojic et al., 2000). Although our results with Poisson stimulation challenge the physiological applicability of the commonly used regular 1 Hz stimulation paradigm for LTD induction, it will also be useful to evaluate the effects of natural stimulus patterns recorded in vivo (Dobrunz and Stevens, 1999).
Footnotes
This work was supported by National Institutes of Health Grant EY-12782 to M.J.F., National Research Service Award 09770 to S.P.P., and Grant MH-52797 to P.R.M. We thank Drs. Lucas Pozzo-Miller and Lynn Dobrunz for helpful comments.
Correspondence should be addressed to Dr. Michael J. Friedlander, Department of Neurobiology, 516 Civitan International Research Building, 1719 Sixth Avenue South, University of Alabama at Birmingham, Birmingham, AL 35294. E-mail: mjf@nrc.uab.edu.
Dr. Dudek's present address: LDN-National Institute of Child Health and Human Development, National Institutes of Health, Bethesda, MD 20892.
Dr. Eagleman's present address: Computational Neurobiology Lab, The Salk Institute, La Jolla, CA 92037.
REFERENCES
- 1.Abbott LF, Sen K, Varela JA, Nelson SB. Synaptic depression and cortical gain control. Science. 1997;275:220–222. doi: 10.1126/science.275.5297.221. [DOI] [PubMed] [Google Scholar]
- 2.Abraham WC, Bear MF. Metaplasticity: the plasticity of synaptic plasticity. Trends Neurosci. 1996;19:126–130. doi: 10.1016/s0166-2236(96)80018-x. [DOI] [PubMed] [Google Scholar]
- 3.Abraham WC, Mason-Parker SE, Logan B. Low-frequency stimulation does not readily cause long-term depression or depotentiation in the dentate gyrus of awake rats. Brain Res. 1996;722:217–221. doi: 10.1016/0006-8993(96)00130-8. [DOI] [PubMed] [Google Scholar]
- 4.Artola A, Singer W. Long-term depression of excitatory synaptic transmission and its relationship to long-term potentiation. Trends Neurosci. 1993;16:480–487. doi: 10.1016/0166-2236(93)90081-v. [DOI] [PubMed] [Google Scholar]
- 5.Artola A, Bröcher S, Singer W. Different voltage-dependent thresholds for inducing long-term depression and long-term potentiation in slices of rat visual cortex. Nature. 1990;347:69–72. doi: 10.1038/347069a0. [DOI] [PubMed] [Google Scholar]
- 6.Bear MF. Mechanism for a sliding synaptic modification threshold. Neuron. 1995;15:1–4. doi: 10.1016/0896-6273(95)90056-x. [DOI] [PubMed] [Google Scholar]
- 7.Bear MF. A synaptic basis for memory storage in the cerebral cortex. Proc Natl Acad Sci USA. 1996;93:13453–13459. doi: 10.1073/pnas.93.24.13453. [DOI] [PMC free article] [PubMed] [Google Scholar]
- 8.Bear MF. Homosynaptic long-term depression: a mechanism for memory? Proc Natl Acad Sci USA. 1999;96:9457–9458. doi: 10.1073/pnas.96.17.9457. [DOI] [PMC free article] [PubMed] [Google Scholar]
- 9.Bear MF, Malenka RC. Synaptic plasticity: LTP and LTD. Curr Opin Neurobiol. 1994;4:389–399. doi: 10.1016/0959-4388(94)90101-5. [DOI] [PubMed] [Google Scholar]
- 10.Bear MF, Press WA, Connors BW. Long-term potentiation in slices of kitten visual cortex and the effects of NMDA receptor blockade. J Neurophysiol. 1992;67:841–851. doi: 10.1152/jn.1992.67.4.841. [DOI] [PubMed] [Google Scholar]
- 11.Berger TW, Eriksson JL, Ciarolla DA, Sclabassi RJ. Nonlinear systems analysis of the hippocampal perforant path-dentate projection. III. Comparison of random train and paired pulse stimulation. J Neurophysiol. 1988;60:1095–1109. doi: 10.1152/jn.1988.60.3.1095. [DOI] [PubMed] [Google Scholar]
- 12.Bienenstock EL, Cooper LN, Munro PW. Theory for the development of neuron selectivity: orientation specificity and binocular interaction in visual cortex. J Neurosci. 1982;2:32–48. doi: 10.1523/JNEUROSCI.02-01-00032.1982. [DOI] [PMC free article] [PubMed] [Google Scholar]
- 13.Blais BS, Shouval HZ, Cooper LN. The role of presynaptic activity in monocular deprivation: comparison of homosynaptic and heterosynaptic mechanisms. Proc Natl Acad Sci USA. 1999;96:1083–1087. doi: 10.1073/pnas.96.3.1083. [DOI] [PMC free article] [PubMed] [Google Scholar]
- 14.Bliss TVP, Gardner-Medwin AR. Long-lasting potentiation of synaptic transmission in the dentate area of the unanaesthetized rabbit following stimulation of the perforant path. J Physiol (Lond) 1973;232:357–374. doi: 10.1113/jphysiol.1973.sp010274. [DOI] [PMC free article] [PubMed] [Google Scholar]
- 15.Borroni AM, Vaknin G, Berry R, Teyler TJ. Methods for studying the conductance changes associated with synaptic activation of forebrain slices: the interpretation of field potentials using CSD profiles. J Neurosci Methods. 1991;39:89–102. doi: 10.1016/0165-0270(91)90096-i. [DOI] [PubMed] [Google Scholar]
- 16.Buonomano DV, Merzenich MM. Cortical plasticity: from synapses to maps. Annu Rev Neurosci. 1998;21:149–186. doi: 10.1146/annurev.neuro.21.1.149. [DOI] [PubMed] [Google Scholar]
- 17.Cahabla LD. The kinetics of recovery and development of potassium channel inactivation in perfused squid giant axons. J Physiol (Lond) 1984;356:193–220. doi: 10.1113/jphysiol.1984.sp015460. [DOI] [PMC free article] [PubMed] [Google Scholar]
- 18.Castro-Alamancos MA, Donoghue JP, Connors BW. Different forms of synaptic plasticity in somatosensory and motor areas of the neocortex. J Neurosci. 1995;15:5324–5333. doi: 10.1523/JNEUROSCI.15-07-05324.1995. [DOI] [PMC free article] [PubMed] [Google Scholar]
- 19.Chen WR, Lee S, Kato K, Spencer DD, Shepherd GM, Williamson A. Long-term modifications of synaptic efficacy in the human inferior and middle temporal cortex. Proc Natl Acad Sci USA. 1996;93:8011–8015. doi: 10.1073/pnas.93.15.8011. [DOI] [PMC free article] [PubMed] [Google Scholar]
- 20.Cho K, Kemp N, Noel J, Aggleton JP, Brown MW, Bashir ZI. A new form of long-term depression in the perirhinal cortex. Nat Neurosci. 2000;3:150–156. doi: 10.1038/72093. [DOI] [PubMed] [Google Scholar]
- 21.Connor JA, Stevens CF. Inward and delayed outward membrane currents in isolated neural somata during voltage clamp. J Physiol (Lond) 1971;213:1–19. doi: 10.1113/jphysiol.1971.sp009364. [DOI] [PMC free article] [PubMed] [Google Scholar]
- 22.Connors BW, Gutnick MJ. Intrinsic firing patterns of diverse neocortical neurons. Trends Neurosci. 1990;13:99–104. doi: 10.1016/0166-2236(90)90185-d. [DOI] [PubMed] [Google Scholar]
- 23.Dobrunz LE, Stevens CF. Response of hippocampal synapses to natural stimulation patterns. Neuron. 1999;22:157–166. doi: 10.1016/s0896-6273(00)80687-x. [DOI] [PubMed] [Google Scholar]
- 24.Dudek SM, Bear MF. Homosynaptic long-term depression in area CA1 of hippocampus and the effects of NMDA receptor blockade. Proc Natl Acad Sci USA. 1992;89:4363–4367. doi: 10.1073/pnas.89.10.4363. [DOI] [PMC free article] [PubMed] [Google Scholar]
- 25.Dudek SM, Bear MF. Bidirectional long-term modification of synaptic effectiveness in the adult and immature hippocampus. J Neurosci. 1993;13:2910–2918. doi: 10.1523/JNEUROSCI.13-07-02910.1993. [DOI] [PMC free article] [PubMed] [Google Scholar]
- 26.Dudek SM, Friedlander MJ. Developmental down-regulation of LTD in cortical layer IV and its independence of modulation by inhibition. Neuron. 1996a;16:1097–1106. doi: 10.1016/s0896-6273(00)80136-1. [DOI] [PubMed] [Google Scholar]
- 27.Dudek SM, Friedlander MJ. Intracellular blockade of inhibitory synaptic responses in visual cortical layer IV neurons. J Neurophysiol. 1996b;75:2167–2173. doi: 10.1152/jn.1996.75.5.2167. [DOI] [PubMed] [Google Scholar]
- 28.Errington ML, Bliss TVP, Richter-Levin G, Yenk K, Doyère V, Laroche S. Stimulation at 1–5 Hz does not produce long-term depression or depotentiation in the hippocampus of the adult rat in vivo. J Neurophysiol. 1995;74:1793–1799. doi: 10.1152/jn.1995.74.4.1793. [DOI] [PubMed] [Google Scholar]
- 29.Frégnac Y, Burke JP, Smith D, Friedlander MJ. Temporal covariance of pre- and postsynaptic activity regulates functional connectivity in the visual cortex. J Neurophysiol. 1994;71:1403–1421. doi: 10.1152/jn.1994.71.4.1403. [DOI] [PubMed] [Google Scholar]
- 30.Friedlander MJ, Martin KA. Development of Y-axon innervation of cortical area 18 in the cat. J Physiol (Lond) 1989;416:183–213. doi: 10.1113/jphysiol.1989.sp017756. [DOI] [PMC free article] [PubMed] [Google Scholar]
- 31.Froc DJ, Chapman CA, Trepel C, Racine RJ. Long-term depression and depotentiation in the sensorimotor cortex of the freely moving rat. J Neurosci. 2000;20:438–445. doi: 10.1523/JNEUROSCI.20-01-00438.2000. [DOI] [PMC free article] [PubMed] [Google Scholar]
- 32.Gilbert CD. Laminar differences in receptive field properties of cells in cat primary visual cortex. J Physiol (Lond) 1977;268:391–421. doi: 10.1113/jphysiol.1977.sp011863. [DOI] [PMC free article] [PubMed] [Google Scholar]
- 33.Hamdy S, Rothwell JC, Aziz Q, Singh KD, Thompson DG. Long-term reorganization of human motor cortex driven by short-term sensory stimulation. Nat Neurosci. 1998;1:64–68. doi: 10.1038/264. [DOI] [PubMed] [Google Scholar]
- 34.Hansel C, Artola A, Singer W. Relation between dendritic Ca2+ levels and the polarity of synaptic long-term modifications in rat visual cortex neurons. Eur J Neurosci. 1997;9:2309–2322. doi: 10.1111/j.1460-9568.1997.tb01648.x. [DOI] [PubMed] [Google Scholar]
- 35.Harsanyi K, Friedlander MJ. Transient synaptic potentiation in the visual cortex. I. Cellular mechanisms. J Neurophysiol. 1997;77:1269–1283. doi: 10.1152/jn.1997.77.3.1269. [DOI] [PubMed] [Google Scholar]
- 36.Hata Y, Tsumoto T, Stryker MP. Selective pruning of more active afferents when cat visual cortex is pharmacologically inhibited. Neuron. 1999;22:375–381. doi: 10.1016/s0896-6273(00)81097-1. [DOI] [PubMed] [Google Scholar]
- 37.Hess G, Donoghue JP. Long-term depression of horizontal connections in rat motor cortex. Eur J Neurosci. 1996;8:658–665. doi: 10.1111/j.1460-9568.1996.tb01251.x. [DOI] [PubMed] [Google Scholar]
- 38.Hubel DH, Wiesel TN. The period of susceptibility to the physiological effects of unilateral eye closure in kittens. J Physiol (Lond) 1970;206:419–436. doi: 10.1113/jphysiol.1970.sp009022. [DOI] [PMC free article] [PubMed] [Google Scholar]
- 39.Jung HY, Mickus T, Spruston N. Prolonged sodium channel inactivation contributes to dendritic action potential attenuation in hippocampal pyramidal neurons. J Neurosci. 1997;17:6639–6646. doi: 10.1523/JNEUROSCI.17-17-06639.1997. [DOI] [PMC free article] [PubMed] [Google Scholar]
- 40.Katz LC, Shatz CJ. Synaptic activity and the construction of cortical circuits. Science. 1996;274:1133–1138. doi: 10.1126/science.274.5290.1133. [DOI] [PubMed] [Google Scholar]
- 41.Kirkwood A, Bear MF. Hebbian synapses in visual cortex. J Neurosci. 1994a;14:1634–1645. doi: 10.1523/JNEUROSCI.14-03-01634.1994. [DOI] [PMC free article] [PubMed] [Google Scholar]
- 42.Kirkwood A, Bear MF. Homosynaptic long-term depression in the visual cortex. J Neurosci. 1994b;14:3404–3412. doi: 10.1523/JNEUROSCI.14-05-03404.1994. [DOI] [PMC free article] [PubMed] [Google Scholar]
- 43.Kirkwood A, Dudek SM, Gold JT, Aizenman CD, Bear MF. Common forms of synaptic plasticity in the hippocampus and neocortex in vitro. Science. 1993;260:1518–1521. doi: 10.1126/science.8502997. [DOI] [PubMed] [Google Scholar]
- 44.Kirkwood A, Silva A, Bear MF. Age-dependent decrease of synaptic plasticity in the neocortex of αCaMKII mutant mice. Proc Natl Acad Sci USA. 1997;94:3380–3383. doi: 10.1073/pnas.94.7.3380. [DOI] [PMC free article] [PubMed] [Google Scholar]
- 45.Kirkwood A, Rozas C, Kirkwood J, Perez F, Bear MF. Modulation of long-term synaptic depression in visual cortex by acetylcholine and norepinephrine. J Neurosci. 1999;19:1599–1609. doi: 10.1523/JNEUROSCI.19-05-01599.1999. [DOI] [PMC free article] [PubMed] [Google Scholar]
- 46.Kojic L, Dyck RH, Gu Q, Douglas RM, Matsubara J, Cynader MS. Columnar distribution of serotonin-dependent plasticity within kitten striate cortex. Proc Natl Acad Sci USA. 2000;97:1841–1844. doi: 10.1073/pnas.97.4.1841. [DOI] [PMC free article] [PubMed] [Google Scholar]
- 47.Komatsu Y. GABAB receptors, monoamine receptors, and postsynaptic inositol triphosphate-induced Ca2+ release are involved in the induction of long-term potentiation at visual cortical inhibitory synapses. J Neurosci. 1996;16:6342–6352. doi: 10.1523/JNEUROSCI.16-20-06342.1996. [DOI] [PMC free article] [PubMed] [Google Scholar]
- 48.Laezza F, Doherty JJ, Dingledine R. Long-term depression in hippocampal interneurons: joint requirement for pre- and postsynaptic events. Science. 1999;285:1411–1414. doi: 10.1126/science.285.5432.1411. [DOI] [PubMed] [Google Scholar]
- 49.Linden DJ. Long-term synaptic depression in the mammalian brain. Neuron. 1994;12:457–472. doi: 10.1016/0896-6273(94)90205-4. [DOI] [PubMed] [Google Scholar]
- 50.Linden DJ. The return of the spike: postsynaptic action potentials and the induction of LTP and LTD. Neuron. 1999;22:661–666. doi: 10.1016/s0896-6273(00)80726-6. [DOI] [PubMed] [Google Scholar]
- 51.Lisman J. A mechanism for the Hebb and the anti-Hebb processes underlying learning and memory. Proc Natl Acad Sci USA. 1989;86:9574–9578. doi: 10.1073/pnas.86.23.9574. [DOI] [PMC free article] [PubMed] [Google Scholar]
- 52.Manahan-Vaughn D, Braunewell KH. Novelty acquisition is associated with induction of hippocampal long-term depression. Proc Natl Acad Sci USA. 1999;96:8739–8744. doi: 10.1073/pnas.96.15.8739. [DOI] [PMC free article] [PubMed] [Google Scholar]
- 53.Markram H, Lübke J, Frotscher M, Sakmann B. Regulation of synaptic efficacy by coincidence of postsynaptic APs and EPSPs. Science. 1997;275:213–215. doi: 10.1126/science.275.5297.213. [DOI] [PubMed] [Google Scholar]
- 54.Marty A, Llano I. Modulation of inhibitory synapses in the mammalian brain. Curr Opin Neurobiol. 1995;5:335–341. doi: 10.1016/0959-4388(95)80046-8. [DOI] [PubMed] [Google Scholar]
- 55.McAdams CJ, Maunsell JHR. Effects of attention on the reliability of individual neurons in monkey visual cortex. Neuron. 1999;23:765–773. doi: 10.1016/s0896-6273(01)80034-9. [DOI] [PubMed] [Google Scholar]
- 56.McCormick DA, Connors BW, Lighthall JW, Prince DA. Comparative electrophysiology of pyramidal and sparsely spiny stellate neurons of the neocortex. J Neurophysiol. 1985;54:782–806. doi: 10.1152/jn.1985.54.4.782. [DOI] [PubMed] [Google Scholar]
- 57.McMahon LL, Kauer JA. Hippocampal interneurons express a novel form of synaptic plasticity. Neuron. 1997;18:295–305. doi: 10.1016/s0896-6273(00)80269-x. [DOI] [PubMed] [Google Scholar]
- 58.Mickus T, Jung HY, Spruston N. Properties of slow, cumulative sodium channel inactivation in rat hippocampal CA1 pyramidal neurons. Biophys J. 1999;76:846–860. doi: 10.1016/S0006-3495(99)77248-6. [DOI] [PMC free article] [PubMed] [Google Scholar]
- 59.Miller KD. Synaptic economics: competition and cooperation in synaptic plasticity. Neuron. 1996;17:371–374. doi: 10.1016/s0896-6273(00)80169-5. [DOI] [PubMed] [Google Scholar]
- 60.Mulkey RM, Malenka RC. Mechanisms underlying induction of homosynaptic long-term depression in area CA1 of the hippocampus. Neuron. 1992;9:967–975. doi: 10.1016/0896-6273(92)90248-c. [DOI] [PubMed] [Google Scholar]
- 61.Ngezahayo A, Schachner M, Artola A. Synaptic activity modulates the induction of bidirectional synaptic changes in adult mouse hippocampus. J Neurosci. 2000;20:2451–2458. doi: 10.1523/JNEUROSCI.20-07-02451.2000. [DOI] [PMC free article] [PubMed] [Google Scholar]
- 62.Paulsen O, Sejnowski TJ. Natural patterns of activity and long-term synaptic plasticity. Curr Opin Neurobiol. 2000;10:172–179. doi: 10.1016/s0959-4388(00)00076-3. [DOI] [PMC free article] [PubMed] [Google Scholar]
- 63.Peng YY, Frank E. Activation of GABAA receptors causes presynaptic and postsynaptic inhibition at synapses between muscle spindle afferents and motoneurons in the spinal cord of bullfrogs. J Neurosci. 1989;9:1516–1522. doi: 10.1523/JNEUROSCI.09-05-01516.1989. [DOI] [PMC free article] [PubMed] [Google Scholar]
- 64.Polley DB, Chen-Bee CH, Frostig RD. Two directions of plasticity in the sensory-deprived adult cortex. Neuron. 1999;24:623–637. doi: 10.1016/s0896-6273(00)81117-4. [DOI] [PubMed] [Google Scholar]
- 65.Rittenhouse CD, Shouval HZ, Paradiso MA, Bear MF. Monocular deprivation induces homosynaptic long-term depression in visual cortex. Nature. 1999;397:347–350. doi: 10.1038/16922. [DOI] [PubMed] [Google Scholar]
- 66.Shadlen MN, Newsome WT. The variable discharge of cortical neurons: implications for connectivity, computation, and information coding. J Neurosci. 1998;18:3870–3896. doi: 10.1523/JNEUROSCI.18-10-03870.1998. [DOI] [PMC free article] [PubMed] [Google Scholar]
- 67.Smith MA, Ashford ML. Inactivation of large-conductance, calcium-activated potassium channels in rat cortical neurons. Neuroscience. 2000;95:33–50. doi: 10.1016/s0306-4522(99)00425-x. [DOI] [PubMed] [Google Scholar]
- 68.Softky WR, Koch C. The highly irregular firing of cortical cells is inconsistent with temporal integration of random EPSPs. J Neurosci. 1993;13:334–350. doi: 10.1523/JNEUROSCI.13-01-00334.1993. [DOI] [PMC free article] [PubMed] [Google Scholar]
- 69.Staubli U, Scafidi J. Studies on long-term depression in area CA1 of the anesthetized and freely moving rat. J Neurosci. 1997;17:4820–4828. doi: 10.1523/JNEUROSCI.17-12-04820.1997. [DOI] [PMC free article] [PubMed] [Google Scholar]
- 70.Stevens CF, Zador AM. Input synchrony and the irregular firing of cortical neurons. Nat Neurosci. 1998;1:210–217. doi: 10.1038/659. [DOI] [PubMed] [Google Scholar]
- 71.Thiels E, Barrionuevo G, Berger TW. Excitatory stimulation during postsynaptic inhibition induces long-term depression in hippocampus in vivo. J Neurophysiol. 1994;72:3009–3016. doi: 10.1152/jn.1994.72.6.3009. [DOI] [PubMed] [Google Scholar]
- 72.Tsodyks MV, Markram H. The neural code between neocortical pyramidal neurons depends on neurotransmitter release probability. Proc Natl Acad Sci USA. 1997;94:719–723. doi: 10.1073/pnas.94.2.719. [DOI] [PMC free article] [PubMed] [Google Scholar]
- 73.Tsumoto T. Long-term potentiation and long-term depression in the neocortex. Prog Neurobiol. 1992;39:209–228. doi: 10.1016/0301-0082(92)90011-3. [DOI] [PubMed] [Google Scholar]
- 74.Tsumoto T. Long-term depression in cerebral cortex: a possible substrate of “forgetting” that should not be forgotten. Neurosci Res. 1993;16:263–270. doi: 10.1016/0168-0102(93)90036-p. [DOI] [PubMed] [Google Scholar]
- 75.Turner DA. Feed-forward inhibitory potentials and excitatory interactions in guinea-pig hippocampal pyramidal cells. J Physiol (Lond) 1990;422:333–350. doi: 10.1113/jphysiol.1990.sp017987. [DOI] [PMC free article] [PubMed] [Google Scholar]
- 76.Turner DA, Wheal HV. Excitatory synaptic potentials in kainic acid-denervated rat CA1 pyramidal neurons. J Neurosci. 1991;11:2786–2794. doi: 10.1523/JNEUROSCI.11-09-02786.1991. [DOI] [PMC free article] [PubMed] [Google Scholar]
- 77.Varela JA, Sen K, Gibson J, Fost J, Abbott LF, Nelson SB. A quantitative description of short-term plasticity at excitatory synapses in layer 2/3 of rat primary visual cortex. J Neurosci. 1997;17:7926–7940. doi: 10.1523/JNEUROSCI.17-20-07926.1997. [DOI] [PMC free article] [PubMed] [Google Scholar]
- 78.Varela JA, Song S, Turrigiano GG, Nelson SB. Differential depression at excitatory and inhibitory synapses in visual cortex. J Neurosci. 1999;19:4293–4304. doi: 10.1523/JNEUROSCI.19-11-04293.1999. [DOI] [PMC free article] [PubMed] [Google Scholar]
- 79.Wagner JJ, Alger BE. GABAergic and development influences on homosynaptic LTD and depotentiation in rat hippocampus. J Neurosci. 1995;15:1577–1586. doi: 10.1523/JNEUROSCI.15-02-01577.1995. [DOI] [PMC free article] [PubMed] [Google Scholar]
- 80.Yang S, Tang Y, Zucker RS. Selective induction of LTP and LTD by postsynaptic [Ca2+]i elevation. J Neurophysiol. 1999;81:781–787. doi: 10.1152/jn.1999.81.2.781. [DOI] [PubMed] [Google Scholar]
- 81.Yasuda H, Tsumoto T. Long-term depression in rat visual cortex is associated with a lower rise of postsynaptic calcium than long-term potentiation. Neurosci Res. 1996;24:265–274. doi: 10.1016/0168-0102(95)01001-7. [DOI] [PubMed] [Google Scholar]