

Abstract
We investigated how the light-evoked input and output signals of salamander retinal ganglion cells adapt to changes in temporal contrast, i.e., changes in the depth of the temporal fluctuations in the light intensity about the mean. Increasing the temporal contrast sped the kinetics and reduced the sensitivity of both the light-evoked input currents measured at the ganglion cell soma and the output spike trains of the cell. The decline in sensitivity of the input currents after an increase in contrast had two distinct kinetic components with fast (<2 sec) and slow (>10 sec) time constants. The recovery of sensitivity after a decrease in contrast was dominated by a single component with an intermediate (4–18 sec) time constant. Contrast adaptation differed for on and offcells, with both the kinetics and amplitude of the light-evoked currents of off cells adapting more strongly than those ofon cells. Contrast adaptation in the input currents of a ganglion cell, however, was unable to account for the extent of adaptation in the output spike trains of the cell, indicating that mechanisms intrinsic to the ganglion cell contributed. Indeed, when fluctuating currents were injected into a ganglion cell, the sensitivity of spike generation decreased with increased current variance. Pharmacological experiments indicated that adaptation of spike generation to the current variance was attributable to properties of tetrodotoxin-sensitive Na+ channels.
Keywords: contrast gain control, contrast adaptation, retinal ganglion cell, adaptation, temporal contrast, retinal signal processing, nonlinear, contrast response
A striking property of the visual system is its ability to operate over an enormous range of lighting conditions. This flexibility relies on adaptation mechanisms that permit vision to maintain sensitivity as the light inputs change. The best appreciated of these is adaptation to the mean light intensity, although the visual system also adapts to the spatial and temporal contrast (Blakemore and Campbell, 1969; Schieting and Spillmann, 1987). We focus here on temporal contrast adaptation: adaptation to the depth of temporal fluctuations in light intensity about the mean.
Temporal contrast adaptation helps match the range of input signals that a cell encounters to the range of its outputs. An important source of temporal contrast under natural conditions is spatial structure in a visual scene coupled to eye movements. Local eye movements cause cells with receptive fields that fall in regions of a scene with little spatial structure to encounter low temporal contrast and cells with receptive fields that fall in regions with high spatial structure to encounter high temporal contrast. By matching their sensitivity to the fluctuations in their inputs, visual neurons can efficiently encode signals with widely varying temporal structure.
A fast-onset form of temporal contrast adaptation, often called contrast gain control (Victor, 1987), can directly influence the computations that visual neurons perform by shaping their response time course. One result is to decrease the response latency of retinal ganglion cells to moving objects (Berry et al., 1999). This computational role requires that contrast adaptation act on a time scale comparable to the integration time of the cell.
Adaptation to the mean and contrast begin in the retina, although contrast adaptation has a strong cortical component (Albrecht et al., 1984; Ohzawa et al., 1985). Adaptation to the mean includes contributions from the photoreceptors (for review, see Koutalos and Yau, 1996) and post-receptoral mechanisms in the retina (for review, see Walraven et al., 1990). Adaptation to temporal contrast is purely a post-receptor phenomenon (Sakai et al., 1995;Smirnakis et al., 1997). Temporal contrast adaptation in the retina has components that differ in their onset and recovery kinetics and in their spatial properties (for review, seeShapley, 1997; Meister and Berry, 1999); this diversity of functional properties suggests a corresponding diversity in the underlying biophysical mechanisms.
Although it is clear that temporal contrast adaptation plays an important role in visual function and that the retina provides the first step in this process, little is known about the retinal locations of contrast adaptation or the mechanisms responsible. We have investigated the effects of temporal contrast on the inputs and outputs of salamander retinal ganglion cells and found that (1) contrast adaptation included contributions from mechanisms acting on the currents reaching the ganglion cell soma and mechanisms intrinsic to spike generation in the ganglion cell; (2) the off pathway adapted to changes in contrast more strongly than the onpathway; and (3) the different sites of contrast adaptation had distinct temporal properties.
Some of this work has been published previously in abstract form (Kim and Rieke, 2000).
MATERIALS AND METHODS
Experimental procedures
Dissection. All experiments used retinae from larval tiger salamanders (Ambystoma tigrinum; Charles Sullivan, Nashville, TN) measuring 10–25 cm in length and maintained at 5°C on a 12 hour light/dark cycle. Animal procedures followed protocols approved by the administrative panel on laboratory animal care at the University of Washington. Experiments were at 20–22°C.
Light-evoked current and voltage responses of retinal ganglion cells were measured in a flat-mount preparation. After 12–15 h of dark adaptation, salamanders were rapidly decapitated and pithed, and the eyes were removed. These initial steps in the dissection were performed under infrared light (>850 nm) using night-vision goggles (ITT Night Vision, Roanoke, VA). The remaining steps were performed under a dissecting microscope equipped with an infrared light source and infrared-visible image converters (BE Meyers, Redmond, WA). Each eye was hemisected and placed in bicarbonate Ringer's solution containing (in mm): 110 NaCl, 2 KCl, 30 NaHCO3, 1.5 CaCl2, 1.6 MgCl2, 10 glucose; pH was 7.4 when equilibrated with 5% CO2/95% O2 and osmolarity was 270–275 mOsm. The lens was removed with tweezers, and the retina was gently peeled away from the pigment epithelium. A piece of retina ∼1 mm in diameter was placed photoreceptor side down in a recording chamber and held in place with a coarse nylon mesh glued to a platinum weighting ring. The chamber was placed on the stage of an upright microscope equipped with an infrared viewing system. The retina was continuously superfused with bicarbonate Ringer's solution at a rate of 1–2 ml/min.
The basement membrane often prevented access to the ganglion cells in the flat-mount preparation. In some cases, pieces of the basement membrane were removed along with the lens during the dissection; in other preparations we cut a small hole in the basement membrane using a large suction electrode to hold the membrane and a sharp quartz microelectrode to tear a hole in it. The area around the hole was cleaned of debris by suction to expose the cell bodies of 5–10 cells. This procedure provided access to cells in the ganglion cell layer without excessively stretching the retina. Immunocytochemistry studies indicate that ∼10% of the cells in the ganglion cell layer are displaced amacrine cells (Watt et al., 1988). Preliminary experiments indicate that the properties of contrast adaptation in amacrine cells are similar to those of ganglion cells. Hence we refer to all cells that were recorded from as ganglion cells.
For experiments on solitary cells, the retina was isolated in room light, treated with papain (7–14 U/ml; Worthington) for 20 min and dissociated (Rieke and Schwartz, 1996). Dissociated cells were plated onto glass coverslips pretreated with concanavalin-A. Cells were stored at 4°C for up to 6 h. During recording, the cells were continuously superfused with a HEPES Ringer's solution containing (in mm): 136 NaCl, 2 KCl, 1.5 CaCl2, 10 glucose, 2 NaHCO3, 1.6 MgCl2, 3 HEPES; pH was adjusted to 7.4 with NaOH and osmolarity was 270–275 mOsm. In some experiments, 10–20 mm NaCl was replaced with either N -methylglucamine (NMG) chloride or pharmacological agents; this allowed us to keep the Na+ concentration constant while suppressing K+ currents. Pharmacological agents were applied by bath superfusion. Isolated ganglion and amacrine cells were distinguished from other cell types by their ability to generate Na+ spikes and the presence of multiple processes extending from their somata. Data were collected only from cells that were able to generate repetitive action potentials with a width of <2 msec and an amplitude of at least 40 mV. The electrical properties of all isolated cells meeting these criteria were similar, and we did not attempt to distinguish between them.
Light stimuli. Light from three light-emitting diodes (LEDs) with peak outputs at 470, 570, and 640 nm were combined using a trifurcated fiber optic and focused on the photoreceptors through the bottom of the recording chamber. The light stimulus was spatially uniform and illuminated a circular area 1.3 mm in diameter centered on the cell that was recorded from. During an experiment, each of the LEDs produced a photon flux at the retina of 1000–3000 photons per μm2 per sec. The temporal contrast of the light stimulus was controlled by adding Gaussian fluctuations (bandwidth 0–30 Hz) to the signal controlling the light output of each LED.
Salamanders have five photoreceptor types: ultraviolet, short-wavelength (S)- and long-wavelength (L)-sensitive cones, and short-wavelength- and long-wavelength-sensitive rods. We used light stimuli that favored the responses of L cones over the other photoreceptor types. The ultraviolet-sensitive cones account for only ∼2% of the cone population (Sherry et al., 1998) and are insensitive to light of wavelength >450 nm. The short-wavelength-sensitive rods account for ∼7% of the rod population (Sherry et al., 1998), and their sensitivity should have been significantly reduced by the high mean light levels used in our experiments. Finally, the three LEDs were modulated coherently with relative amplitudes chosen so that the photon absorption rates in the L cones varied, whereas the absorption rates in the short-wave-sensitive cones and long-wavelength-sensitive rods remained constant. We refer to this as an L-cone isolating stimulus.
The temporal contrast, c, of the light stimulus was defined as the SD of the photoisomerization rate in the L cones, ςL, divided by the mean rate, mL:
| Equation 1 |
ςL and mL were calculated from the published spectral sensitivity of salamander L cones (Makino and Dodd, 1996) and measured spectra of the light reaching the retina from the three LEDs. Unless stated otherwise, repetitions of stimuli with the same temporal contrast used different instantiations of the Gaussian fluctuations and thus were uncorrelated. Light intensities used in each experiment are given in the Figure legends in terms of effective photon flux at the wavelength of peak sensitivity of the L cone.
Patch recording procedure. Voltage and current responses of ganglion cells were measured using perforated-patch recordings (Rae et al., 1991) and an Axopatch 200B patch-clamp amplifier (Axon Instruments, Foster City, CA). Patch pipettes were pulled from borosilicate glass and fire-polished before use. The pipette tip was filled with an internal solution containing (in mm): 115 K-aspartate, 20 KCl, 10 HEPES, 1 NMG–EGTA, 0.2 CaCl2; pH was adjusted to 7.2 with NMG-OH and osmolarity was 260–265 mOsm. In some experiments we replaced 10 mm KCl with K-aspartate; lowering the Cl− concentration did not have a noticeable effect on contrast adaptation. Pipettes were back-filled with internal solution with an added 1 mg/ml amphotericin-B (solubilized formulation; Sigma, St. Louis, MO). Filled pipettes had resistances of 3–6 MΩ, and the series resistance during recording was 10–20 MΩ. Ganglion cells in the intact retina had input resistances between 0.3 and 0.7 GΩ and capacitances between 60 and 90 pF. Solitary spiking cells had resistances between 2.5 and 5 GΩ and capacitances between 15 and 25 pF.
We recorded in both current-clamp and voltage-clamp modes. For voltage-clamp recordings the cell was held at −50 to −60 mV, resulting in a mean current between −40 and 0 pA. We refer to light-evoked currents measured under voltage clamp at the ganglion cell soma as “input currents.” The input currents reflect synaptic currents with possible shaping by processes in the ganglion cell dendrites. Because salamander ganglion cells are thought to be electrotonically compact for light-driven excitatory input (Taylor et al., 1996), the measured input currents should closely resemble the synaptic currents. In current-clamp recordings, the holding current was set between 0 and 40 pA so that the cell produced action potentials at a rate of 1–2 Hz. Under these conditions the mean potential was approximately −50 mV. Junction potentials for all the solutions used were <5 mV and were not corrected.
Data analysis
In this section we present a model that describes the transformation between a continuous input signal and the resulting current or spike response of a ganglion cell. The parameters of the model were determined by correlating the stimulus with the measured response; these parameters provided a measure of the amplitude and kinetics of the response of a cell to the stimulus. Comparison of the parameters measured for two different stimuli, e.g., light stimuli of different contrasts, allowed us to characterize how retinal ganglion cells adapted to these stimuli. We used this model in two ways: (1) to quantify the effect of temporal contrast on the light-evoked currents and spike trains of a ganglion cell and (2) to quantify the effect of the variance of current injected into a ganglion cell on the sensitivity of spike generation. We describe the method in detail below for adaptation to the contrast of the light input.
Static nonlinearity model. We modeled the dependence of the response of the cell to a light stimulus using a linear filter followed by a time-independent or static nonlinearity (Fig.1A). This was the simplest model that captured most of the structure in the light responses of ganglion cells, such as strong rectification of the voltage-clamp currents (Fig. 1D). A key property of the static nonlinearity model is that it permitted separation of an instantaneous nonlinearity in the light response of the cell from a change in sensitivity produced by contrast adaptation (Sakai et al., 1995; Chander and Chichilnisky, 1999). The response of the cell to a continuously varying light input s(t) was predicted by passing s(t) through a linear filter f(τ) and passing the output of the filter through a static nonlinearity g:
| Equation 2 |
where rpred(t) is the predicted response (the time-dependent current in voltage clamp or spiking probability in current clamp). The linear filter f(τ) provides an estimate of the time course of the response of the cell to a brief light flash in the presence of the contrast signal. The static nonlinearity g corrects the output of the filter for the nonlinear relation between the strength of the light input and the response of the cell. Together f(τ) and g provide a description of the steady-state response of the cell to light inputs of a particular contrast; comparison of these parameters for lights of different contrasts provides a measure of how the response of the cell adapts to changes in contrast. Note that Equation 2 describes the steady-state relationship between the light input and the response of the cell and does not describe the dynamics of the onset or recovery from contrast adaptation.
Fig. 1.

Static nonlinearity model. A, Schematic of model. The static nonlinearity model predicts the transformation between light intensity and ganglion cell response by first linearly filtering the light intensity and then passing the filter output through a static nonlinearity. This model was used to analyze the transformation from light stimulus to input currents in a ganglion cell (light-to-current). B, Linear filter (light-to-current) for a voltage-clamped off ganglion cell. The filter was calculated from Equation 3 from six 40 sec epochs during an 8% contrast light stimulus. The first 20 sec of each epoch were discarded from the calculation. C, Static nonlinearity corresponding to filter in B. Each of the dots represents a single comparison of the measured response and the linear prediction created by convolving the light input with the filter in B. The open circles plot the average of 120 adjacent points on the x -axis. Error bars (SEM) are obscured by the markers. D, Section of measured and predicted response to an 8% contrast light stimulus. The thin trace plots the average current response to 20 repetitions of the same random contrast signal. The thick trace is the predicted response from the static nonlinearity model using the linear filter and static nonlinearity shown in B and C. The responses used to generate the thin trace were not used in the calculation of the linear filter and static nonlinearity to guard against overfitting. Mean light intensity: 4300 photoisomerizations/sec per L cone; holding potential: −60 mV.
The linear filter and static nonlinearity were calculated from the current or spike response of a cell to several minutes of stimulation at each contrast. Stimuli of different contrasts were interleaved to prevent mistaking changes in sensitivity over the course of an experiment for adaptation. The retina does not adapt instantaneously to contrast changes (see Results and Fig. 5); thus measurements made in the first 20 sec after a contrast change were discarded to permit contrast adaptation to approach steady state.
Fig. 5.

Time course of onset and offset of contrast adaptation. A, Recovery of the sensitivity of anon/off ganglion cell after an adapting contrast signal. A 21% contrast stimulus was presented for 10 sec. At time 0, modulation of the light ceased, whereas the mean light intensity remained constant. After a variable delay, a 15% L cone-isolating light decrement lasting 400 msec was delivered (see timing trace). Average responses to this stimulus for each delay are superimposed, with the response to the light decrement in the absence of the adapting contrast signal at the far right. Mean light intensity: 2600 photoisomerizations/sec per L cone; holding potential: −60 mV. B, Onset and recovery of contrast adaptation for continuous stimuli. The contrast of the light input was switched between 8 and 21% every 20 sec. The time-dependent RMS current response from 14 statistically independent stimuli of this type is plotted; the RMS current provided a measure of the change in the amplitude of the response of the cell after a change in contrast (see Results). RMS values at each time point were calculated across the 14 stimulus repeats, and the resulting trace was smoothed with a sliding 200 msec time window. At time 0, the contrast increased from 8 to 21%. After an initial increase, the RMS current gradually declined during the subsequent 20 sec. The smooth curve fit to the decline in RMS current after the increase in contrast is a sum of two exponentials with time constants of 0.6 and 11 sec. At 20 sec the contrast decreased from 21 to 8% and the RMS current steadily increased. The smooth curve fit to the increase in RMS current after the decrease in contrast is a single exponential with a time constant of 4 sec. Mean light intensity: 2900 photoisomerizations/sec per L cone; holding potential: −55 mV.
Figure 1, B and C, shows the linear filter and static nonlinearity from a voltage-clamped off ganglion cell during an 8% contrast light stimulus. The shape of the linear filter f(τ) was determined by calculating the best linear predictor of the response of the cell given the light stimulus (Wiener, 1949). The linear predictor that minimizes the mean-square error between the measured and predicted response for a given contrast c is the cross-correlation between the light stimulus and the response divided by the power spectrum of the stimulus:
| Equation 3 |
where the brackets 〈⋯〉 indicate an average over multiple stimuli s from the ensemble described by the power spectrum S(ω), ∗ denotes the complex conjugate,s̃(ω) is the Fourier transform of the light stimulus, and r̃(ω) is the Fourier transform of the measured response r(t), defined as r̃(ω) = ∫ dt exp (iωt)r(t). The response r(t) is the measured current for voltage-clamp experiments or a series of impulses occurring at the spike times for current-clamp experiments. For some current-clamp experiments, a fluctuating injected current replaced the light stimulus but the analysis was otherwise identical. Filters calculated from Equation 3 were restricted to a bandwidth of 0–30 Hz to match the bandwidth of the light stimuli, unless noted otherwise.
After calculating the linear filter, the static nonlinearity g was determined by comparing each independent time point of the measured response with the corresponding time point in the linear prediction obtained by convolving f(τ) with the light stimulus (Eq. 2). Each small dot in Figure 1C represents one such comparison, where the y -axis plots the measured response and the x -axis the corresponding linear prediction. If the response of the cell were linearly related to the light stimulus, the points in Figure 1C would be scattered about a straight line and the extent of scatter would provide a measure of the noise in the response of the cell. Instead the points clearly deviate from linearity. To estimate the shape of the nonlinearity, adjacent points on the x -axis were averaged and plotted as the open circles in Figure 1C.
The most significant nonlinearity in the input currents of a ganglion cell was the rectification of positive currents (Fig. 1D); on average the measured outward currents were much smaller than the linear prediction. Inward currents were strongly correlated with the prediction and showed no evidence of saturation, which would cause the curve to flatten for large negative values of the prediction. The polarity of the linear filter and shape of the static nonlinearity indicate that this is an off cell. Light decrements lead to the prediction of inward (excitatory) currents that are not attenuated by the static nonlinearity. Light increments lead to the prediction of outward currents that are significantly attenuated.
Figure 1D compares the measured current response with the prediction calculated from Equation 2 and the linear filter and static nonlinearity shown in Figure 1, B and C. The measured response is for a section of the experiment that was not used in calculating the filter or nonlinearity. Noise in the measured response was reduced by averaging >20 repetitions of an identical light stimulus. The prediction captured most of the structure in the measured response, although the correspondence is clearly not exact. The correlation coefficient between the measured and predicted currents is 66%. In three such experiments the correlation coefficient between predicted and measured responses ranged from 57 to 66%. These correlation coefficients are underestimates by at least 15% because of noise that remained after averaging across repetitions of the light stimulus.
The average correlation coefficient between the predicted and measured response to a single repetition of the contrast signal was within 6% of the correlation coefficient between measured responses to different repetitions of the contrast signal (three cells, each at two contrasts). Thus the difference between the predicted and measured response was similar to the difference between independent responses to the same stimulus. The correlation between predicted and measured responses did not improve significantly when the linear filter in Equation 2 was replaced with a second-order Wiener series (Wiener, 1949; Marmarelis and Marmarelis, 1978). Thus the static nonlinearity model captured most of the structure in the light-evoked currents of the cell, and more complicated models did not offer substantial improvements.
We also used the static nonlinearity model to study the ganglion cell responses in current-clamp experiments (Fig.2A). In some of these experiments, we injected current into a ganglion cell to bypass the retinal circuitry and study spike generation in the ganglion cell directly. Figure 2B and C, shows the linear filter and static nonlinearity for one such experiment. The filter was calculated according to Equation 3; it predicts the time course of the change in firing rate in response to a brief injected current pulse in the presence of a fluctuating injected current. The static nonlinearity was determined by convolving the filter with the injected current to generate a linear prediction of the firing rate and comparing this prediction with the measured spike train on a point-by-point basis as in Figure 1C. The shape of the static nonlinearity reflects the low resting firing rate of the cell and rapid increase in rate as the cell was depolarized.
Fig. 2.

Spike generation in static nonlinearity model. A, Schematic of transformation of light input to the spike output of a ganglion cell. We compared two models to predict the light-to-current transformation. The first (top path) was a cascade of two static nonlinearity models describing the light-to-current and current-to-spikes transformations. The second was a single static nonlinearity model (bottom path). Linear filter (B) and static nonlinearity (C) describing the transformation of injected currents into spike outputs for a current-clamped off ganglion cell. The injected current was Gaussian with a variance of 225 pA2. The filter and nonlinearity were calculated from two 120 sec epochs; the first 20 sec of each epoch were discarded. Linear filter (D) and static nonlinearity (E) describing the transformation of light inputs into the spike output of a ganglion cell from the same off cell. The filter and static nonlinearity were calculated from current-clamp responses to five 40 sec epochs of 8% contrast light stimulus. Mean light intensity: 4300 photoisomerizations/sec per L cone; holding current: 40 pA.
A complete description of the conversion of light inputs into the spike output of a ganglion cell should include the linear filters and static nonlinearities for both the light-to-current and current-to-spikes transformations (Fig. 2A). This somewhat complex model could be simplified, however, because the kinetics of the filter describing the conversion of injected current-to-spike outputs was brief compared with that describing the conversion of light inputs to currents (Figs.1B, 2B). In this case the current-to-spikes linear filter can be replaced with a scalar, and the two nonlinearities can be combined. Thus the conversion of light inputs to ganglion cell spike trains could be approximated by a linear filter followed by a static nonlinearity (Fig. 2A). This intuition was confirmed by comparing predictions generated by the top and bottom cascades of Figure 2A with the measured light-driven spike train. Correlations of predictions of either cascade with the measured spike response were similar to the correlation between independent spike responses to a repeated light stimulus. Thus we conclude that the two cascades in Figure 2A are effectively equivalent.
Figure 2, D and E, show the linear filter and static nonlinearity for 8% contrast light inputs for a current-clampedoff cell (bottom cascade of Fig. 2A). The linear filter describes the time course of the change in firing rate in response to a brief light flash at time 0 in the presence of the contrast signal. The shape of the static nonlinearity again reflects the low resting firing rate of the cell and rapid increase in rate for depolarizing light inputs.
Contrast adaptation in static nonlinearity model. We used the static nonlinearity model to study contrast adaptation by comparing the linear filters and static nonlinearities measured for light stimuli at two or more contrasts (Fig.3A,B). The model allowed us to measure the effect of contrast on the kinetics and amplitude of the light response of a cell. The shape of the static nonlinearity was contrast independent in the majority of cells except for a scaling of the x -axis. This is not required by the model, which permits the static nonlinearities to have arbitrary shapes at different contrasts; the contrast invariance of the static nonlinearity, however, greatly simplified our analysis.
Fig. 3.

Use of static nonlinearity model to study contrast adaptation. Light-evoked currents were recorded from anon/off ganglion cell during interleaved 8 and 24% contrast inputs. A, Linear filters calculated from Equation 3. B, Static nonlinearities calculated as in Figure1C. The smooth curve fit to the low-contrast static nonlinearity is a best fit quintic polynomial. The x -axis scaling of this curve was varied to fit the high-contrast static nonlinearity. C, Scaled linear filters. The filter at low contrast has been multiplied by 1.3, a factor chosen to produce the best overlap of the static nonlinearities from B. D, Scaled static nonlinearities. The x -axis of the low-contrast static nonlinearity has been expanded by a factor of 1.3, corresponding to the scaling of the linear filters in C. Mean light intensity: 8500 photoisomerizations/sec per L cone; holding potential: −60 mV.
Changes in the kinetics of the response of the cell with changes in contrast influenced only the linear filter because the static nonlinearity is time independent. Kinetic changes attributable to contrast adaptation were taken as the ratio of the time-to-peak of the linear filters for the two contrasts.
Changes in the amplitude of the response of the cell with changes in contrast were taken as the ratio of the maximum amplitudes of the linear filters for the two contrasts after the filters were corrected for the static nonlinearity. Contrast-dependent changes in the amplitude of the response of the cell are potentially shared between the linear filter and the static nonlinearity. However, the shape of the static nonlinearity in the majority of cells (28 of 32) was contrast independent except for a scaling of the x -axis (Fig. 3D), permitting the effect of contrast to be restricted to changes in the linear filter. A change in the amplitude of the linear filter corresponds to a change in the x -axis scaling of the static nonlinearity. Thus the output of the static nonlinearity model (Eq. 2) is unchanged if the linear filter and the x -axis scaling of the static nonlinearity are both multiplied by a factor α (Fig. 3A,B, arrows). By finding a scale factor α that produced an overlap of the static nonlinearities, contrast adaptation was restricted to changes in the linear filter (Fig. 3C,D). Cells for which the static nonlinearities could not be made to overlap (4 of 32) by this procedure were not analyzed further.
To determine the x -axis scaling producing the best overlap of the static nonlinearities at two contrasts, a cubic or quintic polynomial was fit to the static nonlinearity measured at low contrast (Fig. 3B). The x -axis scaling of this curve was varied to provide the best fit (minimum mean-square error) to the high contrast static nonlinearity (Fig. 3D), and the linear filter measured at low contrast was multiplied by this scale factor (Fig. 3C). This fitting procedure assumes that the low and high contrast static nonlinearities have the same general shape except for a scaling of the x -axis. Consistent with this assumption, fitting the high-contrast static nonlinearity with a free cubic or quintic polynomial rather than a scaled version of the fit to the low-contrast static nonlinearity decreased the mean-square error between fit and data by <3%. The error in determining the x -axis scaling producing the best overlap of the static nonlinearities and thus the relative amplitudes of the filters was estimated from the error bars on each point in the static nonlinearities (Fig. 1C). The errors for the relative filter amplitudes determined from this procedure were <10% in all of the cells reported.
RESULTS
The experiments described below indicate that temporal contrast adaptation in the retina is mediated in part by mechanisms acting on the currents reaching the ganglion cell soma (the input currents) and in part by changes in how the ganglion cell converts its input currents to action potentials. We begin by describing the properties of contrast adaptation in the input currents to a ganglion cell and then discuss how changes in contrast alter spike generation.
Contrast adaptation in the ganglion cell input currents
Contrast adaptation caused the response of a ganglion cell to a test stimulus to depend on the temporal contrast present when the test stimulus was delivered. Figure 4 shows an example. An on/off ganglion cell was voltage-clamped, and the current–response to a 50 msec light decrement superimposed on a fluctuating light stimulus of 8 or 24% contrast was measured. Figure 4A shows the light stimulus itself; Figure4B shows the average response to the light decrement delivered during high and low contrast. The response to the decrement delivered during the low contrast stimulus was larger and took longer to reach peak than the response to an identical decrement delivered during the high-contrast stimulus. Similar contrast-dependent changes in the response to a test stimulus were observed in three cells. Thus temporal contrast affected the amplitude and kinetics of the input currents of the ganglion cells.
Fig. 4.
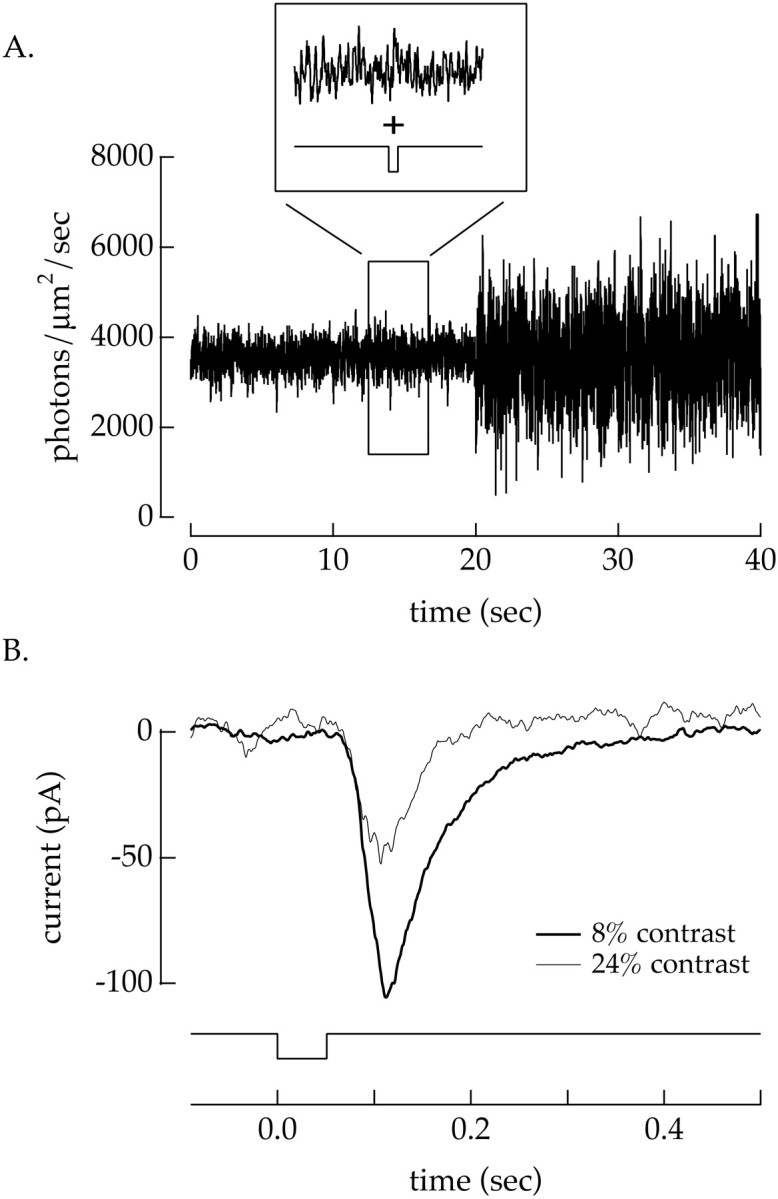
Temporal contrast affects the amplitude and kinetics of the input currents to a ganglion cell. A, Light stimulus used to test the effect of contrast on the flash response of the cell. The contrast was alternated between 8 and 24% every 20 sec. Every 2 sec a 20% L cone-isolating light decrement lasting 50 msec was superimposed on this alternating contrast signal (inset). B, Average current responses to the light decrement in the presence of 8% contrast and 24% contrast for an offganglion cell. The averages of >20 responses all measured >10 sec after a change in contrast. Increasing the temporal contrast from 8 to 24% decreased the amplitude and sped the kinetics of the current response of the ganglion cell. Mean light intensity: 3560 photoisomerizations/sec per L cone; holding potential: −60 mV.
Time course of onset and recovery of contrast adaptation
The effect of temporal contrast on the light-evoked input currents of a ganglion cell persisted for several seconds after the light fluctuations ceased. To measure the recovery of sensitivity after a period of high contrast, we varied the time between the end of an adapting contrast signal and a test light step (see stimulus trace in Fig. 5A). Figure 5A superimposes responses to a light decrement from anon/off ganglion cell for several recovery times; the decrement response in the absence of the adapting contrast signal is shown on the far right. The response measured shortly after the contrast signal ended was approximately half as large as that without the adapting signal. The response of the cell recovered to its unadapted value over the course of several seconds after the end of the contrast signal; this recovery of sensitivity was essentially complete after 2–3 sec. A similar dependence of the light response on the past history of the contrast signal was observed in three other experiments.
The time courses of the onset and offset of contrast adaptation were measured more quantitatively using the response of the cell to the fluctuating contrast signal itself. The light stimulus alternated between 8 and 21% contrast every 20 sec while the input currents to a ganglion cell were recorded. To determine the time course of the contrast-induced changes in sensitivity, we measured the time-dependent root-mean-square (RMS) amplitude of the input currents. The RMS current included contributions from light-evoked responses and cellular fluctuations within the retina. Thus the time course of the RMS current after a change in contrast reflected contrast-induced changes in the sensitivity of the input currents of a ganglion cell to both light signals and cellular noise.
Figure 5B shows the time course of the RMS current for anon/off ganglion cell. When the contrast changed from 8 to 21% (at time 0), the RMS current was initially large but declined over time as the sensitivity of the cell decreased. Similarly, when the contrast changed from 21 to 8% (at 20 sec), the RMS current was initially small but gradually increased as the sensitivity of the cell recovered from the high-contrast period. The onset and offset of contrast adaptation had different time courses, as shown by the smooth exponential fits to the experimental trace. The change in RMS current after the increase in contrast was fit by a sum of two exponentials, one with a relatively fast time constant (0.6 sec in Fig.5B; range 0.5–2.6 sec in seven cells) and the other relatively slow (11 sec in Fig. 5B; >9.8 sec in seven cells). On average, the fast component had an amplitude 2.2 ± 0.6 times that of the slow component (mean ± SEM; seven cells) and thus made a larger contribution to the total contrast adaptation observed. The change in RMS current after the decrease in contrast at 20 sec was well approximated by a single exponential (time constant 4 sec in Fig. 5B; range 4–18 sec in eight cells). The contribution of at least two distinct temporal components to the onset of contrast adaptation suggests that it is mediated by multiple mechanisms, and the large difference in kinetics suggests distinct functional roles for these mechanisms (see Discussion).
Adaptation for continuous stimuli
Experiments like those in Figures 4 and 5 show that the input currents to a ganglion cell adapted to changes in contrast. To characterize more thoroughly the effect of contrast on the response of a cell, we investigated how continuously varying stimuli of different contrasts were encoded by the cell. Figure6A shows a section of the current recorded in response to stimuli of 8 and 21% contrast from anon/off ganglion cell. For each contrast the transformation from light input to ganglion cell current was characterized as a linear filter (Fig. 6B) followed by a static nonlinearity (Fig. 6C) (see Materials and Methods for details). The linear filter provides an estimate of the time course of the response of the cell to a light flash delivered at time 0 in the presence of the contrast signal. The static nonlinearity is an instantaneous amplitude correction acting on the output of the linear filter. This model allowed separation of an instantaneous nonlinearity in the response of the cell from contrast adaptation: i.e., a contrast-dependent change in how light inputs are transformed to neural responses (Sakai et al., 1985; Chander and Chichilnisky, 1999).
Fig. 6.
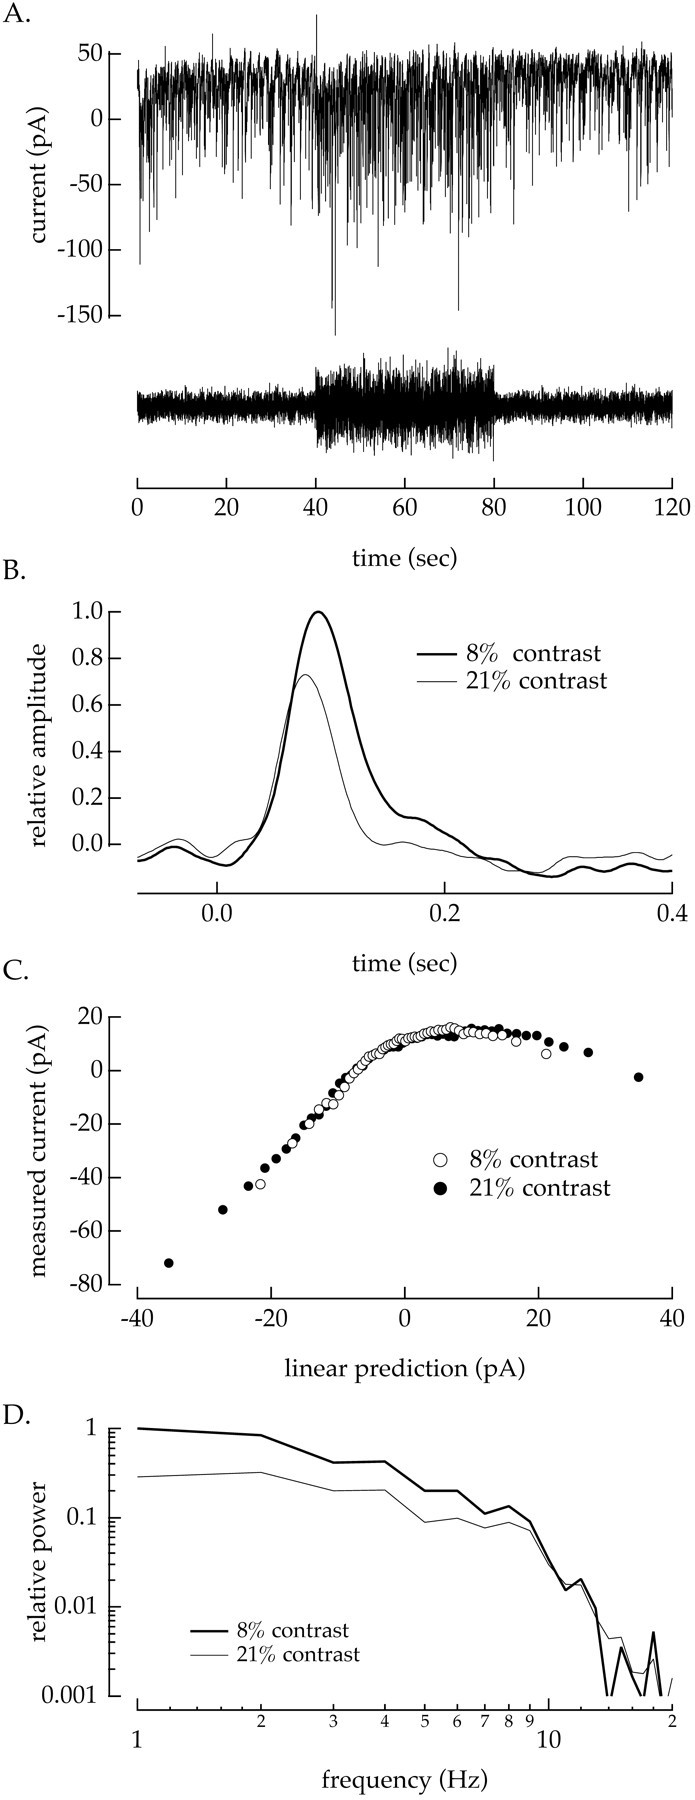
Contrast adaptation in static nonlinearity model. A, Section of current record from a voltage-clampedon/off ganglion cell in response to a light input that alternated between 8 and 21% contrast every 40 sec (seestimulus trace). B, Linear filters calculated from the response to 160 sec of record at 8% (thick trace) and 21% (thin trace) contrast. C, Static nonlinearities measured by correlating the measured input current with the linear prediction generated by convolving the filters in B with the light input at 21% (●) and 8% (○) contrast. Error bars (SEM; Fig.1) are obscured by the data points. The calculation of the linear filter and static nonlinearity used only the measurements made >20 after a contrast change to allow contrast adaptation to approach steady state. D, Normalized power spectra of the filters shown in B. Increasing the contrast reduced the power of the filter at low temporal frequencies but did not significantly change the high-frequency power. Mean light intensity: 2900 photoisomerizations/sec per L cone.
In the majority of the cells that we recorded from (28 of 32), the static nonlinearities measured at high and low contrast had similar shapes; Figure 6C shows an example. When the static nonlinearities overlapped, the effect of contrast was restricted to changes in the linear filter. Thus the transformation from light input to ganglion cell current could be described as a contrast-dependent linear filter followed by a contrast-independent static nonlinearity (Fig. 7). We did not attempt to characterize contrast adaptation in the four cells for which the shape of the static nonlinearity changed with contrast.
Fig. 7.

Effects of contrast in static nonlinearity model. The transformation of light input into the input current of a ganglion cell was described by a linear filter followed by a static nonlinearity. In 28 of 32 cells, the shape of the static nonlinearity was independent of the contrast of the light input, and hence the effect of contrast on the sensitivity was restricted to changes in the linear filter.
Figure 6B superimposes linear filters measured at 8 and 21% contrast, and Figure 6D shows power spectra of the filters at the two contrasts. The filter measured at high contrast had a smaller amplitude and faster kinetics than that at low contrast, similar to the effects seen for the decrement responses in Figure 4. These changes were primarily caused by a decrease in the amplitude of low temporal frequency components of the high-contrast filter (Fig.6D). The relative amplitudes of the low- and high-contrast filters at temporal frequencies >10 Hz were essentially identical. Similar results were seen in all 28 cells for which the static nonlinearities overlapped. Thus both the amplitude and kinetics of the input currents of a ganglion cell adapt to temporal contrast.
on and off pathways adapt differently to contrast
The strength of contrast adaptation in the spike outputs ofon and off salamander ganglion cells differs (Chander and Chichilnisky, 1999). We found similarly that the effect of contrast on the amplitude and kinetics of the input currents differed for different functional types of ganglion cells. Cells were identified as off,on/off, or on based on their response to a 1 sec light increment or decrement; examples are shown in Figures 8A–C (insets).off cells responded to an increase in light intensity with an outward (inhibitory) current and to a decrease in intensity with an inward current (Fig. 8A, inset). on cells responded with the opposite polarity (Fig. 8C, inset), and on/off cells responded to both increases and decreases in light intensity with inward currents (Fig. 8B,inset).
Fig. 8.

The strength of contrast adaptation in the ganglion cell input currents varies with ganglion cell type. A–C, Linear filters for an off (A),on/off (B), and on(C) ganglion cell. The thick traces plot the linear filters calculated for 8% contrast stimuli, and the thin traces plot those for 21% contrast. Cells were classified on the basis of their response to an L cone-isolating 1 sec light increment superimposed on the mean light intensity used to characterize contrast adaptation. Examples of responses to a 16% light increment are shown in the insets. D, Summary of changes in the peak amplitude of the filter at high contrast relative to that at low contrast for each cell type. E, Summary of changes in the time-to-peak at high contrast relative to that at low contrast. Increasing the contrast had a larger effect on the amplitude and time-to-peak of the input currents to off cells thanon cells, with on/off cells falling in between. Error bars are SEM.
We characterized contrast adaptation in each ganglion cell type using the static nonlinearity model as in Figure 6. The correlation between predictions of the model and the measured responses did not differ systematically among the cell types. Linear filters measured at 8 and 21% contrast for representative cells of each type are shown in Figure8A–C. In each case, increasing the contrast decreased the amplitude and the time-to-peak of the linear filter, but these changes were more pronounced in off cells than oncells, with on/off cells falling in between. Figure 8, D and E, summarizes the changes in amplitude and kinetics for each ganglion cell type. Although the extent of contrast adaptation varied significantly within a given ganglion cell type, the off cells showed larger changes in amplitude and kinetics than on cells. Thus the mechanisms controlling contrast adaptation in the input currents to ganglion cells differed in strength according to ganglion cell type. The difference in contrast adaptation in the input currents of on and offcells could originate from differences in either the on andoff circuitry before the ganglion cell or in the dendrites of the ganglion cells themselves.
Contrast adaptation in the ganglion cell spike output
As described below, contrast adaptation of the input currents of a ganglion cell was not sufficient to explain the extent of adaptation in the output spike trains of the cell, suggesting that intrinsic properties of the ganglion cell also contributed. By directly injecting fluctuating currents into a ganglion cell, we found that spike generation adapted to the current variance and thus contributed to contrast adaptation.
Spike trains adapt more strongly than input currents
To test for a contribution of intrinsic properties of the ganglion cell to contrast adaptation, we compared the extent of adaptation in the input currents of a ganglion cell with that in its output spike trains. If the ganglion cell itself adapts to contrast, we should see additional contrast adaptation in its spike output compared with its input currents. We first delivered 8 and 21% contrast light inputs under voltage clamp and computed the linear filters (Fig.9A) and static nonlinearities relating the light stimulus to the measured input currents. The static nonlinearities overlapped, and hence the effect of contrast on the sensitivity of the cell was restricted to changes in the linear filter. We then delivered the same contrast stimuli under current clamp and studied how the transformation of light inputs into the spike output of the ganglion cell depended on contrast. In principle, the light-to-spikes transformation should be described by two successive static nonlinearity models (Fig. 2A): one for the light-to-current transformation and another for the current-to-spikes transformation within the ganglion cell itself. However, because the kinetics of the current-to-spikes transformation was fast (Fig.9, compare time scale in A and C), this complex model could be simplified to a single linear filter and static nonlinearity (see Materials and Methods for a complete description). Figure 9B shows the linear filters relating the light stimulus to the spike output of the cell; the static nonlinearities again overlapped and hence did not contribute to contrast adaptation.
Fig. 9.

Changes in sensitivity of spike generation contributed to contrast adaptation. All measurements are from the same off ganglion cell. A, Linear filters describing the transformation of light intensity to ganglion cell input currents for 8% (thick trace) and 21% contrast (thin trace). Input currents were measured under voltage clamp. B, Linear filters describing the transformation of light intensity to output spikes for 8% (thick trace) and 21% contrast (thin trace). The peak amplitude of the filter at 21% contrast is 0.52 ± 0.01 times that at 8% contrast. Spike outputs were measured under current clamp. C, Linear filters describing the transformation of injected currents to spike outputs for Gaussian currents with variances of 225 pA2(thick trace) and 625 pA2 (thin trace). Current variances were chosen to match those of the input currents measured for 8 and 21% contrast light signals. The peak amplitude of the filter at 625 pA2 variance is 0.82 ± 0.01 times that at 225 pA2 variance. Bandwidth of injected current: 0–50 Hz. D, Predicted linear filters for 8 and 21% contrast. The filters and static nonlinearities describing adaptation in the input currents (A) and in spike generation (C) were used to predict contrast adaptation in the spike output. The amplitude of the predicted filter at 21% contrast was 0.55 ± 0.02 times that at 8% contrast, very similar to the measured effect of contrast shown in B. Holding potential in voltage clamp: −55 mV; holding current in current clamp: 40 pA. Mean light intensity: 4300 photoisomerizations/sec per L cone.
Comparison of the effect of contrast on the input currents of the cell (Fig. 9A) with that on its output spike trains (Fig.9B) indicated that the spike outputs adapted more strongly than the input currents. The contrast-dependent change in the time-to-peak of the filters for the input currents and spike outputs was similar, but the change in the amplitude was significantly greater for the spike output of the cell than for its input currents. In three experiments of this type, the changes in amplitude of the filters describing the light-to-spikes transformation were 2.2 ± 0.1, 1.28 ± 0.04, and 1.33 ± 0.03 times larger than the change for the light-to-current transformation. Thus contrast adaptation was significantly greater in the spike output of a cell than in its input currents. This result indicates that properties intrinsic to the ganglion cell contributed to contrast adaptation.
Spike generation adapts to the variance of the input current
The contribution of intrinsic properties of the ganglion cell to contrast adaptation shown in Figure 9 could result either from voltage-dependent processes in the dendrites that are altered when the cell is voltage-clamped or from changes in how the cell converts its input currents to action potentials. Two observations indicate that changes in the sensitivity of spike generation are responsible.
First, the currents at the cell soma would differ under current and voltage clamp if voltage-clamping the soma altered dendritic processing. The experiment of Figure10 tested for such a difference. We measured the response of a ganglion cell to a 10 msec light flash under both voltage clamp (current response in Fig. 10A) and current clamp (post-stimulus time histogram in Fig. 10B,thick trace). We then injected the current response from Figure 10A into the cell and measured the evoked spike response (Fig. 10B, thin trace). If the light-driven currents reaching the site of spike generation were similar under current and voltage clamp, the response elicited by the light flash should be similar to that elicited by the injected current, as was the case in Figure 10. In three such experiments, the number of spikes elicited by the light flash and the injected current differed by <15%. A similar result was obtained in one cell in which we used a 21% contrast light input rather than a flash; >90% of spikes were consistent between the two conditions. Thus the light-evoked currents reaching the site of spike generation were similar under current and voltage clamp, and the additional contrast adaptation in the spike outputs is unlikely to be mediated by voltage-dependent processing in the dendrites.
Fig. 10.
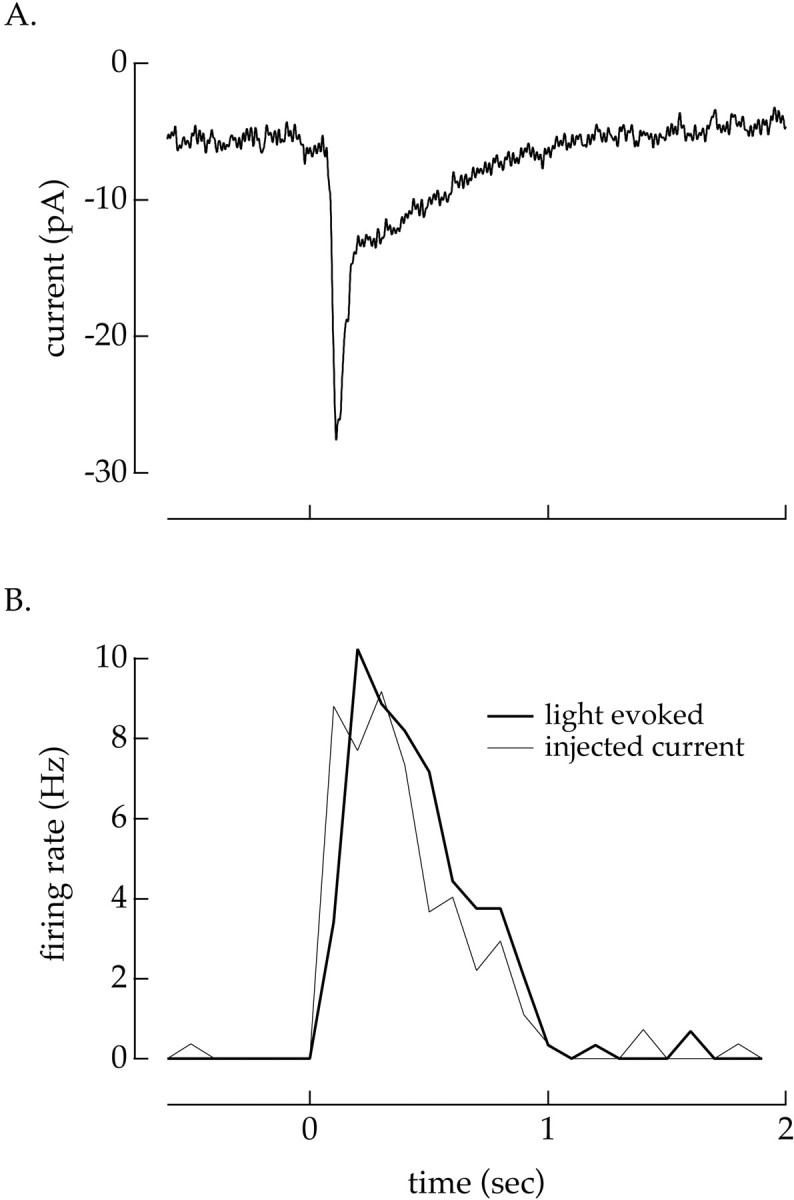
Light-evoked input currents to a ganglion cell were similar under current and voltage clamp. A, Average of 18 responses to a 10 msec light flash measured under voltage clamp. Holding potential: −60 mV. B, Post-stimulus time histograms of spike responses measured under current clamp. The thick trace plots the average firing rate to 28 light flashes identical to those used in A. The thin trace plots the average firing rate to 26 trials in which the current–response from A was used as a current-clamp command signal. The similarity of the light-evoked and current-evoked changes in firing rate indicate that the light-evoked currents reaching the ganglion cell soma are similar under current and voltage clamp. Holding current: −5 pA. Flash strength: 1000 photons μm−2 sec.
Second, direct measurements of the sensitivity of spike generation to injected current suggested that spike generation contributed to contrast adaptation. The variance of the input currents to a ganglion cell increased with increasing contrast (Fig. 6A). To test whether this change in variance altered how input currents were converted to spike trains, we injected currents of different variances into a ganglion cell and computed the linear filter and static nonlinearity describing the relationship between the injected current and spike output (see Materials and Methods). Figure 9C shows the linear filters measured for Gaussian injected currents with variances of 225 and 625 pA2. The static nonlinearities overlapped at the two variances and thus the effect of changes in variance on the sensitivity of spike generation was restricted to changes in the linear filter. The variances were chosen to match the variances of the input currents of the cell measured in response to 8 and 21% contrast light stimuli (288 and 668 pA2). Increasing the variance of the injected current decreased the amplitude and sped the kinetics of the filter. Thus the conversion of currents to spike output in the ganglion cell itself adapted to the variance of the injected current. Changes in the contrast of the light input and the consequent change in the variance of the input currents of the ganglion cell should cause a similar change in the sensitivity of spike generation.
Can adaptation of spike generation to the variance of the input current account for the difference in contrast adaptation in the input currents of a ganglion cell and its output spike trains? We compared the measured effect of contrast on the light-to-spikes transformation with that predicted by combining the effects on the light-to-current and current-to-spikes transformations. The light stimulus was passed through the light-to-current linear filter (Fig. 9A) and associated nonlinearity to predict the light-dependent current. This predicted current was then passed through the current-to-spikes linear filter (Fig. 9C) and nonlinearity to generate a prediction of the time-dependent firing rate. The transformation between the light stimulus and the predicted firing rate was described as a linear filter followed by a static nonlinearity. Predicted filters for 8 and 21% contrast are shown in Figure 9D. The predicted ratio of the amplitudes of the filters is 0.55 ± 0.02 compared with the measured ratio of 0.52 ± 0.01. Thus the contrast-dependent changes in the spike output of the cell are consistent with the combined effects of contrast on the input currents of the cell and of the change in current variance on spike generation.
Adaptation of spike generation is mediated by Na+ channels
To investigate the mechanisms mediating adaptation of the ganglion cells to the variance of the input current, we studied how injected currents were transformed into spike trains in isolated cells. These experiments indicated that adaptation of spike generation to the current variance is mediated by properties of voltage-activated Na+ channels.
As for cells in the intact retina, increasing the variance of the current injected into an isolated spiking cell decreased the amplitude and sped the kinetics of the response of the cell. Figure11A shows linear filters for one such experiment; the static nonlinearities for the two current variances overlapped (data not shown), and thus the effect of the variance on spike generation was restricted to changes in the linear filter. Adaptation of spike generation was essentially complete 0.5–1 sec after both increases and decreases in current variance (data not shown). Thus in the intact retina this mechanism should contribute a fast onset and offset component of contrast adaptation.
Fig. 11.

Na+ channels are required for adaptation in isolated ganglion cells. A, The variance of the injected current altered the sensitivity of the cell. Gaussian noise (bandwidth 0–50 Hz) was injected into a current-clamped isolated ganglion cell, and the measured voltage response was thresholded to identify the spike times. The relation between the injected current and the spiking probability was described using the static nonlinearity model (Fig. 1). The thick trace plots the filter for injected currents with a variance of 16 pA2 and thethin trace for currents with a variance of 144 pA2. The static nonlinearities overlapped, and hence the effect of changes in variance in the response of the cell were confined to the linear filter. B, TTX reduced the effects of current variance on the sensitivity of the cell. The experiment described in A was repeated in the presence of 100 nm TTX. The relation between the injected current and the voltage response was described using the static nonlinearity model. The linear filters were similar for injected currents with variances of 16 pA2 (thick trace) and 144 pA2 (thin trace). C, Collected results on adaptation to fluctuations in the injected current. Relative areas of the linear filters are plotted as a function of the relative variance of the injected current for 16 cells in normal Ringer's solution (●) and 7 cells with 100 nm TTX added to the Ringer's solution (○). Filter areas and injected current variances are normalized to a control variance (usually 16 pA2). Error bars are SEMs. The smooth curve is the third root of the relative variance.
The change in firing rate in response to a brief pulse of injected current had a much shorter duration than the light-dependent current response of the cell (Fig. 9A,C). Thus the primary functional effect of the dependence of spike generation on current variance is to alter the gain with which light-evoked input currents are converted to spike trains. This gain is determined by the area of the filter describing the conversion of input currents to spike outputs. To collect results from multiple experiments, we measured the dependence of the area of the filter on the variance of the injected current. The closed circles in Figure 11C plot the relative area of the filter against the relative current variance for 16 similar experiments. For comparison, increasing the contrast of a light stimulus from 8 to 21% increased the variance of the input currents to a ganglion cell in the intact retina by a factor of 1.8 ± 0.1 (mean ± SEM; 18 cells). The measurements summarized in Figure 11C indicate that this change in variance would be expected to decrease the sensitivity of spike generation by ∼20%.
The change in the amplitude and kinetics of the linear filter shown in Figure 11, A and C, required the activity of voltage-activated Na+ channels. Figure11B shows filters for the same cell after the activity of Na+ channels was suppressed with tetrodotoxin (TTX). In this case the filters relate the injected current to the voltage response of the cell because the cell was unable to generate action potentials. The current-to-voltage transfer in the absence of Na+ channels did not change substantially with increasing current variance. The open circles in Figure11C plot the filter area against the relative current variance for seven cells in the presence of TTX. The effect of changing the variance of the injected current was substantially decreased when Na+ channel activity was suppressed.
The lack of adaptation in the absence of Na+channels indicates either that the Na+ channels themselves mediate adaptation or that the voltage excursion produced by activation of the Na+ channels activates another conductance that is responsible for adaptation. To distinguish between these alternatives, we inhibited the other currents that are likely to be activated during an action potential. Several pharmacological agents that suppressed Ca2+, Ca2+-activated, and K+ currents had little effect on the ability of the cell to adapt to changes in the current variance. Figure 12A shows currents measured for a voltage step from −60 to −20 mV before and after suppressing Ca2+ and K+currents by adding 200 μm Ba2+, 400 μm Cd2+, and 500 nm apamin to the external solution. In addition to decreasing the outward current during depolarization, the action potentials (Fig. 12A,inset) were wider and had little or no afterhyperpolarization with Ca2+ and K+ currents suppressed. Figure 12C shows the linear filters measured for injected currents of high and low variance in normal Ringer's solution. Figure 12B shows filters with Ca2+ and K+currents suppressed. In both cases the static nonlinearities overlapped, and thus the effect of current variance on the sensitivity of spike generation was restricted to changes in the linear filter. The change in both the amplitude and kinetics of the filter with the change in variance of the injected current was indistinguishable with and without Ca2+ and K+ currents.
Fig. 12.
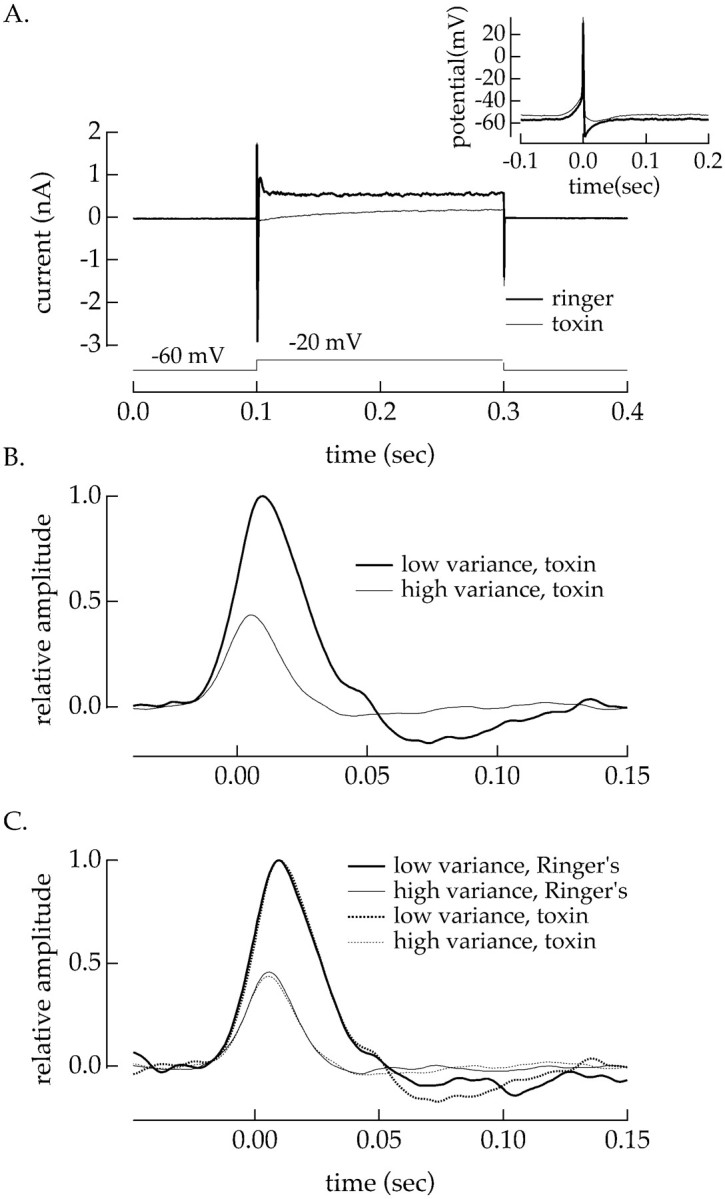
Adaptation to the current variance persisted with Ca2+ and K+ currents suppressed. A, Suppression of Ca2+ and K+ currents. The voltage of an isolated ganglion cell was stepped from −60 to −20 mV for 200 msec. The current–responses in HEPES Ringer's solution (thick line) and in Ringer's solution with 200 μmBa2+, 400 μm Cd2+, and 500 nm apamin added (thin line) are shown. Suppression of Ca2+ and K+currents tripled the width at half-height of the average action potential and reduced the afterhyperpolarization (inset). B, Adaptation to changes in current variance without Ca2+ and K+ currents. Gaussian noise (bandwidth 0–50 Hz) was injected into the cell under current clamp. Linear filters are shown for injected currents with variances of 16 pA2 (thick trace) and 144 pA2 (thin traces). C, Adaptation to changes in current variance was similar with and without Ca2+ and K+ currents. Solid traces plot filters measured in HEPES Ringer's solution, and thedashed traces plot those measured with Ca2+ and K+ currents suppressed. The filters in the absence of blockers were calculated with identical stimuli with and without toxins. Holding current was −10 to −16 pA, chosen so the cell had similar mean firing rates in both conditions.
Results from four such experiments are summarized in Figure13, which plots the relative filter area with Ca2+ and K+ currents suppressed against that in control conditions. The points fall close to the line of unity slope, indicating that adaptation to the variance of the injected current was similar with and without Ca2+ and K+ currents. Figure 13also summarizes results from experiments like that in Figure 11 in which activity of Na+ channels has been suppressed with TTX. The sensitivity of adaptation to the current variance to suppression of Na+ channels and the insensitivity to suppression of Ca2+ and K+channels suggest that the effect of changes in variance on spike generation is mediated by the Na+ channels themselves and not another conductance activated during the action potential.
Fig. 13.

Summary of pharmacology experiments on adaptation to variance of injected current in isolated ganglion cells. The relative area of the linear filters in the presence of pharmacological agents is plotted against that in control Ringer's solution for a collection of cells. In each cell the variance of the injected current was increased ninefold to probe adaptation. Open symbols are experiments on cells with various blockers of Ca2+and K+ currents (Fig. 11): (○) 5 mmTEA, 2.5 mm 4-aminopyridine (4-AP), 100 μmCd2+, (▵) 20 mm TEA, 10 mm4-AP, 100 μm Cd2+, and (◊) 200 μm Ba2+, 400 μmCd2+, 500 nm apamin. Experiments were performed with 100 nm TTX (●) (Fig. 11). In all cells the static nonlinearities overlapped, and the effect of changing the variance was restricted to the linear filter. Holding currents were chosen so that the cell had the same mean firing rate in the presence and absence of toxin. Error bars were estimated as described in Materials and Methods.
DISCUSSION
We investigated how changes in the temporal contrast of the light stimulus affected the amplitude and kinetics of the light-evoked currents and spike trains of ganglion cells. These experiments led to three main conclusions: (1) adaptation to temporal contrast included contributions from mechanisms acting on the input currents of a ganglion cell and from spike generation in the ganglion cell itself; (2) the input currents of off cells adapted more strongly than those of on cells; and (3) the onset of contrast adaptation had both a fast and a slow temporal component. We discuss the implications of these results below.
Contrast adaptation in the ganglion cell input currents
Increasing the temporal contrast decreased the amplitude and sped the kinetics of the light-evoked input currents of a ganglion cell.Sakai et al. (1995) proposed that contrast adaptation in the inputs to amacrine and ganglion cells could be attributed to a saturating nonlinearity between the horizontal and amacrine cells. Such a nonlinearity cannot account for the effect described here because our analysis specifically removed the effect of such a nonlinearity.
Contrast adaptation in the input currents of a ganglion cell could be mediated by processes in the retinal circuitry before the ganglion cell or by processes in the ganglion cell dendrites. The lack of contrast adaptation in horizontal cells (Sakai et al., 1995) and the large spatial extent of the signal controlling adaptation (Donner et al., 1991; Smirnakis et al., 1997) indicates that the photoreceptors and their output synapses are not responsible. Thus the mechanisms controlling contrast adaptation in the input currents must be in the bipolar cell and/or the bipolar–ganglion cell synapse. Preliminary experiments indicate that both sites are involved (Kim and Rieke, 2000).
The onset of adaptation in the input currents of a ganglion cell after an increase in contrast had two distinct temporal components: a fast component (∼1 sec) and a slow component (>11 sec) like that described by Smirnakis et al. (1997). Both of these differ from the effectively instantaneous onset of contrast gain control described by Victor (1987) in cat ganglion cells. The offset of adaptation after a decrease in contrast was well-described by a single temporal component. The retinal locations and mechanisms responsible for these temporal components remain to be determined.
Contrast adaptation in spike generation
Contrast adaptation in the spike outputs of a ganglion cell included a contribution from spike generation in the ganglion cell itself. Increasing the contrast of the light input increased the variance of the input currents of a ganglion cell, which in turn decreased the sensitivity with which input currents were converted to spike outputs. Adaptation of spike generation to the current variance required the activity of voltage-activated Na+channels but not Ca2+ or K+channels. Intrinsic cellular mechanisms also contribute to contrast adaptation in visual cortical neurons (Sanchez-Vives et al., 2000a); however, adaptation in these cells appears to be largely mediated by K+ channels activated during the action potential (Sanchez-Vives et al., 2000b). These distinct biophysical mechanisms may provide a rich repertoire of adaptation properties in spike generation itself, permitting a cell to adapt to several distinct properties of its input signals.
A general mechanism that could account for the adaptation of spike generation in retinal ganglion cells is an increase in the threshold for spike generation with an increase in the current variance. Larger current fluctuations, for example, could increase subthreshold activation of Na+ channels. If the Na+ channels recover from inactivation relatively slowly, this increase in subthreshold activation would increase the fraction of Na+ channels in the inactive state and raise the threshold for spike generation. The increased threshold would lower the gain with which input currents were converted into spike outputs.
The ability of retinal ganglion cells to adapt to the variance of their input currents helps the cells match the range of their input signals to the range of possible outputs. Many cells face a similar problem of representing a large range of input signals with a relatively small dynamic range of outputs. An adaptation mechanism based on properties of voltage-activated Na+ channels could provide a simple solution to this general problem.
Differences in contrast adaptation in on andoff pathways
The effect of contrast changes on the input currents of off ganglion cells was two to three times larger than that on the currents of on cells. A similar asymmetry occurs in the spike outputs of on and offsalamander ganglion cells (Chander and Chichilnisky, 1999). Our results indicate that the greater extent of contrast adaptation in the spike outputs of off cells is attributable, at least in part, to a difference in mechanisms in theon and off pathways before spike generation rather than differences in spike generation itself. Why dooff cells adapt more strongly to contrast? The light-evoked input currents of off ganglion cells were two to three times larger than those of on cells, presenting a greater risk of saturation for high-contrast light inputs in theoff pathway. Thus the greater extent of contrast adaptation in off cells may be a safeguard against such saturation. In addition to differences in the strength of contrast adaptation inon and off cells, the spatial properties in the two cell types also differ (Smirnakis et al., 1997). Because the separation of signals into on andoff pathways is a highly conserved aspect of retinal processing, the on–off asymmetries in contrast adaptation may be an important determinant of visual sensitivity to light increments and decrements.
Our results also suggest that the contribution of spike generation to contrast adaptation relative to that in the input currents was larger for on cells than offcells. Changing the contrast of the light inputs from 8 to 21% decreased the amplitude of the filter between light input and ganglion cell current by an average of 47% in off cells and 17% inon cells (Fig. 8). For both ganglion cell types, the total current variance (noise and light-evoked) during 21% contrast was approximately twice that during 8% contrast. From the dependence of the gain of spike generation on the current variance (Fig.11C), this twofold increase in variance produced a 20% decrease in the sensitivity of the spike output of a ganglion cell. Thus in on cells we estimate that spike generation accounts for approximately half of the total contrast adaptation, whereas inoff cells spike generation should make a relatively smaller but still significant contribution to the total contrast adaptation. Because the onset and offset of adaptation in spike generation were fast, the relative strengths of the fast and slow components of contrast adaptation in the spike trains of on andoff cells should also differ, with on cells showing greater fast contrast adaptation.
Functional roles of contrast adaptation
Adaptation of retinal ganglion cells to changes in contrast exhibits a diverse set of spatial (Smirnakis et al., 1997; Benardete and Kaplan, 1997a,1997b) and temporal (Shapley and Victor, 1978; Smirnakis et al., 1997; Benardete and Kaplan, 1999) properties, and these properties differ among ganglion cell types (Shapley and Victor, 1978; Benardete et al., 1992). This diversity suggests a corresponding diversity in the functional roles of contrast adaptation.
One role of contrast adaptation is to dynamically adjust visual sensitivity to match the temporal and spatial structure of the light inputs (Shapley and Victor, 1978), but contrast adaptation is not restricted to a scaling of the amplitude of the light response of a ganglion cell. Instead, changes in contrast affect the amplitude and kinetics of the light response of the cell (Shapley and Victor, 1978; Smirnakis et al., 1997). As contrast increases, the gain and integration time decrease, protecting the cell from saturation and improving its ability to encode fast temporal changes in the light inputs. Changes in both gain and integration time are more pronounced in off cells than on cells (Fig. 8) (Chander and Chichilnisky, 1999), suggesting that the temporal resolution of theoff pathway may be more sensitive to contrast than that of the on pathway.
Contrast adaptation has both fast- and slow-onset components (Fig. 5). Although the slow-onset component seems well suited for matching the input and output signals of a cell, the fast-onset component may play a more prominent computational role by shaping the responses of ganglion cells to single visual objects, such as lowering the latency for responses to moving objects (Berry et al., 1999). This computational role of contrast adaptation may predominate inon cells because a larger fraction of their contrast adaptation is of the fast-onset form.
Footnotes
This work was supported by National Institutes of Health (NIH) through Grant EY-11850 and by the McKnight Foundation. K.J.K. received support from NIH Training Grant GM07108 and from the University of Washington Graduate School Fund for Excellence and Innovation Special Fellowship. We thank Cecilia Armstrong, Divya Chander, E. J. Chichilnisky, Greg Field, Josh Gold, and Maria McKinley for helpful discussions and Eric Martinson for excellent technical assistance. We also thank the anonymous reviewers for helpful suggestions and comments.
Correspondence should be addressed to Kerry Kim, Department of Physiology and Biophysics, HSB Room G424, Box 357290, University of Washington, Seattle, WA 98195. E-mail:kerrykim@u.washington.edu.
REFERENCES
- 1.Albrecht DG, Farrar SB, Hamilton DB. Spatial contrast adaptation characteristics of neurones recorded in the cat's visual cortex. J Physiol (Lond) 1984;347:713–739. doi: 10.1113/jphysiol.1984.sp015092. [DOI] [PMC free article] [PubMed] [Google Scholar]
- 2.Benardete EA, Kaplan E. The receptive field of the primate P retinal ganglion cell. I: Linear dynamics. Vis Neurosci. 1997a;14:169–185. doi: 10.1017/s0952523800008853. [DOI] [PubMed] [Google Scholar]
- 3.Benardete EA, Kaplan E. The receptive field of the primate P retinal ganglion cell. II: Nonlinear dynamics. Vis Neurosci. 1997b;14:186–205. doi: 10.1017/s0952523800008865. [DOI] [PubMed] [Google Scholar]
- 4.Benardete EA, Kaplan E. The dynamics of primate M retinal ganglion cells. Vis Neurosci. 1999;16:355–368. doi: 10.1017/s0952523899162151. [DOI] [PubMed] [Google Scholar]
- 5.Benardete EA, Kaplan E, Knight BW. Contrast gain control in the primate retina: P cells are not X-like, some M cells are. Vis Neurosci. 1992;72:483–586. doi: 10.1017/s0952523800004995. [DOI] [PubMed] [Google Scholar]
- 6.Berry MJ, Brivanlou IH, Jordan TA, Meister M. Anticipation of moving stimuli by the retina. Nature. 1999;398:334–338. doi: 10.1038/18678. [DOI] [PubMed] [Google Scholar]
- 7.Blakemore C, Campbell FW. On the existence of neurones in the human visual system selectively sensitive to the orientation and size of retinal images. J Physiol (Lond) 1969;203:237–260. doi: 10.1113/jphysiol.1969.sp008862. [DOI] [PMC free article] [PubMed] [Google Scholar]
- 8.Chander D, Chichilnisky EJ. Contrast adaptation and gain changes in salamander and monkey retina. Soc Neurosci Abstr. 1999;25:1431. [Google Scholar]
- 9.Donner K, Djupsund K, Reuter T, Vaisanen I. Adaptation to light fluctuations in the frog retina. Neurosci Res [Suppl] 1991;15:S175–S184. [PubMed] [Google Scholar]
- 10.Kim KJ, Rieke F. Temporal contrast adaptation in the salamander retina (ARVO Abstract). Invest Ophthalmol Vis Sci. 2000;41:4984. [Google Scholar]
- 11.Koutalos Y, Yau KW. Regulation of sensitivity in vertebrate rod photoreceptors by calcium. Trends Neurosci. 1996;19:73–81. doi: 10.1016/0166-2236(96)89624-x. [DOI] [PubMed] [Google Scholar]
- 12.Makino CL, Dodd RL. Multiple visual pigments in a photoreceptor of the salamander retina. J Gen Physiol. 1996;108:27–34. doi: 10.1085/jgp.108.1.27. [DOI] [PMC free article] [PubMed] [Google Scholar]
- 13.Marmarelis PV, Marmarelis VZ. Analysis of physiological systems: the white-noise approach. Plenum; New York: 1978. [Google Scholar]
- 14.Meister M, Berry MJ. The neural code of the retina. Neuron. 1999;22:435–450. doi: 10.1016/s0896-6273(00)80700-x. [DOI] [PubMed] [Google Scholar]
- 15.Ohzawa I, Sclar G, Freeman RD. Contrast gain control in the cat's visual system. J Neurophysiol. 1985;54:651–667. doi: 10.1152/jn.1985.54.3.651. [DOI] [PubMed] [Google Scholar]
- 16.Rae J, Cooper K, Gates P, Watsky M. Low access resistance perforated patch recordings using amphotericin B. J Neurosci Methods. 1991;37:15–26. doi: 10.1016/0165-0270(91)90017-t. [DOI] [PubMed] [Google Scholar]
- 17.Rieke F, Schwartz EA. Asynchronous transmitter release: control of exocytosis and endocytosis at the salamander rod synapse. J Physiol (Lond) 1996;493:1–8. doi: 10.1113/jphysiol.1996.sp021360. [DOI] [PMC free article] [PubMed] [Google Scholar]
- 18.Sakai HM, Wang JL, Naka K. Contrast gain control in the lower vertebrate retinas. J Gen Physiol. 1995;105:815–835. doi: 10.1085/jgp.105.6.815. [DOI] [PMC free article] [PubMed] [Google Scholar]
- 19.Sanchez-Vives MV, Nowak LG, McCormick DA. Membrane mechanisms underlying contrast adaptation in cat area 17 in vivo. J Neurosci. 2000a;20:4267–4285. doi: 10.1523/JNEUROSCI.20-11-04267.2000. [DOI] [PMC free article] [PubMed] [Google Scholar]
- 20.Sanchez-Vives MV, Nowak LG, McCormick DA. Cellular mechanisms of long-lasting adaptation in visual cortical neurons in vitro. J Neurosci. 2000b;20:4286–4299. doi: 10.1523/JNEUROSCI.20-11-04286.2000. [DOI] [PMC free article] [PubMed] [Google Scholar]
- 21.Schieting S, Spillmann L. Flicker adaptation in the peripheral retina. Vision Res. 1987;27:277–284. doi: 10.1016/0042-6989(87)90190-8. [DOI] [PubMed] [Google Scholar]
- 22.Shapley R. Retinal physiology: adapting to the changing scene. Curr Biol. 1997;7:R421–423. doi: 10.1016/s0960-9822(06)00207-7. [DOI] [PubMed] [Google Scholar]
- 23.Shapley R, Victor JD. The effect of contrast on the transfer properties of cat retinal ganglion cells. J Physiol (Lond) 1978;285:275–298. doi: 10.1113/jphysiol.1978.sp012571. [DOI] [PMC free article] [PubMed] [Google Scholar]
- 24.Sherry DM, Bui DD, Degrip WJ. Identification and distribution of photoreceptor subtypes in the neotenic tiger salamander retina. Vis Neurosci. 1998;15:1175–1187. doi: 10.1017/s0952523898156201. [DOI] [PubMed] [Google Scholar]
- 25.Smirnakis SM, Berry MJ, Warland DK, Bialek W, Meister M. Retinal processing adapts to image contrast and spatial scale. Nature. 1997;386:69–73. doi: 10.1038/386069a0. [DOI] [PubMed] [Google Scholar]
- 26.Taylor WR, Mittman S, Copenhagen DR. Passive electrical cable properties and synaptic excitation of tiger salamander retinal ganglion cells. Vis Neurosci. 1996;13:979–990. doi: 10.1017/s0952523800009202. [DOI] [PubMed] [Google Scholar]
- 27.Victor JD. The dynamics of the cat retinal X cell centre. J Physiol (Lond) 1987;386:219–246. doi: 10.1113/jphysiol.1987.sp016531. [DOI] [PMC free article] [PubMed] [Google Scholar]
- 28.Walraven J, Enroth-Cugell C, Hood DC, MacLeod DIA, Schnapf JL. The control of visual sensitivity. In: Spillmann L, Werner SJ, editors. Visual perception: the neurophysiological foundations. Academic; San Diego: 1990. pp. 53–101. [Google Scholar]
- 29.Watt CB, Yang SZ, Lam DM, Wu SM. Localization of tyrosine-hydroxylase-like-immunoreactive amacrine cells in the larval tiger salamander retina. J Comp Neurol. 1988;272:114–126. doi: 10.1002/cne.902720108. [DOI] [PubMed] [Google Scholar]
- 30.Wiener N. Extrapolation, interpolation and smoothing of stationary time series. MIT; Cambridge, MA: 1949. [Google Scholar]