

Abstract
We recorded activity from the granule cell layer (GCL) of cerebellar folium Crus IIa as freely moving rats engaged in a variety of natural behaviors, including grooming, eating, and free tactile exploration. Multiunit responses in the 1000–4500 Hz range were found to be strongly correlated with tactile stimulation of lip and whisker (perioral) regions. These responses occurred regardless of whether the stimulus was externally or self-generated and during both active and passive touch. In contrast, perioral movements that did not tactually stimulate this region of the face (e.g., chewing) produced no detectable increases in GCL activity. In addition, GCL responses were not correlated with movement extremes. When rats used their lips actively for palpation and exploration, the tactile responses in the GCL were not detectably modulated by ongoing jaw movements. However, active palpation and exploratory behaviors did result in the largest and most continuous bursts of GCL activity: responses were on average 10% larger and 50% longer during palpation and exploration than during grooming or passive stimulation. Although activity levels differed between behaviors, the position and spatial extent of the peripheral receptive field was similar over all behaviors that resulted in tactile input. Overall, our data suggest that the 1000–4500 Hz multiunit responses in the Crus IIa GCL of awake rats are correlated with tactile input rather than with movement or any movement parameter and that these responses are likely to be of particular importance during the acquisition of sensory information by perioral structures.
Keywords: cerebellar granule cells, mossy fibers, somatosensory, ingestive, grooming, exploration, whiskers, vibrissae, passive touch, active touch, active sensing
Many theories of cerebellar function have proposed that this structure is involved in the production of smooth and accurate movements, and these theories have strongly influenced the interpretation of cerebellar physiology and anatomy (Marr, 1969; Albus, 1971; Bloedel, 1992; Thach et al., 1992). For example, responses recorded from the neocerebellum of awake behaving animals are often interpreted as direct measures of movement parameters, regardless of the sensory nature of the responses (Strick, 1983; Fortier et al., 1989; Ojakangas and Ebner, 1992; Fu et al., 1997;Kitazawa et al., 1998). Even when the tactile projections to these regions of the cerebellum are specifically considered, it is most often assumed that the projections simply provide feedback or corrective information for smooth movement (Schieber and Thach, 1985; Schwartz et al., 1987; Dugas and Smith, 1992; Lou and Bloedel, 1992; Thach et al., 1992). For example, in the cat, cerebellar responses to light touch of the footpads have been interpreted as representations of information about footfall or about unexpected movement perturbations during walking [Schwartz et al., 1987; (ferret); Lou and Bloedel, 1992]. In the monkey, lateral cerebellar responses to tactile stimulation of the fingers have consistently been interpreted as representations of feedback or corrective information for smooth reaching or grasping movements (Schieber and Thach, 1985; Dugas and Smith, 1992).
In the anesthetized rat, cells in the granule cell layer (GCL) of cerebellar folium Crus IIa respond to tactile stimulation of the lips and whiskers, collectively termed perioral structures (Shambes et al., 1978; Bower and Kassel, 1990). By analogy to smooth walking in the cat and smooth grasping in the monkey, these extensive perioral representations have often been interpreted to be important for the smooth and accurate control of ingestive behaviors (eating and drinking) (Woodson and Angaut, 1984; Buisseret-Delmas and Angaut, 1989a,b; Cicirata et al., 1989; Welsh et al., 1995). In this view, the cerebellar hemispheres and lateral nucleus serve to ensure that ingestive movements are made smoothly, accurately, rapidly, or rhythmically. Other studies, although suggesting that the hemispheric perioral representations may subserve more than ingestion, have nevertheless retained an emphasis on smooth and coordinated movement, proposing that these cerebellar regions serve in the spatiotemporal coordination of groups of muscles or body segments (Cicirata et al., 1989, 1992; Welsh et al., 1995) (cf. Rispal-Padel et al., 1982).
Interestingly, however, the surfaces so extensively represented in the mammalian lateral cerebellum (cat paws, monkey fingers, and rat whiskers) are precisely the surfaces these animals use to tactually explore objects and the environment (Vincent, 1913; Welker, 1964; Paulin, 1993; Brecht et al., 1997). This is one of several reasons why our laboratory has been exploring an alternative hypothesis: that the cerebellar hemispheres are more involved in the direct evaluation of the quality of sensory information rather than in monitoring the accuracy of volitional movements (Bower and Kassel, 1990; Bower, 1997a,b).
In the current experiments, we have recorded from multiple GCL locations in awake rats under different behavioral conditions. We have intentionally examined a range of natural behaviors involving movements with varying degrees and sources of tactile sensory input, and conditions in which the animal was likely to make differential use of that input. The results indicate that neural activity in the GCL of Crus IIa is closely related to tactile stimulation of perioral surfaces and not related to movements involving those surfaces. In addition, GCL responses were found to be larger and most continuous during behaviors that involved active palpation and tactile sensory exploration.
MATERIALS AND METHODS
Surgical implantation procedures
Six female Sprague Dawley rats, aged 4–10 months, were implanted with microwire electrode arrays. These lightweight microdrives were developed in our laboratory (modified from Bhalla and Bower, 1997) and allow up to eight wires to be independently positioned in Crus IIa. Wires were either platinum–iridium (18 μm in diameter), nichrome (66 μm in diameter), or stainless steel (50 μm in diameter). Typical impedances for all electrodes ranged between 1 and 2 MΩ. The reference electrode was a deinsulated stainless steel (76 μm in diameter) wire laid flat over the entire length of Crus IIa.
During implantation, animals were anesthetized with a ketamine–xylazine hydrochloride combination delivered intramuscularly (70 mg/kg ketamine, 3.5 mg/kg xylazine, and 0.7 mg/kg acepromazine maleate) and sodium pentobarbital delivered intraperitoneally (20 mg/kg). Five or six stainless steel screws were placed over neocortical areas and covered with dental acrylic to form a stable base. A small (<2 mm in diameter) craniotomy was then performed over Crus IIa, and the grid of wire electrodes was fixed with acrylic above the exposure. Electrodes were lowered until maximum responses to tactile peripheral stimulation were recorded in the superficial GCL and then fixed in position with dental acrylic. Care was taken to identify and record the receptive field at each recording site and to confirm that the responses were physiologically characteristic of the Crus IIa GCL (see below). Recordings from awake behaving animals were started no sooner than 4 d after surgery and continued for up to 4 months. All animal procedures were approved in advance by the Animal Use Committee of the California Institute of Technology.
After recordings were complete, electrolytic lesions were made at each electrode site using two pulses of 10 mA current for 10 sec. Rats were perfused with 4% formaldehyde solution, and the brains were then sectioned using a freezing microtome (60 μm). Sections were stained with cresyl violet or neutral red.
Multiunit recordings
Histological analysis indicated that field potentials and multiunit activity were recorded from the most superficial GCL of Crus IIa. Figure 1 shows a histological section from a rat verifying that recordings were centered in the middle of the superficial Crus IIa GCL (Paxinos and Watson, 1982). As in previous experiments (Bower and Kassel, 1990), maximum amplitude responses were found between 400 and 700 μm below the pial surface. A high input impedance preamplifier mounted directly on the animal's head (CFP-1020, unity gain; Multichannel Concepts, Phoenix, AZ) allowed neural signals to be carried to a custom-built amplifying system with a minimum of mechanical and electrical artifact. Neural signals were amplified and filtered between 1 Hz and 5 kHz. All data were collected using a 486 personal computer (MicroQ) equipped with a BrainWave (DataWave Technologies, Longmont, CO) data acquisition system at a sampling rate of 10 kHz or greater.
Fig. 1.

Parasaggital section from an implanted rat, stained with cresyl violet. The lesion site (arrow) is centered in the middle of the Crus IIa granule cell layer.
As discussed previously (Bower, and Kassel, 1990), even in anesthetized preparations, the small size of granule cells makes them difficult or impossible to isolate individually. Accordingly, as in previous investigations, we have made no attempt to record from isolated cells but instead have relied on multiunit recordings. In this paper, we have adopted the convention of other reports (Welker, 1987; Bower and Kassel, 1990) and refer to the recorded multiunit responses as GCL activity. We have made no attempt to separate granule cell spikes from mossy fiber spikes or from mossy fiber postsynaptic potentials; our multiunit recordings may include contributions from all three sources. These limitations are compatible with the goal of this study, which was to record what information was available at the mossy fiber–granule cell input layer to Crus IIa.
In this paper, we are, however, most interested in the GCL responses that are most likely to represent the activity passed from the GCL to the overlying Purkinje cells. We have shown previously that Purkinje cell responses are most correlated with the high-frequency (above 1000 Hz) multiunit bursts evoked in the GCL by mossy fiber inputs (Bower and Woolston, 1983; Jaeger and Bower, 1994). For this reason, we have focused in this paper on the analysis of these high-frequency signals. The lower frequency responses also recorded in this study will be the subject of a subsequent paper comparing neuronal activity in the cerebellum with that in primary somatosensory cortex (S1).
Choice of video recording techniques
The results presented in this study are the first published recordings from the GCL of awake, freely behaving animals. The overall goal of the study was to look for correlations between neural activity and (1) gross body movements, such as locomotion and grooming, (2) detailed jaw and lip movements, and (3) tactile contact with perioral regions. Although in principle it would have been possible to monitor times of peripheral contact and muscle activation using microwires, we were concerned that subcutaneous or intramuscular wires placed in the rat's highly sensitive lip and whisker regions would disrupt natural behaviors and movements.
For this reason, we decided not to electrically record peripheral contact or EMGs but rather to perform detailed video analysis of the rat's movements, as described below. All video scoring was done with the scorer blind to the neural data, and we performed much of the video analysis twice to ensure that the scoring was repeatable. The fact that our results show such clear tactile responses suggests to us that EMGs are unlikely to show anything substantially different from the fine, detailed video analysis. However, the limitations imposed by our video analysis are specifically considered in Discussion.
Correlation of neural and behavioral data with video techniques
Animal behaviors were videotaped with a Hi-8, National Television Standards Committee (NTSC) video camera and synchronized in real time with the neural data using a custom-built video splitter (Rasnow et al., 1997). The video splitter combines the pictures from two video cameras, one monitoring the behavior of the rat and one monitoring the neural signals displayed on an oscilloscope. In this way, the neural data were displayed and recorded simultaneously with the animal behaviors.
NTSC video consists of “fields” recorded at a rate of 60 per second. Each field begins with a vertical sync pulse, and two fields are interlaced to form a “frame” (Jack, 1993). Separately viewing each video frame thus achieves an effective temporal resolution of ∼33.33 msec. However, by examining the behavioral data field-by-field, using a standard commercial video cassette recorder (VCR) (EV S3000; Sony, Tokyo, Japan), we were able to analyze the behavioral data with a temporal resolution of ∼16.67 msec.
Off-line, the vertical sync pulse for each field of video data (16.67 msec apart) was synchronized with neural data using TTL (transistor–transistor logic) indicators accurate to within one sample (0.1 msec or better). The video splitter allowed us to scan through many hours of animal behavior looking for interesting neural and/or behavioral events. When a relevant behavior was found (e.g., eating, grooming, or exploration), we analyzed the behavioral videos frame-by-frame (33.33 msec resolution) or sometimes field-by-field (16.67 msec resolution), paying particular attention to perioral sensory inputs and movements.
Frame-by-frame or field-by-field video analysis was done in two ways. In the first method, we frame-grabbed each video field of interest and determined the spatial coordinates of tactile input relative to invariant features of the rat (e.g., nostrils and eyes). These points were then superimposed onto a single video field of the rat. A second method involved the use of digital overlay and chromakeying techniques on a Power Macintosh 6100 AV (Apple Computers, Cupertino, CA) (Hartmann et al., 2000). A Matlab (v5.0.0, 1996; MathWorks Inc., Natick, MA) figure window was first superimposed over a live-video window. Next, using the VCR pause mode, we incremented through the video, tracing and digitizing in Matlab the precise position and shape of the perioral regions of interest. These digital graphics were then saved to a file containing just the tracings and not the underlying video. Reference points on the rat's face, such as the nostrils and/or eyes, were also traced in each field to accommodate for head or body movement. Field-by-field tracing of the behavioral data resulted in an effective sampling rate of 60 Hz, and the positional data were subsequently filtered at 20 Hz to eliminate the highest frequency components of the rat's movements (Berridge and Fentress, 1986).
Analysis of behavioral data
Passive tactile stimulation procedures. Although the principle objective of these experiments was to record neural activity during natural behaviors, we also recorded GCL responses to passive, externally generated tactile stimuli. Both mechanically controlled and manual stimulation techniques were used. Controlled stimulation was obtained with an air-puff stimulator designed to mimic as closely as possible the duration and strength of the mechanical stimulation used in previous experiments (Morissette and Bower, 1996).
Air-puff stimuli, however, were found to be highly aversive to rats, and we therefore more often used manual stimulation in the awake animal. Manual stimulation was provided with a cylindrical wooden probe ∼1 mm in diameter. The probe was tapped on the skin with a quick in-and-out stroke; field-by-field video analysis showed that these stimulations lasted between 100 and 300 msec. Analysis of the data showed no significant differences between the GCL responses evoked by the two different types of stimulation, as long as the stimuli were delivered for approximately the same duration.
Grooming behavior. Most videos of rat grooming behavior were analyzed frame-by-frame (33 msec resolution) to identify where the paw was touching the skin of the animal. For each frame, a score was assigned that represented our confidence that the paw was actually in contact with the body surface. To create Figure 12B, we traced out the trajectory of the paw field-by-field (16.67 msec resolution), using the digital overlay technique described above.
Fig. 12.
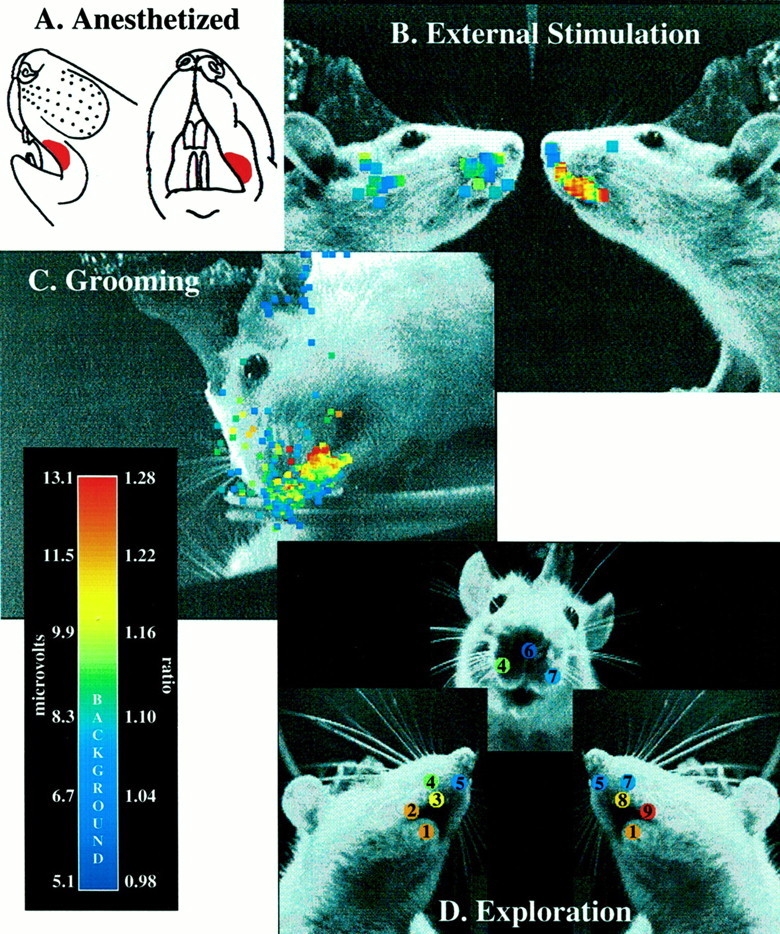
Receptive field localization under different behavioral conditions. A, Receptive field as determined during the initial implantation surgery, in the anesthetized animal.B, Responses during external stimulation. Thepoints superimposed on the single video frame of the rat indicate the positions of tactile stimulation over 96 trials of external stimulation. The color of eachpoint codes for the amplitude of the low-passed envelope of GCL activity when the stimulator touched that position on the rat's face. Locations where there are no points were not tested. Color bar scale on the left applies (microvolts).C, Responses during the self-generated touch occurring during grooming behavior. The points superimposed on the single video frame of the rat indicate the positions of the left paw during 14 sec of grooming. The color of eachpoint codes for the amplitude of the low-passed envelope of GCL activity when the paw was in that position. Color bar scale on the left applies (microvolts). D, Responses during tactile exploration. Numbers identify the nine different perioral surfaces examined in the behavioral analysis. Because these surfaces were used in different combinations with each other during tactile exploration, we took the ratio of the GCL amplitude in the video fields in which that surface was used to the GCL amplitude in the video fields in which that surface was not used. Color bar scale on the right applies (ratio).
Chewing and eating behavior. Videos of rat chewing and eating behavior were generally analyzed frame-by-frame (33 msec resolution). For each frame, we also assigned a score representing our confidence that the lip was in contact with the food. The detailed chewing and eating behaviors shown in Figure 9 were quantified by tracing out the position of the rat's mouth in each video field and then calculating the angle between upper and lower jaw.
Fig. 9.

GCL responses during eating behavior.A, Simultaneous measurement of jaw angle and GCL activity. Black bars at the top andbottom indicate times when the rat was definitely touching, and definitely not touching the food, respectively.Top trace, Field-by field measurement of jaw angle during 12 sec of eating. Calibration: 40°. Bottom trace, Black, GCL activity, filtered between 1400 and 4200 Hz. Calibration: 20 μV. Bottom trace,White, Offset andsuperimposed, Low-passed envelope of the multiunit activity. Calibration: 5 μV. B, C, Correlations between different frequency components of the GCL multiunit activity and the behavioral data. B, Jaw angle and neural activity filtered between 4 and 7 Hz. Calibration: 20°, 2 μV. C, Jaw angle and neural activity filtered between 0.25 and 4 Hz. Calibration: 20°, 2 μV. D, The distribution of GCL envelope amplitude as a function of jaw angle and as a function of touching or not touching the food. Top, The distribution of GCL envelope amplitude for fields in which the jaw angle was in the upper and lower quartiles (solid line) and in the middle two quartiles (dashed line) of jaw angle. Bottom, The distribution of GCL envelope amplitude for fields in which the rat was not touching (dashed line) and touching (solid line) the food.E, Simultaneous measurement of jaw angle and GCL activity for a second rat. Black bars at thetop and bottom indicate times when the rat was definitely touching and definitely not touching the food respectively. Top trace, Field-by field measurement of jaw angle during 6 sec of eating. Calibration: 25°. Bottom trace, Black, GCL activity, filtered between 1400 and 4200 Hz. Calibration: 50 μV. Bottom trace,White, Offset andsuperimposed, Low-passed envelope of the multiunit activity. Calibration: 12.5 μV.
Exploratory behavior. In general, the movements of the rat, as well as the irregular shapes and locations of the objects under exploration, made this data much more difficult to analyze quantitatively. For this reason, many hours of video records were searched for sections of behavior in which the location of the animal in the video field allowed more detailed analysis of the contact being made between the rat's perioral structures and objects in the environment (see Fig. 12C).
Analysis of neural data
All analysis of neural data was performed with Matlab. As described above, the objective of this study was to compare the recorded neural data with behavioral measures. To do so, it was necessary to apply signal processing techniques that would allow us to correlate ongoing changes in the amplitude of the high-frequency (>1000 Hz) multiunit data with the lower frequency (<20 Hz) measured changes in the behavior of the rat. Such a measurement of the neural data can be provided by extracting the envelope of the signal (Hartmann, 1997). This analysis is shown in Figure2 and described in detail below, and is very similar to standard techniques used to analyze EMG data (cf.Hoffer et al., 1981). Rises and falls in the envelope amplitude correspond directly to the rises and falls in the volume heard on an audio monitor when listening to the hash of cellular activity as the rat behaves.
Fig. 2.

Steps in the calculation of the low-passed envelope are illustrated in the responses to external tactile stimulation of the awake animal. Stimulation times are shown asthick bars at the bottom. Calibration:trace 1, 200 μV; traces 2–4, 67 μV;trace 5, 40 μV. Trace 1, Field potential activity, filtered between 0 and 300 Hz. Note that field potential responses are represented as downward deflections.Trace 2, Broadband multiunit data, filtered between 300 and 4500 Hz. Trace 3, The multiunit data of trace 2 has been filtered between 1400 and 4200 Hz to meet the narrow-band condition. Trace 4, The envelope oftrace 3, containing frequencies between 0 and 2600 Hz. See Materials and Methods for details. Trace 5,White, The envelope shown in trace 4 has been low-pass filtered to contain only behaviorally relevant frequencies (0.01–20 Hz). This trace has beenoffset and superimposed on a repeat oftrace 3 (in black) to show that the envelope well characterizes the rises and falls in the narrow-band multiunit data.
Figure 2 illustrates in more detail the analysis procedure used for the neural data. The data in this figure was taken from a 3 sec sequence of manual tactile stimulation of an awake animal. The approximate duration of each stimulus is indicated by the thick black lines at the bottom of the figure.
Traces 1 and 2: differentially filter the raw data. As shown in trace 1, filtering the recorded signals between 0 and 300 Hz illustrates that each stimulation induced a distinct field potential response within the Crus IIa GCL. When the same signal is filtered between 300 and 4500 Hz (trace 2) each field potential can be seen to correspond to a burst of multiunit activity. The remaining traces 3–5 each represent a step in the calculation of the low-passed envelope of the multiunit burst data, as follows.
Trace 3: filter the high-frequency data to meet the narrow-band condition. Mathematically, the envelope of a signal is defined only for narrow-band signals, in which the highest frequency in the signal is no greater than three times the lowest frequency in the signal (Hartmann, 1997). This restriction is necessary to ensure that there is no overlap between the frequencies of the signal and the frequencies of the envelope and thus ensures that we are examining only the behavioral modulation of the GCL multiunit activity. Accordingly, the next step in this analysis was to filter the raw neural data between 1400 and 4200 Hz. (We performed the identical analysis for frequency ranges 1000–3000 and 1500–4500 Hz and found the results to be essentially unchanged.) The resulting signal is shown in trace 3 of Figure 2.
Trace 4: calculate the envelope of the narrow-band signal. Trace 4 shows the envelope of the narrow-band signal of trace 3. The envelope was calculated by removing all positive frequency components in the Fourier transform of the data and then taking the absolute value of the inverse Fourier transform of the remaining spectrum. Multiplying by a factor of two compensated for the power loss induced by the removal of half of the frequencies. The envelope of a signal whose frequencies range between two arbitrary frequencies f1 and f2 will contain frequencies ranging from zero to f2 minus f1. In the case of the envelope shown in trace 4, the frequencies present thus range from zero to 4200 Hz minus 1400 Hz, or 2800 Hz.
Trace 5 (in white): low-pass filter the envelope of the signal to be compatible with the behavioral data. As described above, 20 Hz was the highest frequency reliably extractable from field-by-field scoring of the behavioral video. To facilitate comparison between the neural and video signals, the envelope of the narrow-band signal was low-pass filtered between 0 and 20 Hz.Trace 5, in white, shows the resulting measure of neural activity, superimposed on the narrow-band burst data (inblack, a repeat of trace 3). Careful inspection shows a close correspondence between the bursting behavior of the GCL and the rises and falls of the low-passed envelope.
RESULTS
All GCL recording sites described in this paper were specifically selected to correspond to the central region of folium Crus IIa and were verified histologically. Consistent with previous studies in both anesthetized and unanesthetized decerebrate rats (Bower and Woolston, 1983; Bower and Kassel, 1990), this region contained receptive fields located exclusively on the ipsilateral upper lip.
GCL responses to self-generated tactile stimulation: grooming behavior
The primary objective of this study was to compare GCL activity during several different natural rat behaviors involving different degrees and varieties of tactile stimulation. We began by asking whether responses to tactile stimulation were seen during self-generated touch, by recording neural activity during videotaped grooming sequences. Rat grooming behavior is typically composed of a variety of paw and mouth movements, including paw licks, small paw strokes around the mouth, variable-amplitude paw strokes over the cheeks and head, and body licks (Berridge and Fentress, 1986, 1987). Figure 3A illustrates the small paw strokes around the mouth, which tend to occur bilaterally and result in rhythmic (4–7 Hz) tactile input to the upper lips. This tactile input has been shown to be essential for normal grooming movements of the forelimb, although not for the sequential organization of the motor behavior involved in grooming (Berridge and Fentress, 1986, 1987). Figure 3B illustrates a period of head grooming, in which the lips receive no tactile input. Thus, during any one grooming sequence, there were times when the paws were in contact with perioral structures and other times when they were not. By examining GCL signals during different grooming actions, we could compare activity levels when the rat touched its own lips with activity levels when no contact was made.
Fig. 3.

Lip grooming and head grooming. A, During lip grooming, the rat makes small bilateral paw strokes around the mouth. B, During head grooming, the rat makes variable-amplitude paw strokes over the head and cheeks.
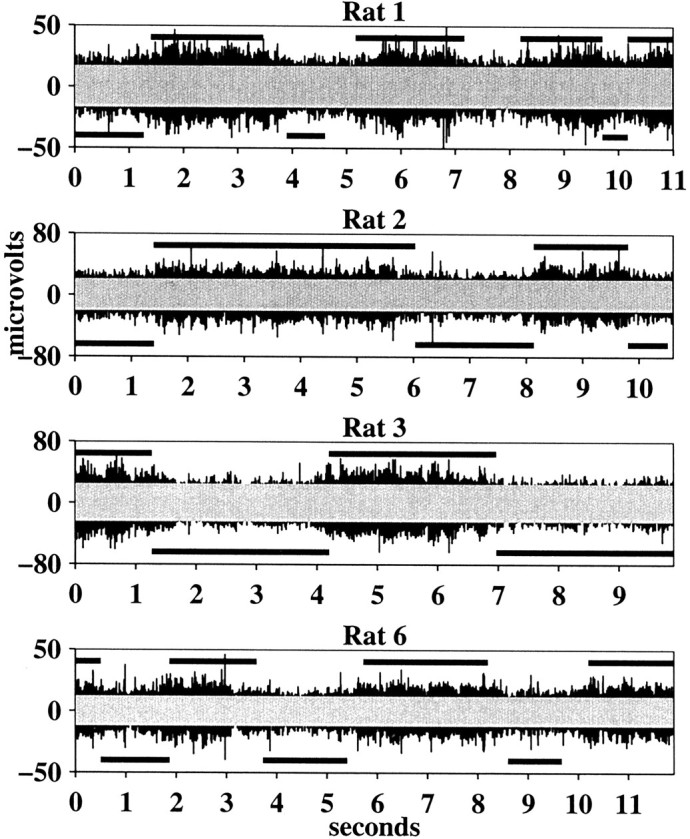
The five black traces in Figure4 show multiunit GCL activity, filtered between 1400 and 4200 Hz, during the grooming behavior of five different rats. For each rat, we also (in the same recording session) recorded GCL activity from the same electrode during a period of behavioral inactivity (i.e., background GCL activity). To determine the times during grooming behavior that the GCL activity exceeded background levels, we chose a threshold at the mean plus 3 SDs of the absolute value of the high-pass-filtered background activity. At this level, the probability that a background signal will exceed threshold is <0.3%. On each of the black traces in Figure 4, we have superimposed a gray rectangle that represents this threshold level. The thick black bars above each data trace indicate periods when video analysis confirmed that the rat was grooming its lips. The black barsbelow the traces indicate periods when the rat was grooming its head, and video analysis indicated that there was no direct tactile contact with the lips or other perioral regions. Periods not designated indicate times when the video analysis was ambiguous. Visual inspection of the five graphs clearly reveals that the GCL is strongly activated during lip grooming, whereas during head grooming (in which there is no lip contact) activity falls close to background levels.
Fig. 4.

GCL multiunit responses during the grooming behavior of five different rats. All data are filtered between 1400 and 4200 Hz. For each rat, the black traces are GCL responses during grooming. The gray superimposed rectangles represent threshold levels established from same-session recordings of background GCL activity from the same electrode. Thick lines above and below thetraces indicate periods of lip and head grooming, respectively.
The difference in GCL activity levels during head grooming and lip grooming was quantified by calculating the percentage of the signal that exceeded background levels in each behavioral condition. For these calculations, we used the envelope of the signals, as described in Materials and Methods. For each rat, a threshold was established at the mean plus 3 SDs of the low-passed envelope of the background activity. Again, at this level, the probability that background will exceed the threshold is <0.3%. Figure 5 shows the percentage of the signal exceeding this threshold during head grooming and lip grooming for each rat. On average, activity during lip grooming exceeded threshold over three times more than during head grooming.
Fig. 5.

Percentage of the signal during head grooming (HG) and lip grooming (LG) that exceeds the mean plus 3 SDs of the low-pass-filtered envelope of the GCL background activity.
GCL responses during ingestive behavior: palpation chewing and raised-head chewing
Many studies have suggested that the extensive perioral representations in the lateral hemispheres and lateral (dentate) nucleus of the cerebellum subserve the control of ingestive behavior (Woodson and Angaut, 1984; Buisseret-Delmas and Angaut, 1989a; Cicirata et al., 1989; Welsh et al., 1995). To test this idea, we analyzed our neural and video data as rats sat freely eating in the recording chamber. The eating behavior of the rat provides an ideal opportunity to isolate jaw movements from perioral tactile stimulation. As shown in Figure 6, eating behavior is easily classified into two phases, which we call “raised-head chewing” and “palpation chewing.” During raised-head chewing (Fig.6A), the animal's head is raised above the food, and the lips make no direct contact with the food pellet. In contrast, during palpation chewing (Fig. 6B), the animal's head is lowered so that the perioral surfaces come in extensive contact with the food source. Throughout both types of chewing, however, the rat chews at a frequency between 4 and 7 Hz. Food palpation has been shown to be an essential component of normal rat ingestive behavior, because bilateral trigeminal deafferentation significantly impairs rats' ability to eat and drink (Jacquin and Zeigler, 1983, 1984). Video analysis in the current study showed that, during normal eating behavior, rats iterated between raised-head chewing and palpation chewing episodes approximately every 1–3 sec.
Fig. 6.
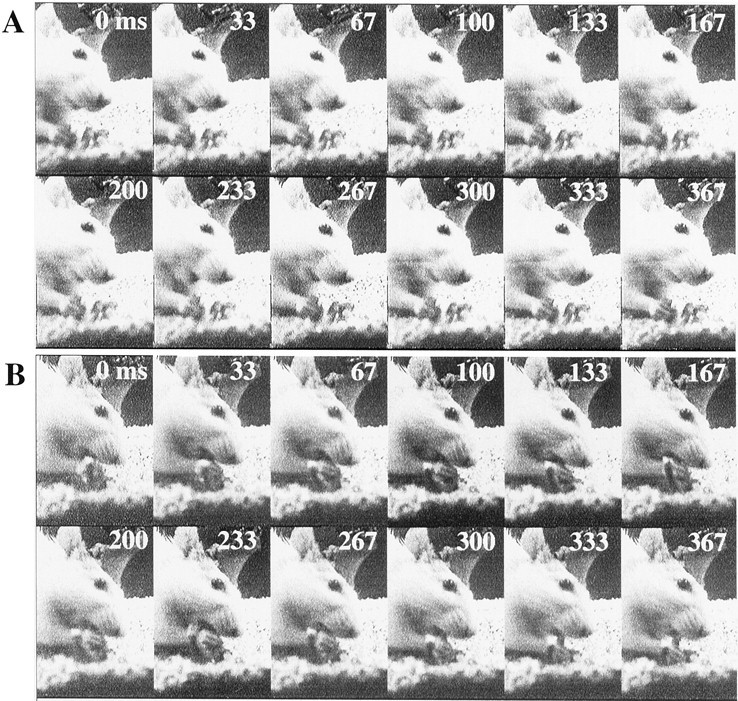
Raised-head chewing and palpation chewing.A, Twelve sequential video frames of raised-head chewing show that the mouth is maximally open at 33 and 233 msec.B, Twelve sequential video frames of a rat engaged in food palpation chewing. Note that the lips come in extensive contact with the food.
Figure 7 compares the GCL multiunit responses during eating behavior in four rats. As for grooming behavior (Fig. 4), we have superimposed gray rectangles that represent threshold levels for background activity. As before, the threshold was set at the mean plus 3 SDs of the absolute value of the high-pass-filtered background activity, which was recorded during a period of behavioral inactivity of the same rat during the same recording session. The thick black bars above the data traces indicate periods of palpation chewing, and thebars below the data traces indicate times of raised-head chewing. It can be seen that, in all four rats, the GCL is strongly activated during palpation chewing, whereas during raised-head chewing (chewing with no lip contact with the food pellet), GCL activity falls much closer to background levels.
Fig. 7.
GCL multiunit responses during the eating behavior of four different rats. All data are filtered between 1400 and 4000 Hz. For each rat, the black traces are GCL responses during eating. The gray superimposed rectangles represent threshold levels established from same-session recordings of background GCL activity from the same electrode. Thick lines above and below the traces indicate periods of palpation chewing and raised-head chewing, respectively.
As for grooming behavior, we quantified the differences between GCL activity levels during palpation chewing and raised-head chewing by calculating the percentage of the signal that exceeded background levels during each behavior. We again used the envelopes of the signals for this calculation, and the threshold was again set at the mean plus 3 SDs of the background activity level. Figure8 shows the percentage of the signal exceeding the background threshold during periods of palpation chewing and raised-head chewing for each rat. Percentages of GCL activity levels during palpation chewing exceeded the threshold three times more than during raised-head chewing.
Fig. 8.

Percentage of the signal during raised-head chewing (RC) and palpation chewing (PC) that exceeds the mean plus 3 SDs of the low-pass-filtered envelope of the GCL background activity.
Jaw movements are uncorrelated with GCL responses
Because the rat chews between 4 and 7 Hertz during both raised-head chewing and palpation chewing, the analysis presented above suggests that chewing alone cannot account for GCL activity. Instead, GCL activity is elevated only during behavioral periods when the rat's upper lip is in contact with the food pellet. One might argue, however, that regions of the GCL representing the upper lip only become active when jaw movements (chewing) are subject to feedback control using perioral tactile input. To further distinguish between the influence of pure tactile input on GCL responses and the significance of jaw movements per se, we quantified the correlation between jaw movements and GCL activity by measuring jaw angle in successive video fields (16.67 msec resolution).
The top trace in Figure9A shows jaw angle data obtained during a continuous 12 sec eating sequence that contained several alternating episodes of raised-head chewing and palpation chewing. Palpation chewing episodes are indicated by the thick bars at the top the figure, and raised-head chewing episodes are indicated by the thick bars at thebottom of the figure. The bottom traces of Figure9A show the GCL multiunit activity recorded simultaneously with the behavioral data. The black trace is the multiunit data filtered between 1400 and 4200 Hz, and the white trace(superimposed) is the envelope of this data, filtered between 0.25 and 20 Hz. As described above, there is considerably more GCL activity during periods of palpation chewing than during raised-head chewing.
As a first attempt to separate the influence of jaw position from the GCL responses attributable to tactile stimulation alone, we performed a cross-correlation between the jaw angle trace and the envelope of the GCL multiunit activity (both filtered at 0–20 Hz). The correlation coefficient was moderately high (0.42), indicating that the traces were to some degree correlated. However, interpretation of this result is confounded by the fact that the 4–7 hertz jaw movements during palpation chewing are also likely to result in activation of the upper lip tactile receptors, blurring the distinction between movement-related sensory input and sensory-related movements (Bower, 1997a,b). As we have already noted, however, jaw movements consistently take place between 4 and 7 Hz, whereas iterations between periods of tactile input (i.e., between periods of raised-head chewing and palpation chewing) occur at lower frequencies. We therefore separately examined the correlations between the high-frequency components of the jaw angle (4–7 Hz) and the GCL activity, and the low-frequency components of the jaw angle (0.25–4 Hz) and the GCL activity.
Figure 9B compares the behavioral (jaw angle) and neural data filtered between 4 and 7 Hz. A correlation analysis between these two records shows a very low correlation value (0.04). In contrast, Figure 9C compares both types of data when filtered between 0.25 and 4 Hz. In this case, a high correlation is obtained between the two traces (0.61). These results demonstrate that the GCL correlate to rhythmic chewing is insignificant, and the positive correlation between the jaw angle data and the envelope of the GCL activity instead reflects the alternating episodes of raised-head chewing and palpation chewing. Thus, for both grooming and ingestion, there is no evidence that GCL responses directly reflect the detailed structure of the movements themselves.
Having ruled out direct motor responses, we next searched specifically for modulation of the tactile GCL responses by ongoing jaw movements. We compared the correlation between the 4–7 Hz components of the jaw angle and the GCL activity during both raised-head chewing and palpation chewing. If the GCL responses are related to the control of jaw movements, one would expect a larger correlation between jaw angle and GCL activity during palpation chewing, when the upper lip is in contact with the food and tactile information is thus available to regulate chewing. However, we found no significant difference in the correlation coefficient between jaw angle and GCL during palpation chewing (0.01) and during raised-head chewing (−0.07). Neither phase of eating behavior produced significant correlations.
Finally, we examined the possibility that GCL activity was correlated with movement extremes (movement endpoints). If high GCL activity levels occurred both when the jaw was completely closed and when the jaw was completely open, then a simple correlation between the neural and behavioral data would be approximately zero, although the position of the jaw was (bimodally) correlated with GCL activity. This possibility was eliminated by the analysis shown in Figure9D, which compares the distribution of signal amplitude as a function of chewing and touching behaviors. The solid linein the top graph shows the distribution of GCL signal amplitude for fields in which the jaw angle was near its extremes (in the highest and lowest quartile of the jaw angle data). Thedashed line in the top graph shows the distribution of signal amplitude for fields in which the jaw angle was in the intermediate range (in the two middle quartiles of the jaw angle data). The two distributions overlap almost completely (two-tailed Student's t test; p = 0.448), and thus GCL activity is clearly not correlated with being particularly close to movement extremes.
We found a very different result when we performed the identical analysis with respect to tactile input. The solid trace in the bottom graph of Figure 9D shows the distribution of signal amplitude when the rat was touching (solid line) the food with its lips. This distribution is clearly distinguishable from the dashed trace of the same graph, which represents the distribution when the rat was not touching the food with its lips (two-tailed Student's t test; value indistinguishable from zero). When the rat was touching the food, the mean signal amplitude was >25% higher than when not touching. Together, Figure 9B–D strongly suggest that all the correlation seen between jaw angle and GCL activity during eating is attributable to the alternations between touching and not touching the food: even during food palpation, increases in GCL activity levels do not correlate with chewing movements.
The analysis presented above leaves open one final possibility. In the example presented in Figure 9A–D, the rat tended to have its jaw open more during palpation chewing than during raised-head chewing. This might seem to suggest that GCL activity could simply correlate with jaw angle. To eliminate this possibility, we performed a field-by-field analysis of eating behavior of a second rat, as shown in Figure 9E. As in Figure 9A, the bottom black trace is the multiunit GCL data filtered between 1400 and 4200 Hz, and the white trace, superimposed, represents the low-pass-filtered envelope of that activity. Thetop trace of Figure 9E is the jaw angle, as measured during the video analysis. Also as before, black bars above the traces indicate times when the rat was clearly seen to be palpating the food, whereas black barsbelow the traces indicate times when there was no tactile contact. Visual inspection clearly shows that the levels of GCL activity correlate strongly with tactile input and not with jaw angle itself. This result was further confirmed by our analysis of exploratory behavior (see next section), in which the rat usually explored with its mouth closed.
Comparison of GCL responses during exploration with those seen during grooming and ingestion
Having assessed the relationship between GCL activity and each different type of behavior individually, we next performed several analyses to compare GCL activity between behaviors. Representativetraces of GCL activity during the grooming, eating, and exploratory behaviors of one rat are shown in Figure10. As in Figures 4 and 7, the overlaidgray rectangles represent threshold levels (mean + 3 SD) of background activity. The thick black lines above each behavioral trace indicate the times during which the upper lip was definitely in contact with an external object. Inspection of the three representative traces suggests that palpation and tactile exploration induce more continuous bursts of GCL activity than does grooming and that these bursts are slightly larger in amplitude.
Fig. 10.

Comparison of activity levels during grooming, eating, and exploratory behaviors. Thick bars above eachtrace indicate periods of definite tactile contact with the upper lip, as determined by video analysis. All data are taken from the same rat during the same recording session. The gray superimposed rectangles represent threshold levels established from same-session recordings of background GCL activity from the same electrode. Calibration: 50 μV.
The relative amounts of GCL activity induced during grooming, eating, and free exploration are compared quantitatively in three different ways in Figure 11. Figure11A shows the proportion of time that the GCL activity exceeded background levels (again set at the mean plus 3 SDs of the background activity level) as a function of the fraction of time that the lip received tactile input. Over all behaviors, the data were divided into 2 sec episodes, and the video was scored to determine the fraction of tactile input during that episode. For example, a single 20 sec grooming bout would be divided into 10 2 sec episodes. Some of those 2 sec episodes would involve lip contact almost 100% of the time, whereas others would involve lip contact only a small percentage of the time. Similarly, a single bout of exploration contains many 2 sec episodes that involve extensive lip contact but other 2 sec episodes in which there is very little lip contact. Across all behaviors, it is clear that the amount of GCL activity directly correlates with the fraction of time that the lip receives tactile input, as illustrated in Figure 11A.
Fig. 11.

Comparison of GCL bursts during grooming, eating, and exploratory behaviors. A, Regardless of behavioral context, the percentage of GCL activity above background scaled linearly with the percentage of the time that the lip received tactile input. B, Histograms of the duration of GCL bursts during periods of tactile contact during the different behaviors. C, Comparison of the GCL burst amplitude of the low-passed envelope over different behaviors. For each behavior, each gray dot represents the average burst amplitude during a period of tactile contact. The averages of these amplitudes are shown as horizontal lines for each behavior, and the SEs of these averages are depicted by the length of the vertical lines.
Figure 11B compares between behaviors the average length of time that bursts of GCL activity stayed above the background level. Grooming behavior results in some bursts that are continuous up to 800 msec, but most bursts lasted only 100–300 msec. This is consistent with the fairly punctate stimulation of the lip created by the rhythmic contact of the paws with the lip. In contrast, both palpation chewing and tactile exploration resulted in many sustained bursts of GCL activity, some lasting longer than 1 sec. On average, palpation chewing and exploration bursts were >50% longer than the bursts induced by grooming.
Finally, we found that the amplitude of the GCL bursts was, on average, >10% higher during active palpation and exploration than during grooming and passively delivered external stimulation (see Materials and Methods). This result was confirmed for all rats for which data were available for all behaviors (n = 4). Figure11C shows the average burst amplitude during periods of contact during each behavior. Each gray dot is the average burst amplitude during a period of tactile stimulation. The mean value of these amplitudes, over several periods of tactile stimulation, is indicated as a horizontal line for each behavior. The SD is represented by the length of the vertical line intersecting the mean value, forming a cross. It is clear that the average burst amplitude is much larger during palpation chewing and exploration than during grooming and stimulation (two-tailed Student's ttest; p < 0.0002).
Comparison of receptive field extent and response amplitude over different behaviors
Given that the GCL responses appeared to be sensory, we next wanted to compare these responses with those found in other areas of the rat nervous system (Simons and Carvell, 1989; Nicolelis and Chapin, 1994). We were specifically interested in examining the location and spatial extent of the GCL receptive field across different behavioral states and then comparing these results with the kinds of receptive fields seen in other brain areas.
As discussed above, the central region of Crus IIa was specifically chosen for this study because it always represents the ipsilateral upper lip in normal rats (Bower and Kassel, 1990). We have shown previously that the GCL receptive fields in this region are similar in both anesthetized and decerebrate animals (Bower and Woolston, 1983;Bower and Kassel, 1990). We therefore wanted to determine whether the receptive fields identifiable in response to passive stimulation were similar to or different from the receptive fields evident during active behaviors, and whether receptive field characteristics were modulated with behavior or movement.
Figure 12 compares the receptive field for a single GCL location determined during several different behavioral and movement states. These results were also qualitatively confirmed in the remaining five rats. Figure 12Ashows the outline of the receptive field recorded following electrode penetration in the initial surgical procedure under general anesthesia. Figure 12B shows the receptive field obtained in the same rat, now awake, using a passive mechanical stimulus. In this and subsequent figures, colored points representing the amplitude of the low-passed envelope of the multiunit GCL activity have been placed on the image of the rat at the stimulus location that evoked the response. External tactile stimuli were presented to several ipsilateral and contralateral locations on the head of the animal. Consistent with the previous GCL mapping studies mentioned above, the receptive field in the awake animal was located exclusively on ipsilateral (left) upper lip, as indicated by the red andyellow points. Tactile stimulation delivered to the contralateral (right) lip, snout, or cheek did not result in GCL activity that exceeded background levels.
Figure 12, C and D, illustrates the receptive fields that emerge during active behaviors resulting in self-generated tactile stimulation. Figure 12C shows data represented in an identical way as in Figure 12B, but the receptive field was determined using a field-by-field video analysis of 14 sec of grooming behavior. In each video field, the position of the left paw relative to the rat's face was carefully determined, and apoint representing the amplitude of GCL activity for that field was placed in the corresponding location on rat's face.Points that are off of the skin represent GCL activity during periods when the paw was moving between skin locations. As in the case for externally generated tactile stimulation, the receptive field again appears as the caudal portion of the rat's left upper lip.
Finally, Figure 12D represents GCL activity levels when the rat was engaged in active tactile exploration using perioral structures. We first defined nine distinct spatial locations on the rat's face, as shown in Figure 12D. Next, we examined several hours of video, taken over 2 d, to determine how and when each of these locations came in contact with objects during exploratory behaviors. Ninety-nine video fields were selected for more detailed analysis. We deliberately selected fields in which the defined facial surfaces were used in different combinations with each other. In this way, we almost certainly underestimated the number of fields in which all perioral surfaces were used simultaneously but are more likely to have covered the full range of combinations of surfaces used during exploration. As in Figure 12, B and C, we next determined the amplitude of GCL activity for each video field. Thecolor of each point in Figure12D represents the ratio of the average GCL amplitude for video fields in which that spatial location was used, to the average GCL amplitude for video fields in which that spatial location was not used. As seen for grooming and external stimulation, this analysis clearly establishes the left caudal upper lip (location 9) as the peak of GCL activation. High values at spatiallocations 1–3 and 8 reflect the fact that these locations were almost always used in conjunction with location 9 during exploration.
In summary, for all behaviors analyzed, this location of the Crus IIa GCL always responded to tactile contact on the same region of the ipsilateral upper lip. Neither the location nor the spatial extent of the GCL receptive field appear to be substantially modulated by behavioral state or by the type of movements involved in these different behaviors.
DISCUSSION
Caveats and experimental limitations
What is the source of the electrical activity recorded in the GCL?
In this paper, we have recorded multiunit activity in the cerebellar GCL rather than recording activity from single granule cells. As discussed in previous publications (Shambes et al., 1978;Bower and Kassel, 1990; Morissette and Bower, 1996), the small size of granule cells precludes the isolation of action potentials even in the anesthetized animal. It is therefore likely that electrical signals reflecting granule cell activation are mixed with signals reflecting action potentials from mossy fiber terminal branches, higher frequency components of mossy fiber postsynaptic potentials, as well as action potentials from other cells types, including Golgi cells. However, in the current study, we have specifically analyzed the high-frequency (1400–4200 Hz) components of the multiunit recordings so as to minimize the contribution of lower frequency “field potentials” to the signal. Our confidence that a large component of this high-frequency activity reflects direct granule cell activation comes from our previous demonstration that these responses predict the spatial location of Purkinje cells that respond at short latency to peripheral tactile input (Bower and Woolston, 1983; Jaeger and Bower, 1994; Gundappa-Sulur et al., 1999). Because these short-latency responses can only be generated by granule cell activation, we believe the high-frequency multiunit GCL activity analyzed here directly reflects the activity relayed from mossy fibers through granule cells to Purkinje cells. Regardless of the exact electrical sources of the signal, however, it is clear that our multiunit data reflect the information that is available at the mossy fiber–granule cell input layer and thus the information processed by cerebellar cortical circuitry.
Quantifying sensory and motor behavior
The results presented in this study are the first published recordings from the GCL of awake, freely behaving animals. The primary objective of this study was to examine during natural behavior the relationships between perioral movements, tactile stimulation of perioral surfaces, and high-frequency activity in the Crus IIa GCL. In principle, numerous techniques are available to monitor both perioral contact and the movements associated with perioral-related behavior. For example, it might be possible to instrument the lip of the rat to record peripheral contact or to record EMG activity from perioral muscles. However, a major objective of this study was to examine neuronal activity during movements that were as natural and unconstrained as possible. It was our judgment that fully instrumenting the rat's face for quantitative measurements of sensory and/or motor events would have significantly disrupted natural behavior patterns. Accordingly, we developed techniques to quantifiably relate video images to recorded neuronal data (Rasnow et al., 1997; Hartmann et al., 2000). Although video is an indirect measure of both tactile contact and movement parameters, the analysis in this paper demonstrates that it is possible to make quantitative comparisons between carefully scored video images and neuronal activity.
GCL responses do not appear to be related to movement or motor parameters
Applying our video analysis techniques, we found that the 1400–4200 Hz GCL responses in Crus IIa of the awake rat are directly related to tactile contact with the upper lip and do not appear to be correlated with large-scale motor behavior. The GCL responded regardless of whether the tactile stimulus was externally or self-generated and regardless of whether something touched the lip or the lip touched something. Under all of the observed behaviors (external stimulation, grooming, eating, and exploration), the 1400–4200 Hz component of the Crus IIa GCL response was most directly related to tactile stimulation of perioral surfaces and not to any measurable aspect of limb, body, jaw, or head movements. Although we specifically looked for motor-related activity in the cerebellar GCL under as natural behavioral conditions as possible, we found no evidence in the responses that any direct information is provided to the recorded regions of Crus IIa about the timing, amplitude, direction, velocity, or other parameters of the movements associated with each behavior. For example, during grooming, GCL responses are only seen when the forepaw makes tactile contact with the upper lip. Similarly, during palpation chewing, GCL responses are only seen when the animal's upper lip is in direct contact with the food pellet. During raised-head chewing, there is very little GCL activity, although the animal chews with similar amplitude and frequency as during palpation chewing. Because jaw opening muscles are known to contain muscle spindles (Donga and Dessem, 1993), the fact that no correlation was observed between GCL activity and the parameters of jaw movement (Fig. 9) suggests that this proprioceptive information is not conveyed to this region of Crus IIa.
EMG recordings will clearly be required to absolutely rule out the presence of any motor signals or motor modulation in Crus IIa GCL activity. The preponderance of evidence, however, points to the absence of such signals in the Crus IIa GCL. Instead, during any particular behavior, the amount of GCL activity scales directly with the amount of tactile contact to the upper lip. Thus, tactile palpation and exploration, both of which involve near-continuous contact of the upper lip with external objects, result in the longest duration bursts of activity within the GCL. The GCL multiunit response amplitude is also largest during active palpation and exploration and lower during grooming and stimulation.
Implications for cerebellar cortical processing
Mossy fiber inputs to Crus IIa
It is well established that Crus IIa receives direct mossy fiber projections from the trigeminal nuclei (Watson and Switzer, 1978;Woolston et al., 1981; Welker, 1987). Both anatomical and physiological studies have shown that this direct cerebellar projection is isolated from the trigeminal projections to ventrobasal thalamus and to the superior colliculus [Woolston et al., 1981: Huerta et al., 1983;Steindler, 1985 (mouse); Mantle-St. John and Tracey, 1987]. It has been suggested that this strict segregation serves to ensure that the direct trigeminal projection to cerebellum is unaffected by descending control from S1 (Mantle-St. John and Tracey, 1987).
In addition to the direct trigeminal projection, the Crus IIa GCL also receives projections from S1 via the pontine nuclei (Wise and Jones, 1977; Bower et al., 1981; Mihailoff, 1983; Mihailoff et al., 1985;Morissette and Bower, 1996; Leergaard et al., 2000). Thus, although the direct trigeminocerebellar projection is likely be kept free of cortical modulation, there is then ample opportunity for cortical modulation to occur within the Crus IIa GCL. The clear and robust tactile responses in the GCL during all behaviors are consistent with a direct, unmodulated trigeminal projection to the Crus IIa GCL. However, the fact that the tactile responses were larger when the lip was actively used than when passively touched may be a result of S1 modulation (Bower, 1997a,b). The influence of S1 on the direct granule cell responses is currently under investigation (Hartmann, 2000).
Significance for the output layer: what information do Purkinje cells receive?
As discussed above, the multiunit data presented in this study reflect the information that is available to Crus IIa Purkinje cells via the mossy fiber–granule cell pathway, and this information is, by all measures, sensory (tactile). For these regions of cerebellar cortex to contribute directly to motor control, some aspect of movement parameters presumably must be available to Purkinje cells. A second possible pathway for nontactile input to reach Purkinje cells is the climbing fiber system, which originates in the inferior olivary nucleus (IO).
A previous study in unanesthetized but restrained rats suggested that climbing fibers in Crus IIa specifically provide timing information about perioral movements (Welsh et al., 1995). In the current study, we did not record from climbing fibers, but earlier studies have shown that the climbing fiber projections from these regions of the IO are tactile (Cook and Wiesendanger, 1976). More specifically, the climbing fibers in Crus IIa have been shown in the anesthetized rat to have the same receptive fields as the underlying GCL (Brown and Bower, 2001). Consistent with these physiological observations, it has also been shown that tactile trigeminocollicular projections collateralize to the regions of the IO that in turn project to Crus IIa (Huerta et al., 1983).
In addition, the studies of Gellman et al. (1983, 1985) in cats have demonstrated that the portions of the IO projecting to Crus IIa respond to tactile stimulation of the forepaws and that the responses occurred most often during exploratory behaviors (Gellman et al., 1985). Although additional study of climbing fiber responses under natural behavioral conditions will clearly be necessary, the data reported here, and the similarity in climbing fiber and mossy fiber perioral tactile receptive fields (Brown and Bower, 2001), would predict that results in the rat and cat may be similar.
Finally, Purkinje cells in rat Crus IIa project to a region of the lateral nucleus known as the dorsolateral hump (DLH), an expansion not found in higher mammals, which contains perioral representations (Buisseret-Delmas and Angaut, 1989a,b). Previous studies have interpreted the absence of the DLH in higher mammals as suggesting that this structure processes information of a primitive variety (Buisseret-Delmas and Angaut, 1989a). In contrast, as will be discussed below, we suggest that the most plausible neuroethological explanation is that the large DLH in rats represents a specialization in animals using perioral regions for exploratory behaviors.
Functional significance
Together, the available data both from our laboratory (current study; Brown and Bower, 2001) and others (Gellman et al., 1983, 1985;Welsh et al., 1995) all point toward the idea that both the mossy and climbing fiber systems transmit tactile information from regions of the animal most specialized for exploratory behavior. These results have three important implications, discussed in detail below. First, it becomes important to compare and contrast these cerebellar sensory responses with those seen in other somatosensory areas of the brain. Second, the results suggest that cerebellar responses previously thought to reflect movement “error” may need to be reevaluated. Third, we argue that these results suggest that these regions of the cerebellum are not involved with motor control directly but rather in a computation concerned with the sensory data itself.
Comparing cerebellar responses with those found in other brain areas
Given our finding that the mossy fiber–granule cell system in Crus IIa conveys tactile, sensory information, it seems reasonable to compare our responses with those reported in the ventral posterior medial nucleus of the thalamus (VPM), the central pathway to S1. Several recording studies in VPM of awake rats have demonstrated that single cells with whisker-related receptive fields exhibit dynamic spatiotemporal shifts (Nicolelis and Chapin, 1994). Our use of multiunit recording techniques and relatively slow video sampling rates do not allow us to address the issue of dynamic changes at the single cell level. Instead, our responses reflect population activity integrated over tens of milliseconds of poststimulus time and therefore can be assumed to define the maximal spatial extent of receptive fields in our recording locations.
With this assumption, our data share with neurons in VPM the property that the location of the receptive field is similar, regardless of whether the animal is anesthetized or awake, but appears to be slightly larger in the awake state (current study; Nicolelis and Chapin, 1994). In addition, the size and location of the cerebellar GCL receptive fields closely resemble the fairly circumscribed receptive fields of VPM cells responsive to the rostral whiskers. In contrast, we never found GCL regions with the extremely large receptive fields (up to 20 whiskers) characteristic of VPM cells responsive to the more caudal whiskers.
Based on the similarity to the rostral-responding VPM cells, we predict that the GCL receptive fields should exhibit only a weak temporally dynamic structure (cf. Nicolelis and Chapin, 1994). This suggestion is consistent with the fact that the 1400–4200 Hz GCL responses were confined to the small microvibrissae of the upper lip and did not show robust responses to the large macrovibrissae (cf. Brecht et al., 1997). Based on studies ongoing in our laboratory (Hartmann, 2000) as well as other reports (Carvell and Simons, 1990; Brecht et al., 1997), these microvibrissae may play a different role in active-sensing and exploratory behaviors and may therefore not need to possess the caudorostral spatiotemporal shifts characteristic of the more caudal whiskers.
Significance for the interpretation of movement error responses
The historical emphasis of cerebellar theories on motor control and coordination (Walker et al., 2000) has led many investigators to assume that cerebellar responses reflect motor-related parameters, such as position, velocity, or movement error (Strick, 1983; Fortier et al., 1989; Ojakangas and Ebner, 1992; Fu et al., 1997; Kitazawa et al., 1998). Thus, the majority of such studies have not quantified the purely tactile component of the responses, on the assumption that all events are motor related (Schieber and Thach, 1985; Schwartz et al., 1987; Lou and Bloedel, 1992; Thach et al., 1992). Many of these studies have also required an animal to make a repetitive, overlearned movement that is then occasionally interrupted by a jolting perturbation (Gilbert and Thach, 1977; Thach, 1980; Schwartz et al., 1987; Lou and Bloedel, 1992). In these cases, the recorded cerebellar responses have been interpreted as “motor error” signals, despite the fact that it has been known for many years that there are extensive tactile projections to these same cerebellar regions (Dow and Anderson, 1942;Snider and Stowell, 1942; Welker, 1987). The results reported here suggest that it is equally likely that these recordings reflect simple tactile sensory responses to the jolting stimulus. Without more careful study of the nature of the tactile response, it would seem inappropriate to simply assume that the signals specifically serve as indications of erroneous or disrupted movement.
What are these sensory data used for?
Our finding that the signals entering Crus IIa via the mossy fiber–granule cell pathway are primarily tactile does not rule out the possibility that these sensory signals are later converted to or used to generate motor control commands that ensure smooth and accurate movement. However, we believe that the weight of the evidence is starting to grow for the involvement of this region of the cerebellum in a function that is more related to the sensory data itself than to the use of the sensory data to generate smooth or coordinated movement (Gellman et al., 1983, 1985; Bower and Kassel, 1990; Bower, 1997a,b).
First, the analysis reported here has failed to reveal any clear motor-related signals in the high-frequency GCL responses known to result in Purkinje cell output (Bower and Woolston, 1983). Second, we have shown recently that climbing fiber and mossy fiber receptive fields of Purkinje cells in this region of the cortex are similar, both reflecting tactile activation of the sensory periphery (Brown and Bower, 2001). Third, in a direct test of our “sensory” hypothesis (Bower, 1997a,b), we have shown that the dentate cerebellar nucleus of humans is more active when the fingers are actively involved in tactile sensory exploration than during fine finger movements alone (Gao et al., 1996). A more recent imaging study has extended this result to the human red nucleus and inferior olive (Liu et al., 2000). Consistent with these results in humans, the current study in rats has shown that GCL responses in regions of cerebellar cortex projecting to the lateral nucleus (Buisseret-Delmas and Angaut, 1989b) are larger and more continuous during behaviors that involve active tactile palpation and exploration than during grooming or passive stimulation. As in the human finger studies, jaw movements during raised-head chewing (when the lips are not seeking or receiving tactile sensory data) fail to generate significant GCL activity. Thus, in both rats and humans, activity in the lateral regions of the cerebellum appears to be more directly related to the use of peripheral structures in behaviors that involve tactile sensation than to the presence of movements involving those tactile surfaces.
Footnotes
We are very grateful to Val Mohammadi for performing the histology. This work was helped by conceptual discussions with Christine Chee-Ruiter and Chris Assad, and by technical discussions with Brian Rasnow, David Kewley, and Gary Lorden. Carolyn Chan, Kevin Neville, and Angela Poole helped in many of the behavioral recordings.
Correspondence should be addressed to Mitra Hartmann, Jet Propulsion Laboratory, California Institute of Technology, MC 303-300, 4800 Oak Grove Drive, Pasadena, CA 91109. E-mail:hartmann@brain.jpl.nasa.gov.
REFERENCES
- 1.Albus JS. A theory of cerebellar function. Math Biosci. 1971;10:25–61. [Google Scholar]
- 2.Berridge KC, Fentress JC. Contextual control of trigeminal sensorimotor function. J Neurosci. 1986;6:325–330. doi: 10.1523/JNEUROSCI.06-02-00325.1986. [DOI] [PMC free article] [PubMed] [Google Scholar]
- 3.Berridge KC, Fentress JC. Deafferentation does not disrupt natural rules of action syntax. Behav Brain Res. 1987;23:69–76. doi: 10.1016/0166-4328(87)90243-9. [DOI] [PubMed] [Google Scholar]
- 4.Bhalla US, Bower JM. Multiday recordings from olfactory bulb neurons in awake freely moving rats: spatially and temporally organized variability in odorant response properties. J Comp Neurosci. 1997;4:221–256. doi: 10.1023/a:1008819818970. [DOI] [PubMed] [Google Scholar]
- 5.Bloedel JR. Functional heterogeneity with structural homogeneity: how does the cerebellum operate. Behav Brain Sci. 1992;15:666–678. [Google Scholar]
- 6.Bower JM. Is the cerebellum sensory for motor's sake, or motor for sensory's sake: the view from the whiskers of a rat? Prog Brain Res. 1997a;114:463–496. doi: 10.1016/s0079-6123(08)63381-6. [DOI] [PubMed] [Google Scholar]
- 7.Bower JM. The cerebellum and the control of sensory data acquisition. In: Schmahmann J, editor. International review of neurobiology, Vol 41, The cerebellum and cognition. Academic; San Diego: 1997b. pp. 489–513. [DOI] [PubMed] [Google Scholar]
- 8.Bower JM, Kassel J. Variability in tactile projection patterns to cerebellar folia crus IIa of the norway rat. J Comp Neurol. 1990;302:768–778. doi: 10.1002/cne.903020409. [DOI] [PubMed] [Google Scholar]
- 9.Bower JM, Woolston DC. Congruence of spatial organization of tactile projections to granule cell and purkinje cell layers of cerebellar hemispheres of the albino rat: vertical organization of cerebellar cortex. J Neurophysiol. 1983;49:745–766. doi: 10.1152/jn.1983.49.3.745. [DOI] [PubMed] [Google Scholar]
- 10.Bower JM, Beerman DH, Gibson JM, Shambes GM, Welker W. Principles of organization of a cerebro-cerebellar circuit. Micromapping the projections from cerebral (S1) to cerebellar (granule cell layer) tactile areas of rats. Brain Behav Evol. 1981;18:1–18. doi: 10.1159/000121772. [DOI] [PubMed] [Google Scholar]
- 11.Brecht M, Preilowski B, Merzenich MM. Functional architecture of the mystacial vibrissae. Behav Brain Res. 1997;84:81–97. doi: 10.1016/s0166-4328(97)83328-1. [DOI] [PubMed] [Google Scholar]
- 12.Brown IE, Bower JM. Congruence of mossy fiber and climbing fiber tactile projections in the lateral hemispheres of the rat cerebellum. J Comp Neurol. 2001;429:59–70. doi: 10.1002/1096-9861(20000101)429:1<59::aid-cne5>3.0.co;2-3. [DOI] [PubMed] [Google Scholar]
- 13.Buisseret-Delmas C, Angaut P. Sagittal organization of the olivocerebellonuclear pathway in the rat. III. Connections with the nucleus dentatus. Neurosci Res. 1989a;7:131–143. doi: 10.1016/0168-0102(89)90053-9. [DOI] [PubMed] [Google Scholar]
- 14.Buisseret-Delmas C, Angaut P. Anatomical mapping of the cerebellar nucleocortical projections in the rat: a retrograde labeling study. J Comp Neurol. 1989b;288:297–310. doi: 10.1002/cne.902880208. [DOI] [PubMed] [Google Scholar]
- 15.Carvell GE, Simons DJ. Biometric analyses of vibrissal tactile discrimination in the rat. J Neurosci. 1990;10:2638–2648. doi: 10.1523/JNEUROSCI.10-08-02638.1990. [DOI] [PMC free article] [PubMed] [Google Scholar]
- 16.Cicirata F, Angaut P, Panto MR, Serapide MF. Neocerebellar control of the motor activity: experimental analysis in the rat. Comparative aspects. Brain Res Rev. 1989;14:117–141. doi: 10.1016/0165-0173(89)90011-8. [DOI] [PubMed] [Google Scholar]
- 17.Cicirata F, Angaut P, Serapide MF, Panto MR, Nicotra G. Multiple representation in the nucleus lateralis of the cerebellum: an electrophysiologic study in the rat. Exp Brain Res. 1992;89:352–362. doi: 10.1007/BF00228251. [DOI] [PubMed] [Google Scholar]
- 18.Cook JR, Wiesendanger M. Input from trigeminal cutaneous afferents to neurons of the inferior olive in rats. Exp Brain Res. 1976;26:193–202. doi: 10.1007/BF00238283. [DOI] [PubMed] [Google Scholar]
- 19.Donga R, Dessem D. An unrelayed projection of jaw-muscle spindle afferents to the cerebellum. Brain Res. 1993;626:347–350. doi: 10.1016/0006-8993(93)90601-i. [DOI] [PubMed] [Google Scholar]
- 20.Dow RS, Anderson R. Cerebellar action potentials following proprioceptive and exteroceptive afferent stimulation in the rat. Fed Proc. 1942;1:22. [Google Scholar]
- 21.Dugas C, Smith AM. Responses of cerebellar purkinje cells to slip of a hand-held object. J Neurophysiol. 1992;67:483–495. doi: 10.1152/jn.1992.67.3.483. [DOI] [PubMed] [Google Scholar]
- 22.Fortier PA, Kalaska JF, Smith AM. Cerebellar neuronal activity related to whole-arm reaching movement in the monkey. J Neurophysiol. 1989;62:198–211. doi: 10.1152/jn.1989.62.1.198. [DOI] [PubMed] [Google Scholar]
- 23.Fu Q-G, Flamant D, Coltz JD, Ebner TJ. Relationship of cerebellar purkinje cell simple spike discharge to movement kinematics in the monkey. J Neurophysiol. 1997;78:478–491. doi: 10.1152/jn.1997.78.1.478. [DOI] [PubMed] [Google Scholar]
- 24.Gao J-H, Parsons LM, Bower JM, Xiong J, Li J, Fox PT. Cerebellum implicated in sensory acquisition and discrimination rather than motor control. Science. 1996;272:545–547. doi: 10.1126/science.272.5261.545. [DOI] [PubMed] [Google Scholar]
- 25.Gellman R, Houk JC, Gibson AR. Somatosensory properties of the inferior olive of the cat. J Comp Neurol. 1983;215:228–243. doi: 10.1002/cne.902150210. [DOI] [PubMed] [Google Scholar]
- 26.Gellman R, Gibson AR, Houk JC. Inferior olivary neurons in the awake cat: detection of contact and passive body displacement. J Neurophysiol. 1985;54:40–60. doi: 10.1152/jn.1985.54.1.40. [DOI] [PubMed] [Google Scholar]
- 27.Gilbert PFC, Thach WT. Purkinje cell activity during motor learning. Brain Res. 1977;128:309–328. doi: 10.1016/0006-8993(77)90997-0. [DOI] [PubMed] [Google Scholar]
- 28.Gundappa-Sulur G, DeSchutter E, Bower JM. Ascending granule cell axon: an important component of cerebellar cortical circuitry. J Comp Neurol. 1999;408:580–596. doi: 10.1002/(sici)1096-9861(19990614)408:4<580::aid-cne11>3.0.co;2-o. [DOI] [PubMed] [Google Scholar]
- 29.Hartmann MJ. PhD thesis. California Institute of Technology; 2000. The cerebellum and active somatosensation: recordings from the granule cell layer of awake, freely-behaving rats. [Google Scholar]
- 30.Hartmann MJ, Assad C, Rasnow B, Bower JM. Applications of video mixing and digital overlay to neuroethology. Methods. 2000;21:385–391. doi: 10.1006/meth.2000.1025. [DOI] [PubMed] [Google Scholar]
- 31.Hartmann WM. Signals, sound and sensation, pp 393–429. American Institute of Physics; Woodbury, NY: 1997. [Google Scholar]
- 32.Hoffer JA, O'Donovan MJ, Pratt CA, Loeb GE. Discharge patterns of hindlimb motoneurons during normal cat locomotion. Science. 1981;213:466–468. doi: 10.1126/science.7244644. [DOI] [PubMed] [Google Scholar]
- 33.Huerta MF, Frankfurter A, Harting JK. Studies of the principal sensory and spinal trigeminal nuclei of the rat: projections to the superior colliculus, inferior olive and cerebellum. J Comp Neurol. 1983;220:147–167. doi: 10.1002/cne.902200204. [DOI] [PubMed] [Google Scholar]
- 34.Jack K. Video demystified: a handbook for the digital engineer, pp 59–64. HighText; Solana Beach, CA: 1993. [Google Scholar]
- 35.Jacquin MF, Zeigler HP. Trigeminal orosensation and ingestive behavior in the rat. Behav Neurosci. 1983;97:62–97. doi: 10.1037//0735-7044.97.1.62. [DOI] [PubMed] [Google Scholar]
- 36.Jacquin MF, Zeigler HP. Trigeminal denervation and operant behavior in the rat. Behav Neurosci. 1984;98:1004–1022. doi: 10.1037//0735-7044.98.6.1004. [DOI] [PubMed] [Google Scholar]
- 37.Jaeger D, Bower JM. Prolonged responses in rat cerebellar purkinje cells following activation of the granule cell layer: an intracellular in vitro and in vivo investigation. Exp Brain Res. 1994;100:200–214. doi: 10.1007/BF00227191. [DOI] [PubMed] [Google Scholar]
- 38.Kitazawa S, Kimura T, Yin P-B. Cerebellar complex spikes encode both destinations and errors in arm movements. Nature. 1998;392:494–497. doi: 10.1038/33141. [DOI] [PubMed] [Google Scholar]
- 39.Leergaard TB, Lyngstad KA, Thompson JH, Taeymans S, Vos BP, De Schutter E, Bower JM, Bjaalie JG. Rat somatosensory cerebropontocerebellar pathways: spatial relationships of the somatotopic map of the primary somatosensory cortex are preserved in a three-dimensional clustered pontine map. J Comp Neurol. 2000;422:246–266. doi: 10.1002/(sici)1096-9861(20000626)422:2<246::aid-cne7>3.0.co;2-r. [DOI] [PubMed] [Google Scholar]
- 40.Liu Y, Pu Y, Gao J-H, Parsons LM, Xiong J, Liotti M, Bower JM, Fox PT. The human red nucleus and lateral cerebellum in cooperative roles supporting sensory discrimination. Hum Brain Mapp. 2000;10:147–159. doi: 10.1002/1097-0193(200008)10:4<147::AID-HBM10>3.0.CO;2-U. [DOI] [PMC free article] [PubMed] [Google Scholar]
- 41.Lou J-S, Bloedel JR. Responses of sagittally aligned purkinje cells during perturbed locomotion: relation of climbing fiber activation to simple spike modulation. J Neurophysiol. 1992;68:1820–1833. doi: 10.1152/jn.1992.68.5.1820. [DOI] [PubMed] [Google Scholar]
- 42.Mantle-St. John L, Tracey DJ. Somatosensory nuclei in the brainstem of the rat: independent projections to the thalamus and cerebellum. J Comp Neurol. 1987;255:259–271. doi: 10.1002/cne.902550209. [DOI] [PubMed] [Google Scholar]
- 43.Marr D. A theory of cerebellar cortex. J Physiol (Lond) 1969;202:437–470. doi: 10.1113/jphysiol.1969.sp008820. [DOI] [PMC free article] [PubMed] [Google Scholar]
- 44.Mihailoff GA. Intra- and interhemispheric collateral branching in the rat pontocerebellar system, a fluorescence double-label study. Neuroscience. 1983;10:141–160. doi: 10.1016/0306-4522(83)90088-x. [DOI] [PubMed] [Google Scholar]
- 45.Mihailoff GA, Lee H, Watt CB, Yates R. Projections to the basilar pontine nuclei from face sensory and motor regions of the cerebral cortex in the rat. J Comp Neurol. 1985;237:251–263. doi: 10.1002/cne.902370209. [DOI] [PubMed] [Google Scholar]
- 46.Morissette J, Bower JM. Contribution of somatosensory cortex to responses in the rat cerebellar granule cell layer following peripheral tactile stimulation. Exp Brain Res. 1996;109:240–250. doi: 10.1007/BF00231784. [DOI] [PubMed] [Google Scholar]
- 47.Nicolelis MAL, Chapin JK. Spatiotemporal structure of somatosensory responses of many-neuron ensembles in the rat ventral posterior medial nucleus of the thalamus. J Neurosci. 1994;14:3511–3532. doi: 10.1523/JNEUROSCI.14-06-03511.1994. [DOI] [PMC free article] [PubMed] [Google Scholar]
- 48.Ojakangas CL, Ebner TJ. Purkinje cell complex and simple spike changes during a voluntary arm movement learning task in the monkey. J Neurophysiol. 1992;68:2222–2236. doi: 10.1152/jn.1992.68.6.2222. [DOI] [PubMed] [Google Scholar]
- 49.Paulin MG. The role of the cerebellum in motor control and perception. Brain Behav Evol. 1993;41:39–50. doi: 10.1159/000113822. [DOI] [PubMed] [Google Scholar]
- 50.Paxinos G, Watson C. The rat brain in stereotaxic coordinates. Academic; New York: 1982. [DOI] [PubMed] [Google Scholar]
- 51.Rasnow B, Assad C, Hartmann MJ, Bower JM. Applications of multimedia computers and video mixing to neuroethology. J Neurosci Methods. 1997;76:83–89. doi: 10.1016/s0165-0270(97)00086-1. [DOI] [PubMed] [Google Scholar]
- 52.Rispal-Padel L, Cicirata F, Pons C. Cerebellar nuclear topography of simple and synergistic movements in the alert baboon (Papio papio). Exp Brain Res. 1982;47:365–380. doi: 10.1007/BF00239355. [DOI] [PubMed] [Google Scholar]
- 53.Schieber MH, Thach WT. Trained slow tracking. II. Bidirectional discharge patterns of cerebellar nuclear, motor cortex, and spindle afferent neurons. J Neurophysiol. 1985;54:1228–1270. doi: 10.1152/jn.1985.54.5.1228. [DOI] [PubMed] [Google Scholar]
- 54.Schwartz AB, Ebner TJ, Bloedel JR. Responses of interposed and dentate neurons to perturbations of the locomotor cycle. Exp Brain Res. 1987;67:323–338. doi: 10.1007/BF00248553. [DOI] [PubMed] [Google Scholar]
- 55.Shambes GM, Gibson JM, Welker W. Fractured somatotopy in granule cell tactile areas of rat cerebellar hemispheres revealed by micromapping. Brain Behav Evol. 1978;15:94–140. doi: 10.1159/000123774. [DOI] [PubMed] [Google Scholar]
- 56.Simons DJ, Carvell GE. Thalamocortical response transformation in the rat vibrissa/barrel system. J Neurophysiol. 1989;61:311–330. doi: 10.1152/jn.1989.61.2.311. [DOI] [PubMed] [Google Scholar]
- 57.Snider RS, Stowell A. Evidence of a representation of tactile sensibility in the cerebellum of the cat. Fed Proc. 1942;1:82. [Google Scholar]
- 58.Steindler DA. Trigeminocerebellar, trigeminotectal, and trigeminothalamic projections: a double retrograde axonal tracing study in the mouse. J Comp Neurol. 1985;237:155–175. doi: 10.1002/cne.902370203. [DOI] [PubMed] [Google Scholar]
- 59.Strick PL. The influence of motor preparation on the response of cerebellar neurons to limb displacements. J Neurosci. 1983;3:2007–2020. doi: 10.1523/JNEUROSCI.03-10-02007.1983. [DOI] [PMC free article] [PubMed] [Google Scholar]
- 60.Thach WT. Complex spikes, the inferior olive, and natural behavior. In: Courville J, editor. The inferior olivary nucleus: anatomy and physiology. Raven; New York: 1980. pp. 349–360. [Google Scholar]
- 61.Thach WT, Goodkin HP, Keating JG. The cerebellum and the adaptive coordination of movement. Annu Rev Neurosci. 1992;15:403–442. doi: 10.1146/annurev.ne.15.030192.002155. [DOI] [PubMed] [Google Scholar]
- 62.Vincent SB. The tactile hair of the white rat. J Comp Neurol. 1913;23:1–36. [Google Scholar]
- 63.Walker MS, Bower JM, Parsons LM. A brief history of theories of cerebellum. Soc Neurosci Abstr. 2000;26:30. [Google Scholar]
- 64.Watson CRR, Switzer RC. Trigeminal projections to cerebellar tactile areas in the rat: origin mainly from n. interpolaris and n. principalis. Neurosci Let. 1978;10:77–82. doi: 10.1016/0304-3940(78)90015-0. [DOI] [PubMed] [Google Scholar]
- 65.Welker W. New concepts in cerebellar neurobiology. Liss; New York: 1987. Spatial organization of somatosensory projections to granule cell cerebellar cortex: functional and connectional implications of fractured somatotopy (summary of Wisconsin studies). pp. 239–280. [Google Scholar]
- 66.Welker WI. Analysis of sniffing of the albino rat. Behaviour. 1964;22:223–244. [Google Scholar]
- 67.Welsh JP, Lang EJ, Sugihara I, Llinás R. Dynamic organization of motor control within the olivocerebellar system. Nature. 1995;374:453–456. doi: 10.1038/374453a0. [DOI] [PubMed] [Google Scholar]
- 68.Wise SP, Jones EG. Cells of origin and terminal distribution of descending projections of the rat somatic sensory cortex. J Comp Neurol. 1977;175:129–158. doi: 10.1002/cne.901750202. [DOI] [PubMed] [Google Scholar]
- 69.Woodson W, Angaut P. The distribution and origin of the ipsilateral descending limb of the brachium conjunctivum. An autoradiographic and horseradish peroxidase study in the rat. Exp Brain Res. 1984;56:167–182. doi: 10.1007/BF00237454. [DOI] [PubMed] [Google Scholar]
- 70.Woolston DC, Kassel J, Gibson JM. Trigeminocerebellar mossy fiber branching to granule cell layer patches in the rat cerebellum. Brain Res. 1981;209:255–269. doi: 10.1016/0006-8993(81)90152-9. [DOI] [PubMed] [Google Scholar]