

Abstract
Neurons with directional specificities are active in the prefrontal cortex (PFC) during tasks that require spatial working memory. Although the coordination of neuronal activity in PFC is thought to be maintained by a network of recurrent connections, direct physiological evidence regarding such networks is sparse. To gain insight into the functional organization of the working memory system in vivo, we recorded simultaneously from multiple neurons spaced 0.2–1 mm apart in monkeys performing an oculomotor delayed response task. We used cross-correlation analysis and characterized the effective connectivity between neurons in relation to their spatial and temporal response properties. The majority of narrow (<5 msec) cross-correlation peaks indicated common input and were most often observed between pairs of neurons within 0.3 mm of each other. Neurons recorded at these distances represented the full range of spatial locations, suggesting that the entire visual hemifield is represented in modules of corresponding dimensions. Nearby neurons could be activated in any epoch of the behavioral task (stimulus presentation, delay, response). The incidence and strength of cross-correlation, however, was highest among cells sharing similar spatial tuning and similar temporal profiles of activation across task epochs. The dependence of correlated discharge on the functional properties of neurons was observed both when we analyzed firing from the task period as well as from baseline fixation. Our results suggest that the coding specificity of individual neurons extends to the local circuits of which they are part.
Keywords: working memory, prefrontal cortex, primate, cross-correlation, saccade, learning and memory
The primate prefrontal cortex (PFC) is a critical component of the cortical network that mediates working memory, and damage to this region produces deficits involving memory maintenance and future planning (Jacobsen, 1936; Milner, 1963;Goldman-Rakic, 1987). PFC malfunction has been implicated in numerous mental illnesses, most notably schizophrenia (Franzen and Ingvar, 1975;Weinberger et al., 1986; Goldman-Rakic, 1994). Electrophysiological studies undertaken to address the cellular basis of these cognitive functions have revealed a population of neurons in monkey dorsolateral PFC that is active during the delay periods of working-memory tasks (Fuster and Alexander, 1971; Kubota and Niki, 1971; Funahashi et al., 1989, 1990, 1991). PFC neurons exhibit coding specificity for attributes of remembered stimuli or “memory fields,” independent of motor responses (Niki and Watanabe, 1976; Funahashi et al., 1993;Constantinidis et al., 2001). The sustained activity of these neurons mediates “on-line” storage and processing required by working-memory tasks and poses the question of the nature of the cortical architecture that endows the PFC network with such operational properties.
Anatomical studies of the local prefrontal network have revealed that both intrinsic interconnections and associational projections to PFC terminate in a precise, stripe-like fashion (Goldman and Nauta, 1977; Levitt et al., 1993; Kritzer and Goldman-Rakic, 1995; Pucak et al., 1996). Intrinsic collaterals emanating from pyramidal cells in layer III terminate in a regular pattern of interdigitated columns ∼0.5 mm wide, extending laterally by 2–8 mm within the supragranular layers. These experiments examined the basic building units of the local network but not their functional implications.
Our present study was designed to address the effective connectivity (Aertsen et al., 1989) of the PFC to provide insight into the dynamics of working memory. We used an array of electrodes to record simultaneously from several neurons during execution of a spatial working-memory task and identify cross-correlation interactions between cells with different functional properties. Such methodology has been used successfully in other cortical areas, most notably in the primary visual cortex, where cells are likely to be interconnected if they possess overlapping receptive fields (RFs) or share orientation preferences (Ts'o et al., 1986; Das and Gilbert, 1999).
The current study extends previous findings from our laboratory showing that neurons recorded within 400 μm along the same electrode track tend to be modulated by stimuli in the same part of the visual field and receive common input (Wilson et al., 1994; Rao et al., 1999). Cross-correlation interactions have been demonstrated among neuronal pairs with similar spatial tuning isolated from a single electrode (Funahashi and Inoue, 2000). We now show that neurons separated by lateral distances not >300 μm are more likely to show cross-correlation peaks if they share similar spatial tuning and are active during the same task epochs. The results have important implications regarding the principles of PFC functional organization and the nature of information processing in working-memory circuits.
Parts of these results have been published previously in abstract form (Constantinidis et al., 1999).
MATERIALS AND METHODS
Subjects. Two male rhesus monkeys (Macaca mulatta), weighing 10–12.5 kg, served as subjects in this study. A magnetic resonance imaging-guided craniotomy was performed on both animals, exposing a 20 mm region of dorsolateral prefrontal cortex that included both the frontal eye fields and area 46 of the left hemisphere (see Fig. 1). Monkeys were also implanted with a scleral eye coil to monitor eye position and a head bolt to stabilize the head during task performance (Judge et al., 1980). The animals were allowed at least 2 weeks to recover from surgery before training on the behavioral task was initiated. Surgery and training protocols were in accord with guidelines set by the National Institutes of Health and were approved by the Yale University Animal Care and Use Committee.
Fig. 1.

Location of electrophysiological recording in dorsolateral prefrontal cortex, centered on area 46 and the frontal eye fields (area 8). This region included the caudal half of the principal sulcus and cortex lining the arcuate sulcus.
Working-memory task. Animals were trained on an oculomotor delayed response task (ODR) shown in Figure 2. Stimuli were back projected onto a tangent screen placed 50 cm away from the subject. Monkeys initiated a trial by fixating a central point 0.2° in size, for 500 msec. They maintained central fixation as a cue stimulus subtending 1° flashed for 500 msec at an eccentricity of 14°. The cue could appear in one of eight possible locations around the fixation point (see Fig. 2A); 10–12 correct trials were typically recorded for each location. Target locations were randomly interleaved across trials. For some recordings, 25 cue locations were used, arranged in three concentric circles of 7, 14, and 21° eccentricity, with an additional cue appearing over the fixation point. In some instances, after the spatial tuning of the neuron had been established with the 8- or 25-target ODR, another set of recordings was performed used only two targets, inside and outside of the receptive field; 80–100 trials were typically recorded in this fashion. A delay period lasting 3 sec followed the presentation of the cue. At the end of this period the fixation point was extinguished, and the monkeys were trained to make a saccade to the remembered target location in the absence of any visual cues. Eye position was monitored throughout the entire period, and the trial was terminated immediately if it deviated by more than a predetermined distance (∼2° for most recordings). The actual eye position was much more restricted around the fixation point, and the choice of the eye window size was dictated by the resolution of the computer system responsible for behavioral control in real time. Monkeys received a liquid reward for saccades that terminated within 5° from the center of the cue.
Fig. 2.
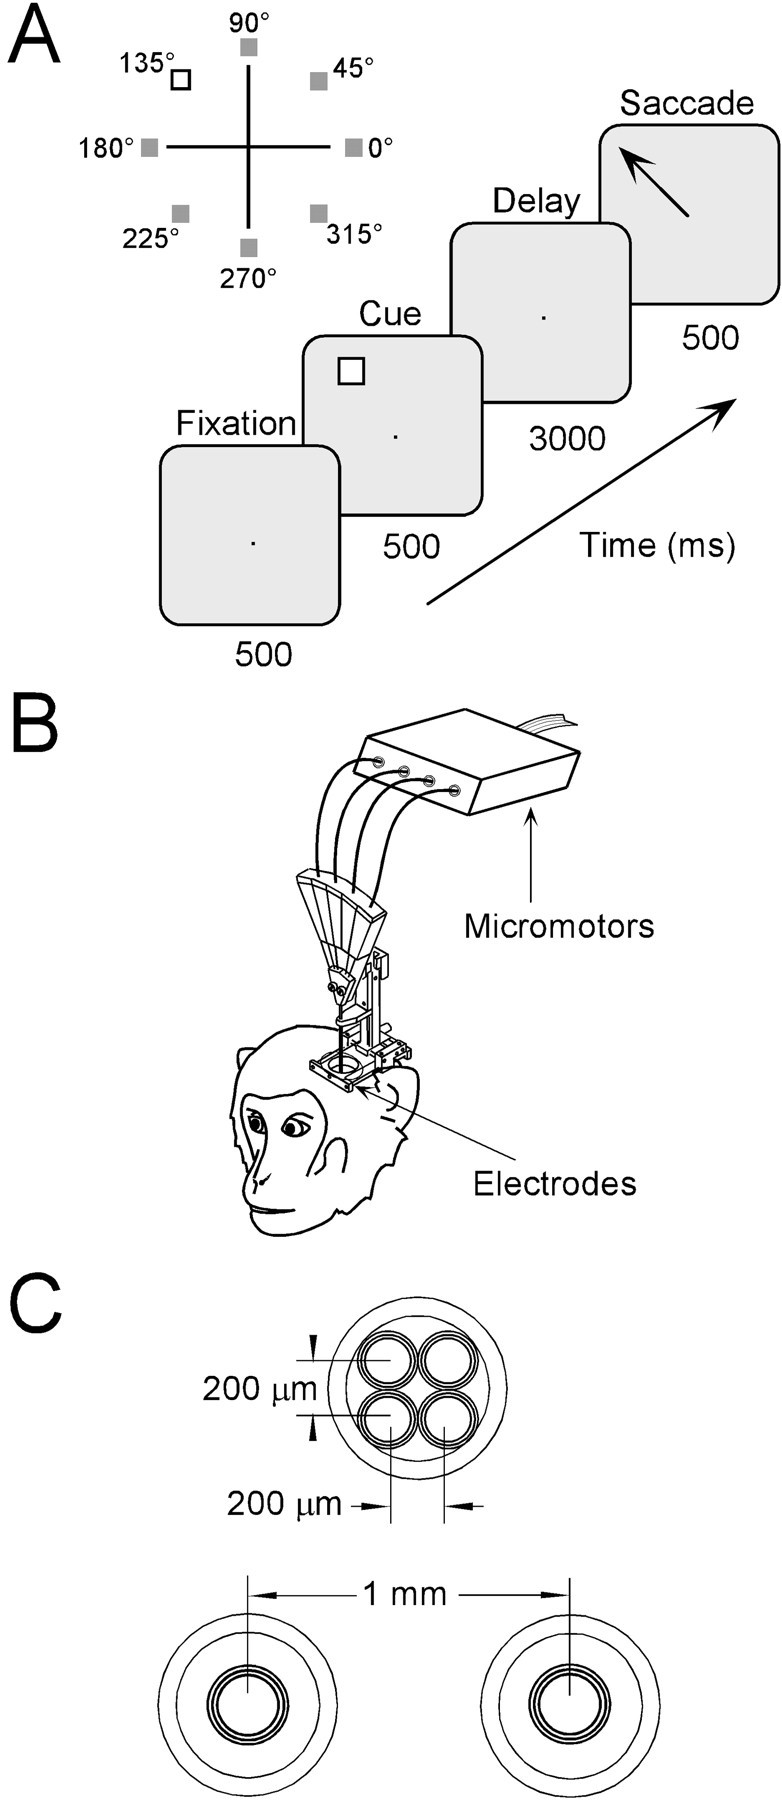
Oculomotor delayed response task and recording methodology. A, Trials began when the monkey fixated a central point on a screen for 500 msec. A target appeared in one of eight possible locations (0–315°) for 500 msec and was followed by a delay period of 3000 msec. When the fixation point was extinguished, the monkey saccaded to the location of the remembered target.B, Independently advancing electrodes were lowered in the monkey's cortex. C, Cross-view illustrating the electrode configurations most often used in this study. The top circle represents a single guide tube that contains four electrodes in a 2 × 2 matrix. The two bottom circles represent two guide tubes separated by 1 mm, each holding a single electrode.
Multiple electrode recording. Neuronal activity was monitored using varnish-coated tungsten electrodes (1–4 MΩ at 1 kHz). One or more electrodes were placed in stainless steel guide tubes. Each electrode was independently advanced into the cortex with a set of micromotors (Alpha-Omega Engineering, Nazareth, Israel), as shown in Figure 2B. Electrodes could be arranged in several possible configurations with the use of appropriate guide tubes (FHC, Bodowinham, ME). We typically used four electrodes spaced ∼200–300 μm apart within a single guide tube or two electrodes spaced 1000 μm apart in two separate guide tubes (see Fig.2B). Neuronal activity was amplified 1000 times and bandpass-filtered (400 Hz – 10 kHz). The conditioned signal was sampled with a temporal resolution of 30 μsec by a data acquisition system (CED, Cambridge, UK). Sampled waveforms were sorted into separate units using a template-matching algorithm. Peristimulus time histograms and cross-correlation histograms (CCHs) were displayed on line. Eye position was recorded with 10 msec resolution.
Data analysis: neuron classification. The firing rate of each unit was computed in five different time windows, during the fixation period (500 msec), cue presentation (500 msec), delay period (3000 msec), pre-saccade period (250 msec after the fixation point was turned off), and post-saccade period (500 msec after the end of the pre-saccade period). We included in our analysis only neurons that exhibited significantly elevated firing rates in any task epoch compared with baseline fixation (paired t test;p < 0.05; adjusted for multiple comparisons).
We used a bootstrapping test to assess whether the firing rate of a neuron was spatially tuned in each task epoch (Lurito et al., 1991). The response to each target location was represented by a vector the direction of which was determined by the position of the cue. The amplitude of the vector was equal to the mean firing rate corresponding to the particular cue location. The sum of all eight vectors for individual target locations produced a resultant vector indicating the location that maximally excited the neuron. We evaluated the probability that the observed spatial tuning could arise by chance by estimating the percentage of 10,000 randomly generated resultant vectors that exceeded the length of the actual resultant. For this procedure, we randomly assigned the firing rate of each trial to one of the eight target locations and then computed a resultant vector, as before. Neurons were deemed spatially tuned for p values ≤0.01. This statistical bootstrapping technique was in good agreement with the results obtained performing an ANOVA test at the same level of significance. The two tests produced the same classification (responses tuned or untuned) in 87.3% of the cases tested. The bootstrapping test, however, presented the benefit that it required no assumptions on the distribution of firing rates and took into account the geometrical arrangement of the response rate distributions.
We estimated the tuning difference between two neurons by calculating the absolute difference between the directions of their resultant vectors. This calculation was performed only for responses recorded during the same epoch. If a pair of neurons were spatially tuned in more than one epoch, a tuning difference was estimated for each epoch separately, then all values were averaged together. Spatial tunings in the cue, delay, and pre-saccadic epochs were generally in close agreement. The median difference in spatial tuning between any two epochs of the same neuron was 22.7° for our sample; however, we did observe examples with quite disparate spatial tuning in different task epochs, as reported previously (Rao et al., 1999). We simulated the expected distribution of spatial tuning differences by randomly pairing neurons from different recording sessions, then computing the spatial tuning difference between them. We used 10,000 randomly selected pairs to generate the expected distribution of tuning differences.
We also characterized neuronal responses with respect to the temporal pattern of activation. For each neuron we pooled responses from all spatial locations and computed the average discharge rate for each task epoch. We further divided the delay epoch into three periods, each 1 sec long, for the purposes of this analysis (although results were very similar when we averaged firing rates from the entire delay period). The similarity in temporal profile of activation for each pair of neurons was evaluated by calculating the Pearson correlation coefficient between the corresponding task–period responses. We estimated the expected distribution of correlation coefficients by again pairing neurons randomly and calculating r values. We used 10,000 randomly selected pairs for this analysis, as above.
Cross-correlation analysis. CCHs were constructed from the spike trains of simultaneously recorded pairs of neurons (Perkel et al., 1967). Our analysis in this paper focuses on cross-correlation histograms using the entire length of all correct trials, but separate CCHs were also constructed for each location and task epoch. The position and width of CCH peaks for separate locations and task epochs, when present, were generally consistent with the cross-correlation analysis based on the entire trial period.
For each CCH a shift predictor was calculated to help identify potential correlated firing, time locked to the stimulus. We constructed shift predictors by first grouping trials depending on cue location and then shifting the order of trials by one trial position. Because previous studies have identified CCH peaks of greatly varying widths (Nowak et al., 1995), we used four time scales varying from ±25 to ±250 msec and four bin widths varying from 0.5 to 5 msec in an attempt to reveal several kinds of neuronal interactions. The statistical significance of CCH peaks was evaluated by using the SD of the shift predictor as a measure of the expected SD of the raw correlogram under the null hypothesis that the two spikes are independent. For each of the four time scales used, we first computed the baseline of the raw correlogram defined as the average of half the bins in the flanks of the CCH. We then identified peaks that exceeded the baseline by a number of shift-predictor SDs corresponding to a probability value of 0.001, under the assumption that bin heights in the four correlograms are independent and normally distributed. For our data this was 4.41 SDs. None of our shift predictors exceeded these confidence intervals. This estimation of significance is similar to methods used previously in the primary visual cortex (Reid and Alonso, 1995; Das and Gilbert, 1999). Only CCHs containing >1000 spikes were analyzed in this study. We tested the assumption that CCH histogram bins were distributed randomly by performing a Kolmogorov–Smirnov, one-sample test on all shift predictors. The null hypothesis that bin heights were normally distributed was rejected in 12.1% (163/1348) of the cases, higher than the 0.05 level of significance that we used for the test. Histograms rejecting the null hypothesis were most often (82/163) those with the smallest bin width of 0.5 msec, for which we observed the lowest spike counts in each bin. CCHs that violated the normality assumption were not used for evaluating significant peaks.
We calculated the strength of correlated firing between two units by computing the number of spikes under the correlogram peak that exceeded the baseline and dividing it by the total number of spikes from each neuron. In the case of peaks that are offset from zero, this measure is termed “efficacy” when it refers to the presynaptic neuron and “contribution” when it refers to the postsynaptic neuron (Levick et al., 1972). We computed the correlation strength for peaks straddling the zero point in a 5 msec window centered at zero. These calculations were performed on the 1 msec bin CCH.
We performed a regression analysis to test the dependence of the presence of narrow peaks on electrode separation. A linear model of the form Y = aX + b was used, whereY represented the proportion of neurons with significant peaks and X represented the distance between electrodes. Each neuron was treated as one observation. For each neuron,Y could take the value of either 1 or 0 (for presence or absence of a narrow peak). The average value of the dependent variable was equal to the proportion of neurons with narrow CCH peaks at each recording distance.
RESULTS
Database
We recorded from a total of 778 neurons in the dorsolateral prefrontal cortex (areas 8 and 46) of two awake, behaving monkeys (Fig.1). Four hundred fifty-two of these neurons were significantly modulated during performance of the oculomotor delayed response task (Fig.2). Our data included simultaneous recordings of 337 neuronal pairs, both members of which exhibited significant responses from separate electrodes. Of those, 194 pairs were recorded from electrodes 200 μm apart, 92 pairs were recorded at 300 μm apart, and 51 pairs were recorded at 1 mm apart.
The precise laminar distribution of the recorded units could not be determined with confidence, but an attempt was made to record mainly from the supragranular layers, because anatomical studies have indicated that a large proportion of horizontal connections terminate in layer 3 (Levitt et al., 1993; Kritzer and Goldman-Rakic, 1995). Ninety-one percent (413/452) of responding units were recorded at depths <1 mm from the surface of the cortex, as identified by the initial appearance of neuronal activity, and thus were highly likely to represent a sample of neurons from the supragranular layers.
Characteristics of cross-correlation interactions
Neurons recorded simultaneously from electrodes separated by 200–1000 μm exhibited overlapping receptive, memory, or movement fields. This is in agreement with previous results that indicate neurons in dorsolateral prefrontal cortex possess large RFs that can subtend up to 60° of visual angle (Suzuki and Azuma, 1983; Rao et al., 1999). For 218 of the total 337 pairs, both neurons displayed spatially tuned responses during the same epoch so that we could determine their difference in tuning using a vector algorithm (see Materials and Methods).
Cross-correlation analysis was performed in an attempt to identify the pattern of putative connections within prefrontal cortex. We found a total of 100 neuronal pairs that exhibited significant peaks or troughs; the remaining 237 pairs exhibited no significant interactions. We were particularly interested in CCH peaks that could arise from direct interactions between neurons and therefore could provide some insight into the dynamics of PFC organization. We defined CCH peaks as “narrow” if they were centered within 5 msec of the center bin and their width at half peak height was ≤5 msec (Michalski et al., 1983;Kruger and Aiple, 1988). Such peaks could be the result of monosynaptic connections or common input, involving one or two synapses (Alonso and Martinez, 1998). A typical result of this analysis is shown in Figure3 for a pair of neurons recorded from electrodes 200 μm apart. The cell shown at the left of the figure (Neuron 3083) responded maximally during the cue, delay, and saccade periods for the target appearing at 315°. Neuron 3086, shown at the right, responded maximally for the 270 and 315° targets. Cross-correlation analysis revealed a narrow peak of 2–3 msec width, centered at 0 time lag. Such a peak could be the result of shared input between the two neurons. Eleven percent of all pairs displayed similar narrow peaks (38/337 total pairs). A larger percentage of neuronal pairs (22%, 75/337) displayed broader peaks, which could be the result of polysynaptic interactions (Nowak et al., 1995) or covariations in neuronal firing during the same time epochs (Brody, 1998). An example is shown in Figure4. The two neurons were active during cue presentation at the 0 and 45° locations. A peak ∼15 msec wide is evident in the CCH (bin size, 2 msec). Most examples of CCH interactions observed for units recorded from separate electrodes exhibited a peak at 0 time lag. Only 1% of all pairs (5/337) exhibited off-center excitatory narrow peaks. An additional 1% of the total number of pairs displayed narrow troughs (4/337).
Fig. 3.

Unit activity for two neurons recorded from electrodes ∼200 μm apart. The two outer panelsdisplay peristimulus time histograms representing neuronal activity on the ODR task. Histograms are arranged to indicate the location of the corresponding cue. The center panel presents the raw cross-correlation histogram with the shift predictor overlaid as a gray line. Horizontal lines represent CCH baseline and 0.001 confidence intervals. The neuron shown on theright was the reference cell for the construction of the CCH. PST histograms reveal spatially overlapping delay period activity in the lower contralateral visual field (315° position). The narrow peak centered on the zero time point of the cross-correlation histogram reflects synchronous neuronal firing. Spikes that contributed to CCH for Neuron 3083 and Neuron 3086 were 14,025 and 18,192, respectively. Percentages of total spikes represented in the peak (cross-correlation strength) were 2.3 and 1.8%, respectively. Bin size for CCH was 1 msec.
Fig. 4.

Unit activity is presented for neurons recorded from two electrodes ∼200 μm apart. Conventions are the same as for Figure 3, except for CCH bin size (2 msec). The neuronal pair shared spatially overlapping receptive fields, with maximal activation during the presentation of the cue. Spikes that contributed to CCH forNeuron 1437 and Neuron 1439 were 10,089 and 14,779, respectively.
Factors governing effective connectivity
The incidence of any cross-correlation interactions and narrow peaks, in particular (Fig. 5,gray and white bars, respectively), decreased dramatically with electrode separation. We performed a regression analysis to test whether the proportion of pairs with significant CCH interaction was dependent on distance. The results revealed that the proportion of pairs exhibiting significant interactions decreased significantly (p < 0.05) as distance increased. This was true when we considered all peaks or narrow peaks alone. For the remainder of our analysis we focused on the 278 pairs of neurons recorded at 200–300 μm apart, because these were the distances where we recorded most of the significant CCH peaks. We sought to explore the functional properties of neurons recorded at these distances from each other and test whether the incidence and strength of cross-correlation peaks were dependent on the spatial tuning and epoch of activation of the neurons.
Fig. 5.

Percentage of pairs exhibiting significant cross-correlation interactions as a function of electrode separation. The proportion of CCH peaks, both broad and narrow, decreased as the distance between electrodes increased to 1 mm.
Both neurons of 136 pairs displayed spatially tuned activity during the same task epochs, making it possible to compute their spatial tuning difference. We first examined the tuning difference between simultaneously recorded pairs, whether they exhibited a CCH peak or not. Pairs of neurons recorded 200–300 μm apart exhibited the entire range of spatial tuning preferences (Fig.6A). This evidence suggests that the entire visual hemifield is represented in a region of cortex 200–300 μm wide. However, at these distances, there was a significant bias for more similar tuning than would be expected by chance. The difference between the observed and expected distributions was statistically significant (χ2 test;p < 0.05).
Fig. 6.

Distribution of spatial tuning differences and rate correlation coefficients for neurons recorded simultaneously from electrodes 200–300 μm apart. The expected distributions, simulated by randomly pairing neurons recorded at different sessions, are shown on the right column. A, The number of pairs spatially tuned during the same task epochs is plotted as a function of their tuning difference (n = 136).B, The number of pairs is plotted as a function of the correlation coefficient computed for their mean firing rates in each task epoch (n = 286).
Similarly, we observed that neurons recorded at distances of 200–300 μm apart could be active in any task epoch and displayed widely ranging temporal profiles of activation. We quantified the degree of similarity between the temporal profiles of two neurons by computing the correlation coefficient for their averaged responses in the different task epochs (see Materials and Methods). We observedr values ranging anywhere between −1 and 1 (Fig.6B). There was, however, again a statistically significant bias for pairs of neurons with more similar temporal profiles, corresponding to higher correlation values (χ2 test; p < 0.05).
We proceeded to test whether the incidence of cross-correlation peaks was greater for neurons with similar functional properties. The proportion of pairs exhibiting narrow CCH peaks was higher for pairs with similar spatial tuning (Fig. 7). This effect was statistically significant (regression analysis;p < 0.05). More examples of narrow CCH interactions between neurons with similar spatial tuning are shown in Figure8. To ensure that the decrease in the number of interactions as a function of tuning difference could not be accounted for by factors such as firing rate, we repeated the regression analysis including the absolute firing rate and firing rate difference of the pair as independent variables in the model. The effect of tuning difference on the proportion of neurons with narrow peaks remained significant (regression analysis; p < 0.05). Our failure to detect synchrony among neurons with dissimilar spatial tuning could also be attributable to the fact that they were never coactivated by the same preferred stimulus, and therefore a sufficient number of spikes was not available to reveal a possible interaction. To test this possibility, we repeated the cross-correlation analysis during the fixation period alone. Analysis of the fixation period revealed similar results: pairs exhibited synchrony more often when their spatial tuning was similar (Fig. 7,right). The proportion of significant peaks was again significantly dependent on tuning difference (regression analysis;p < 0.05). However, the overall percentage of neurons exhibiting narrow peaks during the fixation period was lower, suggesting that task parameters may dynamically modulate the strength of interactions between PFC neurons.
Fig. 7.

Incidence of narrow cross-correlation peaks as a function of spatial tuning. Left panel illustrates results from cross-correlation analysis based on the cue, delay, and saccade behavioral epochs. Most functional interactions were observed for neurons with the highest spatial tuning similarity. Right panel shows results from baseline fixation period. Pairs with similar tuning tended to exhibit narrow peaks during the fixation period, before the neurons were engaged by the task and the spatial tuning of the neuron could be determined.
Fig. 8.

Examples of neuronal pairs recorded 200–300 μm apart that displayed narrow CCH peaks. Polar plotsrepresent the spatial tuning of the neuron. The arrowrepresents the preferred location of each neuron as determined by a vector algorithm. Cross-correlation histogram is shown in thecenter of each panel. A, Spatial tuning of the pair was obtained in the cue period. B, Spatial tuning was obtained during the delay period. C, Spatial tuning was obtained in the saccade period.
The strength of interactions between pairs of neurons was estimated as the fraction of the total number of spikes represented by each neuron in the CCH peak (see Materials and Methods). We then plotted this cross-correlation strength between neuron pairs as a function of their difference in spatial tuning (Fig.9A). We found that cross-correlation strength was greatest for pairs with smaller tuning differences and decreased for pairs of neurons with larger tuning differences. A regression analysis revealed a statistically significant (p < 0.05) dependence for activity recorded both during the task period and baseline fixation (Fig.9A).
Fig. 9.

Cross-correlation strength as a function of spatial tuning and epoch of activation. A, Eachpoint represents the mean CCH strength values for pairs with tuning difference that falls in a 20° wide bin centered around the point. Error bars represent SEM. Pairs with similar tuning exhibited stronger correlation peaks during ODR task epochs (left) and fixation period (right) when their spatial tuning was more similar. B, CCH strength is plotted as a function of the correlation coefficient computed by the mean firing rates of the two neurons in each task epoch.
We next tested whether cross-correlation strength was dependent on the similarity of the temporal profiles of activation between two neurons (Fig. 9B). A regression analysis between CCH strength and the correlation of the mean responses of the two neurons in different epochs showed a significant dependence between the two factors (p < 0.05). This dependence was observed when we constructed CCHs based on spikes from either the task epochs or the baseline fixation. The result suggests that CCH interactions depend on the temporal pattern of activation of the neuron and that such interactions are evident even in a baseline state, before the neurons are activated by the task.
Finally, we examined the incidence of narrow cross-correlation peaks for neurons activated during each of the task epochs. We identified neurons that exhibited firing rate significantly elevated above baseline for at least one epoch (t test; p< 0.01 corrected for multiple comparisons). We then calculated the percentage of pairs exhibiting narrow CCH peaks for the groups of pairs with both neurons, one neuron, or neither neuron active in the same task epoch. The percentage of pairs exhibiting narrow CCH peaks was highest for pairs of neurons both members of which were activated during the same task epoch (Fig. 10). The distribution of pairs was significantly different from uniform for the cue, delay, and saccade epochs (χ2test; p < 0.05).
Fig. 10.

Incidence of narrow CCH peaks as a function of epoch of activation. The percentage of pairs exhibiting narrow CCH peaks is shown for pairs of neurons: both of which are active in a task epoch (gray bars), only one neuron of which is active (white bars), or neither is active (black bars).
DISCUSSION
The present study used multiple electrode recordings in an effort to shed light on the functional organization of the spatial working-memory network in prefrontal cortex. Cross-correlation analysis was used to study the patterns of interactions between classes of neurons defined by their spatial and temporal properties as they relate to working-memory performance. Although there is no strict, causal relationship between a peak in the cross-correlation histogram and an anatomical connection between two neurons, the patterns observed can begin to define the rules of organization of the underlying synaptic interactions, direct or indirect. This has been termed the “effective connectivity” of the circuitry (Aertsen et al., 1989).
Most interactions revealed by cross-correlation analysis were found between pairs of neurons recorded within 200–300 μm of each other. We observed that neurons recorded at these distances represented the entire range of spatial locations and epochs of activation. However, the pattern of interactions between these cells was not random. Neurons that shared similar spatial tuning and were active in the same task epochs exhibited a significantly higher incidence of synchronous firing patterns. The dependence of synchrony on spatial tuning and epoch of activation was an effect of the underlying circuitry rather than stimulus presentation, because we observed the same dependence during baseline fixation, before the neurons were engaged by the task. A similar finding of correlated firing in the fixation as well as stimulus presentation period was reported recently in area MT (Bair et al., 2001). Our results do not exclude the possibility that the relative strength of correlated firing may be dynamically modulated across task epochs (Aertsen et al., 1989; Sanes and Donoghue, 1993;Vaadia et al., 1995; Riehle et al., 1997). This will be the focus of an upcoming study.
Characteristics and sources of synchronous activity in neocortex
Previous studies have identified CCH interactions or coincidence between neurons in primate frontal cortex that were modulated over the time course of several seconds across the duration of a behavioral task (Abeles et al., 1993; Seidemann et al., 1996). The present study extends this work by addressing the defining properties of prefrontal neurons and providing evidence for effective connectivity between functionally characterized neuronal subtypes. Although we observed CCH peaks of varying widths, we focused on the analysis of narrow (≤5 msec) peaks because these are less likely to be caused by polysynaptic interactions or covariations in firing rate (Nowak et al., 1995; Brody, 1998). Narrow peaks most often tended to straddle the zero time point, indicating synchronous neuronal firing. Synchronized neuronal activity at zero-delay may be a general feature of intracortical processing. Studies in M1 (Hatsopoulos et al., 1998), V1 (Schwarz and Bolz, 1991;Nowak et al., 1995), A1 (Eggermont, 1992), and MT (Kreiter and Singer, 1996; Cardoso de Oliveira et al., 1997) also failed to detect a preponderance of monosynaptic interactions from separate electrodes placed perpendicular to the pial surface at a range of distances. However, when multiple electrodes are positioned within a single cortical column (i.e., across lamina), monosynaptic interactions are evident (Alonso and Martinez, 1998). These studies suggest that interactions within microcolumns are more robust than those between microcolumns, and although each cortical neuron may integrate a large number of inputs, any single horizontal connection is relatively weak, making detection of pairwise connections between any two individual neurons difficult.
Possible sources of shared input that could produce synchronous firing in the present investigation include inputs from neurons within the same cortical column, from neurons in nearby columns, or from any of the numerous extrinsic afferents to the prefrontal cortex. Anatomical data have identified such potential sources of common input among the posterior parietal cortex (Petrides and Pandya, 1984; Cavada and Goldman-Rakic, 1989), other sensory and limbic areas (Barbas and Mesulam, 1981; Selemon and Goldman-Rakic, 1988; Romanski et al., 1999), and subcortical structures, including the mediodorsal nucleus of thalamus (Goldman-Rakic and Porrino, 1985; Giguere and Goldman-Rakic, 1988). It cannot be discounted, however, that two neurons exhibiting a CCH peak centered at time 0 are synaptically connected, as well as connected to a number of other neurons. Theoretical studies suggest that such a highly interconnected network will produce firing rate synchronization (Juergens and Eckhorn, 1997), and horizontal connections between PFC neurons tend to be reciprocal (Pucak et al., 1996; Melchitzky et al., 1998).
Distance effects
The present study demonstrated that PFC cells interact more often when they are in close proximity of one another. CCH peaks dropped dramatically when electrodes were separated by 1000 μm. These distances are consistent with studies in other cortical areas (Toyama et al., 1981; Hata et al., 1993). Functional connections in V1 diminish when electrodes are spaced >500 μm apart (Michalski et al., 1983;Kruger and Aiple, 1988). Similar magnitudes were observed in other cortical regions, including A1 (Eggermont, 1992; Eggermont and Smith, 1996), MT (Cardoso de Oliveira et al., 1997), and IT (Gochin et al., 1991). The evidence suggests a common organization across a range of neocortical regions. The drop-off in connectivity at 1000 μm does not eliminate the possibility of stronger connectivity at this or still wider distances, because interconnected clusters of pyramidal neurons in PFC have been demonstrated for up to several millimeters from a given reference cluster (Kritzer and Goldman-Rakic, 1995;Gonzalez-Burgos et al., 2000). Indeed, previous studies have shown that intrinsic PFC circuitry extends over 7–8 mm in collections of discrete bands (Goldman-Rakic, 1984; Levitt et al., 1993). Detection of interactions at these distances will require placement of electrodes in anatomical sites corresponding to functionally similar units.
Effective connectivity depends on spatial tuning
The dependence of cross-correlation interactions on the functional properties of prefrontal cortical neurons bears resemblance to the primary visual cortex. Cells in the visual cortex are organized in so-called “pin-wheels,” representing all orientations of a bar stimulus (Bonhoeffer and Grinvald, 1991, 1993; Bartfeld and Grinvald, 1992; Crair et al., 1997; Maldonado et al., 1997). Adjacent pin-wheels represent adjacent visual field locations, in a regular progression across the surface of the cortex. Neurons are likely to be interconnected if they possess overlapping receptive fields (lie within the same pin-wheel) or share orientation selectivity, across different pinwheels (Ts'o et al., 1986; Gilbert and Wiesel, 1989; Malach et al., 1993).
The pattern of organization of prefrontal cortical neurons is not equally well understood, but our present results offer some valuable insights. Neurons recorded at distances of 200–300 μm apart in the cortical surface were shown to represent any part of the visual hemifield, although this distribution was biased toward adjacent spatial locations. This result raises the possibility that the entire visual field is represented in repeating areal units analogous to pin-wheels, possibly corresponding to the stripe-like structures revealed by anatomical studies (Goldman-Rakic, 1984; Levitt et al., 1993). Such a pattern of organization could explain why a gross topographic representation has not been revealed for the prefrontal cortex, because the same spatial location may be represented multiple time across the cortical surface.
Receptive field overlap is a critical factor determining connectivity in other regions of cortex. This has been demonstrated between V1 and V2 neurons (Nelson et al., 1992) and between MT neurons (Kreiter and Singer, 1996) as well as between hemispheres, at the V1/V2 border (Nowak et al., 1995). Our results also bear striking similarity in this respect, with the pattern of organization of the primary motor cortex where the strength of connections between two neurons varies linearly as a function of their difference in directional tuning (Georgopoulos et al., 1993; Lee et al., 1998). Theoretical models have posited that recurrent circuitry restricted among neurons with similar spatial tuning mediates sustained delay activity during working-memory processing in PFC (Amit and Brunel, 1997; Camperi and Wang, 1998;Lisman et al., 1998; Compte et al., 2000).
Effective connectivity depends on epoch of activation
Our results additionally revealed that the temporal profile of activation during the different epochs of the behavioral task may be an equally important factor governing PFC organization. Within a distance of 200–300 μm we encountered units active at any task period and with widely varying temporal response profiles. The strength of cross-correlation interactions, however, was dependent on the similarity of the neurons in temporal profiles. Epoch of activation has received less attention as an organizational principle for the working-memory circuitry (Zipser et al., 1993). Our results suggest that this may be an equally important factor.
PFC organization has been proposed to be constrained by informational content (Goldman-Rakic, 1995). According to this view, different regions of PFC are organized by information domain at both macro-architectural (areas) and micro-architectural (columns and intrinsic circuits) levels. Evidence presented in this study lends support to such a framework. The effective connectivity between neurons active in the ODR task depends on their functional properties, such as spatial tuning and temporal pattern of activation. Thus, the local network that mediates spatial tuning is constrained by stimulus selectivity consistent with a modular architecture for working memory.
Footnotes
This work was supported by National Institute of Mental Health Grant MH38546 (P.S.G.-R.), Fellowship MH11812 (M.N.F), and a McDonnel-Pew Program in Cognitive Neuroscience Award (C.C.). We thank Vincent Bernardo for his excellent technical contribution to this study.
C.C. and M.N.F contributed equally to this work.
Correspondence should be addressed to Dr. Patricia S. Goldman-Rakic, Yale School of Medicine, Section of Neurobiology, 333 Cedar Street, SHM C303, New Haven, CT 06510. E-mail:patricia.goldman-rakic@yale.edu.
REFERENCES
- 1.Abeles M, Bergman H, Margalit E, Vaadia E. Spatiotemporal firing patterns in the frontal cortex of behaving monkeys. J Neurophysiol. 1993;70:1629–1638. doi: 10.1152/jn.1993.70.4.1629. [DOI] [PubMed] [Google Scholar]
- 2.Aertsen AM, Gerstein GL, Habib MK, Palm G. Dynamics of neuronal firing correlation: modulation of “effective connectivity.”. J Neurophysiol. 1989;61:900–917. doi: 10.1152/jn.1989.61.5.900. [DOI] [PubMed] [Google Scholar]
- 3.Alonso JM, Martinez LM. Functional connectivity between simple cells and complex cells in cat striate cortex. Nat Neurosci. 1998;1:395–403. doi: 10.1038/1609. [DOI] [PubMed] [Google Scholar]
- 4.Amit DJ, Brunel N. Model of global spontaneous activity and local structured activity during delay periods in the cerebral cortex. Cereb Cortex. 1997;7:237–252. doi: 10.1093/cercor/7.3.237. [DOI] [PubMed] [Google Scholar]
- 5.Bair W, Zohary D, Newsome WT. Correlated firing in macaque visual area MT: time scales and relationship to behavior. J Neurosci. 2001;21:1676–1697. doi: 10.1523/JNEUROSCI.21-05-01676.2001. [DOI] [PMC free article] [PubMed] [Google Scholar]
- 6.Barbas H, Mesulam MM. Organization of afferent input to subdivisions of area 8 in the rhesus monkey. J Comp Neurol. 1981;200:407–431. doi: 10.1002/cne.902000309. [DOI] [PubMed] [Google Scholar]
- 7.Bartfeld E, Grinvald A. Relationships between orientation-preference pinwheels, cytochrome oxidase blobs, and ocular-dominance columns in primate striate cortex. Proc Natl Acad Sci USA. 1992;89:11905–11909. doi: 10.1073/pnas.89.24.11905. [DOI] [PMC free article] [PubMed] [Google Scholar]
- 8.Bonhoeffer T, Grinvald A. Iso-orientation domains in cat visual cortex are arranged in pinwheel-like patterns. Nature. 1991;353:429–431. doi: 10.1038/353429a0. [DOI] [PubMed] [Google Scholar]
- 9.Bonhoeffer T, Grinvald A. The layout of iso-orientation domains in area 18 of cat visual cortex: optical imaging reveals a pinwheel-like organization. J Neurosci. 1993;13:4157–4180. doi: 10.1523/JNEUROSCI.13-10-04157.1993. [DOI] [PMC free article] [PubMed] [Google Scholar]
- 10.Brody CD. Slow covariations in neuronal resting potentials can lead to artefactually fast cross-correlations in their spike trains. J Neurophysiol. 1998;80:3345–3351. doi: 10.1152/jn.1998.80.6.3345. [DOI] [PubMed] [Google Scholar]
- 11.Camperi M, Wang XJ. A model of visuospatial working memory in prefrontal cortex: recurrent network and cellular bistability. J Comput Neurosci. 1998;5:383–405. doi: 10.1023/a:1008837311948. [DOI] [PubMed] [Google Scholar]
- 12.Cardoso de Oliveira S, Thiele A, Hoffmann KP. Synchronization of neuronal activity during stimulus expectation in a direction discrimination task. J Neurosci. 1997;17:9248–9260. doi: 10.1523/JNEUROSCI.17-23-09248.1997. [DOI] [PMC free article] [PubMed] [Google Scholar]
- 13.Cavada C, Goldman-Rakic PS. Posterior parietal cortex in rhesus monkey: I. Parcellation of areas based on distinctive limbic and sensory corticocortical connections. J Comp Neurol. 1989;287:393–421. doi: 10.1002/cne.902870402. [DOI] [PubMed] [Google Scholar]
- 14.Compte A, Brunel N, Goldman-Rakic PS, Wang XJ. Synaptic mechanisms and network dynamics underlying spatial working memory in a cortical network model. Cereb Cortex. 2000;10:910–923. doi: 10.1093/cercor/10.9.910. [DOI] [PubMed] [Google Scholar]
- 15.Constantinidis C, Franowicz MN, Goldman-Rakic PS. Multiple electrode analysis of local circuitry in the primate prefrontal cortex during spatial working memory. Soc Neurosci Abstr. 1999;25:97. [Google Scholar]
- 16.Constantinidis C, Franowicz MN, Goldman-Rakic PS. The sensory nature of mnemonic representation in the primate prefrontal cortex. Nat Neurosci. 2001;4:311–316. doi: 10.1038/85179. [DOI] [PubMed] [Google Scholar]
- 17.Crair MC, Ruthazer ES, Gillespie DC, Stryker MP. Ocular dominance peaks at pinwheel center singularities of the orientation map in cat visual cortex. J Neurophysiol. 1997;77:3381–3385. doi: 10.1152/jn.1997.77.6.3381. [DOI] [PubMed] [Google Scholar]
- 18.Das A, Gilbert CD. Topography of contextual modulations mediated by short-range interactions in primary visual cortex. Nature. 1999;399:655–661. doi: 10.1038/21371. [DOI] [PubMed] [Google Scholar]
- 19.Eggermont JJ. Neural interaction in cat primary auditory cortex. Dependence on recording depth, electrode separation, and age. J Neurophysiol. 1992;68:1216–1228. doi: 10.1152/jn.1992.68.4.1216. [DOI] [PubMed] [Google Scholar]
- 20.Eggermont JJ, Smith GM. Neural connectivity only accounts for a small part of neural correlation in auditory cortex. Exp Brain Res. 1996;110:379–391. doi: 10.1007/BF00229138. [DOI] [PubMed] [Google Scholar]
- 21.Franzen G, Ingvar DH. Absence of activation in frontal structures during psychological testing of chronic schizophrenics. J Neurol Neurosurg Psychiatry. 1975;38:1027–1032. doi: 10.1136/jnnp.38.10.1027. [DOI] [PMC free article] [PubMed] [Google Scholar]
- 22.Funahashi S, Inoue M. Neuronal interactions related to working memory processes in the primate prefrontal cortex revealed by cross-correlation analysis. Cereb Cortex. 2000;10:535–551. doi: 10.1093/cercor/10.6.535. [DOI] [PubMed] [Google Scholar]
- 23.Funahashi S, Bruce CJ, Goldman-Rakic PS. Mnemonic coding of visual space in the monkey's dorsolateral prefrontal cortex. J Neurophysiol. 1989;61:331–349. doi: 10.1152/jn.1989.61.2.331. [DOI] [PubMed] [Google Scholar]
- 24.Funahashi S, Bruce CJ, Goldman-Rakic PS. Visuospatial coding in primate prefrontal neurons revealed by oculomotor paradigms. J Neurophysiol. 1990;63:814–831. doi: 10.1152/jn.1990.63.4.814. [DOI] [PubMed] [Google Scholar]
- 25.Funahashi S, Bruce CJ, Goldman-Rakic PS. Neuronal activity related to saccadic eye movements in the monkey's dorsolateral prefrontal cortex. J Neurophysiol. 1991;65:1464–1483. doi: 10.1152/jn.1991.65.6.1464. [DOI] [PubMed] [Google Scholar]
- 26.Funahashi S, Chafee MV, Goldman-Rakic PS. Prefrontal neuronal activity in rhesus monkeys performing a delayed anti-saccade task. Nature. 1993;365:753–756. doi: 10.1038/365753a0. [DOI] [PubMed] [Google Scholar]
- 27.Fuster JM, Alexander GE. Neuron activity related to short-term memory. Science. 1971;173:652–654. doi: 10.1126/science.173.3997.652. [DOI] [PubMed] [Google Scholar]
- 28.Georgopoulos AP, Taira M, Lukashin A. Cognitive neurophysiology of the motor cortex. Science. 1993;260:47–52. doi: 10.1126/science.8465199. [DOI] [PubMed] [Google Scholar]
- 29.Giguere M, Goldman-Rakic PS. Mediodorsal nucleus: areal, laminar, and tangential distribution of afferents and efferents in the frontal lobe of rhesus monkeys. J Comp Neurol. 1988;277:195–213. doi: 10.1002/cne.902770204. [DOI] [PubMed] [Google Scholar]
- 30.Gilbert CD, Wiesel TN. Columnar specificity of intrinsic horizontal and corticocortical connections in cat visual cortex. J Neurosci. 1989;9:2432–2442. doi: 10.1523/JNEUROSCI.09-07-02432.1989. [DOI] [PMC free article] [PubMed] [Google Scholar]
- 31.Gochin PM, Miller EK, Gross CG, Gerstein GL. Functional interactions among neurons in inferior temporal cortex of the awake macaque. Exp Brain Res. 1991;84:505–516. doi: 10.1007/BF00230962. [DOI] [PubMed] [Google Scholar]
- 32.Goldman PS, Nauta WJ. Columnar distribution of cortico-cortical fibers in the frontal association, limbic, and motor cortex of the developing rhesus monkey. Brain Res. 1977;122:393–413. doi: 10.1016/0006-8993(77)90453-x. [DOI] [PubMed] [Google Scholar]
- 33.Goldman-Rakic PS. Modular organization of prefrontal cortex. Trends Neurosci. 1984;7:419–424. [Google Scholar]
- 34.Goldman-Rakic PS. Circuitry of the prefrontal cortex and the regulation of behavior by representational knowledge. In: Plum F, Mountcastle VB, editors. Handbook of physiology. American Physiological Society; Bethesda, MD: 1987. pp. 373–417. [Google Scholar]
- 35.Goldman-Rakic PS. Working memory dysfunction in schizophrenia. J Neuropsychiatry Clin Neurosci. 1994;6:348–357. doi: 10.1176/jnp.6.4.348. [DOI] [PubMed] [Google Scholar]
- 36.Goldman-Rakic PS. Cellular basis of working memory. Neuron. 1995;14:477–485. doi: 10.1016/0896-6273(95)90304-6. [DOI] [PubMed] [Google Scholar]
- 37.Goldman-Rakic PS, Porrino LJ. The primate mediodorsal (MD) nucleus and its projection to the frontal lobe. J Comp Neurol. 1985;242:535–560. doi: 10.1002/cne.902420406. [DOI] [PubMed] [Google Scholar]
- 38.Gonzalez-Burgos G, Barrionuevo G, Lewis DA. Horizontal synaptic connections in monkey prefrontal cortex: an in vitro electrophysiological study. Cereb Cortex. 2000;10:82–92. doi: 10.1093/cercor/10.1.82. [DOI] [PubMed] [Google Scholar]
- 39.Hata Y, Tsumoto T, Sato H, Hagihara K, Tamura H. Development of local horizontal interactions in cat visual cortex studied by cross-correlation analysis. J Neurophysiol. 1993;69:40–56. doi: 10.1152/jn.1993.69.1.40. [DOI] [PubMed] [Google Scholar]
- 40.Hatsopoulos NG, Ojakangas CL, Donoghue JP, Maynard EM. Detection and identification of ensemble codes in motor cortex. In: Eichenbaum H, Davis JL, editors. Neuronal ensembles. Wiley; New York: 1998. pp. 161–175. [Google Scholar]
- 41.Jacobsen CF. Studies of cerebral function in primates. Comp Psychol Monogr. 1936;13:1–68. [Google Scholar]
- 42.Judge SJ, Richmond BJ, Chu FC. Implantation of magnetic search coils for measurement of eye position: an improved method. Vision Res. 1980;20:535–538. doi: 10.1016/0042-6989(80)90128-5. [DOI] [PubMed] [Google Scholar]
- 43.Juergens E, Eckhorn R. Parallel processing by a homogeneous group of coupled model neurons can enhance, reduce and generate signal correlations. Biol Cybern. 1997;76:217–227. doi: 10.1007/s004220050334. [DOI] [PubMed] [Google Scholar]
- 44.Kreiter AK, Singer W. Stimulus-dependent synchronization of neuronal responses in the visual cortex of the awake macaque monkey. J Neurosci. 1996;16:2381–2396. doi: 10.1523/JNEUROSCI.16-07-02381.1996. [DOI] [PMC free article] [PubMed] [Google Scholar]
- 45.Kritzer MF, Goldman-Rakic PS. Intrinsic circuit organization of the major layers and sublayers of the dorsolateral prefrontal cortex in the rhesus monkey. J Comp Neurol. 1995;359:131–143. doi: 10.1002/cne.903590109. [DOI] [PubMed] [Google Scholar]
- 46.Kruger J, Aiple F. Multimicroelectrode investigation of monkey striate cortex: spike train correlations in the infragranular layers. J Neurophysiol. 1988;60:798–828. doi: 10.1152/jn.1988.60.2.798. [DOI] [PubMed] [Google Scholar]
- 47.Kubota K, Niki H. Prefrontal cortical unit activity and delayed alternation performance in monkeys. J Neurophysiol. 1971;34:337–347. doi: 10.1152/jn.1971.34.3.337. [DOI] [PubMed] [Google Scholar]
- 48.Lee D, Port NL, Kruse W, Georgopoulos AP. Variability and correlated noise in the discharge of neurons in motor and parietal areas of the primate cortex. J Neurosci. 1998;18:1161–1170. doi: 10.1523/JNEUROSCI.18-03-01161.1998. [DOI] [PMC free article] [PubMed] [Google Scholar]
- 49.Levick WR, Cleland BG, Dubin MW. Lateral geniculate neurons of cat: retinal inputs and physiology. Invest Ophthalmol. 1972;11:302–311. [PubMed] [Google Scholar]
- 50.Levitt JB, Lewis DA, Yoshioka T, Lund JS. Topography of pyramidal neuron intrinsic connections in macaque monkey prefrontal cortex (areas 9 and 46). J Comp Neurol. 1993;338:360–376. doi: 10.1002/cne.903380304. [DOI] [PubMed] [Google Scholar]
- 51.Lisman JE, Fellous JM, Wang XJ. A role for NMDA-receptor channels in working memory. Nat Neurosci. 1998;1:273–275. doi: 10.1038/1086. [DOI] [PubMed] [Google Scholar]
- 52.Lurito JT, Georgakopoulos T, Georgopoulos AP. Cognitive spatial-motor processes. 7. The making of movements at an angle from a stimulus direction: studies of motor cortical activity at the single cell and population levels. Exp Brain Res. 1991;87:562–580. doi: 10.1007/BF00227082. [DOI] [PubMed] [Google Scholar]
- 53.Malach R, Amir Y, Harel M, Grinvald A. Relationship between intrinsic connections and functional architecture revealed by optical imaging and in vivo targeted biocytin injections in primate striate cortex. Proc Natl Acad Sci USA. 1993;90:10469–10473. doi: 10.1073/pnas.90.22.10469. [DOI] [PMC free article] [PubMed] [Google Scholar]
- 54.Maldonado PE, Godecke I, Gray CM, Bonhoeffer T. Orientation selectivity in pinwheel centers in cat striate cortex. Science. 1997;276:1551–1555. doi: 10.1126/science.276.5318.1551. [DOI] [PubMed] [Google Scholar]
- 55.Melchitzky DS, Sesack SR, Pucak ML, Lewis DA. Synaptic targets of pyramidal neurons providing intrinsic horizontal connections in monkey prefrontal cortex. J Comp Neurol. 1998;390:211–224. doi: 10.1002/(sici)1096-9861(19980112)390:2<211::aid-cne4>3.0.co;2-4. [DOI] [PubMed] [Google Scholar]
- 56.Michalski A, Gerstein GL, Czarkowska J, Tarnecki R. Interactions between cat striate cortex neurons. Exp Brain Res. 1983;51:97–107. doi: 10.1007/BF00236807. [DOI] [PubMed] [Google Scholar]
- 57.Milner B. Effects of different brain lesions on card sorting. Arch Neurol. 1963;9:100–110. [Google Scholar]
- 58.Nelson JI, Salin PA, Munk MH, Arzi M, Bullier J. Spatial and temporal coherence in cortico-cortical connections: a cross-correlation study in areas 17 and 18 in the cat. Vis Neurosci. 1992;9:21–37. doi: 10.1017/s0952523800006349. [DOI] [PubMed] [Google Scholar]
- 59.Niki H, Watanabe M. Prefrontal unit activity and delayed response: relation to cue location versus direction of response. Brain Res. 1976;105:79–88. doi: 10.1016/0006-8993(76)90924-0. [DOI] [PubMed] [Google Scholar]
- 60.Nowak LG, Munk MH, Nelson JI, James AC, Bullier J. Structural basis of cortical synchronization. I. Three types of interhemispheric coupling. J Neurophysiol. 1995;74:2379–2400. doi: 10.1152/jn.1995.74.6.2379. [DOI] [PubMed] [Google Scholar]
- 61.Perkel DH, Gerstein GL, Moore GP. Neuronal spike trains and stochastic point processes. II. Simultaneous spike trains. Biophys J. 1967;7:419–440. doi: 10.1016/S0006-3495(67)86597-4. [DOI] [PMC free article] [PubMed] [Google Scholar]
- 62.Petrides M, Pandya DN. Projections to the frontal cortex from the posterior parietal region in the rhesus monkey. J Comp Neurol. 1984;228:105–116. doi: 10.1002/cne.902280110. [DOI] [PubMed] [Google Scholar]
- 63.Pucak ML, Levitt JB, Lund JS, Lewis DA. Patterns of intrinsic and associational circuitry in monkey prefrontal cortex. J Comp Neurol. 1996;376:614–630. doi: 10.1002/(SICI)1096-9861(19961223)376:4<614::AID-CNE9>3.0.CO;2-4. [DOI] [PubMed] [Google Scholar]
- 64.Rao SG, Williams GV, Goldman-Rakic PS. Isodirectional tuning of adjacent interneurons and pyramidal cells during working memory: evidence for microcolumnar organization in PFC. J Neurophysiol. 1999;81:1903–1916. doi: 10.1152/jn.1999.81.4.1903. [DOI] [PubMed] [Google Scholar]
- 65.Reid RC, Alonso JM. Specificity of monosynaptic connections from thalamus to visual cortex. Nature. 1995;378:281–284. doi: 10.1038/378281a0. [DOI] [PubMed] [Google Scholar]
- 66.Riehle A, Grun S, Diesmann M, Aertsen A. Spike synchronization and rate modulation differentially involved in motor cortical function. Science. 1997;278:1950–1953. doi: 10.1126/science.278.5345.1950. [DOI] [PubMed] [Google Scholar]
- 67.Romanski LM, Tian B, Fritz J, Mishkin M, Goldman-Rakic PS, Rauschecker JP. Dual streams of auditory afferents target multiple domains in the primate prefrontal cortex. Nat Neurosci. 1999;2:1131–1136. doi: 10.1038/16056. [DOI] [PMC free article] [PubMed] [Google Scholar]
- 68.Sanes JN, Donoghue JP. Oscillations in local field potentials of the primate motor cortex during voluntary movement. Proc Natl Acad Sci USA. 1993;90:4470–4474. doi: 10.1073/pnas.90.10.4470. [DOI] [PMC free article] [PubMed] [Google Scholar]
- 69.Schwarz C, Bolz J. Functional specificity of a long-range horizontal connection in cat visual cortex: a cross-correlation study. J Neurosci. 1991;11:2995–3007. doi: 10.1523/JNEUROSCI.11-10-02995.1991. [DOI] [PMC free article] [PubMed] [Google Scholar]
- 70.Seidemann E, Meilijson I, Abeles M, Bergman H, Vaadia E. Simultaneously recorded single units in the frontal cortex go through sequences of discrete and stable states in monkeys performing a delayed localization task. J Neurosci. 1996;16:752–768. doi: 10.1523/JNEUROSCI.16-02-00752.1996. [DOI] [PMC free article] [PubMed] [Google Scholar]
- 71.Selemon LD, Goldman-Rakic PS. Common cortical and subcortical targets of the dorsolateral prefrontal and posterior parietal cortices in the rhesus monkey: evidence for a distributed neural network subserving spatially guided behavior. J Neurosci. 1988;8:4049–4068. doi: 10.1523/JNEUROSCI.08-11-04049.1988. [DOI] [PMC free article] [PubMed] [Google Scholar]
- 72.Suzuki H, Azuma M. Topographic studies on visual neurons in the dorsolateral prefrontal cortex of the monkey. Exp Brain Res. 1983;53:47–58. doi: 10.1007/BF00239397. [DOI] [PubMed] [Google Scholar]
- 73.Toyama K, Kimura M, Tanaka K. Cross-correlation analysis of interneuronal connectivity in cat visual cortex. J Neurophysiol. 1981;46:191–201. doi: 10.1152/jn.1981.46.2.191. [DOI] [PubMed] [Google Scholar]
- 74.Ts'o DY, Gilbert CD, Wiesel TN. Relationships between horizontal interactions and functional architecture in cat striate cortex as revealed by cross-correlation analysis. J Neurosci. 1986;6:1160–1170. doi: 10.1523/JNEUROSCI.06-04-01160.1986. [DOI] [PMC free article] [PubMed] [Google Scholar]
- 75.Vaadia E, Haalman I, Abeles M, Bergman H, Prut Y, Slovin H, Aertsen A. Dynamics of neuronal interactions in monkey cortex in relation to behavioural events. Nature. 1995;373:515–518. doi: 10.1038/373515a0. [DOI] [PubMed] [Google Scholar]
- 76.Weinberger DR, Berman KF, Zec RF. Physiologic dysfunction of dorsolateral prefrontal cortex in schizophrenia. I. Regional cerebral blood flow evidence. Arch Gen Psychiatry. 1986;43:114–124. doi: 10.1001/archpsyc.1986.01800020020004. [DOI] [PubMed] [Google Scholar]
- 77.Wilson FA, O'Scalaidhe SP, Goldman-Rakic PS. Functional synergism between putative gamma-aminobutyrate-containing neurons and pyramidal neurons in prefrontal cortex. Proc Natl Acad Sci USA. 1994;91:4009–4013. doi: 10.1073/pnas.91.9.4009. [DOI] [PMC free article] [PubMed] [Google Scholar]
- 78.Zipser D, Kehoe B, Littlewort G, Fuster J. A spiking network model of short-term active memory. J Neurosci. 1993;13:3406–3420. doi: 10.1523/JNEUROSCI.13-08-03406.1993. [DOI] [PMC free article] [PubMed] [Google Scholar]