

Abstract
Reaching movements performed without vision of the moving limb are continuously monitored, during their execution, by feedback loops (designated nonvisual). In this study, we investigated the functional anatomy of these nonvisual loops using positron emission tomography (PET). Seven subjects had to “look at” (eye) or “look and point to” (eye–arm) visual targets whose location either remained stationary or changed undetectably during the ocular saccade (when vision is suppressed). Slightly changing the target location during gaze shift causes an increase in the amount of correction to be generated. Functional anatomy of nonvisual feedback loops was identified by comparing the reaching condition involving large corrections (jump) with the reaching condition involving small corrections (stationary), after subtracting the activations associated with saccadic movements and hand movement planning [(eye–arm–jumping minus eye–jumping) minus (eye–arm–stationary minus eye–stationary)]. Behavioral data confirmed that the subjects were both accurate at reaching to the stationary targets and able to update their movement smoothly and early in response to the target jump. PET difference images showed that these corrections were mediated by a restricted network involving the left posterior parietal cortex, the right anterior intermediate cerebellum, and the left primary motor cortex. These results are consistent with our knowledge of the functional properties of these areas and more generally with models emphasizing parietal–cerebellar circuits for processing a dynamic motor error signal.
Keywords: error correction, feedback, reaching, cerebellum, parietal, double step, PET, human
Imaging studies using positron emission tomography (PET) have identified a large set of cortical and subcortical areas activated during the execution of goal-directed movements. During the last decade, several attempts have been made to partition this extended reach related network into separate functional subcircuits mediating, for instance, visuomotor adaptation (Clower et al., 1996) or the control of movement velocity (Turner et al., 1998). The present study is in line with this approach. Our goal was to identify the functional anatomy of nonvisual feedback loops, i.e., of feedback loops that do not rely on the vision of the moving limb (for review, see Desmurget and Grafton, 2000). The existence of these loops was demonstrated initially in simple psychophysical experiments showing that reaching movements performed without vision of the moving limb were significantly less accurate when the target was turned off after hand movement onset (Prablanc et al., 1986). Further evidence was provided by subliminal target displacement experiments (Goodale et al., 1986; Prablanc and Martin, 1992; Desmurget et al., 1999a). In these “double-step” experiments, subjects were required to “look and point,” in the dark, to visual targets displayed in the peripheral visual field. During saccadic gaze displacement (when vision is suppressed) the target location was slightly modified. This modification triggered a change in hand trajectory that deviated early and smoothly from its initial path to reach the new target location. The occurrence and characteristics of these deviations were identical whether or not vision of the moving limb was allowed, indicating that nonvisual feedback loops represent the key mechanism for early hand trajectory control, even when vision of the moving limb is available (Prablanc and Martin, 1992).
Functionally, subliminal double-step paradigms do mimic the organization of single-step movements directed at stationary targets (Desmurget et al., 1999a; Desmurget and Grafton, 2000). Indeed, when a subject is required to point “quickly and accurately” to a stationary target located in the peripheral visual field, muscle activation starts nearly simultaneously for eyes and arm (Biguer et al., 1982), indicating that the motor command initially sent to the upper limb is based on the initial peripheral visual signal. As reported in several studies, this signal is not entirely accurate (Prablanc et al., 1979; Bock, 1993). At the end of the ocular saccade, which roughly corresponds to hand movement onset (Prablanc and Martin, 1992), the target location is recomputed on the basis of perifoveal information. The updated visual signal is then used by the nervous system to adjust the ongoing trajectory (Prablanc et al., 1986). Modifying slightly the target location during gaze shift simply increases an error that is already present in the system. In this study, we took advantage of this functional similarity to investigate the motor network mediating nonvisual feedback loops during reaching movements.
MATERIALS AND METHODS
Subjects
Seven right-handed naive subjects (one female, six males) ranging from 19 to 37 years (mean, 25.4; SD, 6.6) participated in the study. All subjects gave informed consent, and the study was approved by the institutional Human Investigation Committee of Emory University. All subjects underwent a brief neurological examination to ensure they were healthy and devoid of visual deficits.
Apparatus
Throughout the study, subjects were supine in the scanner. Their heads were immobilized with a thermoplastic mask. The experimental apparatus was similar to one used in previous psychophysical studies (Desmurget et al., 1999a,b) (Fig.1A). It consisted of a pointing board placed in front of the subjects. An array of light-emitting diodes (LEDs) was arranged orthogonally to the pointing board. A half-reflecting mirror was positioned at an angle of 45° with respect to both the pointing board and the array of LEDs. The subjects saw the virtual images of the LEDs through the mirror, in the plane of the board. Consequently, the reaching hand could not occlude the virtual image of the LEDs, which prevented the subjects from gaining an indirect feedback of their reaching accuracy. The targets were located on a circle centered on the hand starting point (S; radius, 25 cm). A direct orthogonal reference frame was defined for data analysis and target location definition (Fig.1B). S was the origin of this reference frame. Thez-axis was orthogonal to the pointing board and oriented toward the subject. The x-axis was horizontal and oriented rightward. The y was orthogonal to x-zand oriented upward. Nine targets were used in the present experiment. One green diode was located in the left hemispace at minus30° (with respect to the y-axis). Eight red diodes were located in the right hemispace with a 5° increment from 10 to 45°. The orientation of the pointing board was adjusted so that the z-axis passed through the subject cyclopean eye (center of mass of the two eye balls). The distance between the cyclopean eye and the hand starting point was 45 cm. During the experiment, movement of an infrared emitting diode located on the subject's index fingertip was recorded with an Elite motion analysis system at a sampling frequency of 100 Hz. Eye movements were recorded binocularly using DC electro-oculography (EOG).
Fig. 1.
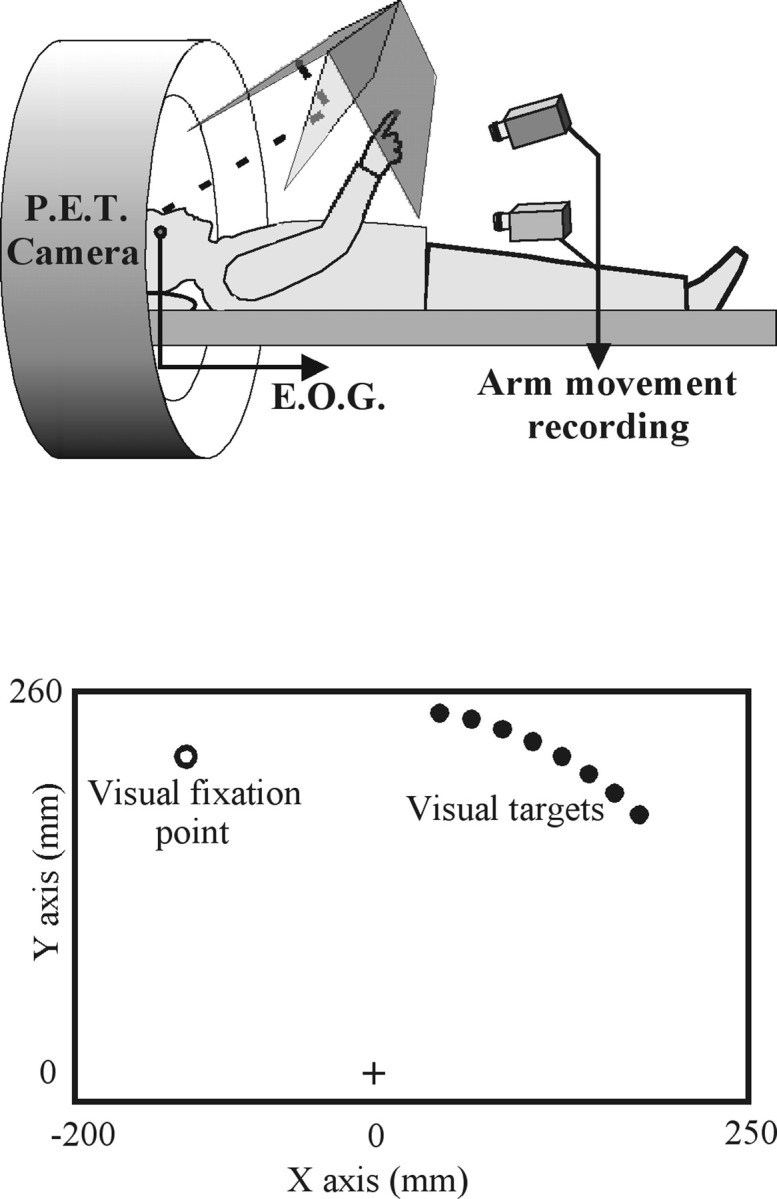
A, Schematic representation of the experimental apparatus. Subjects were supine with their head immobilized in the scanner. A pointing board was placed in front of them. An array of LEDs and a half-reflecting mirror were suspended over the pointing board. The subjects saw the virtual image of the LEDs (targets) through the mirror, in the plane of the board.B, Schematic representation of the pointing board. Nine LEDs were used in the present experiment. They were located on a circle (radius, 250 mm; center, the hand starting point). One green diode (white circle) was located in the left hemispace at −30° (visual fixation point). Eight red diodes (black circles) were located in the right hemispace with a 5° increment from 10 to 45° (targets).
Experimental conditions
Light was turned off at injection time (i.e., 10 sec before the start of the scan; see below), and all scans were recorded in a totally dark room. Light was turned on between scans. The protocol resulted from the combination of two experimental variables. The first variable was related to the instruction given to the subject before the session. Subjects were instructed either to “look and point to the target” (eye + arm: eye–arm), or to only “look at the targets, without pointing” (eye). The second variable was related to the type of trial defined by the target response. In half of the sessions, the target remained stationary during the whole trial (stationary). In the other half, the target location was modified during the saccadic response (jump). The combination of these two variables resulted in four experimental conditions: eye–arm–stationary, eye–arm–jump, eye–stationary, and eye–jump. Each of these four conditions was replicated three times leading to a total number of 12 scans per subject (four conditions, three replications). The different conditions and different replications were randomly ordered across subjects. The sequence of target presentation was strictly balanced with respect to the effector factor (for a given subject, the three sequences of target presentation used for the three repetitions of the eye condition were also used for the eye–arm condition). For the perturbation factor (jump vs stationary) the sequence of target presentation was balanced with respect to the movement final location. In the stationary condition the subjects pointed 12 times to each target. In the jump condition the same targets were presented after either a leftward or a rightward jump. The 10° target (extreme left) was always presented after a leftward jump (15° → 10°). The 45° target (extreme right) was always presented after a rightward jump (40° → 45°). The other targets were presented after either a leftward (six times) or a rightward jump (six times).
All scans involved the same sequence of events. (1) The green visual fixation point (left LED) was turned on for 1.4 sec. (2) Visual fixation was turned off while one of the red targets (right LEDs) was simultaneously turned on. (3) Depending on the experimental instruction, the subjects had to “look at” (eye) or “look and point to” (eye–arm) the target. (4) The target location either remained stationary or was modified during the ocular saccade (because of saccadic suppression this displacement was not consciously detected by the subjects). The target presentation phase lasted 1.4 sec. (5) The green target was turned on again for visual fixation. In the eye–arm conditions, the subjects used proprioceptive information from the contralateral left hand to return the right hand quickly to the starting point. Their left index finger was placed, as a tactile mark, just below the hand starting location while their left arm rested comfortably on a large pillow placed on their abdomen. In the reaching condition when the right hand was at the starting point, the elbow was slightly flexed (∼140° if 180 describes a fully extended arm) with the plane of the arm (wrist–elbow–shoulder) making an angle of ∼30° with respect to the sagittal plane. In the eye condition both the right and left hands rested passively on the pillow.
During the experiment, eye velocity was extracted on-line from the position signal, using a two-point central difference derivative algorithm (Bahill and McDonald, 1983). The change in target location occurred, in the jump conditions, when eye velocity reached a level roughly equal to half of its the peak value. The threshold for target jump was set manually on an oscilloscope at the beginning of the experiment while the subject was required to perform a series of saccades. It was adjusted during the scans if necessary.
Behavioral analyses
For arm movements, the x, y, andz position signals were filtered at 10 Hz with a second-order Butterworth dual pass filter. Movement velocity was computed from the filtered position signal, using a least square second-order polynomial method (window ± 4 points). The same method was used to compute the acceleration of the hand from the velocity signal. The main arm-related parameters analyzed in this experiment were the hand reaction time (RThand), the hand movement duration (MDhand), the index finger final location, and the hand path linearity. The index finger final location was defined by the x and ycoordinates of the index fingertip location at the end of the trial. Hand path linearity was defined as the ratio of the largest deviation of arm trajectory from the line connecting the start and end points of the movement to the length of this line (Atkeson and Hollerbach, 1985). It accounted for the global movement curvature (Desmurget et al., 1999b). The hand path linearity index is equal to 0 when the movement is perfectly straight and to 0.5 when the movement is semicircular. In addition to the previous parameters, we also determined the movement direction (Mdir) at the time of peak acceleration and time of peak velocity. Mdir was determined by computing the azimuth and elevation angles of the tangential velocity vector. As shown by earlier studies (Prablanc and Martin, 1992; Desmurget and Prablanc, 1997), Mdir is the most accurate indicator of the motor reaction time to the perturbation. The onset and the end of the movements were computed automatically using the following thresholds: hand velocity = 80 mm/sec and hand acceleration = 150 mm/sec2.
Two-way ANOVA (perturbation × target location) was used to determine significant differences between experimental conditions for arm movement parameters. Two different ANOVA were conducted to contrast the stationary condition with each of the jump conditions (leftward or rightward). This was done because rightward and leftward target jumps are expected to have opposite kinematic effects and because the experimental design was not complete with respect to the initial target location factor (the extreme left target was never the initial target location for the leftward jump condition; the extreme right target was never the initial target location for the rightward jump condition). For the comparisons involving leftward jumps, the 10° target was removed from the stationary dataset. For the comparisons involving the rightward jumps, the 45° target was removed from the stationary dataset. Bidimensional parameters such as the index final location (x and y coordinates) were compared using two way MANOVAs. In this case, the F value was determined from the Wilk's lambda, using Rao's approximation (Maxwell and Delaney, 1990).
The calibration of the EOG signal was performed in two steps. First, the eccentricity of the different targets was redefined with respect to the cyclopean eye (target eccentricity was initially defined with respect to the hand starting point). When expressed in eye-centered coordinates, the target eccentricities were: −15.5° (−30° fixation point/sec), 5.5° (10°/sec), 8.2° (15°/sec), 10.8° (20°/sec), 13.2° (25°/sec), 15.5° (30°/sec), 17.7° (35°/sec), 19.7° (40°/sec), and 21.4° (45°/sec). Second, the EOG signal was measured while the subject looked at the different targets. A calibration curve was then computed from these measurements by fitting a polynomial through the data. This curve was used to transform the EOG signal into a calibrated eye position signal. Once calibrated, the eye position signal was numerically filtered at 30 Hz with a second-order Butterworth dual pass filter. The velocity signal was computed from the filtered position signal, using a least square second-order polynomial method (window ± 4 points). The main saccadic parameters analyzed in this experiment were the eye reaction time (RTeye), the eye movement duration (MDeye), and the amplitude of the primary saccade. The latter parameter was expressed as a percentage of the initial required displacement. The beginning and the end of the primary saccade were automatically detected using a velocity threshold procedure (20°/sec). The results of this procedure were checked off-line and corrected if necessary.
Three-way ANOVA was used to determine significant differences between experimental conditions for eye movements [effector (eye alone vs eye–arm); perturbation; target location]. As for arm movements (see above), we conducted two different ANOVAs to contrast the stationary condition with each of the jump conditions (leftward or rightward). Because the primary saccadic response is known to be unmodified on-line on the basis of peripheral visual information (Deubel et al., 1986;Desmurget et al. 2000), we also conducted a single three way ANOVA in which the saccades related to leftward or rightward trials were averaged together. Results were identical in both analyses. As a consequence, only the first one will be reported here for the sake of consistency.
The statistical threshold was set at p = 0.05 for all behavioral analyses.
Imaging
Imaging methods have been described in previous publications (Desmurget et al., 1998, 2000). In brief, regional cerebral blood flow (rCBF) images were acquired with a Siemens ECAT Exact scanner, by using a modified autoradiographic method in three-dimensional mode. Ninety second scans were recorded every 8 min. The series of scans was made, from each subject, using bolus intravenous injections of H215O (25 mCi) that were delivered into the left arm 10 sec before the start of the scan. Performance of the designated task began at the same time as the scanning. Images were reconstructed by using calculated attenuation correction.
Image processing was performed on a SunSparc5 workstation. For spatial normalization, a within-subject alignment of PET scans was performed by using an automated registration algorithm (Woods et al., 1998a,b). For each subject, the mean PET image was then coregistered to a population-based PET reference atlas centered in Talairach coordinates (Talairach and Tournoux 1988), using affine and nonlinear transforms with 60 degrees of freedom (Woods et al., 1998a,b). Coregistered PET images were smoothed to a final isotropic resolution of 15 mm full width at half maximum and normalized to each other by using proportionate global scaling. ANOVA for a randomized complete block design was used, for all contrasts, to identify significant task effects (Neter et al., 1990; Woods et al., 1996). The effects (and source of variance) in the statistical model were subject, task, and repetition. Given the performance consistency of the behavioral paradigm under investigation and the randomization procedure, repetition could be treated as replication, resulting in a two-way ANOVA (Turner et al., 1998). For all the contrasts evaluated in this study, the statistical threshold was initially set at p= 0.005. The following five contrasts were evaluated.
Overall hand-reaching effect. [(eye–arm–jump plus eye–arm-stationary) minus (eye–jump plus eye–stationary)] (df = 70; t ≥ 2.65). This contrast allows removal of the brain activation specifically related to the visual capture of the target. As a consequence it should primarily identify the areas involved in movement planning and movement control. However, one may not exclude the possibility that areas associated specifically with motor correction (response to the jump) or eye–hand coordination (interaction) contribute to the overall effect observed. No a priori hypothesis was formulated about the areas that might be activated in this contrast (unplanned contrast). To adjust for multiple comparisons, the t statistic image was corrected using the method developed by Friston et al. (1994). This method takes into account the size of the activation (359 resolving elements), the search volume, and the degree of image smoothness. Correction for multiple comparison was conducted at a final certainty of p < 0.01.
Strict hand-reaching effect. [eye–arm–stationary minus eye-stationary] (df = 28; t ≥ 2.76). This contrast is similar to the previous one except that only the movements to stationary targets were taken into account. If it is correct that the jump and no jump trials involve similar functional mechanisms, the strict and overall reaching contrast should give comparable results. Noa priori hypothesis was formulated about the areas that might be activated in this contrast (unplanned contrast). As a consequence, t statistic image was corrected for multiple comparisons (359 resolving elements) to a final certainty ofp < 0.01 using the method developed by Friston et al. (1994).
Overall jump effect. [(eye–arm–jump plus eye–jump) minus (eye–arm–stationary plus eye–stationary)] (df = 56;t ≥ 2.67). In this contrast we determined the effect of jumping the target location, irrespective of the effector. The overall jump effect should give information about the global network activated when the estimation of the target location by the peripheral retina is erroneous (see introductory remarks). No a priorihypothesis was formulated about the areas that might be activated in this contrast (unplanned contrast). As a consequence, tstatistic image was corrected for multiple comparisons (359 resolving elements) to a final certainty of p < 0.01 using the method developed by Friston et al. (1994).
Eye error correction effect. [eye–jump minus eye–stationary] (df = 56; t ≥ 2.67). In this contrast we determined the effect of jumping the target location on the oculomotor system. This contrast should give information about the network activated when the initial saccadic response is incorrect. Noa priori hypothesis was formulated about the areas that might be activated in this contrast (unplanned contrast). As a consequence, t statistic image was corrected for multiple comparisons (359 resolving elements) to a final certainty ofp < 0.01 using the method developed by Friston et al. (1994).
Hand error correction effect. [(eye–arm–jump minus eye–jump) minus (eye–arm–stationary minus eye–stationary)] (df = 56; t ≥ 2.67). In this contrast we determined the subcircuit mediating on-line hand trajectory adjustments. To this end, we contrasted the jump and stationary conditions after subtraction of the oculomotor-related activity. It is worth emphasizing that this double difference amounts, in fact, to an interaction. The areas identified by this contrast are the areas that increase their responsiveness when larger corrections have to be performed. As already emphasized, what we compare in this experiment is a condition involving small corrections (stationary) with a condition involving large corrections (jump). Consequently, the interpretation of the present contrast can be framed in terms of modulation of the underlying executive system by a perturbation that increases the error processing. A potential difficulty with this design, and more precisely with the fact that similar feedback loops are engaged in both the jump and stationary conditions, is that the hand error correction effect might be very subtle and hard to detect. Stringent statistical procedures involving strict corrections for multiple comparisons might be excessively conservative in this context. At the same time, however, increasing the statistical p value or abolishing corrections for multiple comparisons might abnormally increase the risk of type I errors (declaring significant an activation that is not). To accommodate these contradictory exigencies, (i.e., increasing statistical sensitivity while minimizing type I errors) a two-step analysis was conducted. First, a nonplanned contrast was evaluated. For this contrast, no a priori hypothesis was formulated about the areas that might be activated. As a consequence, the tstatistic image was corrected for multiple comparisons (359 resolving elements) to a final certainty of p < 0.01 using the method developed by Friston et al. (1994). Second, a planned contrast was evaluated. For this contrast, the search volume was restricteda priori to the structures showing an unequivocal reach related effect, i.e., to the structures activated in the strict hand-reaching contrast. No correction for multiple comparisons was applied within this restricted set of functionally plausible structures. To avoid an overly conservative restriction of the search volume “the reach-related network” was defined at a relaxed threshold, with no corrections for multiple comparisons (strict hand-reaching effect at p < 0.01; 39 resolving elements).
RESULTS
Behavioral observations: saccade characteristics
For both the stationary and jump conditions, the saccadic response consisted of two phases (Fig.2A): an initial saccade undershooting the initial target position and covering on average 96% (±3.7) of the initially required displacement and a corrective saccade achieving accurate target acquisition. The amplitude of the primary saccade did not vary significantly as a function of the perturbation [stationary, 96.3% (±3.9); rightward jump, 95.1% (±3.8); leftward jump, 95.7% (±4.1); p > 0.10] or effector factors [eye, 95.6% (±4.1); eye–arm, 95.9% (±3.9); p > 0.35]. The number of trials involving more than one corrective saccade was marginal, even in the jump condition. This latter observation was expected considering the modest amplitude of the target jump (between 1.7° and 2.7°; see Materials and Methods) (Desmurget et al., 2000).
Fig. 2.

Individual trials performed by one subject in the eye–arm condition to stationary and jumping targets (stationary 25°,continuous line; jumping 25° → 20°, dotted line; jumping 25° → 30°, dashed line).A, Eye velocity signals. B, Hand velocity signals. C, Cartesian hand paths. A andB show that hand movement starts around the end of the main saccade. C shows, for the perturbed trials, that hand movement is initially directed to the first target location before diverging toward the second target location. As shown by the hand velocity profiles, hand paths updating was performed smoothly without interrupting the ongoing movement.
RTeye was equal to 212 msec (±36). This parameter did not vary significantly as a function of the perturbation [stationary, 215 msec (±43); rightward jump, 209 msec (±31); leftward jump, 211 msec (±31); p > 0.35] or effector factors [eye, 215 msec (±36); eye–arm, 209 msec (±35);p > 0.25]. MDeye was equal to 88 msec (±15). It was not affected by the perturbation factor [stationary, 87 msec (±14); rightward jump, 85 msec (±14); leftward jump, 92 msec (±16); p > 0.10] but was found to be significantly shorter in eye–arm than in eye [86 msec (±13) versus 90 msec (±16); p < 0.01]. The meaning of this heretofore undescribed effect is unclear. On the one hand, this slight difference may represent a false positive inference. On the other hand, it may reflect the functional capacity of the motor system to update the target location more quickly to allow early hand path adjustments.
None of the subjects reported the existence of a change in target position during the saccadic response, even when questioned explicitly at the end of the study. The absence of conscious perception of the target jump is coherent with the absence of significant variation of the kinematic characteristics of the primary saccadic response as a function of the perturbation factor.
Behavioral observations: arm movement characteristics
RThand was independent of the perturbation factor [stationary, 277 msec (±50); rightward jump, 269 msec (±48); leftward jump, 263 msec (±40); p > 0.25]. On average RThand was 58 msec longer than RTeye [270 msec (±46) vs 212 msec (±36)]. This indicates that arm movement started around the end of the ocular saccade (for eye–arm, RTeye + MDeye = 300 msec; Fig. 2A,B), or in other words that the arm motor command was issued on the basis of a peripheral retinal input. If one considers that the onset of the agonist muscle contraction occurs 50–100 msec before the actual motion for reaching movements (Biguer et al., 1982; Turner et al., 1995), the latencies observed in this study are compatible with previous observations showing that arm muscle contraction is synchronous with eye movement onset during fast reaching movements directed at peripheral targets (Biguer et al., 1982).
Peak hand acceleration occurred on average at 125 msec (±22 msec) and was independent of the perturbation factor (p > 0.30). No significant variations of the movement direction were observed at the time of peak hand acceleration (p > 0.90), supporting the idea that the subjects did not develop a specific strategy in the jump sessions. Peak hand velocity occurred on average at 251 msec (±37), i.e., at 41% of the total movement duration. Like peak hand acceleration, peak hand velocity did not vary significantly with the perturbation factor (p > 0.50). Interestingly, significant variations of Mdir were observed at the time of peak hand velocity (p < 0.04). At this instant, Mdir was found to be rotated to the left by 2.7° on average in the leftward jump condition and rotated to the right by 3.3° on average in the rightward jump condition. This result demonstrates the existence of early path corrections in response to the target jump.
Arm trajectory amendments were clearly visible in the hand path linearity index, which varied significantly as a function of the perturbation factor [stationary, 0.120 (±0.021); rightward jump, 0.130 (±0.024); leftward jump, 0.108 (±0.019); p < 0.005] (Fig. 2C). They were also reflected in the index fingertip final location. This parameter was significantly different in the control trials directed to a given target and in the jump trials initially directed to the same target (p < 0.001). Interestingly, when the control trials directed to a given target T were contrasted with the jump trials for which T was the final target, no significant difference was observed for the final hand location (p > 0.20). This result indicates that the path corrections observed in the jump condition were nearly complete. Trajectory amendments occurred without significant increase of the mean movement duration [stationary, 618 msec (±64); rightward jump, 609 msec (±81); leftward jump, 627 msec (±88);p > 0.60], as observed in previous reports (Goodale et al., 1986; Desmurget et al., 1999a).
PET image: overall hand-reaching effect
The overall hand-reaching contrast revealed a large set of motor-related areas (Table 1, Fig.3). Congruent with earlier studies, the main cortical site of activation was observed in a wide portion of cortex surrounding the left central sulcus (contralateral to the used arm). The activated area encompassed the primary motor and the premotor cortices, the primary somatosensory cortex, the superior and inferior parietal lobules, the intraparietal sulcus, the central and parietal operculum, and the insula. A focal activation was also observed in the left occipitotemporal region. Strikingly, no cortical activation was observed in the supplementary motor area or the right hemisphere (ipsilateral to the used arm). At a noncortical level, a very large bilateral activation was observed in the cerebellum. Other significant responses were found in the thalamus (bilaterally), the left lenticular nuclei, and the brainstem.
Table 1.
Coordinates of local maxima of significant rCBF increase observed in the overall reaching contrast (p < 0.005; corrected for multiple comparisons)
| Brain areas | Coordinates (x, y,z) | t test | p value |
|---|---|---|---|
| Left cortical activation | |||
| Central sulcus (sensorimotor; 3, 4) | (−39, −29, 63) | 10.0 | 2 × 10⁻¹⁵ |
| Central sulcus (sensorimotor; 3, 4) | (−35, −27, 53) | 8.4 | 2 × 10⁻¹² |
| Precentral sulcus (dorsal premotor area; 6) | (−41, −23, 62) | 10.2 | 1 × 10⁻¹⁵ |
| (−53, −29, 50) | 7.0 | 6 × 10⁻¹⁰ | |
| Postcentral sulcus (40) | (−27, −54, 59) | 6.3 | 1 × 10⁻⁸ |
| Sup. parietal lobule (5, 7) | (−48, −30, 30) | 6.2 | 2 × 10⁻⁸ |
| Inf. parietal lobule (40) | (−24, −63, 51) | 4.0 | 0.000078 |
| Intraparietal sulcus | (−7, −24, 48) | 3.8 | 0.00015 |
| Dorsal cingulate gyrus (24) | (−47, −24, 20) | 6.1 | 3 × 10⁻⁸ |
| Operculum/insula | (−45, −59, 3) | 4.3 | 0.000027 |
| Occipitotemporal (19, 37, 21) | |||
| Basal ganglia and thalamus | |||
| Right thalamus | (4, −22, −3) | 3.5 | 0.00041 |
| Left thalamus | (−16, −18, 11) | 4.6 | 0.000009 |
| Left lenticular | (−28, −22, 14) | 3.3 | 0.00076 |
| Cerebellum | |||
| Vermis | (6, −47, −15) | >11.00 | <1 × 10⁻¹⁶ |
| Right hemisphere | (26, −59, −46) | 9.4 | 3 × 10⁻¹⁴ |
| Left hemisphere | (−20, −51, −15) | 7.1 | 4 × 10⁻¹⁰ |
| Brain stem | (4, −34, −27) | 5.2 | 0.000001 |
Talairach coordinates of the local maxima, tstatistics, and corresponding p values are reported. Brodmann areas displayed between parentheses in the brain area column are reported for the sake of information. They were inferred from the Talairach atlas.
Fig. 3.
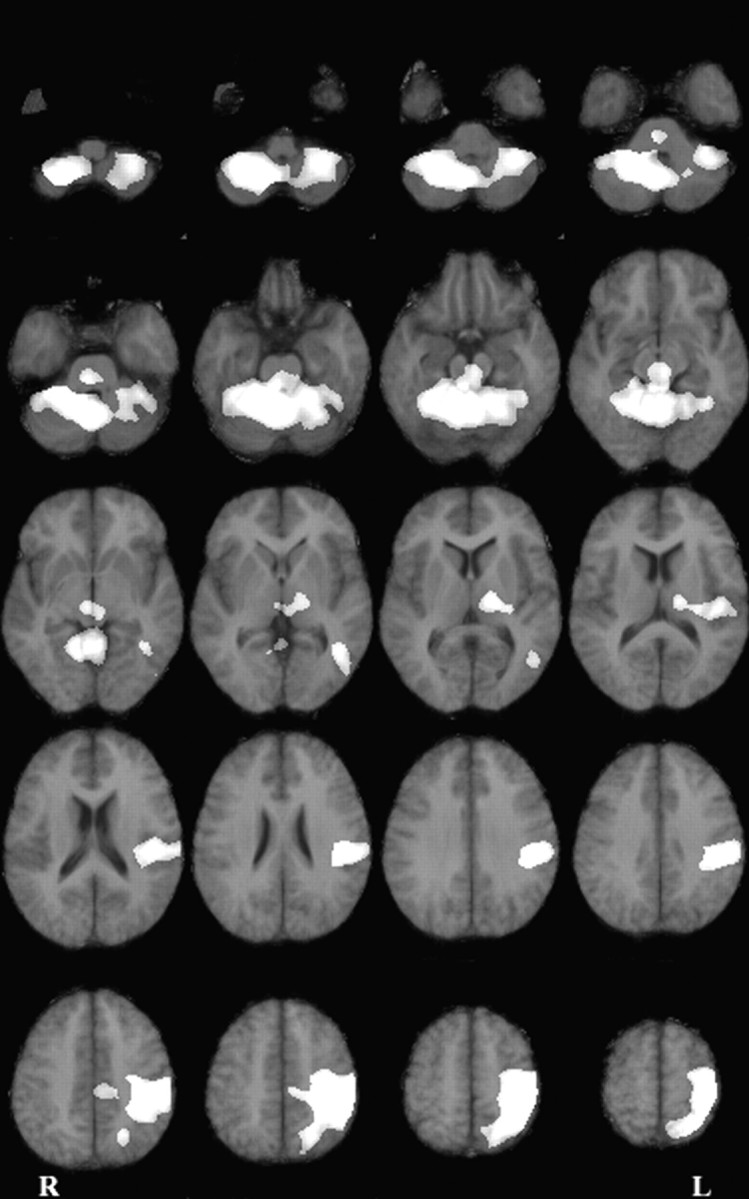
Horizontal difference images representing the overall reaching effect corrected for the eye kinematics effect (p < 0.005; adjusted for multiple comparisons). Activations are shown superimposed on a mean magnetic resonance image (MRI) in Talairach coordinates. The anatomic right side is shown on the left side of the figure. The first section (top left) is 49 mm below the anteroposterior commissural line (Z = −49). The last section (bottom right) is 65 mm above the anteroposterior commissural line (Z = +65). Sections are presented every 6 mm.
PET image: strict hand-reaching effect
The strict hand-reaching contrast revealed a pattern of activation that was globally similar to the one observed for the overall hand-reaching contrast (Table 2, Fig.4). The main cortical site of activation was observed in a wide portion of cortex surrounding the left central sulcus. The activated area encompassed the primary motor and the premotor cortices, the primary somatosensory cortex, the superior and inferior parietal lobules, the intraparietal sulcus, the central and parietal operculum, and the insula. A focal activation was also observed in the left occipitotemporal region. No cortical activation was observed in the right hemisphere. At a subcortical level, a very large bilateral activation was observed in the cerebellum. Other significant responses were found in the thalamus (bilaterally) and the brainstem. As shown in Figures 3 and 4, the main difference between the overall and strict hand-reaching contrasts was that activations were a little bit broader in the former than in the latter contrast. Two nonexclusive factors may account for this result: (1) some areas may exhibit an enhanced activity in the jump trials with respect to the stationary trials; (2) the overall reaching contrast is statistically more sensitive inasmuch as it involves a larger number of degrees of freedom (see Materials and Methods). Theoretically, the close similarity between the overall and strict contrasts is coherent with the behavioral results, suggesting that movements directed at jumping and stationary targets involve similar functional processes (see introductory remarks). Further argument supporting this view will be presented in the next section.
Table 2.
Significant activation observed in the strict reaching contrast (p < 0.005; corrected for multiple comparisons)
| Brain areas | Coordinates (x, y,z) | t test | p value |
|---|---|---|---|
| Left cortical activation | |||
| Central sulcus (sensorimotor; 3, 4) | (−36, −23, 53) | 7.0 | 6 × 10⁻⁸ |
| Precentral sulcus (dorsal premotor area; 6) | (−41, −23, 62) | 6.2 | 0.0000006 |
| (−57, −21, 48) | 4.9 | 0.000018 | |
| Postcentral sulcus (1, 2) | (−27, −54, 59) | 4.6 | 0.000041 |
| Sup. parietal lobule (5, 7) | (−46, −30, 33) | 4.3 | 0.000094 |
| Inf. parietal lobule (40) | (−24, −63, 51) | 3.9 | 0.00028 |
| Intraparietal sulcus | (−45, −30, 22) | 3.0 | 0.0028 |
| Operculum/insula | (−43, −63, 6) | 4.2 | 0.00012 |
| Occipitotemporal (19, 37, 21) | |||
| Thalamus | |||
| Right thalamus | (2, −23, 5) | 3.9 | 0.00028 |
| Left thalamus | (−2, −23, 8) | 3.7 | 0.00053 |
| Cerebellum | |||
| Vermis | (3, −51, −14) | 12.8 | 2 × 10⁻¹³ |
| Right hemisphere | (23, −62, −47) | 7.6 | 2 × 10⁻⁸ |
| Left hemisphere | (−24, −59, −17) | 5.1 | 0.000011 |
| Brainstem | (−3, −29, −17) | 4.1 | 0.00016 |
Same conventions as Table 1.
Fig. 4.
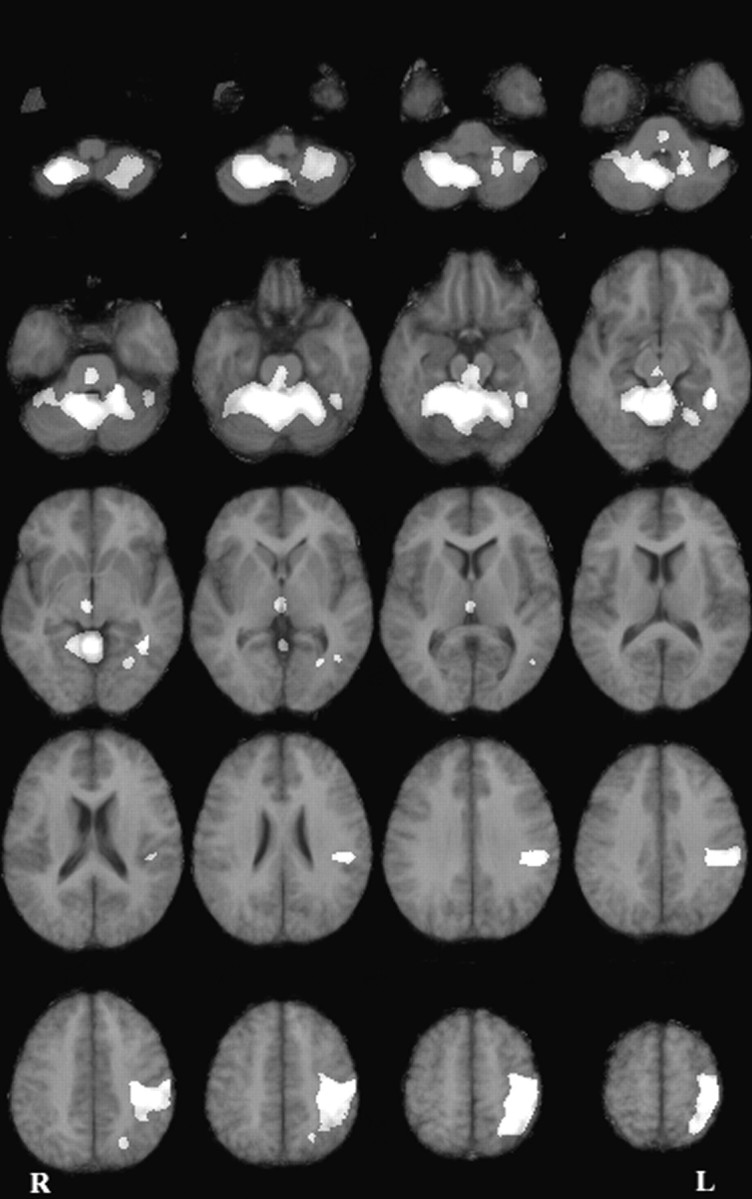
Horizontal difference images representing the strict reaching effect corrected for the eye kinematics effect (p < 0.005; adjusted for multiple comparisons). Same conventions as Figure 3.
PET image: overall jump effect, eye error correction effect, and hand error correction effect
These three contrasts failed to reveal any significant activation at either the cortical or subcortical levels after correction for multiple comparisons. These results confirm and extend the conclusions of a previous study showing that jumping the target location randomly during the course of the saccade does not generate any significant activation in the main oculomotor areas with respect to a condition in which the target location remains stationary (Desmurget et al., 2000). The present negative finding shows that the metabolic response induced by the target jump is not substantial enough to be identified with stringent nonplanned statistical procedures.
PET image: hand error correction effect and planned analysis
This analysis revealed a restricted motor network engaging three areas previously postulated to have a role in nonvisual feedback loops (see Discussion), namely the parietal cortex, the frontal cortex, and the cerebellum (Table 3, Fig.5). The parietal activation was located in the left intraparietal sulcus, in a region that is generally considered the rostral part of the posterior parietal cortex (PPC). The cerebellar activation was found in the right anterior parasagittal cerebellar cortex, in a region associated with the production of arm movements. The frontal activation was located in the arm-related area of the primary motor cortex. Figure 6displays rCBF values for these three regions of interest, in each experimental condition.
Table 3.
Significant activation observed in the hand error correction contrast (p < 0.005; uncorrected for multiple comparisons)
| Brain areas | Coordinates (x,y, z) | t test | p value |
|---|---|---|---|
| Left cortical activation | |||
| Precentral gyrus (4) | (−30,−26,57) | 2.9 | 0.0027 |
| Intraparietal sulcus | (−41,−44,58) | 3.0 | 0.002 |
| Cerebellum | |||
| Right anterior parasagittal | (11,−45,−20) | 3.0 | 0.002 |
Same conventions as Table 1.
Fig. 5.

Horizontal, sagittal, and coronal difference images representing the hand error correction effect corrected for the eye kinematics and hand movement planning effects (p < 0.005; planned comparison). Activations are shown superimposed on a mean MRI in Talairach coordinates. On the horizontal and coronal images, the anatomicright side is shown on the left side. On the sagittal images, positive values of x designate the right hemisphere (ipsilateral to the reaching arm), and negative values designate the left hemisphere (contralateral to the reaching arm). Thetop row is centered on the cerebellar activation site (11, −45, −20). The middle row is centered on the posterior parietal activation site (−41, −44, 58). The bottom row is centered on the precentral activation site (−30, −26, 57).
Fig. 6.

rCBF mean values (SD vertical bars), in each experimental condition, for the three cerebral regions showing significant activation in the hand error correction contrast (E&A, eye and arm pointing; E, eye alone;statio, stationary trial; jump, jump trial). These regions are the primary motor cortex (black triangles, left curve; Talairach coordinates: −30, −26, 57), the posterior parietal cortex (black circles, middle curve; −41, −44, 58), and the anterior parasagittal cerebellar cortex (black squares, right curve; 11, −45, −20).
DISCUSSION
We identified a distributed cerebral network activated during visually directed movements performed without vision of the moving limb. Then, we describe within this network, for the first time, a restricted subset of areas specifically involved in on-line movement guidance.
Reaching in the dark
Although the reach-related cerebral network observed in the present study is generally coherent with previous observations performed with and without vision of the moving limb (Colebatch et al., 1991; Grafton et al., 1992, 1996; Deiber et al., 1996; Lacquaniti et al., 1997; Inoue et al., 1998; Turner et al., 1998; Winstein et al., 1997), our results differ from earlier reports in two ways. First, we observed a larger noncortical contribution, especially within the cerebellum and pontine nuclei. Second, we noted a less distributed cortical activation. In particular, we did not identify any activation within the motor, premotor, and parietal cortices of the hemisphere ispilateral to the moving arm. Similarly, we did not observe any rCBF increase within the supplementary motor area or occipital visual areas. These differences may be related to the fact that the motor reaching task we investigated here was more “rudimentary” than the tasks considered in earlier experiments. The present study differs, indeed, from earlier studies by at least one of the following aspects: (1) vision of the moving limb was never allowed, preventing visual feedback loops from operating; (2) no estimation of the reaching error was provided during or at the end of trial, prohibiting motor learning (Jordan 1990; Redding and Wallace 1996); (3) the subjects reached to the target directly without the mediation of a manipulandum or a joystick, avoiding the need for complex visuomotor transformations; (4) targets were seen in binocular vision and not through a virtual display system that provides conflicting vergence and accommodation signals, thus requiring adaptive behavior by preventing real depth perception; (5) oculomotor activity was strictly controlled allowing precise evaluation of arm reaching-related changes in rCBF. Our data suggest that basic reaching movements performed without visual guidance involve a less distributed cortical network and rely more consistently on cerebellar structures than the visually more complex motor tasks usually studied.
Functional anatomy of movement guidance
Functional anatomy of nonvisual feedback loops was determined, within the reach-related motor network, by identifying the brain areas that increase their responsiveness when the error to be corrected is larger. Because this planned analysis was performed without stringent corrections for multiple comparisons (see Materials and Methods), one might wonder whether the areas we identified may represent a series of false-positive inferences. Although this possibility cannot be rejected categorically it seems very unlikely, for at least two reasons. First, the statistical threshold used in the planned analysis appears rather conservative, considering that the search volume was limited to a very plausible set of motor areas. Several studies have used a comparable threshold for nonplanned investigations in which no correction for multiple comparisons was applied (Inoue et al., 1998; Turner et al., 1998). Second, our statistical query is supported by our knowledge of the functional properties of the cerebellum, the parietal cortex, and the motor cortex. Convergent observations gathered during the last decades have suggested that these areas may play a critical role in the process of on-line error correction (for review, see Desmurget and Grafton, 2000).
Anatomically, the PPC lies between the postcentral sulcus anteriorly, the subparietal sulcus on the medial wall of the hemisphere, the parieto-occipital sulcus posteriorly, and laterally the posteromedial part of the superior temporal sulcus and the posterior part of the lateral sulcus (Stein, 1989). Numerous studies have shown, in monkey and human, that the PPC is a highly differentiated structure with many functional subdivisions (Andersen et al., 1997; Colby, 1998; Milner and Dijkerman, 1998). Although the role of many of these subdivisions is not entirely known yet, several observations have suggested that the region of parietal cortex identified in the present study (intraparietal sulcus and its surrounding cortex) may be involved in on-line movement guidance in humans (Clower et al., 1996; Desmurget and Grafton, 2000). Among these observations, the most compelling was provided recently by our group in a transcranial magnetic stimulation study (Desmurget et al., 1999a). Subjects pointed to visual targets with their right hand. Vision of the arm was not allowed during the movement. In some trials the target location was displaced during the saccadic response, whereas in other trials it remained stationary. As observed in the present study, the target jump elicited a smooth and progressive adjustment of the hand path. Strikingly, when a single transcranial magnetic stimulation pulse was applied, at hand movement onset, over the PPC, these path corrections were disrupted, and the subject pointed to the first target location. This result was recently replicated in a clinical study involving a patient presenting with bilateral ischemic lesions of the PPC (Pisella et al., 2000). Although this patient was able to accurately point to stationary targets, she presented a dramatic inability to correct her ongoing movements when the target location was slightly modified at movement onset.
Functionally, it has been suggested that a major role of PPC in movement guidance is to determine whether and to what extent the current motor response is inadequate (Desmurget et al., 1999a;Desmurget and Grafton, 2000). This hypothesis is based on the observation that PPC displays three main properties that would be expected from an error detection module. First, it has access to a representation of the target and current hand location through afferent information coming from many sensory modalities (visual, proprioceptive, vestibular), and the main motor structures (Andersen et al., 1997; Brodal and Bjaalie, 1997). Second, it is critical for establishing stable relationships between heterogeneous information, i.e., for merging arm and target-related signals into a common frame of reference (Clower et al., 1996; Carey et al., 1997; Colby, 1998;Binkofski et al., 1999; Xing and Andersen, 2000). Third, it modulates its neural activity as the hand approaches the target, i.e., as the motor error varies (MacKay, 1992). In a recent paper, Desmurget and Grafton (2000) have suggested that dynamic error detection was achieved by the PPC through forward modeling. According to this view, a forward model of the arm's dynamics is generated during the movement. This forward model, which requires integration of both afferent and efferent information, allows prediction of the movement end point. When a discrepancy is detected between the predicted movement final location and the target location, an error signal is generated. This error signal has then to be transformed into an actual motor command. The cerebellum is a primary candidate for this task.
Like PPC, the cerebellum has long been associated with feedback control (Miall et al., 1993; Stein, 1986). As shown in several studies involving reaching (Day et al., 1998) and tracking tasks (Miall et al., 1993; Haggard et al., 1995), cerebellar lesions do not prevent on-line trajectory adjustments from occurring. However, the motor corrections generated by patients presenting with a lesion of the cerebellum are characterized by excessive deviations and ill-tuned muscle activation patterns. Anatomically, it was shown that the cerebellum receives abundant input from PPC via the pontine nuclei (Brodal and Bjaalie, 1997; Middleton and Strick, 1998). Functionally, it was suggested that one of the main contributions of the cerebellum to movement control is to perform the inverse computations allowing transformation of a desired displacement into an actual muscle command. In support of this idea, it was demonstrated that inverse models are represented within the cerebellum (Wolpert et al., 1998; Kawato, 1999; Imamizu et al., 2000) and that patients with cerebellar lesions display a chronic inability to accurately define the pattern of muscle activation required to direct the hand along a specific path (Bastian et al., 1996; Day et al., 1998).
The previous observations suggest that the cerebellar contribution to on-line movement guidance may be to convert the dynamic motor error signal computed by PPC into an appropriate corrective command. Within this context, the precentral gyrus activation we observed, concurrently with the cerebellar activation, may be accounted for by assuming that the cerebellar signal influence the ongoing motor command by modulating the neural signal issued by the primary motor cortex. In agreement with this view, it has been shown that the primary motor cortex receives substantial input from the cerebellum via the ventrolateral thalamus (Asanuma et al., 1983; Brodal and Bjaalie, 1997; Hoover and Strick, 1999). Also, it has been suggested that the motor system is organized in a relative hierarchy such that the primary motor cortex is mainly involved in the low-level aspects of motor control. Consistent with this idea, it was shown that purely kinematic and dynamical aspects of the movement are more commonly represented in the motor cortex than, for instance, in the parietal or premotor areas that seem to encode more abstract variables (Alexander and Crutcher, 1990; Scott et al., 1997; Shen and Alexander, 1997; Turner et al., 1998). The activation of M1 during error correction may appear to be in contradiction with a previous transcranial magnetic stimulation (TMS) study in which we observed no effect, on movement correction, when the motor cortex was stimulated (Desmurget et al., 1999). However, the level of stimulation we used in our previous TMS study was not high enough to generate any EMG response in the primary arm movers. This indicates that the stimulation did not interfere with the ongoing movement. It is likely that higher level of stimulation would have resulted in more dramatic effects.
In conclusion, the present experiment provides new evidence in support of the hypothesis that parietal-cerebellar circuits are critical for hand movement guidance. We have shown that nonvisual feedback loops involve a limited network including the motor cortex, the cerebellum, and the PPC. Based on recent neurophysiological and clinical observations, we hypothesize that PPC computes a dynamic motor error by comparing the updated location of the visual target and the estimated movement end point. This dynamic motor error is sent to the cerebellum, which converts it into a corrective motor command. The corrective signal influence finally the ongoing motor command by modulating the neural signal issued by the primary motor cortex.
Footnotes
This project was supported by National Institutes of Health Grant NS 33504 to S.G. We thank Michael White and Delicia Votaw for their technical assistance and Roger Woods for providing image analysis software. We also thank Miranda Lim for her contribution during data collection and Laura Payne for editing this manuscript.
Correspondence should be addressed to Scott T. Grafton, Center for Cognitive Neuroscience, 6162 Moore Hall, Dartmouth College, Hanover, NH 03755. E-mail: Scott.T.Grafton@dartmouth.edu.
REFERENCES
- 1.Alexander GE, Crutcher MD. Neural representations of the target (goal) of visually guided arm movements in three motor areas of the monkey. J Neurophysiol. 1990;64:164–178. doi: 10.1152/jn.1990.64.1.164. [DOI] [PubMed] [Google Scholar]
- 2.Andersen RA, Snyder LH, Bradley DC, Xing J. Multimodal representation of space in the posterior parietal cortex and its use in planning movements. Annu Rev Neurosci. 1997;20:303–330. doi: 10.1146/annurev.neuro.20.1.303. [DOI] [PubMed] [Google Scholar]
- 3.Asanuma C, Thach WR, Jones EG. Anatomical evidence for segregated focal groupings of efferent cells and their terminal ramifications in the cerebellothalamic pathway of the monkey. Brain Res. 1983;286:267–297. doi: 10.1016/0165-0173(83)90016-4. [DOI] [PubMed] [Google Scholar]
- 4.Atkeson CG, Hollerbach JM. Kinematic features of unrestrained vertical arm movements. J Neurosci. 1985;5:2318–2330. doi: 10.1523/JNEUROSCI.05-09-02318.1985. [DOI] [PMC free article] [PubMed] [Google Scholar]
- 5.Bahill AT, McDonald JD. Frequency limitations and optimal step size for the two-points central difference derivative algorithm with application to human eye data. IEEE Trans Biomed Eng. 1983;30:191–194. doi: 10.1109/tbme.1983.325108. [DOI] [PubMed] [Google Scholar]
- 6.Bastian AJ, Martin TA, Keating JG, Thach WT. Cerebellar ataxia: abnormal control of interaction torques across multiple joints. J Neurophysiol. 1996;76:492–509. doi: 10.1152/jn.1996.76.1.492. [DOI] [PubMed] [Google Scholar]
- 7.Biguer B, Jeannerod M, Prablanc C. The coordination of eye, head and arm movements during reaching at a single visual target. Exp Brain Res. 1982;46:301–304. doi: 10.1007/BF00237188. [DOI] [PubMed] [Google Scholar]
- 8.Binkofski F, Buccino G, Dohle C, Seitz RJ, Freund HJ. Mirror agnosia and mirror ataxia constitute different parietal lobe disorders. Ann Neurol. 1999;46:51–61. doi: 10.1002/1531-8249(199907)46:1<51::aid-ana9>3.0.co;2-q. [DOI] [PubMed] [Google Scholar]
- 9.Bock O. Localization of objects in the peripheral visual field. Behav Brain Res. 1993;56:77–84. doi: 10.1016/0166-4328(93)90023-j. [DOI] [PubMed] [Google Scholar]
- 10.Brodal P, Bjaalie JG. Salient anatomic features of the cortico-ponto-cerebellar pathway. Prog Brain Res. 1997;114:227–249. doi: 10.1016/s0079-6123(08)63367-1. [DOI] [PubMed] [Google Scholar]
- 11.Carey DP, Coleman RJ, Della Sala S. Magnetic misreaching. Cortex. 1997;33:639–652. doi: 10.1016/s0010-9452(08)70722-6. [DOI] [PubMed] [Google Scholar]
- 12.Clower DM, Hoffman JM, Votaw JR, Faber TL, Woods RP, Alexander G. Role of posterior parietal cortex in the recalibration of visually guided reaching. Nature. 1996;383:618–621. doi: 10.1038/383618a0. [DOI] [PubMed] [Google Scholar]
- 13.Colby CL. Action-oriented spatial reference frames in cortex. Neuron. 1998;20:15–24. doi: 10.1016/s0896-6273(00)80429-8. [DOI] [PubMed] [Google Scholar]
- 14.Colebatch JG, Deiber MP, Passingham RE, Friston KJ, Frackowiak RS. Regional cerebral blood flow during voluntary arm and hand movements in human subjects. J Neurophysiol. 1991;65:1392–1401. doi: 10.1152/jn.1991.65.6.1392. [DOI] [PubMed] [Google Scholar]
- 15.Day BL, Thompson PD, Harding AE, Marsden CD. Influence of vision on upper limb reaching movements in patients with cerebellar ataxia. Brain. 1998;121:357–372. doi: 10.1093/brain/121.2.357. [DOI] [PubMed] [Google Scholar]
- 16.Deiber MP, Ibanez V, Sadato N, Hallett M. Cerebral structures participating in motor preparation in humans: a positron emission tomography study. J Neurophysiol. 1996;75:233–247. doi: 10.1152/jn.1996.75.1.233. [DOI] [PubMed] [Google Scholar]
- 17.Desmurget M, Grafton ST. Forward modeling allows feedback control for fast reaching movements. Trends Cognit Sci. 2000;4:423–431. doi: 10.1016/s1364-6613(00)01537-0. [DOI] [PubMed] [Google Scholar]
- 18.Desmurget M, Prablanc C. Postural control of three dimensional prehension movements. J Neurophysiol. 1997;77:452–464. doi: 10.1152/jn.1997.77.1.452. [DOI] [PubMed] [Google Scholar]
- 19.Desmurget M, Pelisson D, Urquizar C, Prablanc C, Alexander GE, Grafton ST. Functional anatomy of saccadic adaptation in humans. Nat Neurosci. 1998;1:524–528. doi: 10.1038/2241. [DOI] [PubMed] [Google Scholar]
- 20.Desmurget M, Epstein CM, Turner RS, Prablanc C, Alexander GE, Grafton ST. Role of the posterior parietal cortex in updating reaching movements to a visual target. Nat Neurosci. 1999a;2:563–567. doi: 10.1038/9219. [DOI] [PubMed] [Google Scholar]
- 21.Desmurget M, Prablanc C, Jordan MI, Jeannerod M. Are reaching movements planned to be straight and invariant in the extrinsic space: kinematic comparison between compliant and unconstrained motions. Q J Exp Psychol. 1999b;52A:981–1020. [Google Scholar]
- 22.Desmurget M, Pélisson D, Grethe JS, Alexander GE, Urquizar C, Prablanc C, Grafton ST. Functional adaptation of reactive saccades in humans: a PET study. Exp Brain Res. 2000;132:243–259. doi: 10.1007/s002210000342. [DOI] [PubMed] [Google Scholar]
- 23.Deubel H, Wolf W, Hauske G. Adaptive gain control of saccadic eye movements. Hum Neurobiol. 1986;5:245–253. [PubMed] [Google Scholar]
- 24.Friston KJ, Worsley KJ, Frakowiak RSJ, Mazziotta JC. Assessing the significance of focal activations using their spatial extent. Hum Brain Mapp. 1994;1:214–220. doi: 10.1002/hbm.460010306. [DOI] [PubMed] [Google Scholar]
- 25.Goodale MA, Pélisson D, Prablanc C. Large adjustments in visually guided reaching do not depend on vision of the hand and perception of target displacement. Nature. 1986;320:748–750. doi: 10.1038/320748a0. [DOI] [PubMed] [Google Scholar]
- 26.Grafton ST, Mazziotta JC, Woods RP, Phelps ME. Human functional anatomy of visually guided finger movements. Brain. 1992;115:565–587. doi: 10.1093/brain/115.2.565. [DOI] [PubMed] [Google Scholar]
- 27.Grafton ST, Fagg AH, Woods RP, Arbib MA. Functional anatomy of pointing and grasping in humans. Cereb Cortex. 1996;6:226–237. doi: 10.1093/cercor/6.2.226. [DOI] [PubMed] [Google Scholar]
- 28.Haggard P, Miall RC, Wade D, Fowler S, Richardson A, Anslow P, Stein J. Damage to cerebellocortical pathways after closed head injury: a behavioural and magnetic resonance imaging study. J Neurol Neurosurg Psychiatry. 1995;58:433–438. doi: 10.1136/jnnp.58.4.433. [DOI] [PMC free article] [PubMed] [Google Scholar]
- 29.Hoover JE, Strick PL. The organization of cerebellar and basal ganglia outputs to primary motor cortex as revealed by retrograde transneuronal transport of herpes simplex virus type 1. J Neurosci. 1999;19:1446–1463. doi: 10.1523/JNEUROSCI.19-04-01446.1999. [DOI] [PMC free article] [PubMed] [Google Scholar]
- 30.Imamizu H, Miyauchi S, Tamada T, Sasaki Y, Takino R, Putz B, Yoshioka T, Kawato M. Human cerebellar activity reflecting an acquired internal model of a new tool. Nature. 2000;403:192–195. doi: 10.1038/35003194. [DOI] [PubMed] [Google Scholar]
- 31.Inoue K, Kawashima R, Satoh K, Kinomura S, Goto R, Koyama M, Sugiura M, Ito M, Fukuda H. PET study of pointing with visual feedback of moving hands. J Neurophysiol. 1998;79:117–125. doi: 10.1152/jn.1998.79.1.117. [DOI] [PubMed] [Google Scholar]
- 32.Jordan MI. Motor learning and the degrees of freedom problem. In: Jeannerod M, editor. Attention and performance XIII: Motor representation and control. Erlbaum; HillsDale, NJ: 1990. pp. 796–836. [Google Scholar]
- 33.Kawato M. Internal models for motor control and trajectory planning. Curr Opin Neurobiol. 1999;9:718–727. doi: 10.1016/s0959-4388(99)00028-8. [DOI] [PubMed] [Google Scholar]
- 34.Lacquaniti F, Perani D, Guigon E, Bettinardi V, Carrozzo M, Grassi F, Rossetti Y, Fazio F. Visuomotor transformations for reaching to memorized targets: a PET study. NeuroImage. 1997;5:129–146. doi: 10.1006/nimg.1996.0254. [DOI] [PubMed] [Google Scholar]
- 35.MacKay WA. Properties of reach-related neuronal activity in cortical area 7A. J Neurophysiol. 1992;67:1335–1345. doi: 10.1152/jn.1992.67.5.1335. [DOI] [PubMed] [Google Scholar]
- 36.Maxwell SE, Delaney HD. Designing experiments and analysing data. A model comparison perspective. Wadsworth; Belmont, CA: 1990. [Google Scholar]
- 37.Miall RC, Weir DJ, Wolpert DM, Stein JF. Is the cerebellum a Smith predictor. J Mot Behav. 1993;25:203–216. doi: 10.1080/00222895.1993.9942050. [DOI] [PubMed] [Google Scholar]
- 38.Middleton FA, Strick PL. The cerebellum: an overview. Trends Neurosci. 1998;21:367–369. doi: 10.1016/s0166-2236(98)01330-7. [DOI] [PubMed] [Google Scholar]
- 39.Milner AD, Dijkerman HC. Visual processing in the primate parietal lobe. In: Milner AD, editor. Comparative neuropsychology. Oxford UP; Oxford: 1998. pp. 70–94. [Google Scholar]
- 40.Neter J, Wasserman W, Kutner MH. Applied linear models. Irwin; Boston, MA: 1990. [Google Scholar]
- 41.Pisella L, Gréa H, Tilikete C, Vighetto A, Desmurget M, Rode G, Boisson D, Rossetti Y. An “automatic pilot” for the hand in human posterior parietal cortex: toward reinterpreting optic ataxia. Nat Neurosci. 2000;3:729–736. doi: 10.1038/76694. [DOI] [PubMed] [Google Scholar]
- 42.Prablanc C, Martin O. Automatic control during hand reaching at undetected two-dimensional target displacements. J Neurophysiol. 1992;67:455–469. doi: 10.1152/jn.1992.67.2.455. [DOI] [PubMed] [Google Scholar]
- 43.Prablanc C, Echallier JF, Komilis E, Jeannerod M. Optimal response of eye and hand motor system in pointing at visual target. I. Spatio-temporal characteristics of eye and hand movements and their relationships when varying the amount of visual information. Biol Cybern. 1979;35:113–124. doi: 10.1007/BF00337436. [DOI] [PubMed] [Google Scholar]
- 44.Prablanc C, Pélisson D, Goodale MA. Visual control of reaching movements without vision of the limb. I. Role of extraretinal feedback of target position in guiding the hand. Exp Brain Res. 1986;62:293–302. doi: 10.1007/BF00238848. [DOI] [PubMed] [Google Scholar]
- 45.Redding GM, Wallace B. Adaptative spatial alignment and strategic perceptual-motor control. J Exp Psychol Hum Percept Perform. 1996;22:379–394. doi: 10.1037//0096-1523.22.2.379. [DOI] [PubMed] [Google Scholar]
- 46.Scott SH, Sergio LE, Kalaska JF. Reaching movements with similar hand paths but different arm orientations. II. Activity of individual cells in dorsal premotor cortex and parietal area 5. J Neurophysiol. 1997;78:2413–2426. doi: 10.1152/jn.1997.78.5.2413. [DOI] [PubMed] [Google Scholar]
- 47.Shen L, Alexander GE. Neural correlates of a spatial sensory-to-motor transformation in primary motor cortex. J Neurophysiol. 1997;77:1171–1194. doi: 10.1152/jn.1997.77.3.1171. [DOI] [PubMed] [Google Scholar]
- 48.Stein JF. Role of the cerebellum in the visual guidance of movement. Nature. 1986;323:217–221. doi: 10.1038/323217a0. [DOI] [PubMed] [Google Scholar]
- 49.Stein JF. Representation of egocentric space in the posterior parietal cortex. Q J Exp Physiol. 1989;74:583–606. doi: 10.1113/expphysiol.1989.sp003314. [DOI] [PubMed] [Google Scholar]
- 50.Talairach J, Tournoux P. Co-planar stereotaxic atlas of the human brain. Thieme; Stuttgart, Germany: 1988. [Google Scholar]
- 51.Turner RS, Owens JW, Jr, Anderson ME. Directional variation of spatial and temporal characteristics of limb movements made by monkeys in a two-dimensional work space. J Neurophysiol. 1995;74:684–697. doi: 10.1152/jn.1995.74.2.684. [DOI] [PubMed] [Google Scholar]
- 52.Turner RS, Grafton ST, Votaw JR, Delong MR, Hoffman JM. Motor subcircuits mediating the control of movement velocity: a PET study. J Neurophysiol. 1998;80:2162–2176. doi: 10.1152/jn.1998.80.4.2162. [DOI] [PubMed] [Google Scholar]
- 53.Winstein CJ, Grafton ST, Pohl PS. Motor task difficulty and brain activity: investigation of goal-directed reciprocal aiming using positron emission tomography. J Neurophysiol. 1997;77:1581–1594. doi: 10.1152/jn.1997.77.3.1581. [DOI] [PubMed] [Google Scholar]
- 54.Wolpert DM, Miall RC, Kawato M. Internal models in the cerebellum. Trends Cognitive Sci. 1998;2:338–347. doi: 10.1016/s1364-6613(98)01221-2. [DOI] [PubMed] [Google Scholar]
- 55.Woods RP, Iacobini M, Grafton ST, Mazziotta JC. Three-way analysis of variance. In: Myers R, Cunningham V, Bailey D, editors. Quantification of brain function using PET. Academic; New York: 1996. pp. 353–358. [Google Scholar]
- 56.Woods RP, Grafton ST, Holmes CJ, Cherry SR, Mazziotta JC. Automated image registration: 1. General methods and intra- subject validation. J Comput Assist Tomogr. 1998a;22:139–152. doi: 10.1097/00004728-199801000-00027. [DOI] [PubMed] [Google Scholar]
- 57.Woods RP, Grafton ST, Watson JDG, Sicotte NL, Mazziotta JC. Automated image registration: 2. Intersubject validation of linear and nonlinear models. J Comput Assist Tomogr. 1998b;22:155–165. doi: 10.1097/00004728-199801000-00028. [DOI] [PubMed] [Google Scholar]
- 58.Xing J, Andersen RA. Models of the posterior parietal cortex which perform multimodal integration and represent space in several coordinate frames. J Cognit Neurosci. 2000;12:601–614. doi: 10.1162/089892900562363. [DOI] [PubMed] [Google Scholar]