Abstract
Mutations in the extracellular M2–M3 loop of the glycine receptor (GlyR) α1 subunit have been shown previously to affect channel gating. In this study, the substituted cysteine accessibility method was used to investigate whether a structural rearrangement of the M2–M3 loop accompanies GlyR activation. All residues from R271C to V277C were covalently modified by both positively charged methanethiosulfonate ethyltrimethylammonium (MTSET) and negatively charged methanethiosulfonate ethylsulfonate (MTSES), implying that these residues form an irregular surface loop. The MTSET modification rate of all residues from R271C to K276C was faster in the glycine-bound state than in the unliganded state. MTSES modification of A272C, L274C, and V277C was also faster in the glycine-bound state. These results demonstrate that the surface accessibility of the M2–M3 loop is increased as the channel transitions from the closed to the open state, implying that either the loop itself or an overlying domain moves during channel activation.
Keywords: ligand-gated ion channel, glycine receptor α1 subunit, substituted cysteine accessibility method (SCAM), methanethiosulfonate ethyltrimethylammonium (MTSET), methanethiosulfonate ethylsulfonate (MTSES), hyperekplexia
The inhibitory glycine receptor (GlyR) chloride channel mediates inhibitory neurotransmission in the spinal cord and brainstem. GlyRs are members of the neurotransmitter-gated ion channel superfamily, which also includes nicotinic, serotonin, and GABAA- and GABAC-type receptors (Galzi and Changeux, 1995;Karlin and Akabas, 1995; Rajendra et al., 1997). Receptors of this family are composed of five subunits arranged symmetrically around a central ion-conducting pore. Individual subunits consist of a large extracellular N-terminal domain that contains ligand-binding sites and four membrane-spanning domains (M1–M4). The M2 domain forms an α-helix that lines the channel pore. The ligand-binding sites are distant from the channel activation gate, implying that channel activation is mediated by long-range allosteric mechanisms. However, little is known about the structural basis of these interactions.
Human hereditary hyperekplexia, or startle disease, is caused by mutations in both the intracellular and extracellular loops flanking the M2 domain (Shiang et al., 1993, 1995; Rees et al., 1994; Elmslie et al., 1996; Saul et al., 1999). It has been demonstrated recently that both startle disease mutations and many alanine-substitution mutations distributed throughout the M1–M2 and M2–M3 loops uncouple agonist-binding sites from the channel activation gate (Rajendra et al., 1995a; Lynch et al., 1997; Lewis et al., 1998; Saul et al., 1999). These results suggest a role for these loops in the channel-gating process. However, it remains to be established whether channel activation is accompanied by physical changes in the conformation of these loops.
The scanning cysteine accessibility method can be used to identify structural changes of ion channel domains in different functional states (Karlin and Akabas, 1998). In this technique, cysteine residues are probed with a water-soluble, cysteine-specific methanethiosulfonate (MTS) derivative. If a functional property of the channel is irreversibly modified on exposure to such a reagent, the cysteine is assumed to be exposed at the water-accessible protein surface. The rate of reaction with cysteines is determined by the local electrostatic potential, sulfhydryl ionization state, and steric accessibility of the sulfhydryl group at the protein surface (Karlin and Akabas, 1998). If the modification rate difference between the closed and open states is similar for both a positively charged and a negatively charged MTS reagent, then state-dependent changes in electrostatic potential can be eliminated. In such a case, the reaction rate is assumed to be dominated by the ionization state and steric accessibility, which both increase with thiol exposure to the aqueous interface (Karlin and Akabas, 1998).
We applied this approach in an attempt to determine whether structural rearrangements in the M2–M3 loop accompany GlyR channel activation. This study compares the open and closed state reaction rates of positively charged MTS-ethyltrimethylammonium (MTSET) and negatively charged MTS-ethylsulfonate (MTSES) (Stauffer and Karlin, 1994). We concluded that the seven residues closest to the M2 end of the loop are accessible to the aqueous environment. Furthermore, the state-dependent differences in the reaction rates of both MTSET and MTSES imply that either the loop itself or an overlying domain must move during channel activation.
MATERIALS AND METHODS
Mutagenesis and expression of human GlyR α1 subunit cDNA. Site-directed mutations were incorporated into the human GlyR α1 subunit cDNA in the pCIS2 expression vector using oligonucleotide-driven PCR mutagenesis and were confirmed by sequencing the cDNA clones. All cysteine-substituted mutant GlyRs investigated in this study also incorporated the C41A mutation. Wild-type (WT) and mutant plasmid constructs were transiently transfected into the human embryonic kidney 293 cell line using the modified calcium phosphate precipitation method (Chen and Okayama, 1987). After 24 hr exposure to transfecting solution, cells were washed with culture medium (Eagle's minimum essential medium supplemented with 2 mm glutamine and 10% fetal calf serum), and patch-clamp studies were conducted over the following 24–72 hr.
Electrophysiology. Glycine-gated currents were recorded using the whole-cell patch-clamp configuration at a holding potential of −50 mV. Currents were recorded directly to disk via an Axopatch 1D amplifier and pClamp6 software (Axon Instruments, Foster City, CA). Coverslips containing cultured transfected cells were transferred into a small volume (2 ml) recording chamber that was continually perfused at ∼2 ml/min with the standard bathing solution containing (in mm): 140 NaCl, 5 KCl, 2 CaCl2, 1 MgCl2, 10 HEPES, 10 glucose, pH 7.4, with NaOH. Heat-polished patch pipettes had tip resistances of 1–2.5 MΩ when filled with the standard intracellular solution containing (in mm): 145 CsCl, 2 CaCl2, 2 MgCl2, 10 HEPES, 10 EGTA, pH 7.4, with CsOH. At least 50% of full series resistance compensation was applied in all recordings. MTSET and MTSES, obtained from Toronto Research Chemicals (Toronto, Canada), were prepared as stock solutions of 10 and 100 mm, respectively, in distilled water and maintained on ice for up to 3 hr until used. These compounds were applied to cells within 30 sec of being dissolved in room temperature bathing solution. The disulfide reducing agent, dithiothreitol (DTT), was prepared daily as a 1 mm solution (unless otherwise indicated) in the standard bathing solution. This DTT-containing solution had no effect on the magnitude of currents in the WT GlyR. Solutions were applied to cells via a parallel system of gravity-fed tubes, and solution exchange was effected with a time constant of ∼100 msec. Experiments were performed at room temperature (19–22°C).
The effects of MTSET and MTSES were tested using the following procedure. After establishment of the recording configuration, cells were bathed in 1 mm DTT for 1 min to ensure that exposed sulfhydryl groups were fully reduced. Then the glycine dose–response was measured by applying increasing glycine concentrations at 1 min intervals. After this, three consecutive brief applications of a constant glycine concentration were applied at 1 min intervals to establish that the current magnitude was invariant. Provided that the current amplitude remained constant (±5%), the averaged maximum current amplitude was used as the control. After application of the MTS-containing solution, cells were washed in control solution for at least 2 min before the maximum current magnitudes and glycine EC50 values were measured again. In long-term patch recordings, both parameters were measured continually and were observed to remain constant in all mutant GlyRs for periods as long as 40 min. This strongly suggests that irreversible changes in both parameters were caused by covalent modification of exposed cysteines. Initial screening of cysteine-substituted mutant GlyRs comprised a 1 min application of either 100 μm MTSET or 1 mm MTSES. It is estimated that a 10% irreversible change in current over 1 min would have been reliably detected. If an irreversible effect was observed, the concentration of the MTS derivative was adjusted so that the time constant of the current response was between 0.5 and 20 sec. The method used to measure the MTS modification rate is explained in the text. The receptor desensitization rate was low (<0.005 sec−1) for all mutant GlyRs used in this study and, as such, did not impact significantly on the measurement of MTS reactivity rates.
Data analysis. Results are expressed as mean ± SEM of three or more independent experiments. The empirical Hill equation, fitted by a nonlinear least-squares algorithm (Sigmaplot; Jandel Scientific, San Rafael, CA), was used to calculate the 50% effective concentrations for activation (EC50). There was no consistent relationship between the respective Hill coefficient values and any other parameter measured in this study. Exponential fits were performed using the same nonlinear least-squares algorithm. Statistical significance was determined by one-way ANOVA using the Student–Newman–Keuls post hoc test for unpaired data (Sigmastat; Jandel Scientific), with p < 0.05 representing significance.
RESULTS
Effect of MTSET and MTSES on the WT GlyR
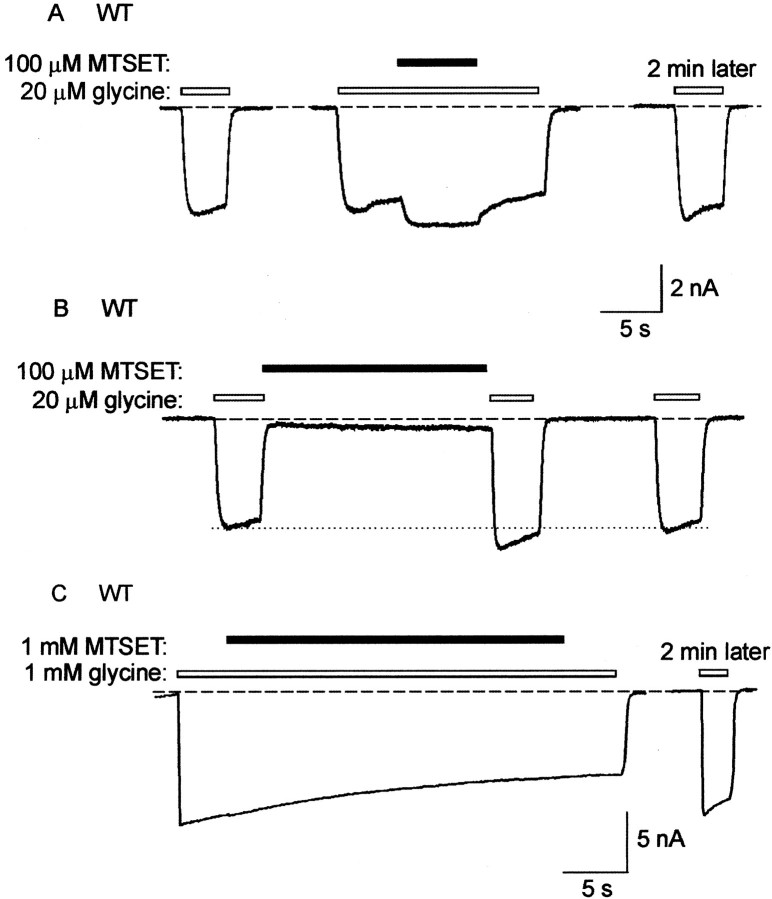
The effect of 100 μm MTSET in the presence of a half-maximal (20 μm) concentration of glycine on the WT GlyR is shown in Figure1A. The three traces were recorded at 2 min intervals from the same cell. The center trace shows that MTSET induces a transient increase in glycine current, but this effect is rapidly reversed on the removal of MTSET. The control glycine trace recorded after a 2 min wash in control bathing solution confirms the absence of a sustained MTSET effect (Fig.1A, right). Similarly, 100 μm MTSET had no irreversible effect when applied in the absence of glycine. Figure 1Bdemonstrates that MTSET acts as a weak reversible agonist of the receptor. Furthermore, immediately after MTSET exposure, the glycine-gated current was transiently increased, possibly because of the effect observed in Figure 1A. However, a control glycine-gated current recorded several seconds later confirms that this transient current increase was not sustained. These experiments, which were repeated in a total of four cells, confirm that 100 μm MTSET induced no significant irreversible change in current magnitude, regardless of whether it was applied in the absence or presence of glycine. Similarly, a 1 mm concentration of MTSET also caused no irreversible effect at either a half-saturating (20 μm) or a saturating (1 mm) concentration of glycine (n = 3 cells). An example of the effect of 1 mm MTSET in the presence of 1 mm glycine is shown in Figure1C.
Fig. 1.
Effect of MTSET on the WT GlyR. A,All traces represent currents activated by a half-saturating (20 μm) concentration of glycine. In this and all subsequent figures, the dashed line indicates the channel closed state; unless otherwise indicated, glycine applications are indicated by unfilled bars, and MTSET applications are indicated by filled bars. The threetraces were recorded at 2 min intervals from the same cell. The left trace is a control glycine-gated current. The center trace shows the response to 100 μm MTSET applied in conjunction with 20 μmglycine. The right trace was recorded after a 2 min wash in the standard bathing solution. B, Thistrace was recorded from the same cell as A. The first two glycine applications were separated by an ∼20 sec application of MTSET alone. The dotted line is included to emphasize the transient increase in glycine-activated current after MTSET exposure. C, In this cell, a saturating (1 mm) glycine concentration was used to maximally activate all available channels. A 1 mm MTSET concentration appeared to have no effect on current magnitude. A control glycine-activated current recorded after a 2 min wash in standard bathing solution confirms this (right trace).
The transient potentiation induced by MTSET was dramatically diminished at saturating glycine concentrations (Fig. 1C), implying that it was predominantly mediated by an enhancement of the apparent glycine affinity. The agonist action of MTSET was characterized by an extremely slow onset, with maximal activation requiring an MTSET application time of >10 sec. Both the potentiation and the activation were observed sporadically in all mutant GlyRs examined in this study. Their magnitudes diminished rapidly with repeated applications of the same MTSET solution, implying that they were mediated by MTSET itself and not its breakdown products. These reversible effects of MTSET were not investigated further. However, because the magnitudes of the reversible effects were much smaller than those of the irreversible effects, they did not impact significantly on the measurements of MTSET reaction rates.
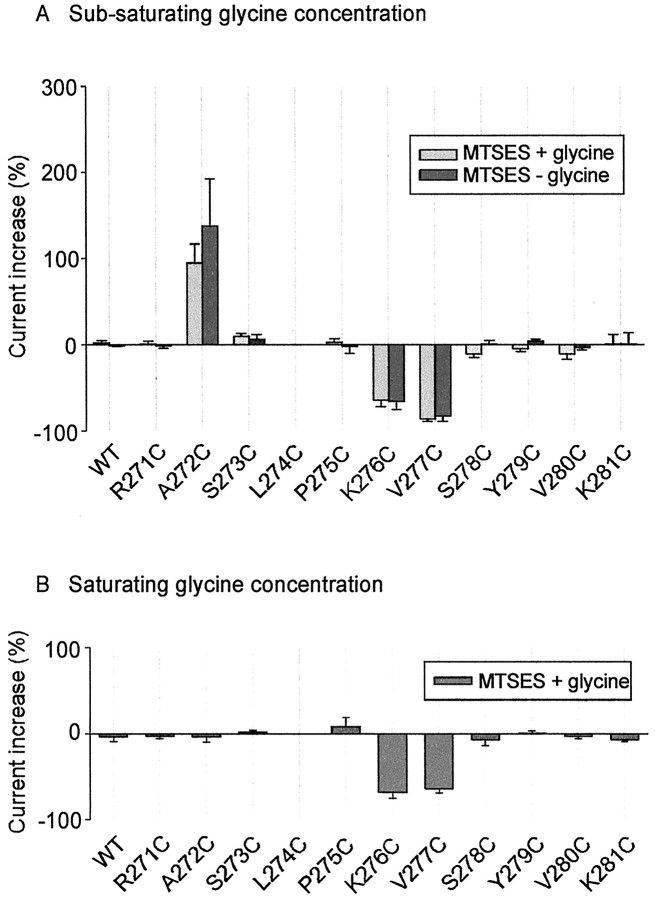
The effects of 1 mm MTSES on the WT GlyR were very similar to those of MTSET. MTSES also acted as a weak partial agonist in the absence of glycine and induced reversible potentiation in the presence of glycine. However, as summarized below (see Fig. 8), it exerted no irreversible effects on the GlyR, regardless of whether it was applied in the absence or presence of glycine.
Fig. 8.
Summary of the effects of MTSES on glycine-activated currents in the WT and cysteine-substituted mutant GlyRs. The percentage change was calculated as (Iglycine,after/Iglycine,before− 1) × 100. MTSES was applied for a sufficient time for the current change to reach a steady-state value or for a period of 1 min, whichever came first. Light-shaded columns show the effect of MTSES when applied in the absence of glycine.Dark-shaded columns show the effect of MTSES when applied simultaneously with glycine. All points were averaged from three to nine different cells. A, The effect of MTSES at a subsaturating glycine concentration. The glycine concentrations (together with the approximate EC values) that were used in these experiments were as follows: WT, 20 μm(EC50); R271C, 1 mm(EC20); A272C, 1 mm(EC20); S273C, 20 μm(EC20); L274C, 400 μm(EC50); P275C, 1 mm(EC50); K276C, 1 mm(EC20); V277C, 1 mm(EC50); S278C, 100 μm(EC50); Y279C, 1 mm(EC20); V280C, 1 μm(EC20); K281C, 20 μm(EC20). MTSES was applied at a concentration of 1 mm, except in the following mutants: A272C, 5 mm; K276C, 500 μm; V277C, 200 μm. MTSES induced significant (p < 0.05) changes in current magnitude in the A272C, K276C, and V277C mutant GlyRs, compared with the C41A mutant GlyR, but there was no significant difference between the open and closed states. B, The effect of MTSES at a saturating glycine concentration. The glycine concentrations used are as follows: WT, 1 mm; R271C, 15 mm; A272C, 15 mm; S273C, 1 mm; L274C, 10 mm; P275C, 15 mm; K276C, 15 mm; V277C, 15 mm; S278C, 10 mm; Y279C, 15 mm; V280C, 1 mm; K281C, 1 mm. The MTSES concentrations used are as indicated in A. MTSES induced significant (p < 0.05) changes in current magnitude in the K276C and V277C mutant GlyRs. However, these values were not significantly different from their respective values inA.
Despite the absence of irreversible MTSET or MTSES effects on the WT GlyR, it is possible that introduction of a cysteine mutation could expose a previously concealed cysteine elsewhere in the protein (Karlin and Akabas, 1998). Hence, it is necessary to remove any uncross-linked external cysteines to avoid possible complications in the interpretation of results obtained with cysteine-modifying agents (Karlin and Akabas, 1998). The human GlyR α1 subunit contains five external endogenous cysteines. However, in the recombinantly expressed receptor, four of these cysteines are cross-linked. Disulfide bonds are formed between C138–C152 and C198–C209 (Rajendra et al., 1995b). The remaining cysteine at position 41 is not believed to be cross-linked, and, hence, all cysteine-substituted mutant GlyRs examined in this study were constructed on the background of the C41A mutation. As shown in Figure 2, the C41A mutation caused no change in either the glycine EC50 value or the magnitude of peak currents.
Fig. 2.
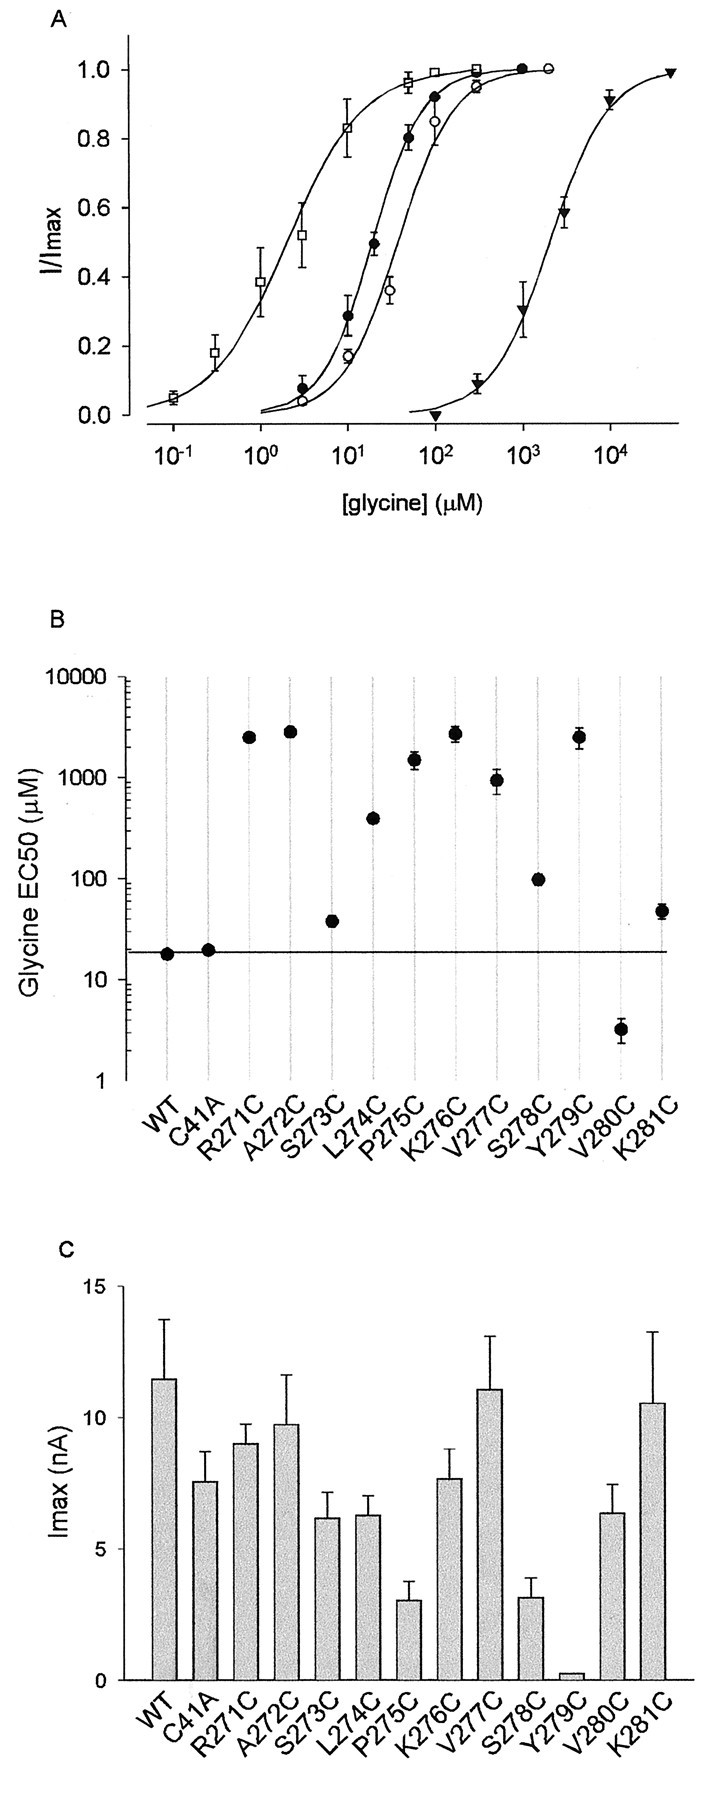
Properties of the WT and mutant GlyRs used in this study. Note that all cysteine-substituted GlyRs were constructed on the background of the C41A mutation. A,Examples of averaged glycine dose–responses from the WT GlyR (●), the S273C mutant GlyR (○), the K276C mutant GlyR (▴), and the V280C mutant GlyR (■). B, Summary of glycine dose–response data. All points are averaged from three to six different cells, and error bars (± SEM) are shown when larger than symbol size. Thehorizontal line is drawn through the mean WT glycine EC50 value. C, Maximum currents activated at saturating glycine concentrations. Each bar represents the average of three to nine cells.
Exposure of the WT GlyR for 1 min to a 1 mm concentration of the reducing agent, DTT, had no effect on current magnitude. This implies that the endogenous disulfide bonds are either not exposed at the protein surface or not needed for receptor activation by glycine after the receptor is inserted into the membrane. As described below, this concentration of DTT was able to completely reduce the disulfide bonds formed between MTSET and the exposed introduced cysteines.
Steady-state effects of MTSET on mutant GlyRs
The substituted cysteine accessibility method (Karlin and Akabas, 1998) was used to investigate the pattern of residue accessibility of the M2–M3 loop in both the open and closed channel states. Accordingly, the 11 residues forming the N-terminal portion of this loop (R271–K281) were individually mutated to cysteine on the background of the C41A mutation. With the exception of Y279C, all mutant GlyRs produced large glycine-gated inward currents in cells voltage-clamped at −50 mV. The Y279C mutation, which is a genetic cause of human startle disease (Shiang et al., 1995), has been shown previously to dramatically reduce the whole-cell glycine-gated conductance (Lynch et al., 1997). Representative glycine dose–response curves for the WT and several mutant GlyRs are displayed in Figure2A. The averaged glycine EC50values and peak current magnitudes for the WT and all mutant GlyRs are shown in Figure 2, B and C, respectively. As seen in Figure 2B, some mutations caused glycine EC50 changes of up to 100 times that of the WT GlyR and therefore may have induced nonspecific structural alterations in the M2–M3 loop. The implications of this for the interpretation of results are considered below.
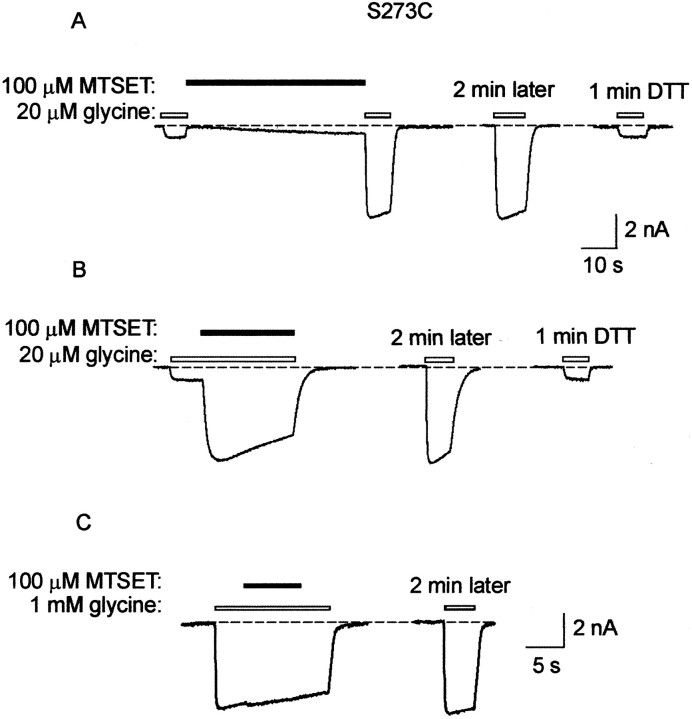
Examples of MTSET effects on the S273C mutant GlyR are shown in Figure3. In Figure 3A, it can be seen that MTSET applied in the closed state caused a strong potentiation of the glycine-gated current (left). In this experiment, glycine was applied at the concentration of 20 μm, which corresponds approximately to its EC20 value. Because the MTSET-induced potentiation persisted after a 2 min wash (Fig. 3A,center), it was concluded that it was caused by covalent modification of the introduced cysteine. The potentiation was completely reversed by a 1 min wash in a 1 mmDTT-containing solution (right).
Fig. 3.
Effect of MTSET on the S273C mutant GlyR.A, All traces in A andB were recorded sequentially from the same cell in the presence of 20 μm glycine. This glycine concentration corresponds approximately to the EC20. The left trace shows the effect of an ∼50 sec application of 100 μm MTSET alone. The center trace shows that the current increase remains after a 2 min wash in standard bathing solution. The right trace shows that a 1 min wash in 1 mm DTT solution returns the current magnitude to the control level. B, The left traceshows the effect of applying MTSET in the presence of glycine. Thecenter trace was recorded after a 2 min wash in standard bathing solution, and the right trace was recorded after a 1 min exposure to 1 mm DTT. C, Theleft trace shows that when glycine is applied at a saturating (1 mm) concentration, there is no effect of MTSET on peak current magnitude. The right trace is a control recorded after a 2 min wash in standard bathing solution.
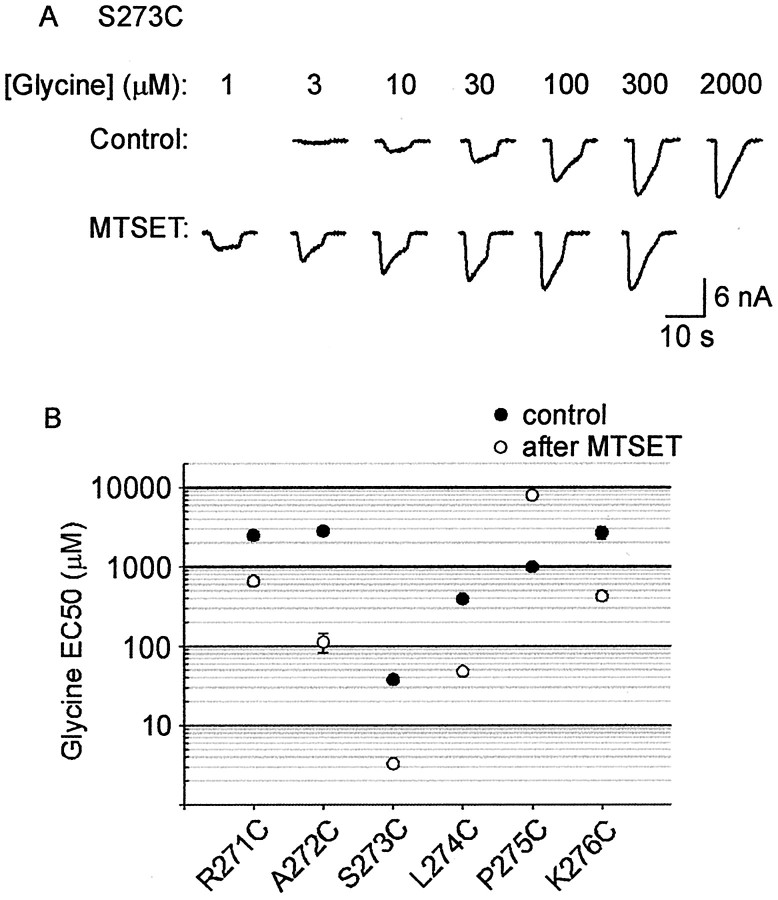
When applied in the presence of 20 μm glycine, MTSET caused a strong rapid potentiation (Fig. 3B,left) that persisted after a 2 min wash (center). Again, the potentiation was completely reversed by a 1 min DTT wash (right). As summarized in Figure4, there was no significant difference in the magnitude of the MTSET-induced potentiation between the closed and open channel states. However, when MTSET was applied in the presence of a saturating (1 mm) glycine concentration, no change in current magnitude was observed (Fig. 3C), although receptor modification did occur (Fig.5A). This indicates that MTSET acted by increasing the apparent glycine affinity. This observation was confirmed directly by measuring the glycine dose–responses before and after the application of 100 μm MTSET. Examples of glycine dose–responses in the S273C mutant GlyR in the same cell before and after MTSET exposure are shown in Figure 5A. The averaged respective glycine EC50 values are shown in Figure 5B. As seen in this Figure, MTSET caused an approximately 10-fold increase in the apparent glycine affinity of the S273C mutant GlyR.
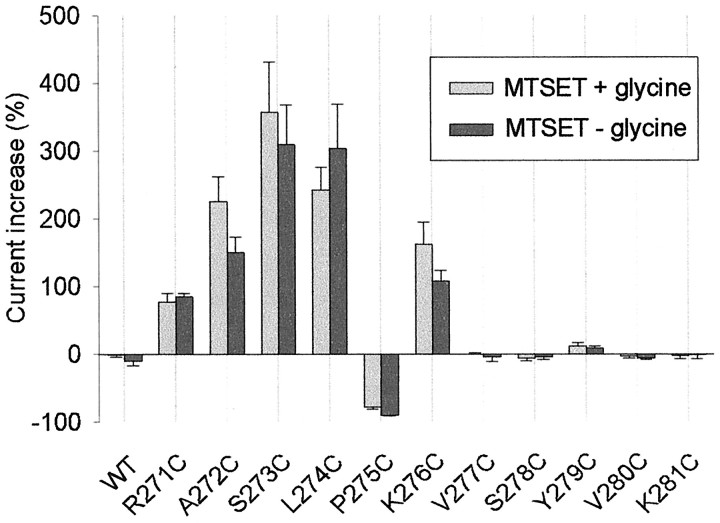
Fig. 4.
Summary of the effects of 100 μmMTSET on glycine-activated currents in the WT and cysteine-substituted mutant GlyRs. MTSET was applied for a sufficient time for the current change to reach a steady-state value or for a period of 1 min, whichever came first. The percentage change was calculated as (Iglycine,after/Iglycine,before− 1) × 100. Light-shaded columns show the effect of MTSET when applied in the absence of glycine. Dark-shaded columns show the effect of MTSET when applied simultaneously with glycine. All points were averaged from three to nine different cells, and error bars (± SEM) are shown. The glycine concentrations (together with the approximate EC value) that were used in these experiments are as follows: WT, 20 μm(EC50); R271C, 1 mm(EC20); A272C, 1 mm(EC20); S273C, 20 μm(EC20); L274C, 200 μm(EC20); P275C, 1 mm(EC50); K276C, 1 mm(EC20); V277C, 1 mm(EC50); S278C, 100 μm(EC50); Y279C, 1 mm(EC20); V280C, 1 μm(EC20); K281C, 20 μm(EC20). Using a one-way ANOVA and Student–Newman–Keuls post hoc test, we found that MTSET caused highly significant (p < 0.01) changes in current magnitude in the R271C, A272C, S273C, L274C, P275C, and K276C mutant GlyRs, relative to the C41A mutant GlyR. However, the magnitude of the current change was not significantly dependent on whether MTSET was applied in the open or closed state.
Fig. 5.
Effect of MTSET on the apparent glycine affinity of mutant GlyRs. A, Examples of glycine dose–responses from the S273C mutant GlyR measured before and after a 30 sec application of 100 μm MTSET. Both dose–responses were recorded from the same cell. B, Averaged dose–responses recorded before (●) and after (○) MTSET exposure for all MTSET-reactive mutant GlyRs. Points represent the average of three to four measurements, and error bars are shown when larger than symbol size.
Using a similar experimental approach, we investigated the effects of 100 μm MTSET on all cysteine-substituted mutant GlyRs, and its effects on current magnitude are displayed in Figure 4. MTSET was applied in both the absence and presence of glycine, with its effects being monitored using both a subsaturating (EC20–EC50) and a saturating glycine concentration. MTSET was applied for sufficient time for the observed current magnitude changes to reach a steady-state value or for a period of 1 min, whichever came first. The subsaturating glycine concentrations, together with their respective EC values, that were applied to each mutant GlyR are listed in the legend to Figure 4. The EC20 glycine concentrations were used on each of the mutant GlyRs in which MTSET had an irreversible potentiating effect. When using a saturating glycine concentration, we observed no effect of MTSET on any mutant GlyR investigated in this study. However, when assayed using the subsaturating glycine concentration, MTSET induced statistically significant (p < 0.05) current magnitude changes, relative to the C41A mutant GlyR, in the following six mutant GlyRs: R271C, A272C, S273C, L274C, P275C, and K276C (Fig. 4).
Figure 4 demonstrates that the final effect of MTSET was independent of whether it was applied in the channel closed or open state. It further shows that MTSET induces an increase in apparent glycine affinity in the R271C, A272C, S273C, L274C, and K276C mutant GlyRs and a decrease in the apparent affinity in the P275C mutant GlyR. This was confirmed by measuring the glycine dose–responses for each of these mutant GlyRs before and after MTSET exposure (Fig. 5B). The change in glycine sensitivity of each of the mutants displayed in this Figure was statistically significant (p < 0.05).
Interestingly, neither MTSET nor MTSES had any significant effect on the L274C mutant GlyR unless the receptor was reduced first by a 1 min DTT application (n = 12 cells). Because this reaction did not alter significantly the magnitude of the current activated by the EC20 glycine concentration (p > 0.05; n = 6), the DTT application had no effect on the glycine affinity.
State-dependence of MTSET reaction rates
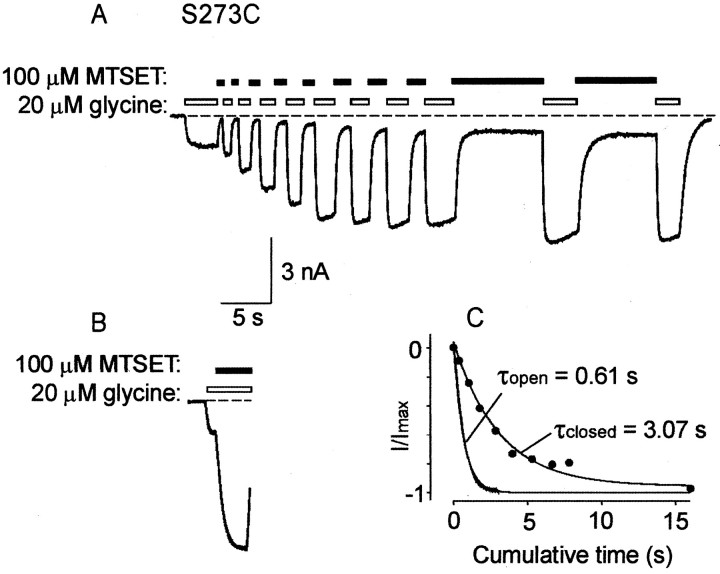
The state-dependence of MTSET reaction with S273C was measured as shown in Figure 6. MTSET was applied first in the closed state (Fig. 6A) and then in the open state (Fig. 6B) in the same cell. After the first MTSET application, a 1 min exposure to 1 mmDTT was required to completely reduce the introduced cysteine before MTSET was applied again. In both the closed and open states, experiments were performed using a 20 μm(EC20) glycine concentration and a 100 μm MTSET concentration. To assess MTSET reactivity in the closed state, the cell was rapidly switched between a glycine-only solution and an MTSET-only solution (Fig.6A). The relationship between the current magnitude change and the cumulative MTSET exposure time for the tracedisplayed in Figure 6A is plotted in Figure6C (●). The current–response to MTSET applied in the open state (Fig. 6B) is directly replotted in Figure6C. The time courses of the MTSET reaction rate in both the open and closed states were described adequately by single exponential fits with respective time constants of 0.61 sec (open state) and 3.07 sec (closed state). The averaged open and closed state reaction time constants were 0.54 ± 0.08 sec (n = 8 cells) and 3.51 ± 0.6 sec (n = 7), respectively. The difference between these values was statistically significant (p < 0.05). Thus, MTSET reacted ∼6.5 times faster in the open channel state than in the closed state.
Fig. 6.
State-dependent MTSET modification of S273C.A, To assess MTSET reactivity in the closed state, the cell was rapidly switched between a solution that contained only 20 μm glycine and a solution that contained only 100 μm MTSET. Note the slow weak agonist action of MTSET in this cell. B, Measurement of the effect of 100 μm MTSET in the open state. This trace was recorded from the same cell as A (after a 1 min DTT wash) and is plotted using the same horizontal andvertical scales. C, Measurement of reaction time constants in the closed and open states. Thefilled circles represent the proportionate increase in current magnitude plotted against cumulative exposure time to MTSET applied in the closed state. The noisy current trace corresponding to MTSET applied in the open state has been replotted fromB. Both final steady-state current amplitudes were normalized to 1, and the initial current magnitudes were normalized to zero. The lines represent exponential fits obtained using a nonlinear least-squares fitting routine with the time constants of best fit as shown.
One limitation to this approach is that, for most mutant GlyRs, the “open state” MTSET reaction rate was measured at the glycine EC20 value. This was necessary because most mutant GlyRs responded to MTSET via a dramatic increase in the glycine affinity (Fig. 5B). If a higher EC value had been used, the receptor current would have saturated before completion of the MTSET reaction, thereby distorting the apparent modification rate. Thus, in the open state, channels were open on average for only 20% of the time that they would have been at a saturating glycine concentration. Presumably, if a higher equivalent concentration had been used, a faster MTSET reaction rate would have resulted. Furthermore, assessment of the reaction rate in the closed state is complicated by the fact that MTSET was often a weak agonist. Thus, the true differential between reaction rates in the closed and open states is likely to be underestimated in these experiments.
The state-dependence of MTSET reactivity with the R271C, A272C, L274C, P275C, and K276C mutant GlyRs was investigated using a similar procedure, and the mean reaction rates thus obtained are displayed in Figure 7A. As seen in this Figure, the rate of reaction between MTSET and all residues from R271C to K276C was significantly increased in the glycine-bound state.
Fig. 7.
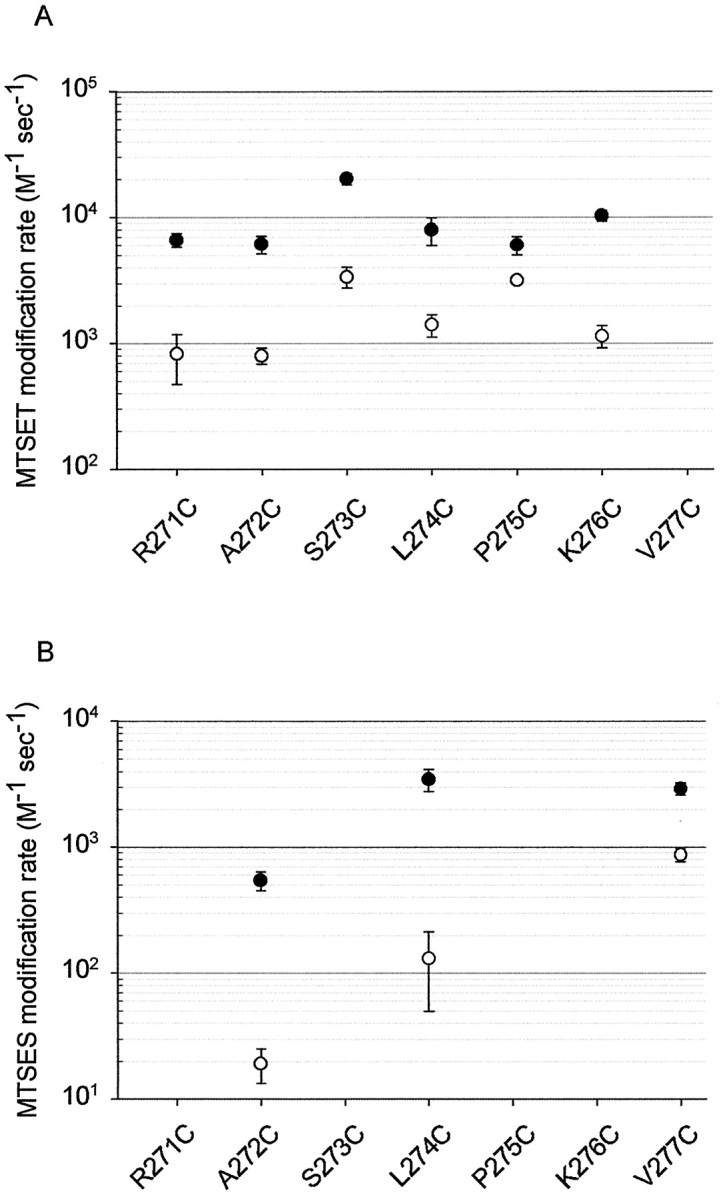
MTSET and MTSES reaction rates in the open (●) and closed (○) channel states. A, Averaged reaction rates for MTSET. The MTSET and glycine concentrations used in these determinations are given in the legend to Figure 4. B, Averaged reaction rates for MTSES. The MTSES and glycine concentrations used in these determinations are given in the legend to Figure 8. All points are averaged from three to eight cells for each mutant GlyR. Error bars are shown when larger than symbol size. Reaction rates were significantly faster in the open state than in the closed state for all displayed mutant GlyRs (p < 0.05).
Effects of MTSES on mutant GlyRs
The influence of electrostatic potential can be determined by comparing the state-dependence of the reaction rate of negatively and positively charged MTS derivatives (Pascual and Karlin, 1998). Accordingly, we investigated the effects of negatively charged MTSES on the cysteine-substituted mutant GlyRs.
As shown in Figure 8, MTSES also induced irreversible current magnitude changes in several mutant GlyRs. Figure8, A and B, displays the mean amplitude changes measured in the presence of subsaturating and saturating glycine concentrations, respectively. MTSES was applied for sufficient time for the observed current magnitude changes to reach a steady-state value or for a maximum period of 1 min, whichever came first. The concentrations of glycine and MTSES used in these experiments are displayed in the legend to Figure 8. MTSES modification of A272C dramatically increased the current activated by a 1 mm(EC20) glycine concentration but had no apparent effect at a saturating (15 mm) glycine concentration. However, the effect of MTSES on the K276C and V277C mutant GlyRs was not significantly dependent on the glycine concentration. It should be noted that although MTSES did modify irreversibly the P275C mutant GlyR, its effect was not accompanied by a change in the amplitude of the glycine-activated current (see below). Furthermore, because the L274C mutant GlyR was activated irreversibly by MTSES (see below), its effect could not be plotted on this scale.
Although MTSES did not appear to modify the R271C or S273C mutant GlyRs, MTSET induced a large effect. Hence, by examining the effects of sequential applications of MTSES and MTSES, it should be possible to detect whether MTSES is able to covalently modify these mutant GlyRs. An example of such an experiment designed to investigate this is shown in Figure 9A. Before the displayed experiment, the receptor was fully reduced by a 1 min exposure to 1 mm DTT. As shown in Figure9A, 1 mm MTSES induced no irreversible effect (top panel) but prevented a subsequent application of 100 μm MTSET from having an effect (center panel). However, after a 1 min exposure to 1 mm DTT, the robust MTSET-induced current increase returned (bottom panel). Results averaged from three such experiments are summarized in Figure9B and demonstrate that MTSES covalently modifies S273C without inducing a current magnitude change. A similar protocol revealed that the R271C mutant GlyR was also modified covalently by 1 mm MTSES (Fig. 9C). By contrast, the V277C mutant GlyR was inhibited dramatically by 1 mm MTSES, although 100 μmMTSET had no apparent effect. As shown in Figure 9D, previous MTSET application protects against the inhibitory effects of MTSES, demonstrating that MTSET does indeed modify V277C without changing the current amplitude. Thus, all three sulfhydryl groups (R271C, S273C, and V277C) are readily accessible to both MTSET and MTSES.
Fig. 9.
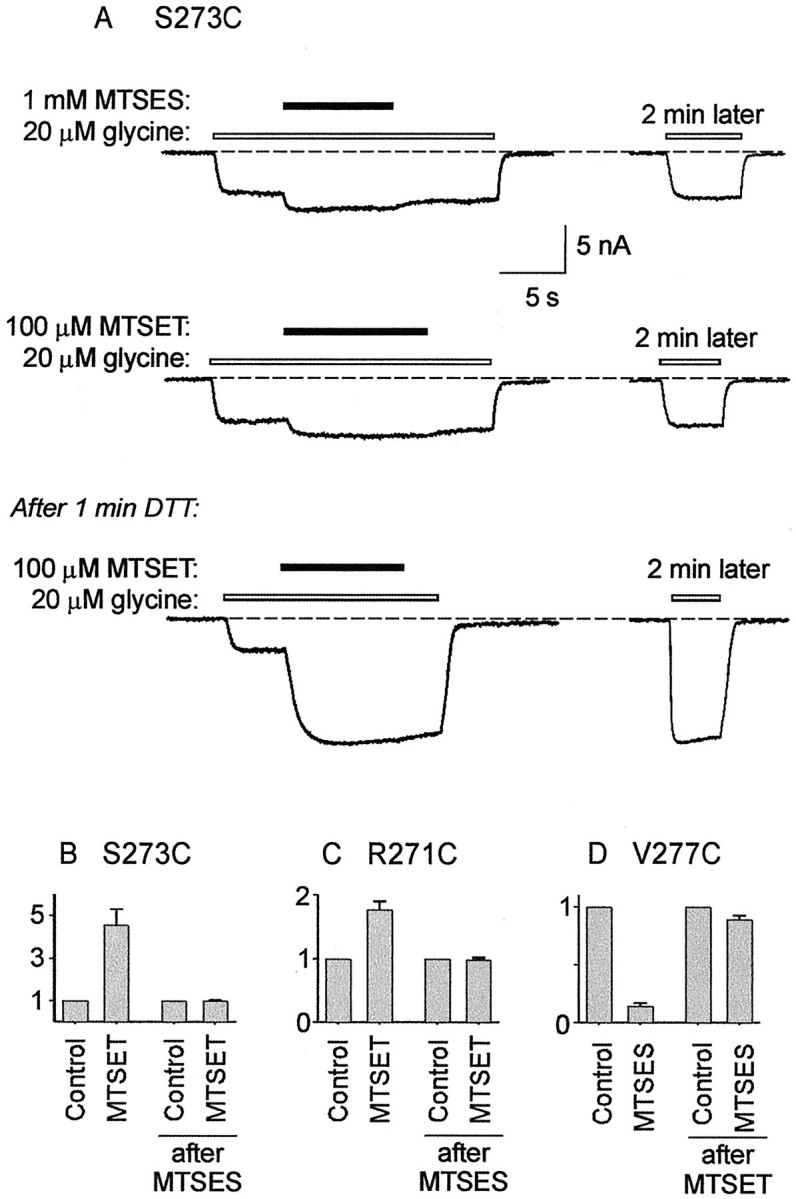
Modification of S273C, R271C, and V277C without effects on current magnitude. A, Alltraces in A were recorded sequentially from the same cell. An application of 1 mm MTSES had no irreversible effect on current magnitude (top panel). A subsequent application of 100 μmMTSET was also without effect (center panel). However, after a 1 min wash in 1 mm DTT, a large irreversible MTSET-mediated current increase was observed (bottom panel), demonstrating MTSES and modification of S273C. B, Averaged results from three cells using the experimental protocol displayed in A indicate that MTSET-mediated current increase was significant before, but not after, MTSES application. C, Results, averaged from three cells, of a similar experiment on the R271C mutant GlyR. The MTSET-mediated current increase was significant before, but not after, MTSES application. D, Results of a similar experiment on the V277C mutant GlyR. In this case, a previous MTSET application prevented MTSES-mediated inhibition. Results were averaged from three cells.
As indicated in Figure 8, A272C was the only residue to respond to MTSES via an increase in glycine sensitivity. The averaged open and closed state reaction time constants, measured as shown in Figure 6, were 0.41 ± 0.06 sec (n = 5 cells) and 13.2 ± 3.2 sec (n = 4), respectively. The difference between these values was statistically significant (p < 0.05). The reaction rates calculated from these time constants are shown in Figure 8B.
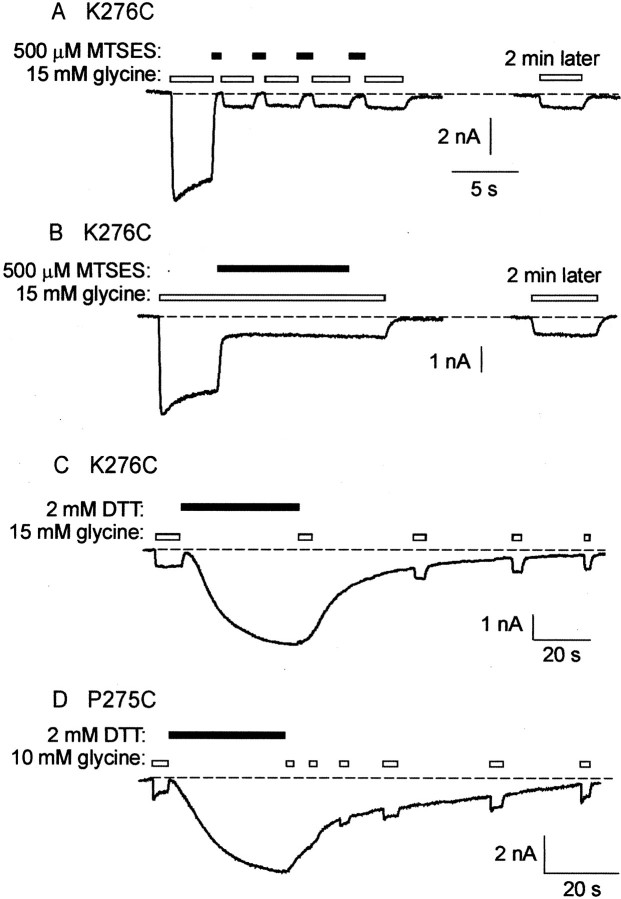
The V277C mutant GlyR averaged open and closed state reaction time constants of 1.83 ± 0.25 sec (n = 5 cells) and 5.97 ± 0.76 sec (n = 3), respectively, which is a statistically significant difference (p < 0.05). The mean MTSES modification rate constants calculated from these values are also shown in Figure 8B. In the K276C mutant GlyR, the MTSES-induced inhibition was very rapid in both the closed and open channel states (Fig.10A,B). The displayed traces, obtained from different cells, were recorded using a saturating (15 mm) glycine concentration and a 500 μm MTSES concentration. Because the time course of MTSES modification was indistinguishable from that of the solution exchange (Fig. 10B), the true modification rate was too fast to be resolved under our experimental conditions. For this to happen, the MTSES modification rate must have been >1.3 × 10⁴m/sec. Higher resolution experiments will be required to characterize the interaction between MTSES and K276C.
Fig. 10.
Effects of MTSES on K276C and P275C mutant GlyRs.A, B, Currents activated by a 15 mm (saturating) glycine concentration are rapidly inhibited by 500 μm MTSES applied in the channel closed state (A) and in the fully open state (B). In both cases, a 2 min wash in control solution reveals that the inhibition is irreversible.Traces in A and B were recorded from different cells. The horizontal scale barapplies to both recordings. C, This tracewas recorded from the same cell as B. After modification by MTSES, a 2 mm concentration of DTT reversibly activates a slow inward current. D, A 2 mmconcentration of DTT also reversibly activates a slow inward current in the MTSES-modified P275C mutant GlyR. In both mutant GlyRs, an inverse relationship existed between the magnitude of the DTT-activated current and the glycine-activated current (n = 5 cells expressing each mutant GlyR).
Effects of DTT on MTSES-modified GlyRs
As stated above, MTSET modification of all mutant GlyRs examined in this study was completely reversed by a 1 min exposure to 1 mm DTT. This treatment also completely reversed the effect of MTSES modification of the R271C, A272C, and S273C mutant GlyRs. However, a 1 min exposure to 1 mm DTT did not diminish significantly the magnitude of MTSES-induced current changes in the L274C, P275C, K276C, or V277C mutant GlyRs. Indeed, longer (3–5 min) applications of 2 mm DTT were also without significant effect (n ≥ 7 cells for each of L274C, P275C, K276C, or V277C). However, 2 mm DTT did exert an unusual effect on MTSES-modified K276C and P275C mutant GlyRs. An example of its effect on the K276C mutant GlyR is shown in Figure 10C. This trace was recorded from the same cell as displayed in Figure10B. After MTSES exposure, 2 mmDTT induced a large, slowly activating inward current (Fig.10C). This current attained a peak magnitude of 1.03 ± 0.16 times (n = 5) the saturating magnitude of the glycine-activated current before MTSES modification and was activated with a mean time constant of 11.5 ± 0.9 sec (n = 5). After removal of DTT, the current gradually returned to baseline. When the DTT-activated current was maximal, the glycine-activated current was diminished in magnitude, but after DTT was removed and the current returned to baseline, the glycine-activated current increased to its previous MTSES-modified magnitude (Fig. 10C). The DTT-mediated current could be reproduced multiple times in direct succession from the same cell, and DTT did not reverse MTSES modification of K276C. The DTT-mediated current was never observed before the application of MTSES (n = 7 cells).
A very similar effect was observed with the MTSES-modified P275C mutant GlyR (Fig. 10D). DTT activated the current with a time constant of 12.0 ± 3.2 sec (n = 7 cells), and the current reached a peak magnitude of 4.9 ± 0.6 times (n = 7 cells) the magnitude of the saturating glycine-activated current. Again, before the application of 1 mmMTSES, DTT exerted no detectable effect on current magnitude (n = 7 cells). This DTT-activated current was the only evidence for MTSES modification of P275C.
MTSES irreversibly activates the L274C mutant GlyR
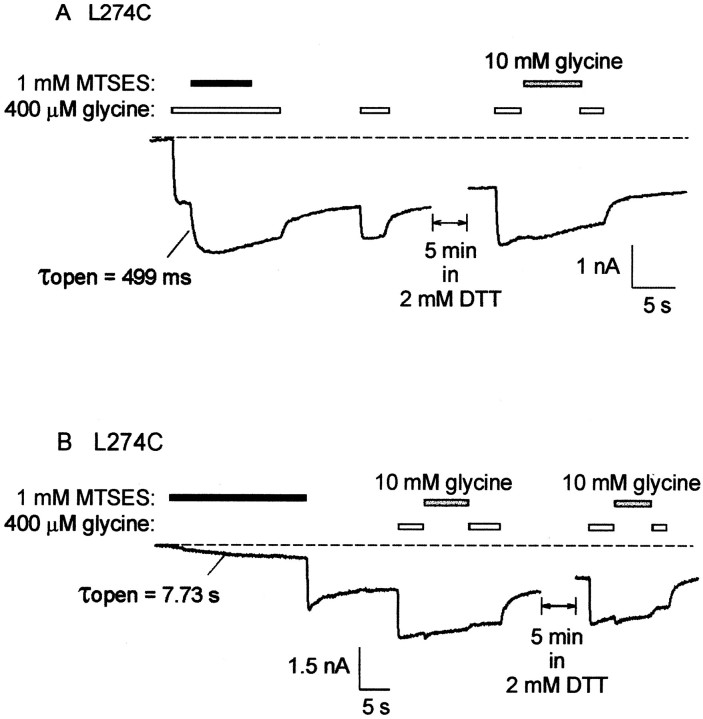
The L274C mutant GlyR was irreversibly activated by MTSES. An example of its effect when applied in the channel open state is shown in Figure 11A. These experiments were performed using a 400 μm(EC50) glycine concentration and a 1 mm MTSES concentration. In the presence of glycine, the MTSES-mediated current increase followed a time constant of 499 msec (Fig. 11A). The open state modification time constant averaged from six cells was 369 ± 79 msec. After MTSES exposure, the channels remained in a partially activated state, even after a 5 min wash in 2 mm DTT (n = 6 cells). A subsequent application of 400 μm glycine fully activated the remaining fraction of receptors, indicating that MTSES modification had irreversibly increased the glycine sensitivity (Fig.11A). A 100 μm concentration of strychnine completely inhibited current flow through the MTSES-modified receptors (n = 3 cells). Although 1 mm picrotoxin completely inhibited currents before the application of MTSES, it had no significant effect on MTSES-modified receptors (n = 3 cells). An example of the effect of 1 mm MTSES applied in the channel closed state is shown in Figure 11B. MTSES directly activated a small inward current at a time constant of 7.73 sec. The time constant averaged from five cells was 9.37 ± 2.1 sec. After MTSES was removed, the current suddenly increased, suggesting that MTSES also exerted an inhibitory effect (Fig.11B). This unusual effect was observed in all five cells in which it was examined. Again, the channels remained in the partially activated state after the MTSES modification. A subsequent application of 400 μm glycine fully activated the remaining complement of receptors, indicating that MTSES modification had increased the glycine sensitivity (Fig.11B). The averaged MTSES modification rate constants in the closed and open states are displayed in Figure7B. The results indicate that the L274C reacts faster with MTSES in the glycine-bound state.
Fig. 11.
MTSES modification of L274C induces irreversible activation. A, Effect of 1 mm MTSES applied in the presence of a 400 μm (EC50) glycine concentration. MTSES modification followed a time constant of 499 msec. After removal of glycine, the channels remained partially activated. A 5 min application of 2 mm DTT was without significant effect, and further application of 400 μm and 10 mm indicated an irreversible increase in glycine sensitivity. B, Effect of 1 mm MTSES applied in the absence of glycine. Glycine-gated current was monitored using a 400 μm (EC50) or a 10 mm(saturating) glycine concentration, as indicated. MTSES directly induced a small, slowly activating current. The magnitude of this current was rapidly enhanced after the removal of MTSES. Subsequent applications of 400 μm and 10 mm glycine indicated an irreversible increase in glycine sensitivity. A 5 min DTT application was again without significant effect. Tracesdisplayed in A and B were recorded from different cells, and each trace is representative of five cells.
DISCUSSION
Considerations for the interpretation of results
By measuring the rates of reaction of charged MTS reagents with substituted cysteines throughout the M2–M3 loop, this study aimed to provide evidence for loop conformational changes during channel gating. However, several important considerations apply to the interpretation of the reaction rate data.
Many of the cysteine-substitution mutations caused large shifts in the glycine sensitivity (Fig. 2B). This highlights an unavoidable problem of using site-directed mutagenesis to investigate domains involved in receptor gating. The problem is one of reciprocity between ligand-binding sites and allosteric activation pathways. In the same way that a small ligand binding-induced conformational change in the ligand-binding site alters the structural orientation of domains involved in receptor activation, mutating these domains will also affect apparent ligand-binding affinity (Colquhoun, 1998). Thus, a caveat that must be applied to the findings of this study is that the mutations themselves may have induced structural alterations in the M2–M3 loop.
Each functional GlyR contains five introduced cysteines. This study has not determined how many cysteines per receptor need to be modified to produce the entire effect. This has important implications for the true rate of reaction, which in turn may have implications for understanding the mechanisms of action of the MTS reagents. A related issue concerns the fact that open state reaction rates were generally measured at the glycine EC20 value, which would have further distorted the true open state reaction rate. In this study, conclusions are based on the differential between the closed and open state reaction rates, not on their absolute magnitudes.
The rate of reaction of a charged MTS derivative is determined by three factors: local electrostatic potential, sulfhydryl ionization state, and steric availability of the sulfhydryl group at the protein surface. A state-dependent change in electrostatic potential can lead to a state-dependent difference in the reaction rate of a charged MTS derivative (Pascual and Karlin, 1998). If a state-dependent change in reaction rate is similar for a positively and a negatively charged MTS derivative, then a state-dependent change in electrostatic potential is unlikely. MTS ions react 5 × 10⁹times faster with ionized cysteines (-S−) than with uncharged thiols (-SH) (Roberts et al., 1986). Sulfhydryl ionization is likely to be increased in conditions of higher dielectric constant and increased space for the formation of activated complexes (Pascual and Karlin, 1998). Because water has a higher dielectric constant than a nonpolar protein interior, ionization state and steric availability are both determined by the accessibility of the sulfhydryl group to the protein surface. Thus, if electrostatic potential can be eliminated as a determinant of state-dependent changes in reactivity rates, then changes in surface availability of introduced sulfhydryl groups will be the dominant factor in controlling MTS reactivity rates.
The M2–M3 domain as an irregular surface loop
Substituted cysteine accessibility studies of the M2 domain of the nicotinic acetylcholine receptor have shown that protein surface α-helices generally have one exposed cysteine per helix rotation (Akabas et al., 1994; Zhang and Karlin, 1998). Similarly, β-sheets may be expected to have every second residue exposed (Akabas et al., 1992; Boileau et al., 1999). The observation that the seven contiguous residues closest to the M2 domain end of the loop are exposed to the aqueous interface (Fig. 4) is not consistent with either model and therefore reinforces the current view of this domain as an irregular loop (Galzi and Changeux, 1995; Karlin and Akabas, 1995; Rajendra et al., 1997). Because covalent modification of residues from R271C to P275C by either MTSET or MTSES did not affect the saturating current magnitude, it is unlikely that single channel conductance was modified. Therefore, despite linking directly to the M2 domain, it is unlikely that the loop contributes to the lining of the pore vestibule.
Either the four residues from S278C to K281C were exposed insufficiently to the surface to permit the access of MTSET or MTSES, or, if they were sufficiently exposed, their modification induced no dramatic change in receptor function. These residues lie close to the external end of the M3 domain. It has been demonstrated recently that several M3 domain residues of the GABAAR α1 subunit are exposed to the protein surface, implying that this domain lines a water-filled crevice that extends deep into the membrane (Williams and Akabas, 1999). The water accessibility of this crevice is increased in the GABA- and benzodiazepine-bound states (Williams and Akabas, 1999, 2000). Furthermore, because an M2 domain residue and an M3 domain residue combine to form a water-accessible alcohol and anesthetic binding site (Mascia et al., 2000), this crevice is apparently lined by elements of both domains.
Evidence for changes in the surface accessibility of the M2–M3 loop
As shown in Figure 7A, the MTSET reaction rate with all residues from R271C to K276C was faster in the glycine-bound state than in the unliganded state. Because the MTSES reaction rates with two of these residues (A272C and L274C) was also faster in the glycine-bound state (Fig. 7B), it can be concluded that surface accessibility is the dominant factor influencing the reaction rate. It was not possible to directly compare MTSET and MTSES modification rates at any other residue. However, because it is highly unlikely that electrostatic potential would change drastically from one residue to the next, it is probable that the MTSET reactivity difference of all residues from R271C to V277C is dominated by thiol surface accessibility. Hence, it may be concluded that when glycine binds to the receptor, these residues become more accessible at the protein surface.
It is not possible, however, to determine whether the M2–M3 loop moves with respect to static surrounding domains or whether the accessibility change is caused by the movement of an overlying domain. It is also not possible to resolve whether the overlying domain lies close enough to sterically control access to the substituted cysteines or whether a distant part of the receptor acts as a gate to prevent access to the entire domain.
Effects of covalent modification
MTSET modification of R271C, A272C, S273C, L274C, and K276C dramatically increased the apparent glycine affinity (Fig.5B). MTSES had a similar effect on the A272C mutant GlyR (Fig. 8). In principle, such effects could result from structural alterations to the glycine-binding site or to the receptor gating mechanism. However, because strong evidence implicates the M2–M3 loop as a transduction element (Kusama et al., 1994; Rajendra et al., 1995a;Campos-Caro et al., 1996; Lynch et al., 1997; Fisher and Macdonald, 1998; Lewis et al., 1998; Rovira et al., 1998, 1999; Boileau and Czajkowski, 1999; Grosman et al., 2000a,b), it is likely that MTS modification primarily affects the gating mechanism. If so, the increase in ligand affinity indicates a bias in the conformational equilibrium toward the high-affinity activated state. The irreversible partial activation of the L274C mutant GlyR by MTSES (Fig. 11) may be an extreme example of such a mechanism. On the other hand, MTSET modification of the P275C mutant GlyR decreased the glycine affinity (Fig. 5B), presumably by biasing the receptor conformation equilibrium toward the closed state. MTSES modification of the K276C and V277C mutant GlyRs resulted in a current reduction without an accompanying change in glycine affinity (Fig. 8), implying that the modified receptors were hindered from entering a fully conducting state.
MTSET and MTSES frequently induced different effects when applied to the same residue. For example, at position K276C, MTSET increased the apparent glycine affinity, whereas MTSES reduced current without affecting glycine sensitivity. Without knowledge of GlyR tertiary structure, it is not possible to explain such effects, although some general principles can be considered. Like any protein structure, the conformation of the M2–M3 loop is maintained by a combination of Van der Waals forces: hydrogen bonds and ionic bonds with both water and neighboring domains. The attached ethyltrimethylammonium and ethylsulfonate side chains would be expected to affect loop structure by two mechanisms. First, their bulkiness would distort the local protein structure, and second, they would introduce additional charges and hydrogen bond-forming ions. Together, these effects would change the balance of existing bonding forces or create new ones, leading to either a change in the local structure or a change in the stability of the existing structure. Thus, the difference in size, charge, and chemical properties of ethyltrimethylammonium and ethylsulfonate could bias the receptor toward various different functional states, leading to a variety of different phenotypes.
Although DTT efficiently reduced MTSET modification of all responsive mutants and MTSES modification of R271–S273C, it did not reduce the MTSES modification of L274C–V277C. Because MTSES is smaller than MTSET, the MTSES modification of these later residues probably resulted in a reduced space around the introduced sulfhydryl groups, thereby hindering DTT accessibility to the disulfide bonds. A surprising finding was that MTSES modification of P275C and K276C rendered the GlyRs susceptible to activation by DTT (Fig.10C,D). Because DTT did not reverse the MTSES-mediated inhibition of the K276C mutant GlyR, it is unlikely that the agonist action was mediated by the reduction of K276C. It is more likely that DTT acts elsewhere on the receptor, possibly by reducing an endogenous disulfide bond.
An unusual observation was that the L274C mutant GlyR was not affected by either MTSET or MTSES unless it was first exposed to DTT for 1 min. As stated above, DTT did not change the glycine sensitivity. One possibility is that the introduced cysteines in adjacent subunits are constitutively cross-linked in the naive L274C GlyR. However, because the resultant conformational restriction should affect the glycine sensitivity, this possibility is unlikely. Another possibility is that some component of the cell culture medium may have chemically modified the introduced cysteines at this position. Additional experiments are required to determine why the naive L274C GlyR is insensitive to MTS reagents.
When the L274C mutant GlyR was irreversibly activated by MTSES, the resultant current was not affected by 1 mm picrotoxin but was completely inhibited by 100 μm strychnine. Picrotoxin behaves as a potent competitive antagonist of the WT GlyR α1 subunit (Lynch et al., 1995). However, picrotoxin almost certainly acts via an allosteric mechanism because mutations to R271 convert it into a noncompetitive antagonist at high picrotoxin concentrations and into an allosteric potentiator at low concentrations (Lynch et al., 1995). The loss of picrotoxin sensitivity in the MTSES-modified L274C mutant GlyR is therefore not surprising given that mutations to a nearby residue drastically affect its mode of action. However, much evidence implicates strychnine as a classical competitive antagonist of the GlyR (for review, see Rajendra et al., 1997). The observation that extremely high (100 μm) strychnine concentrations inhibit an irreversibly activated GlyR in the absence of glycine suggests that strychnine may also act via a distinct mechanism. Additional experiments are required to investigate this novel mechanism of action.
Comparison with other studies
It has been demonstrated previously that genetic mutations causing human startle disease (Rajendra et al., 1995a; Lynch et al., 1997;Lewis et al., 1998; Saul et al., 1999) and numerous alanine-substituted mutations in both the M1–M2 and the M2–M3 loops (Lynch et al., 1997) functionally disrupt the linkage between the GlyR agonist-binding sites and the activation gate. From this it was inferred that the loops were components of the receptor gating process. Recent evidence from the nicotinic acetylcholine receptor cation channel (Campos-Caro et al., 1996; Rovira et al., 1998, 1999; Grosman et al., 2000a,b), the GABAc receptor Cl−channel (Kusama et al., 1994), and the GABAAreceptor Cl− channel (Fisher and Macdonald, 1998; Boileau and Czajkowski, 1999) suggests that this domain also comprises a gating control element in other members of the ligand-gated ion channel superfamily. By demonstrating that the surface accessibility of the M2–M3 loop is increased in the glycine-bound state, the present study provides evidence for an external conformational change that accompanies channel activation and places constraints on structural models of ligand-gated ion channels.
Footnotes
This work was supported the Australian Research Council (J.W.L.) and the National Health and Medical Research Council of Australia (P.R.S.). N.-L.R.H. was the recipient of an International Postgraduate Research Studentship from the Australian Commonwealth Department of Education, Training and Youth Affairs.
Correspondence should be addressed to Dr. Joseph Lynch, Department of Physiology and Pharmacology, University of Queensland, Brisbane, QLD, 4072, Australia. E-mail: lynch@plpk.uq.edu.au.
REFERENCES
- 1.Akabas MH, Stauffer DA, Xu M, Karlin A. Acetylcholine receptor structure probed in cysteine-substitution mutants. Science. 1992;258:307–310. doi: 10.1126/science.1384130. [DOI] [PubMed] [Google Scholar]
- 2.Akabas MH, Kaufmann C, Archdeacon P, Karlin A. Identification of acetylcholine receptor channel-lining residues in the entire M2 segment of the α subunit. Neuron. 1994;13:919–927. doi: 10.1016/0896-6273(94)90257-7. [DOI] [PubMed] [Google Scholar]
- 3.Boileau AJ, Czajkowski C. Identification of transduction elements for benzodiazepine modulation of the GABAA receptor: three residues are required for allosteric coupling. J Neurosci. 1999;19:10213–10220. doi: 10.1523/JNEUROSCI.19-23-10213.1999. [DOI] [PMC free article] [PubMed] [Google Scholar]
- 4.Boileau AJ, Evers AR, Davis AF, Czajkowski C. Mapping the agonist binding site of the GABAA receptor: evidence for a β-strand. J Neurosci. 1999;19:4847–4854. doi: 10.1523/JNEUROSCI.19-12-04847.1999. [DOI] [PMC free article] [PubMed] [Google Scholar]
- 5.Campos-Caro A, Sala S, Balesta JJ, Vicente-Agullo F, Criado M, Sala F. A single residue in the M2–M3 loop is a major determinant of coupling between binding and gating in neuronal nicotinic receptors. Proc Natl Acad Sci USA. 1996;93:6118–6123. doi: 10.1073/pnas.93.12.6118. [DOI] [PMC free article] [PubMed] [Google Scholar]
- 6.Chen C, Okayama H. High efficiency expression of mammalian cells by plasmid DNA. Mol Cell Biol. 1987;7:2745–2751. doi: 10.1128/mcb.7.8.2745. [DOI] [PMC free article] [PubMed] [Google Scholar]
- 7.Colquhoun D. Binding, gating, affinity and efficacy: the interpretation of structure-activity relationships for agonists and of the effects of mutating receptors. Br J Pharmacol. 1998;125:924–947. doi: 10.1038/sj.bjp.0702164. [DOI] [PMC free article] [PubMed] [Google Scholar]
- 8.Elmslie FV, Hutchings SM, Spencer V, Curtis A, Covanis T, Gardiner RM, Rees M. Analysis of GLRA1 in hereditary and sporadic hyperekplexia: a novel mutation in a family cosegregating for hyperekplexia and spastic paraparesis. J Med Genet. 1996;33:435–436. doi: 10.1136/jmg.33.5.435. [DOI] [PMC free article] [PubMed] [Google Scholar]
- 9.Fisher JL, Macdonald RL. The role of an α subtype M2–M3 His in regulating inhibition of GABAA receptor current by zinc and other divalent cations. J Neurosci. 1998;18:2944–2953. doi: 10.1523/JNEUROSCI.18-08-02944.1998. [DOI] [PMC free article] [PubMed] [Google Scholar]
- 10.Galzi J-L, Changeux JP. Neuronal nicotinic receptors: molecular organization and regulations. Neuropharmacology. 1995;34:563–582. doi: 10.1016/0028-3908(95)00034-4. [DOI] [PubMed] [Google Scholar]
- 11.Grosman C, Salamone FN, Sine SM, Auerbach A. The extracellular linker of muscle acetylcholine receptor channels is a gating control element. J Gen Physiol. 2000a;116:327–339. doi: 10.1085/jgp.116.3.327. [DOI] [PMC free article] [PubMed] [Google Scholar]
- 12.Grosman C, Zhou M, Auerbach A. Mapping the conformational wave of acetylcholine receptor channel gating. Nature. 2000b;403:773–776. doi: 10.1038/35001586. [DOI] [PubMed] [Google Scholar]
- 13.Karlin A, Akabas MH. Toward a structural basis for the function of nicotinic acetylcholine receptors and their cousins. Neuron. 1995;15:1231–1244. doi: 10.1016/0896-6273(95)90004-7. [DOI] [PubMed] [Google Scholar]
- 14.Karlin A, Akabas MH. Substituted-cysteine accessibility method. Methods Enzymol. 1998;293:123–145. doi: 10.1016/s0076-6879(98)93011-7. [DOI] [PubMed] [Google Scholar]
- 15.Kusama T, Wang JB, Spivak CE, Uhl GR. Mutagenesis of the GABA ρ1 receptor alters agonist affinity and channel gating. NeuroReport. 1994;5:1209–1212. doi: 10.1097/00001756-199406020-00012. [DOI] [PubMed] [Google Scholar]
- 16.Lewis TM, Sivilotti LG, Colquhoun D, Gardiner RM, Schoepfer R, Rees M. Properties of human glycine receptors containing the hyperekplexia mutation alpha1(K276E), expressed in Xenopus oocytes. J Physiol (Lond) 1998;507:25–40. doi: 10.1111/j.1469-7793.1998.025bu.x. [DOI] [PMC free article] [PubMed] [Google Scholar]
- 17.Lynch JW, Rajendra S, Barry PH, Schofield PR. Mutations affecting the glycine receptor agonist transduction mechanism convert the competitive antagonist, picrotoxin, into an allosteric potentiator. J Biol Chem. 1995;270:13799–13806. doi: 10.1074/jbc.270.23.13799. [DOI] [PubMed] [Google Scholar]
- 18.Lynch JW, Rajendra S, Pierce KD, Handford CA, Barry PH, Schofield PR. Identification of intracellular and extracellular domains mediating signal transduction in the inhibitory glycine receptor chloride channel. EMBO J. 1997;16:110–120. doi: 10.1093/emboj/16.1.110. [DOI] [PMC free article] [PubMed] [Google Scholar]
- 19.Mascia MP, Trudell JR, Harris RA. Specific binding sites for alcohols and anesthetics on ligand-gated channels. Proc Natl Acad Sci USA. 2000;97:9305–9310. doi: 10.1073/pnas.160128797. [DOI] [PMC free article] [PubMed] [Google Scholar]
- 20.Pascual JM, Karlin A. State-dependent accessibility and electrostatic potential in the channel of the acetylcholine receptor: inferences from rates of reaction with thiosulfonates with substituted cysteines in the M2 segment of the alpha subunit. J Gen Physiol. 1998;111:717–739. doi: 10.1085/jgp.111.6.717. [DOI] [PMC free article] [PubMed] [Google Scholar]
- 21.Rajendra S, Lynch JW, Pierce KD, French CR, Barry PH, Schofield PR. Mutation of an arginine residue in the human glycine receptor transforms β-alanine and taurine from agonists into competitive antagonists. Neuron. 1995a;14:169–175. doi: 10.1016/0896-6273(95)90251-1. [DOI] [PubMed] [Google Scholar]
- 22.Rajendra S, Vandenberg RJ, Pierce KD, Cunningham AM, French PW, Barry PH, Schofield PR. The unique extracellular disulfide loop of the glycine receptor is a principal ligand binding element. EMBO J. 1995b;14:2987–2998. doi: 10.1002/j.1460-2075.1995.tb07301.x. [DOI] [PMC free article] [PubMed] [Google Scholar]
- 23.Rajendra S, Lynch JW, Schofield PR. The glycine receptor. Pharmacol Ther. 1997;73:121–146. doi: 10.1016/s0163-7258(96)00163-5. [DOI] [PubMed] [Google Scholar]
- 24.Rees MI, Andrew M, Jawad S, Owen MJ. Evidence for recessive as well as dominant forms of startle disease (hyperekplexia) caused by mutations in the α1 subunit of the inhibitory glycine receptor. Hum Mol Genet. 1994;3:2175–2179. doi: 10.1093/hmg/3.12.2175. [DOI] [PubMed] [Google Scholar]
- 25.Roberts DD, Lewis SD, Ballou DP, Olson ST, Shafer JA. Reactivity of small thiolate anions and cysteine-25 in papain toward methyl methanethiosulfonate. Biochemistry. 1986;25:5595–5601. doi: 10.1021/bi00367a038. [DOI] [PubMed] [Google Scholar]
- 26.Rovira JC, Ballesta JJ, Vicente-Agullo F, Campos-Caro A, Criado M, Sala F, Sala S. A residue in the middle of the M2–M3 loop of the beta 4 subunit specifically affects gating of neuronal nicotinic receptors. FEBS Lett. 1998;433:89–92. doi: 10.1016/s0014-5793(98)00889-8. [DOI] [PubMed] [Google Scholar]
- 27.Rovira JC, Vicente-Agullo F, Campos-Caro A, Criado M, Sala F, Sala S, Ballesta JJ. Gating of alpha3beta4 neuronal nicotinic receptor can be controlled by the M2–M3 loop of both alpha3 and beta4 subunits. Pflügers Arch. 1999;439:86–92. doi: 10.1007/s004249900143. [DOI] [PubMed] [Google Scholar]
- 28.Saul B, Kuner T, Sobetzko D, Brune W, Hanefield F, Meinck HM, Becker CM. Novel GLRA1 missense mutation (P250T) in dominant hyperekplexia defines an intracellular determinant of glycine receptor channel gating. J Neurosci. 1999;19:869–877. doi: 10.1523/JNEUROSCI.19-03-00869.1999. [DOI] [PMC free article] [PubMed] [Google Scholar]
- 29.Shiang R, Ryan SG, Zhu YZ, Hahn AF, O'Connell P, Wasmuth JJ. Mutations in the α1 subunit of the inhibitory glycine receptor cause the dominant neurologic disorder, hyperekplexia. Nat Genet. 1993;5:351–358. doi: 10.1038/ng1293-351. [DOI] [PubMed] [Google Scholar]
- 30.Shiang R, Ryan SG, Zhu YZ, Fielder TJ, Allen RJ, Fryer A, Yamashita S, O'Connell P, Wasmuth JJ. Mutational analysis of familial and sporadic hyperekplexia. Ann Neurol. 1995;38:85–91. doi: 10.1002/ana.410380115. [DOI] [PubMed] [Google Scholar]
- 31.Stauffer DA, Karlin A. Electrostatic potential of the acetylcholine binding sites in the nicotinic receptor probed by reactions of binding-site cysteines with charged methanethiosulfonates. Biochemistry. 1994;33:6840–6849. doi: 10.1021/bi00188a013. [DOI] [PubMed] [Google Scholar]
- 32.Williams DB, Akabas MH. γ-aminobutyric acid increases the water accessibility of M3 membrane-spanning segment residues in γ-aminobutyric acid type A receptors. Biophys J. 1999;77:2563–2574. doi: 10.1016/s0006-3495(99)77091-8. [DOI] [PMC free article] [PubMed] [Google Scholar]
- 33.Williams DB, Akabas MH. Benzodiazepines induce a conformational change in the region of the γ-aminobutyric acid type A receptor α1-subunit M3 membrane-spanning domain. Mol Pharmacol. 2000;58:1129–1136. doi: 10.1124/mol.58.5.1129. [DOI] [PubMed] [Google Scholar]
- 34.Zhang H, Karlin A. Contribution of the β subunit M2 segment to the ion-conducting pathway of the acetylcholine receptor. Biochemistry. 1998;37:7952–7964. doi: 10.1021/bi980143m. [DOI] [PubMed] [Google Scholar]


