

Abstract
The subthalamic nucleus (STN), a component of the basal ganglia motor system, sends an excitatory amino acid (EAA)-containing projection to the ventral pallidum (VP), a major limbic system output region. The VP contains both NMDA and AMPA subtypes of EAA receptors. To characterize the physiology of the subthalamic pathway to the VP, and to determine the influence of EAA receptor subtypes, in vivo intracellular recordings, and in vivoextracellular recordings combined with microiontophoresis, were made from VP neurons in anesthetized rats. Of the intracellularly recorded neurons, 86% responded to STN stimulation, and these displayed EPSPs with an onset of 8.7 msec, consistent with a monosynaptic input. The EPSPs evoked in spontaneously firing neurons were nearly twice the amplitude of those in nonfiring cells (13.1 vs 6.8 mV, respectively). As neurons were depolarized by current injection, the latency for spiking decreased from 24.2 to 14.2 msec, although EPSP latency was unaffected. Eighty-seven percent of the extracellularly recorded VP neurons responded to STN stimulation with a rapid and robust enhancement of spiking; the response onset, like the EPSP onset, equaled 8.7 msec. Firing rate was enhanced by NMDA in 94% of the STN-excited cells, and AMPA increased firing in 94% as well. The NMDA-selective antagonist AP-5 attenuated 67% of the STN-evoked excitatory responses, and the AMPA-selective antagonist CNQX attenuated 52%. Both antagonists attenuated 33% of responses, and 78% were attenuated by at least one. This evidence suggests that a great majority of VP neurons are directly influenced by STN activation and that both NMDA and non-NMDA receptors are involved. Moreover, the VP response to STN stimulation appears to be strongly dependent on the depolarization state of the neuron.
Keywords: ventral pallidum, subthalamic nucleus, basal ganglia, NMDA, AMPA, CNQX, AP-5, electrophysiology
The subthalamic nucleus (STN) is a basal ganglia structure involved in processes related to both normal motor function and movement disorders (Albin et al., 1989; Graybiel et al., 1994). Damage to the STN can result in hemiballismus (Whittier and Mettler, 1949; Guridi and Obeso, 1997), whereas surgically placed lesions of the STN in Parkinson's disease patients reverse many of the motor symptoms associated with this pathology (Guridi and Obeso, 1997). STN function may not be limited to effects on motor systems, for excitotoxic lesions of the STN in rats induce deficits in attentional tasks (Baunez and Robbins, 1997). It is plausible that the nonmotor functions of the STN reflect its reciprocal projections with the ventral pallidum (VP) (Groenewegen and Berendse, 1990), a brain region that serves as a major output from the limbic (ventral) striatum (Heimer et al., 1985). As suggested by the anatomy of the VP and its associated structures, recent electrophysiological studies have demonstrated that the VP integrates information flow among distinct limbic and basal ganglia systems (Chrobak and Napier, 1993;Maslowski-Cobuzzi and Napier, 1994; Mitrovic and Napier, 1998). Consistent with this role, the VP influences motivational (Richardson and DeLong, 1991), cognitive (Chrobak et al., 1991; Wilson, 1991), and motor (Mogenson and Yang, 1991) behaviors. Thus, a better definition of its influence on the VP may delineate a clearer understanding of the functional repertoire of the STN, as well as the putative deficits that may occur with dysfunction of this structure.
The STN sends an excitatory amino acid (EAA)-containing projection to the VP (Kita and Kitai, 1987; Smith and Parent, 1988; Groenewegen and Berendse, 1990). EAA receptor mRNA (Standaert et al., 1994), protein (Page and Everitt, 1995), and ligand binding (Monaghan and Cotman, 1985; Martin et al., 1993) have been observed within the VP for two major classes of ionotropic receptors (AMPA and NMDA). The functional significance of EAA receptors in the VP is suggested by the fact that activation of these receptors increases the VP neuronal firing rate (Lamour et al., 1986; Napier et al., 1991) and enhances locomotion (Shreve and Uretsky, 1991; Gong et al., 1997). Despite the compelling evidence for the presence of an EAA-containing projection from the STN to the VP, the physiological response associated with this projection, as well as the EAA receptor subtypes involved, have yet to be delineated. Thus, to directly assess the physiology of the STN projection to the VP, we electrically activated the STN in chloral hydrate-anesthetized rats while performing either extracellular or intracellular recordings of single VP neurons. To ascertain the EAA receptor subtype mediating the VP response, the ability of the AMPA antagonist CNQX and the NMDA antagonist AP-5 to attenuate STN-evoked responding was determined.
MATERIALS AND METHODS
Animal preparation. All animals were handled in accordance with the procedures outlined in the Guide for the Care and Use of Laboratory Animals published by the US Public Health Service, and specific protocols were approved by the Loyola University and University of Pittsburgh Animal Care and Use Committees. Recordings were made from Sprague Dawley male rats (Harlan Labs, Indianapolis, IN, and Zivic-Miller, Portersville, PA) weighing 300–330 gm. The rats were anesthetized with chloral hydrate (400 mg/kg, i.p.; Sigma, St. Louis, MO), mounted in a stereotaxic apparatus (David Kopf Industries, Tujunga, CA), and fitted with a lateral tail vein catheter for subsequent anesthetic administration. The core body temperature was maintained at 37 ± 0.5°C by a thermostatically controlled heating pad (Fintronics, Orange, CT). An incision was made in the scalp, the skull was exposed, and a burr hole was drilled over the VP [coordinates: posterior (P) 0.4 mm and lateral (L) 2.3 mm from Bregma, and ventral (V) 7.5–8.5 from the brain surface] and the STN (P 3.7 mm and L 2.4 mm from Bregma, and V 7.7 mm from brain surface) (Paxinos and Watson, 1986).
Microelectrodes. Intracellular microelectrodes were pulled from 1.0 mm outer diameter (o.d.) Omegadot tubing (WPI, New Haven, CT) using a Flaming-Brown P-80/PC microelectrode puller (Sutter Instrument Company, Novato, CA). The electrodes were filled with 3.0m potassium acetate (electrode resistance = 55–85 MΩ in situ).
The microiontophoretic pipette and extracellular recording microelectrode assembly was constructed by heat pulling (Narishige puller, Setagaya-Ku, Tokyo) five-barrel and single-barrel glass pipettes (A-M Systems, Carlsburg, WA). The five-barrel pipette tip was broken back to 15 μm across its widest dimension. The single-barrel electrode tip was broken back to 3–4 μm. The two pipettes were cemented together in parallel with the microelectrode tip protruding 15 μm beyond the tip of the multibarrel pipette.
The extracellular recording microelectrode and central barrel of the multibarrel microiontophoretic pipette (which served as a current-balancing channel) were filled with a 2% pontamine sky blue/0.5 m sodium acetate solution (BDH Chemicals, Poole, England). The other four barrels of the microiontophoretic pipette were individually filled with one of the following drugs (all purchased from Research Biochemicals International, Natick, MA): NMDA, 50 mm in 200 mm NaCl, pH 8.0; AMPA, 10 mm in 150 mm NaCl, pH 8.0; 6-cyano-7-nitroquinoxaline-2,3-dione (CNQX), 1 mm in 200 mm NaCl, pH 9.0; or 2-amino-5-phosphonopentanoic acid (AP-5), 50 mm in 200 mm NaCl, pH 8.0. We have determined previously that vehicles with similar pH values did not alter neuronal firing (Napier et al., 1991). As measured in saline (Winston Electronics Company, Millbray, CA), the final impedance of the recording microelectrode was 3–5 MΩ, the balance pipette was 20–30 MΩ, and the drug-containing pipettes were 30–50 MΩ.
Electrical activation of the STN. Stimulation of the STN was achieved using a stainless steel concentric bipolar electrode (NEX-100: inner diameter 0.2, o.d. 0.5, with two 0.5 mm contacts separated by 0.5 mm insulation; David Kopf Instruments, Tujunga, CA). Current was generated using a stimulator (S 88; Grass Medical Instruments Company, Quincy, MA), then passed in series through a stimulus isolation unit (PSIU 6; Grass Instruments) and constant current unit (CCU 1; Grass Instruments). A 0.05–1.6 mA square pulse was delivered at 1 Hz. For the intracellular recording experiments, a pulse duration range of 0.1–0.5 msec was evaluated initially. It was determined that EPSPs were more reliably evoked with stimuli of longer duration (i.e., 0.3–0.5 msec) with no change in EPSP latency or amplitude, and a 0.5 msec pulse duration used for the intracellular recordings reported in this study. For the extracellular recording experiments, the stimulation pulse duration was 0.1 msec.
Intracellular recording protocols. For intracellular recordings, impalements were defined as stable if the resting membrane potential (RMP) was at least −55 mV, and the action potential amplitude was at least 60 mV. A headstage amplifier connected to a preamplifier (NEURODATA IR-283; Cygnus Technology, Delaware Water Gap, PA) amplified signals. Current was injected across a bridge circuit, with electrode potentials and current injection amplitude monitored on an oscilloscope (BK Precision Instruments, Placentia, CA) using a Microstar board (Microstar Labs, Bellevue, WA) as an interface to a PC computer. Recorded data were stored on the hard drive of the computer for subsequent off-line analysis using a custom-designed software program.
The EPSPs evoked by stimulating the STN were recognized by their failure to reach threshold potentials and by the passive repolarization. The onset latency for EPSPs was calculated from the onset of the stimulus artifact to the onset of the membrane potential deflection, and the EPSP duration was measured from the beginning of the EPSP to the repolarization to RMP. Unless stated otherwise, the amplitude of the evoked EPSP was measured only in cases in which a concurrent spike was not evoked. The onset delay for spikes was calculated from the onset of the stimulus artifact to the threshold for the fast component of the action potential. Data were compared using a Student's t test or paired t test. Significance is reported at the p ≤ 0.05 level. Data are expressed as mean ± SEM.
Extracellular recording protocols. Action potentials were amplified and discriminated from baseline (using an amplifier/window-discriminator; Fintronics, Orange, CT), and the discriminator output signal was collected using a digital counter-timer PC card (Metrabyte, Taunton, MA) and custom software and stored on a PC for off-line analysis. Action potentials with amplitudes that were at least three times that of background were evaluated. The number of spontaneously firing cells encountered per electrode penetration through the VP (termed “track”) was determined. The peak-to-peak amplitude, duration, waveform (e.g., a positive then negative deflection), and number of deflections were obtained for representative action potentials of each cell. A 5 min stable recording period was used to assess the spontaneous firing pattern [i.e., interspike interval (ISI)] and rate.
To test for sensitivity to activation of the STN, a stimulation current of 0.8–1.2 mA was used to generate 128 samples of 1 sec stimulation epochs. A peristimulus raster was constructed (by a Fintronics raster stepper) on a storage oscilloscope (Tektronix, Beaverton, OR) and photographed using Polaroid film (Cambridge, MA). A peristimulus time histogram was generated on-line for the discriminated action potentials that occurred within each 2 msec bin before and after the onset of the stimulus artifact. Action potentials occasionally appeared during the stimulus artifact (which occurred within the first two bins; 0–3.9 msec), and these could not be isolated with the voltage amplitude criterion used by the window discriminator. As a result, it is possible that in some cases the latency for VP spiking after STN stimulation may have been shorter than what was recorded. Verification that stimulation of the STN-evoked responses that differed from those obtained when regions outside the STN were stimulated was accomplished by comparing (1) the distribution of evoked response categories evoked using χ2 analysis and (2) the characteristics of evoked responses using Student's t test (e.g., amplitude, duration, latency, and threshold current needed to produce a response). In STN-sensitive VP neurons, repeated sampling was performed by varying the STN stimulation current from 0.2 to 1.2 mA in 2 mA intervals to establish the minimum current amplitude required to produce a significant response (threshold) and the maximal response (Emax). Subsequent testing using EAA antagonists was performed at the stimulation current that evoked a VP response that was ∼70–90% of maximal (ECur70 toECur90).
To determine the role of ionotropic EAA receptor subtypes in VP cell firing, microiontophoretic techniques were used. The drugs were retained in the microiontophoretic pipette using a cationic current of 10 nA and expelled using an anionic current of 5–120 nA. The agonists AMPA and NMDA were applied in 10 sec ejection/30 sec retention cycles. Drug effects were assessed by comparing the average spiking for the last six 1 sec bins during drug iontophoresis to the six bins immediately preceding drug ejection (baseline). Neurons with firing enhanced by AMPA or NMDA by at least 20% above baseline by 50 nA were then used to evaluate the effectiveness and specificity of the receptor subtype-selective antagonists CNQX and AP-5. To do this, an agonist ejection current that produced an increase in firing to ∼50% of the maximum response obtained (ECur50) was repeatedly pulsed on while a continuous ejection current was applied to the antagonist. The minimum antagonist ejection current that produced an attenuation of the homotypic agonist-induced rate enhancement by at least 20% was determined (this was the on-line criterion for “effective” antagonism). To indicate receptor selectivity, antagonist effectiveness was tested for the response induced by the heterotypic agonist. This ejection current also was used to assess the effects of the antagonist on spontaneous firing and occasionally it was observed that spontaneous firing was altered. Thus, it was important that the statistical analysis of the agonist + antagonist effects were corrected for this possible confound. This correction (cA) was accomplished by multiplying the rate obtained during agonist application (A) by the ratio of the rate obtained during the antagonist alone (An) and the spontaneous (no drug) firing rate (S); therefore, cA= A(An/S). Because this “corrected agonist rate” took into account any possible changes that might have occurred with the antagonist alone, it was compared directly with the observed agonist + antagonist rate using a paired t test (p ≤ 0.05).
To indicate the receptor subtype that mediated VP responses to activation of the STN, the antagonist ejection current that effectively and selectively produced antagonism of the homotypic agonist was applied to the VP cell during stimulation of the STN. The off-line analysis of the peristimulus time histograms generated from the 128 STN stimulation epochs was as follows. The number of counts per bin during the 40 bins (80 msec) that preceded the stimulus artifact was averaged and used as a baseline value. Responses that occurred within the first 50 bins (100 msec) after the STN stimulation artifact were analyzed. Using the control condition, i.e., when no antagonist was applied, the onset of a response component was defined as the first of two (for quick onset, short duration responses) or three consecutive bins with counts that differed from the prestimulus mean by >1.65 SD. Evoked response offset was defined as the first of two or three consecutive bins that no longer met this criterion. This approach set pat 0.01 or 0.001, respectively (Chrobak and Napier, 1993;Maslowski-Cobuzzi and Napier, 1994; Mitrovic and Napier, 1998). For numeric averaging, the midpoint of the first bin in the response was used, e.g., the post-STN stimulation bin lasting from 4 to 5.9 msec would be assigned a value of 5 for calculating the mean and variance of the response onset. The bin location of the most frequently occurring onset time, or mode, also was determined. The ability of the EAA antagonists to alter these parameters was used as an indication of the involvement of the receptor subtype in the STN-evoked VP responses. To ensure that any rate changes that the antagonists had on spontaneous firing did not confound the interpretation of the ability of antagonists to alter STN-evoked responses, we used an established analytic method that corrected for this possible influence (Chrobak and Napier, 1993; Maslowski-Cobuzzi and Napier, 1994; Mitrovic and Napier, 1998) that is similar to the approach used for evaluating antagonist effects on spontaneous firing. In this protocol, the agonist-induced response is represented by an evoked component putatively resulting from STN stimulation-evoked release of an unknown endogenous agonist transmitter (T). Thus, the corrected response (cT) was obtained by multiplying the number of spikes obtained during a component of the STN-evoked response (T) by the ratio of the prestimulus baseline rate obtained during antagonist iontophoresis (AnB) and the baseline rate obtained in the control (no drug) condition (B); i.e., cT = T(AnB/B) (for a specific example, see Fig. 8legend). As would be predicted, when calculated for neurons with a baseline that was not altered by the antagonists, cT =T [e.g., see Mitrovic and Napier (1998)]. BecausecT took into account baseline rate changes produced by the antagonist alone, cT was compared directly with the evoked response observed during antagonist application for all cells tested using a paired t test (p ≤ 0.05). The data are presented as mean ± SEM.
Fig. 8.

Peristimulus time histograms illustrating the effect of the AMPA antagonist CNQX and the NMDA antagonist AP-5 on extracellular responses evoked by stimulating the subthalamic nucleus (using 0.8 mA). These histograms were obtained from the same ventral pallidal neuron that is presented in Figure 7A. Each histogram is of responses totaled in 2 msec bins, from 128, 1 Hz epochs of subthalamic stimulation, (denoted at time 0).B–D, Scales are the same as those forA. A, The short-latency excitation of the type typically seen in ventral pallidal neurons in response to stimulation of the subthalamic nucleus (control). A total of 83 action potentials or spikes were in this evoked response component. B, Microiontophoretic applications of CNQX at 30 nA during subthalamic stimulation reduced the number of spikes in the evoked component to 49. Statistical comparisons of these data were conducted on a transformation that compensates for possible changes in baseline that may be induced by the antagonist and could impact the evoked response magnitude [i.e., cT =T (AnB/B); see Materials and Methods]. The corrected evoked response (cT) equals the evoked response in the control condition (T, i.e., 83) multiplied by the ratio of the prestimulus baseline obtained during CNQX iontophoresis (AnB, 3.5 spikes per bin) and baseline during the untreated control (B, 4.0 spikes per bin). Thus, the corrected evoked response, cT, equals 73.5 spikes. Because 49 spikes were obtained in the evoked response while 30 nA of CNQX was applied, this represents a 33% decrease in the subthalamic nucleus-evoked excitation. C, This peristimulus time histogram illustrates that increasing the ejection current of CNQX to 120 nA further reduced the magnitude of the excitatory evoked response. Because 32 spikes occurred in this component during 120 nA CNQX, when compared with a corrected value (cT) of 69.0, this represents a 54% decrease. As illustrated in Figure 7A, 120 nA of CNQX still demonstrated non-NMDA receptor subtype selectivity. D, Microiontophoresis of AP-5 at 30 nA attenuated the evoked response to 46 spikes. The corrected value for the excitatory response was 73.0, revealing an antagonist-produced decrease of 37%.
Histology. After termination of the extracellular recording experiments, pontamine sky blue was electrophoretically deposited from the recording electrode (300 V, 15 min). All rats were killed with an overdose of chloral hydrate, and the brain was removed. The brain was stored at −80°C before sectioning. The frozen brain was mounted on a chuck, cut into 60 μm sections, and thaw-mounted on slides. These sections were then stained with cresyl violet (J. T. Baker Chemical Company, Phillipsburg, NJ) or cresyl violet with neutral red (Sigma) counterstain. The location of the pontamine sky blue dye ejection was determined, and the extracellular recording sites were calculated relative to this position (see Fig. 1A). The VP location of intracellularly recorded neurons was estimated by reconstruction from the microelectrode track. To substantiate that the recordings were of VP neurons, intracellularly determined electrophysiological characteristics were compared with those of neurons verified in previous studies to be in the VP (Lavin and Grace, 1996). STN-stimulating electrode placement also was determined for all experiments by visualizing the electrode track (see Fig.1B). Two independent observers verified the histology. A Student's t test was used to compare the extracellularly determined electrophysiological parameters of neurons recorded from different anatomical locations in the VP (e.g., medial vs lateral VP and baseline firing rate or sensitivity to STN stimulation). For distribution analysis, a χ2 test was used (p ≤ 0.05).
Fig. 1.
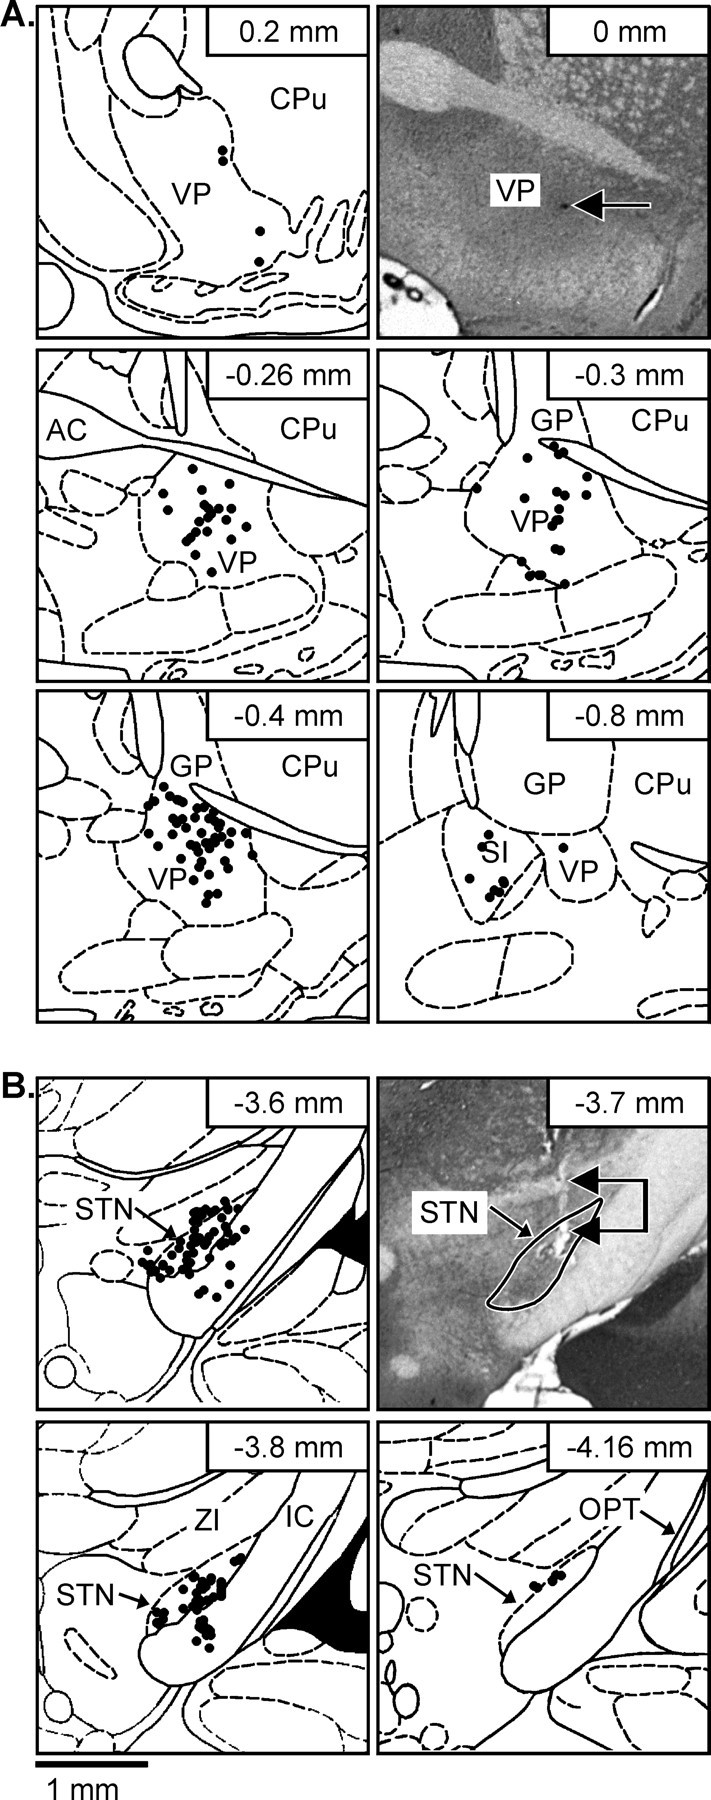
Illustration of the anatomical location of recorded ventral pallidal neurons and stimulation electrode tips in the subthalamic nucleus (STN). The photomicrographs (A, top right, B,top right) are cresyl violet-stained coronal brain sections. The arrow (A, top right) indicates the spot where pontamine sky blue was deposited in the tissue at the tip of an extracellularly placed microelectrode to reveal the site of a recorded neuron. Theconnected arrows (B, top right) point to the lesion produced by insertion of the stimulating electrode, and the STN isoutlined. Plotted on the line-drawn stereotaxic maps (Paxinos and Watson, 1986) are representations of the recording (A) and stimulation (B) sites from which data were obtained in the extracellular recording experiments. Many of the recording sites overlapped. Recording and stimulation locales for the intracellular recording experiments were the same as those for the extracellular study (data not shown). The stimulating electrode configuration (concentric bipolar with two 500 μm contacts separated by 500 μm insulation) allows stimulation to occur dorsal to the tip of the electrode; only the tip is plotted, so the stimulating electrode extends through the STN for those points that appear to have placements in the ventral medial portions of the internal capsule (IC). The number in thetop right corner of each map indicates the distance from bregma. CPu, Caudate-putamen; AC, anterior commissure; GP, globus pallidus;SI, substantia innominata; ZI, zona inserta; OPT, optic tract.
RESULTS
The data reported in this study were collected from a total of 14 VP neurons recorded intracellularly and 139 neurons recorded extracellularly. The sampled neurons were located throughout the entire rostrocaudal and dorsoventral extent of the VP as defined by Heimer and Wilson (1975) and delineated by substance P immunohistochemistry (Haber and Nauta, 1983; Napier et al., 1995), with the exception of the rostroventral infra-accumbal extreme (Fig.1A). There were no apparent differences in the intracellularly or extracellulary determined physiological parameters for the VP neurons examined (e.g., firing rate, firing pattern, action potential or synaptic potential characteristics, sensitivity to STN stimulation) that distinguished groups of neurons within a particular anatomical region of the VP. The locations of the tip of the stimulating electrodes used to activate the STN are illustrated in Figure 1B.
General electrophysiological characteristics
Intracellular recordings
Of the 14 VP neurons sampled intracellularly at RMP, 86% (12 of 14) responded to STN stimulation (Fig. 2, Table 1). These neurons exhibited electrophysiological characteristics that were consistent with VP neurons identified previously (Lavin and Grace, 1996). Of the 12 responding neurons, 3 were spontaneously firing and exhibited a regular spiking pattern with an average firing frequency of 14.5 ± 7.7 spikes per second. Two other neurons demonstrated only infrequent spike discharge, and seven did not spike during the recording session; these nine were operationally defined as quiescent neurons. The spontaneously discharging neurons had a slightly more but not significantly different (NS) depolarized RMP (quiescent = −71.9 ± 2.6 mV, range = −58.2 to −83.3 mV; spontaneous = −68.4 ± 2.8 mV, range = −62.7 to −71.4 mV). When the membrane of three of the quiescent neurons was depolarized to approximately −55 mV, one of these exhibited spontaneous spike discharge. There were no other apparent differences in neuronal characteristics between spontaneously active and quiescent neurons that were measured.
Fig. 2.

Intracellular recordings from five different ventral pallidal neurons demonstrating typical responses to subthalamic nucleus (STN) stimulation. In Aand B, the resting membrane potential was −80 mV, and current was injected through the intracellular microelectrode to depolarize the membrane potential to the value indicated on theleft side of each trace. A, STN stimulation (1 Hz, 1.0 mA) evoked an EPSP (onset latency = 14.2 msec) when the membrane potential was −80 mV. The EPSP resulted in a spike when the cell was depolarized to −75 mV, and multiple spiking occurred with more positive potentials. B, In another ventral pallidal neuron, the EPSP (latency = 4.3 ± 0.6 msec) evoked by STN stimulation (1 Hz, 1.0 mA) was followed by an IPSP when this cell was depolarized. With further depolarization, a spike was generated during the EPSP, and the duration and amplitude of the IPSP were enhanced. C, This ventral pallidal neuron was depolarized to −65 mV. When the STN was stimulated with 0.7 mA (1 Hz), an EPSP was evoked (left trace). When the stimulation current for the STN was increased to 1.0 mA (stimulus artifacts are identified byarrows), an action potential was generated during the EPSP (middle and right traces). The mean onset of this spike was 2.7 ± 0.7 msec, but because it was riding on an EPSP and exhibited variable latencies with repeated stimulus presentations (compare the middle and right traces), it likely was mediated orthodromically.D, Stimulation of the STN at higher frequencies (4 Hz, 0.8 mA; 4 consecutive traces overlaid) evoked EPSPs in this ventral pallidal neuron that had a relatively consistent latency (latency = 4.2 ± 0.1 msec), and EPSP failures were not observed.E, With increasing STN stimulus strength (1 Hz, 0.4, 0.6, 0.8, and 1.0 mA), the EPSP (latency = 3.7 ± 0.7 msec) exhibited a linear increase in amplitude. The properties illustrated inD and E are consistent with monosynaptically mediated events.
Table 1.
Intracellularly determined electrophysiological profile of the ventral pallidal neurons that responded to subthalamic nucleus stimulation
| Number of neurons | Mean ± SEM | Range | |
|---|---|---|---|
| Total tested | 14 | ||
| Spontaneously firing | 3 /14 (21%) | ||
| Exhibiting evoked EPSPS | 12 /14 (86%) | ||
| Resting membrane potential (mV) | −71.0 ± 2.1 | −58.2 to −83.3 | |
| Input resistance (MΩ) | 48.9 ± 7.8 | 33.5 to 65.6 | |
| EPSP latency (msec) | 8.7 ± 1.6 | 2.2 to 16.7 | |
| EPSP duration (msec) | 34.4 ± 7.3 | 9.0 to 85.7 | |
| EPSP amplitude (mV) | 8.9 ± 1.2 | 2.5 to 17.3 | |
| Exhibiting evoked spikes at RMP | 5 /14 (36%) | ||
| Spike latency (msec) | 21.1 ± 4.3 | 2.7 to 31.5 |
Extracellular recordings
Electrophysiological characteristics were assessed for two sets of extracellularly recorded spontaneously firing VP neurons: randomly encountered neurons and neurons selected for responding to STN stimulation with an evoked excitatory response. No differences in the action potential or firing characteristics (listed below) were found between the groups of neurons recorded using each protocol (Student'st test); thus, these data were pooled (n = 109 cells used for this analysis; 56 randomly sampled neurons + 53 that were sensitive to STN stimulation). The action potentials of these 109 neurons exhibited a peak-to-peak amplitude of 274.0 ± 15.1 μV and a duration of 1.2 ± 0.03 msec. Biphasic action potentials were observed in 85% of the cells recorded (93 of 109), and 66% (72 of 109) of action potentials had an initial negative component. Triphasic action potentials were observed in 15% (16 of 109) of neurons, and these typically exhibited an initially positive waveform. These characteristics were similar to those of our previous reports of VP recordings (Chrobak and Napier, 1993; Maslowski-Cobuzzi and Napier, 1994; Mitrovic and Napier, 1998).
VP neurons demonstrated a firing rate of 14.4 ± 0.8 spikes per second, and the frequency of encountering a spiking neuron was 1.0 ± 0.1 cells per track (n = 349 tracks; not all encountered neurons were used for further analysis). Two distinct firing patterns were quantified by comparing the ratio of the mean to the mode ISI. Of the 34 STN-sensitive neurons evaluated, 41% (14 of 34) fired with a fairly uniform pattern characterized by a narrowly distributed ISI histogram and a mean/mode ratio of 0.69 ± 0.03, whereas 59% (20 of 34) exhibited an irregular spike discharge pattern with a widely distributed ISI histogram and a mean/mode ratio of 0.36 ± 0.04 (t = 6.10;p < 0.01). The regularly firing neurons discharged at a frequency of 20.3 ± 1.7 spikes per second, and the activity of irregularly firing neurons was 9.5 ± 1.5 spikes per second (t = 4.64; p < 0.01). None of the other electrophysiological properties measured differed between the two groups (i.e., action potential waveform, location within the VP, sensitivity to EAA, etc.).
STN-evoked responses
Intracellular recordings
Intracellular recordings of VP responses to STN stimulation were used to determine the influence of the electrophysiological state of the recorded cell on the evoked response profile. Of the 14 VP neurons tested, 12 responded to STN stimulation with an EPSP (Table 1). The remaining two cells were unresponsive. The EPSP amplitude in the spontaneously discharging neurons (13.1 ± 2.1 mV, range = 9.0 to 17.3 mV; n = 3) was nearly twice that evoked in quiescent neurons (6.8 ± 0.9 mV, range = 2.5 to 10.9 mV;n = 9; t = 3.16; p < 0.01). In contrast, the onset latency of the EPSPs did not differ between quiescent and spontaneously firing neurons (spontaneous = 13.8 ± 1.7 msec, range = 10.8 to 16.7 msec; quiescent = 7.1 ± 1.8 msec, range = 2.2 to 15.4 msec; NS). At RMP, 42% (5 of 12) of the STN-sensitive cells responded with evoked EPSPs only (Fig. 2), 42% (5 of 12) responded with evoked EPSPs that triggered spike discharge, and 17% (2 of 12) of the cells exhibited an EPSP–IPSP sequence. The neurons that responded at RMP with evoked spikes consisted of 33% (2 of 3) of spontaneously firing neurons and 33% (3 of 9) of the quiescent neurons. The cells that responded with subthreshold EPSPs (58%; 7 of 12) had an average RMP of −71.9 ± 2.6 mV (range = −58.2 to −83.3 mV), and the neurons that responded with EPSPs that triggered spike discharge (5 of 12) had an RMP of −68.4 ± 2.8 mV (range = −62.7 to −71.4 mV; NS). Because the onset latency of the EPSPs (EPSP only = 6.0 ± 1.7 msec, range = 2.2 to 11.9 msec; EPSP with spiking = 10.7 ± 2.8 msec, range = 3.4 to 16.7 msec; NS) and the amplitude of the evoked EPSPs (EPSP only = 7.5 ± 1.2 mV, range = 2.5 to 10.9 mV; EPSP/spike = 16.2 ± 3.0 mV, range = 3.8 to 26 mV; NS) had overlapping values, these were not likely to represent excitations derived from different sources.
To directly examine the impact of membrane potential on the evoked response, the membrane of six VP neurons (three exhibiting evoked spikes and three exhibiting only subthreshold EPSPs) was progressively depolarized while activating the STN. On depolarization, all six neurons exhibited evoked spike discharge after STN stimulation (Fig. 2A,B). The onset latency of the evoked spikes often decreased with increasing depolarization (data not shown in Fig. 2), such that at a membrane potential of −67.2 ± 2.6 mV, spike latency was 24.2 ± 2.2 msec (range = 18.0–32.6 msec), but at a membrane potential of −56.6 ± 1.0 mV, the latency was 14.2 ± 2.3 msec (range = 7.3 to 23.6 msec; t = 4.28;p < 0.01 for latency comparisons). Thus, depolarizing the membrane by ∼10 mV shortened the evoked spike latency by 10.0 ± 2.3 msec.
The nature of the excitatory responses was consistent with an orthodromic effect. As shown in Figure 2C, even when spikes occurred with very short onset latency, they always were riding on an EPSP. Additionally, the spike latency was not constant. These features would not be present if the spikes were evoked antidromically. The response also was likely to be monosynaptically mediated because STN stimulation at slightly higher frequencies (e.g., 4 Hz) (Fig.2D) consistently evoked EPSPs. If multiple synapses were involved, EPSP failure would be expected to occur. Moreover, the EPSP amplitude was proportionally enhanced with increasing STN stimulus strength (Fig. 2E), a phenomenon also consistent with a monosynaptically mediated response.
Extracellular recordings
VP neurons (120) were examined extracellularly for sensitivity to STN activation using two different sampling paradigms. In the first paradigm, randomly encountered neurons (n = 59) were analyzed to indicate the proportion of spontaneously firing VP cells that were sensitive to STN stimulation. (The stimulation electrode tip placements are shown on Fig. 1B.) Of the 59 encountered neurons, 95% (56 of 59) were sensitive to activation of the STN. Stimulation evoked 84 statistically determined response components in the 56 responding neurons (Fig.3); 31% of these components (26 of 84) were inhibitory, and 69% (58 of 84) were excitatory. The minimum current necessary to evoke each statistically significant component of the response (defined as threshold current) was determined, and this current level was used to delineate the various parameters of the evoked response profile. The inhibitory responses demonstrated a skewed unimodal distribution of onset latencies: 38% (10 of 26) had onset latencies that clustered at 4–7.9 msec bins, with a peak in the 4–5.9 msec bin. The remaining inhibitory responses were uniformly distributed between 8 and 21.9 msec. Onset latencies of the excitatory responses to STN stimulation also demonstrated a skewed unimodal distribution. Forty-eight percent (28 of 58) of the excitatory responses occurred between 4 and 7.9 msec with a peak in the 4–5.9 msec bin. After the peak, the frequency of occurrence of longer latency responses dropped off sharply, with 29% (17 of 58) of the excitatory responses being evenly distributed between 8 and 21.9 msec. The onset of the remaining excitatory responses (22%; 13 of 58) occurred sporadically. To allow a more precise examination of the potential role of the STN projection in these excitatory responses, they were grouped based on the distribution of onset latencies. The excitatory responses occurring between 4 and 7.9 msec were categorized into short-latency excitations (SLEs), those occurring in the bins ranging from 8 to 21.9 msec were termed intermediate-latency excitations (ILEs), and those beginning 22 msec or longer were termed long-latency excitations (LLEs).
Fig. 3.
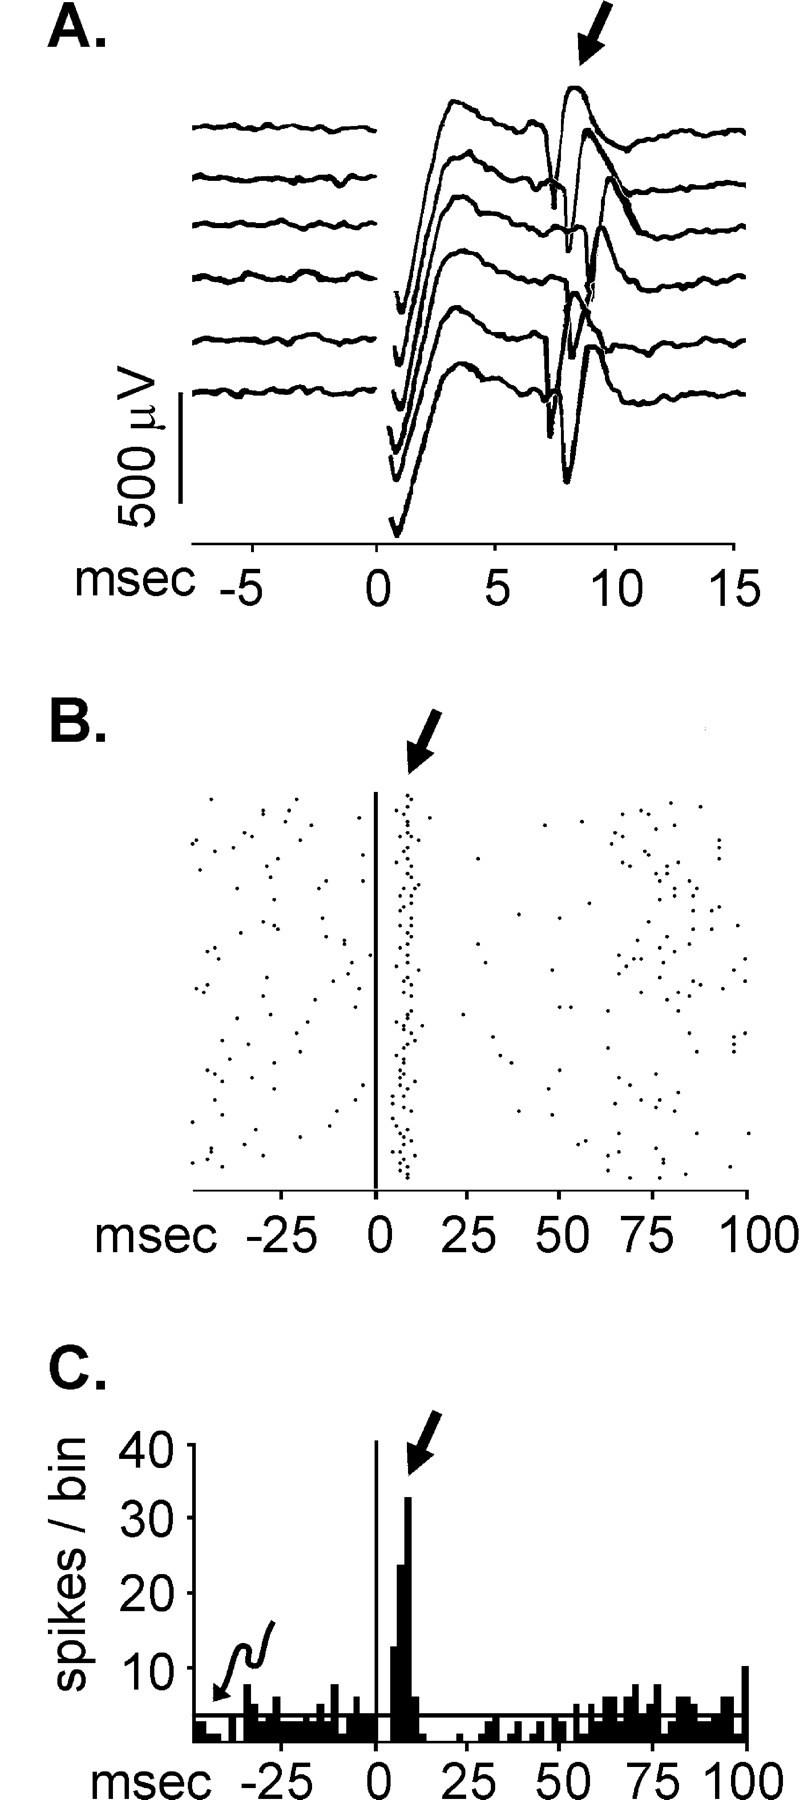
Extracellularly recorded responses evoked in two ventral pallidal neurons after electrical activation (1 mA) of the subthalamic nucleus. The stimulus artifacts are shown at time 0.A, Oscilloscope traces of a representative recording with the evoked spikes (straight arrow) occurring between 6 and 8 msec after the stimulus. B, A peristimulus time raster display of responses from a different cell to 128 epochs of single stimulus pulses delivered to the subthalamic nucleus once per second. Each dot represents the occurrence of a spike. The evoked excitatory response can be seen under the straight arrow. This raster display illustrates the consistent finding that subthalamic-evoked ventral pallidal responses remain stable across all 128 epochs. C, A peristimulus time histogram of the same data shown in B. The peristimulus time histogram contains the accumulation of action potentials at each 2 msec time interval relative to the stimulus artifact for 128 epochs (shown on the raster display above). Thesolid horizontal line (curved arrow) illustrates the mean number of prestimulus spikes per bin (baseline). An evoked response was considered to have occurred if the number of spikes in three consecutive bins was 1.65 SDs above or below baseline. On the basis of this criterion, the excitatory response (straight arrow) was determined to occur from 4 to 12 msec, and 55 spikes were evoked during this time period. The apparent inhibition did not meet our criterion for a significant effect.
The number of instances in which the various response components occurred after a 0.6 mA STN stimulation was determined (this level was the closest current tested to the statistically determined threshold current). Some neurons responded with single responses and some responded with complex responses (e.g., SLE followed by an LLE response). Of the 37 randomly encountered neurons that were sensitive to STN stimulation at 0.6 mA, 46% (17 of 37) demonstrated SLE responses, and 71% of these (12 of 17) occurred in isolation (i.e., without additional components). Of the ILE responses, which occurred in 11% (8 of 37) of the tested neurons, 63% (5 of 8) occurred alone. An LLE response was evoked in 11% of neurons (4 of 37), and this component occurred alone in 75% (3 of 4) of these. All of the inhibitory responses, which were obtained in 38% (14 of 37) of the cells tested, occurred alone. In all neurons that demonstrated a response consisting of more than one component (n = 5), one of the components was an SLE response.
Because the projection from the STN to the VP is hypothesized to be monosynaptic and uses EAA transmission, in the second sampling paradigm we focused our analyses only on those neurons that demonstrated an SLE or an ILE response, or both. Of the 61 neurons recorded with this paradigm, 22 were tested with varying STN stimulation currents to determine threshold, Emax, and the current that produced ∼70% of Emax(ECur70). The remaining 39 neurons were tested only with the approximatedECur70 (and with EAA ligands). The action potential and firing profiles of the 22 neurons selected for further analysis because of their demonstration of SLE or ILE responses to threshold STN stimulation did not differ from the SLE and ILE responses found by the random sampling paradigm (n = 56 responding neurons of 59 tested), and the data were pooled as presented in Table 2 and below. For both SLE and ILE components, the response magnitude directly increased with increasing stimulation magnitude until Emax was reached (Figs.4, 5). The resulting stimulation–response curve was steep, characteristic of a small “window” between threshold and maximal effects. This conclusion was substantiated by evaluating the ejection current–response relationship with threshold standardized to zero, and with responses determined for each 0.2 mA ejection current interval tested above threshold (data not shown). The shapes of these curves were similar to those presented in Figure 5, withEmax attained by 0.2–0.4 mA above the threshold. It appears, therefore, that when the STN is sufficiently engaged to initiate a response, it evokes a near-maximal stimulation of VP neurons. In addition, the similarity in the stimulation–response relationship between SLE and ILE allows for the possibility that the driving mechanisms underlying SLE and ILE responses are similar.
Table 2.
Extracellularly determined responses of ventral pallidal neurons sensitive to subthalamic nucleus stimulation
| Response component2-a | ||||
|---|---|---|---|---|
| Short-latency excitation (n = 43) | Intermediate-latency excitation (n = 24) | Long-latency excitation (n = 13) | Inhibition (n = 27) | |
| STN stimulation threshold current (mA) | 0.5 ± 0.0 | 0.5 ± 0.0 | 0.6 ± 0.1 | 0.5 ± 0.1 |
| Response onset latency (msec) | 5.6 ± 0.1 | 14.1 ± 0.8 | 34.5 ± 4.5 | 10.8 ± 1.6 |
| Response duration (msec) | 18.7 ± 4.6 | 18.3 ± 2.4 | 17.7 ± 4.0 | 22.6 ± 3.0 |
| Response magnitude (number of action potentials) | 80 ± 8 | 107 ± 19 | 50 ± 12 | 20 ± 6 |
Data are presented as mean ± SEM.
A total of 78 neurons were evaluated at threshold stimulation current. This included 56 neurons randomly sampled and 22 neurons selected for responding to STN stimulation with an evoked excitatory response. Responses are categorized as either excitatory or inhibitory and further categorized on the basis of onset latency. Neurons often demonstrated complex response profiles with two or more response components so the total number of components (presented as the n in each column) is greater than the total number of neurons tested.
Fig. 4.

The relationship between increasing the subthalamic nucleus stimulation current magnitude and the response profile evoked in a ventral pallidal neuron.A–D, Peristimulus time histograms taken from the same neuron illustrating 128 stimulation epochs applied once per sec, with extracellular responses accumulated in 2 msec bins.B–D, scales are the same as those forA. The magnitude of the subthalamic stimulation current is indicated on the stimulus artifact at time 0 on each histogram. In this representative neuron, increasing subthalamic stimulation currents increased the magnitude of the response (indicated byarrows), and 0.8 mA introduced a second component, a long-latency inhibition. A horizontal open bar indicates the onset and offset of the inhibitory response.
Fig. 5.

The magnitude of the excitatory responses of ventral pallidal neurons increased as the magnitude of the subthalamic stimulation current was increased. Neurons that were monitored during at least three different stimulation current intensities in the range from 0.05 to 1.2 mA were used for this comparison. For each data point in the short latency excitation (SLE) curve (●), there were from 3 to 30 neurons represented (for a total of 31), and 3 to 22 neurons for each data point on the intermediate latency excitation curve (ILE, for a total of 23; ■). The parameters of the response (onset and duration) were determined at a threshold current (defined in Materials and Methods), and these parameters were used to quantify the magnitude (i.e., cT; see Materials and Methods) of the excitatory response obtained with the other stimulation current levels. The duration, as determined at threshold, also was used to quantify baseline. The total number of spikes occurring in the same time frame in the prestimulus period for neurons showing SLE responses (32 ± 5 spikes; mean illustrated by a dashed horizontal line) and ILE responses (44 ± 10 spikes; solid horizontal line) was not significantly different. Increasing the subthalamic stimulation current enhanced spiking frequency in the evoked response component until a maximal effect (Emax) was reached. The SLE responses demonstrated an Emax of ∼100 spikes, and the ILE responses had an Emax of 120 spikes as derived from the peak of the third order polynomial curve fitted to the data. A Student's t test of the response obtained with 0.8 mA was not significantly different. These comparisons indicate that the Emax values for the SLE and ILE curves were similar.
Increasing stimulation magnitude also altered the latency of some of the evoked response components. The latency of the ILE responses decreased by 20% with a 0.2 mA current above threshold, but did not decrease further with additional increases in current. This shift in latency moved some ILE-grouped cells to the range used to categorize SLE responses (4–7.9 msec). In contrast, the onset of SLE responses did not vary with increased STN stimulation current above threshold. These data suggest that the SLE and ILE response categories represent two segments of a continuous distribution of onset latencies under 22 msec.
Because multiple sampling was necessary for these evaluations, it was important to verify that repeated STN stimulation did not influence the ability of VP neurons to produce evoked responses. Demonstrating this, paired t test comparisons of the first and last trial for the second highest current tested in this protocol (1.0 mA;n = 13 neurons) revealed no significant differences in the total number of action potentials in the excitatory (SLE + ILE) response (82 ± 10 vs 78 ± 13 spikes; NS) or in the response latency (7.2 ± 0.7 vs 7.2 ± 0.8 msec; NS) or duration (11.5 ± 1.8 vs 10.6 ± 1.7 msec; NS).
To substantiate the physiological validity of these observations, the VP-evoked response parameters defined in the data analysis above (e.g., stimulation threshold, SLE, ILE) were used to indicate the “discreteness” of the STN stimulation protocol. To do so, VP responses obtained by stimulating brain areas that are near to the STN were evaluated. Because the conductive zones of the stimulation electrode were in a vertical configuration, we separated this comparison into two categories: those electrode tip locations that were ventral to the STN (where the electrode penetrated the STN) and those electrode tip sites that were located in other areas around the STN (such that the STN was not in physical contact with the electrode). The first comparison determined that stimulation electrode tip placements ventral to the STN [i.e., in the ventral medial internal capsule (vmIC)] likely allowed for activation of the STN. Comparing STN and vmIC tip placements, the portion of VP cells exhibiting an SLE was similar for both sites (29 of 49 for the STN and 14 of 29 for the vmIC; χ2; NS). Moreover, the response profiles (e.g., threshold current to evoke an SLE, and the latency, duration, and magnitude of the SLE) were not different (Student's ttest; NS). To validate that activation of IC capsule fibers per se was not the primary contributor to the evoked SLE, the responses of the 29 neurons evaluated with vmIC stimulation electrode tip placements were compared with those obtained from IC placement sites that were anterior to the STN (aIC) (n = 10 cells). Stimulation of the aIC evoked eight responses in six sensitive neurons but failed to evoke an SLE (number of SLE vs all other responses for aIC vs vmIC tip placements; χ2 = 4.6; p< 0.05). In sum, these comparisons suggested that the SLE evoked in the VP by current applied to a stimulation electrode with a tip that extended into the vmIC largely reflected activation of the STN and not activation of fibers passing through the IC. Thus (as shown on Fig.1B), data obtained from vmIC placements were pooled with those from STN placements (and collectively are referred to in this paper as activating the STN).
Two additional protocols were used to ascertain the effects of stimulating brain locales that were situated at least 500 μm distal to the STN (i.e., where the STN was not penetrated by the electrode). In one set of comparisons (n = 9 neurons), a VP neuron was isolated, and the response to a constant current level was evaluated for stimulating electrode tip placements dorsal to the STN and after relocating the electrode within the STN. As shown in Figure 6, the SLE response was evoked only when the electrode was moved into the STN (current ranged from 0.8 to 1.0 mA). In a second approach, stationary stimulating electrodes were located in several regions around the STN, and the probability of evoking an excitatory response in the VP was ascertained. Regions that were stimulated included the zona inserta (evaluated in 21 VP neurons), optic tract (n = 10 neurons), aIC (n = 5 neurons), and entopeduncular nucleus region of the IC (n = 5 neurons; neurons in these latter two regions were the ones compared with the vmIC, as described in the previous paragraph). Of the VP neurons tested, 49% (19 of 41) were sensitive to brain stimulation, and 25 separate response components were isolated (some evoked responses consisted of multiple components). However, only one SLE response was obtained (i.e., 4%; 1 of 25; compared with SLE responses obtained from STN stimulation; χ2; NS) and this occurred with zona inserta stimulation of a relatively higher current (i.e., 1.2 mA). Forty-eight percent (12 of 25) of the responses components were ILEs, with a mean latency of 12.8 ± 1.3 msec, but the current required to achieve this effect was significantly greater than that which produced an ILE response after STN activation (0.74 ± 0.1 vs 0.50 ± 0.0 mA, respectively; t = 2.62; p < 0.05). These data support the idea that stimulation of the STN itself is largely responsible for the evoked responses measured in this experiment.
Fig. 6.

Illustration of ventral pallidal responses to stimulating sites in or near the subthalamic nucleus (STN). Three different ventral pallidal neurons (I, II, III) were continuously monitored while the stimulating electrode was moved to activate various sites. The stimulating electrode tip locations for the corresponding peristimulus time histograms (A–G) are illustrated in thebottom right diagram of the STN. Thearrow indicates the stimulus artifact at time 0.I. When 1.0 mA is applied to a stimulating electrode located 500 μm above the STN (A, in the zona inserta), no response is seen in this ventral pallidal neuron. When the electrode tip is lowered into the STN (B) or just below the STN (C, in the ventral medial internal capsule, where the dorsal aspect of the conducting portion of the electrode remains in the STN), 1.0 mA evokes a short-latency excitatory response in the same neuron. II. This ventral pallidal neuron fails to demonstrate an excitatory response (at 0.8 mA) when the stimulating electrode is located 500 μm above the STN (D, in the zona inserta) but demonstrates a short-latency excitatory response (E) when the electrode is moved into the STN.III. A third ventral pallidal neuron fails to demonstrate a significant response (at 1.0 mA) when the stimulating electrode is located 800 μm above the STN (F, in the zona inserta) but exhibits a robust short-latency excitatory response (G) when the electrode is moved into the STN.
Anatomical studies demonstrate that the projection from the STN to the VP arises predominantly from the medial aspect of the STN (Groenewegen and Berendse, 1990). Given the apparent discrete nature of the stimulation protocol, we then ascertained whether our electrophysiological assessments were consistent with this anatomical topography. We found that neurons which demonstrated an SLE response to medial STN stimulation (n = 33) had a shorter onset at threshold currents (5.3 ± 0.1 msec) than neurons that responded to lateral STN stimulation (6.4 ± 0.3 msec; n = 10; t = 3.79; p < 0.01). However, the other electrophysiological properties assessed (i.e., action potential waveform, firing frequency, etc.) did not differ significantly for neurons that were evoked by stimulation of the medial versus the lateral STN.
Comparisons of the evoked responses obtained with intracellular and extracellular recording techniques
Several comparisons indicate that the same underlying events were being assessed by the intracellular and extracellular recording paradigms. After electrical activation of the STN, 86% of the intracellularly recorded VP neurons demonstrated an EPSP, and extracellularly recorded evoked excitations (SLE or ILE) occurred in 87% of the neurons tested. The onset of these responses was similar; intracellularly measured EPSP latency was 8.7 ± 1.6 msec, whereas spiking onset for combined SLE and ILE extracellular recordings also was 8.7 ± 0.6 msec (NS). Moreover, the duration of the EPSP (32.3 ± 7.8 msec) and the duration of the extracellularly monitored evoked excitatory responses (18.4 ± 3.0 msec) parallel the qualitative observation that spiking tended to ride on the plateau of the EPSP.
Pharmacology of EAA-induced responses in VP
Effects of EAA agonists and antagonists on spontaneous activity
The responsiveness to the EAA receptor subtype-selective agonists AMPA and NMDA was evaluated in 40 VP neurons. Eighty-six percent (35 of 40) exhibited rate enhancements (of >20%) on application of AMPA, and 95% (38 of 40) exhibited increased firing in response to NMDA (Fig.7). The agonists did not decrease firing. The magnitude of the agonist-induced response was directly proportional to the level of the microiontophoretic ejection current until the maximal firing rate for a given neuron was elicited. Thereafter, the measured firing rate decreased because of an apparent depolarization block (i.e., decreased spike amplitude, increased spike duration, coupled with a decrease in firing rate; data not shown) (Grace and Bunney, 1986). When both drugs were tested on the same neuron, all neurons demonstrated sensitivity to at least one of the two agonists: 82% (31 of 38) were sensitive to both, 5% (2 of 38) were sensitive only to AMPA, and 13% (5 of 38) were sensitive only to NMDA. The AMPA-induced rate increases were attenuated by CNQX in 81% of the cells tested (22 of 27); NMDA was antagonized by AP-5 in 95% (21 of 22) of the cells tested (for example, see Fig. 7).
Fig. 7.
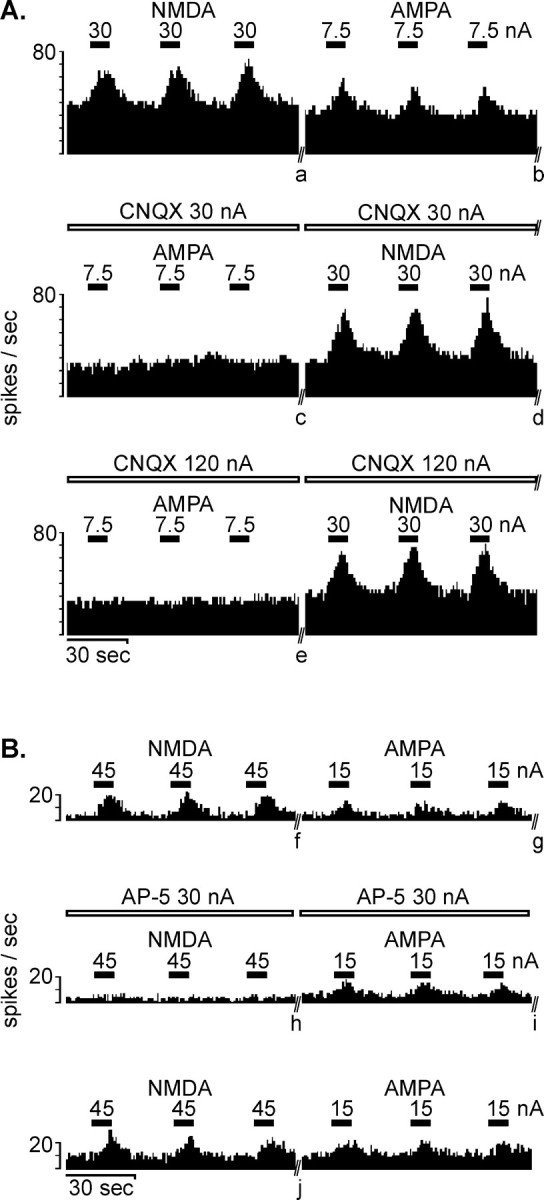
Real-time rate histograms of extracellular recordings taken from ventral pallidal neurons demonstrating the enhanced firing seen with microiontophoretically applied excitatory amino acid agonists and the receptor subtype selectivity of the excitatory amino acid antagonists.The horizontal bars above each graph illustrate when an ejection current of the magnitude indicated was used to expel agonists NMDA and AMPA (solid bars) and antagonists CNQX and AP-5 (open bars). A, Both AMPA and NMDA readily enhanced firing. Co-iontophoresis of CNQX attenuated the excitatory effects of AMPA but not NMDA. Antagonist selectivity is seen even at an ejection current of 120 nA (the highest current used in this study).B, A second ventral pallidal neuron that also was sensitive to the excitatory effects of AMPA and NMDA. Co-iontophoresis of AP-5 attenuated the excitatory effect of NMDA but not AMPA. Recovery from the effects of the antagonist is also shown in this example. Stable periods of the recording were excised (//) to conserve space and are marked with letters as follows:a = 2.2 min, b = 1.3 min,c = 6.3 min, d = 1.3 min,e = 1.5 min, f = 3.6 min,g = 13.0 min, h = 3.0 min,i = 47 min, j = 1.7 min.
All four EAA ligands were evaluated in 13 agonist-sensitive neurons; consequently, the data obtained by these comparisons were analyzed in greater detail. At the ejection current levels that were used for co-iontophoretic application with the antagonists, AMPA (21.0 ± 4.5 nA) enhanced cell firing from 11.4 ± 1.9 to 23.5 ± 2.2 spikes per second (t = 9.44; p < 0.001), and NMDA (30.0 ± 3.6 nA) induced a change from 11.7 ± 1.9 to 22.3 ± 2.5 spikes per second (t = 8.42;p < 0.001). When evaluated at ejection currents used for co-iontophoretic application with the agonists, CNQX (32.0 ± 4.6 nA) did not alter neuronal activity (rate changed from 11.5 ± 1.6 to 11.7 ± 1.4 spikes per second; NS). In contrast, AP-5 (25 ± 2.3 nA) decreased spontaneous firing from 11.7 ± 1.9 to 7.4 ± 1.2 spikes per second (t = 4.91;p < 0.001), presumably by blocking a tonically firing EAA input that preferentially activated NMDA receptors. Thus, to allow an accurate assessment of the ability and selectivity of an antagonist to attenuate the agonist-induced effects, this comparison was made taking into account antagonist-induced changes in baseline (see Materials and Methods). At the ejection currents listed above for the 13 tested neurons, CNQX decreased by 35.5 ± 3.9% the enhanced firing evoked by AMPA microiontophoresis (t = 9.02;p < 0.001) but only produced a 5.9 ± 3.7% shift in NMDA-induced responses (NS). When individual neuronal responses were categorized using the criterion of a minimum 20% decrease in agonist-induced response, CNQX attenuated AMPA-induced enhancements for 12 of 13 cells and the response of only a single cell to NMDA. Demonstrating a similar receptor subtype selectivity, AP-5 attenuated the NMDA-induced excitations by 44.6 ± 4.0% (t = 11.29; p < 0.001), whereas the AMPA influences showed a slight potentiation trend (19.4 ± 12.8%; NS). Categorization revealed that AP-5 antagonized NMDA-induced effects in all 13 cells tested, but only a single neuron showed an altered response to AMPA. As a collective, these results demonstrate that at the ejection currents used, the agonists AMPA and NMDA increased the neuronal firing rate by selectively activating their corresponding EAA receptor subtype, and that the antagonists CNQX and AP-5 selectively blocked the non-NMDA and NMDA receptors, respectively.
Pharmacology of responses evoked by STN stimulation
To determine whether the exogenously applied EAA mimicked the response evoked by STN stimulation, VP neurons that demonstrated an SLE or ILE response, or both, to STN stimulation were tested with AMPA and NMDA. Ninety-four percent (32 of 34) of the VP neurons responding to STN stimulation demonstrated rate increases after application of AMPA, and 94% (32 of 34) demonstrated rate increases after NMDA application. All cells demonstrated rate increases after iontophoretic application of at least one EAA agonist. These results reveal that VP neurons demonstrating rate enhancements to STN stimulation (presumably because of a release of endogenous EAA) also increase firing to the exogenously applied EAA agonists NMDA and AMPA.
To more directly assess whether the excitatory responses evoked by STN stimulation resulted from activation of NMDA or non-NMDA receptors, the ability of AP-5 or CNQX to attenuate STN-evoked responses was determined (Fig. 8). To do so, the STN stimulation current that produced a 70–90% of maximum increase in firing rate (ECur70 toECur90) was used. The antagonists were ejected with a current level that attenuated the rate increases to their homotypic agonist but did not alter responses to the heterotypic EAA receptor agonist; most often, this was 30 nA. No differences in the ability of the EAA antagonists to attenuate SLE or ILE responses to STN stimulation were observed; thus the data were pooled. The excitatory responses were attenuated by application of AP-5 in 67% (12 of 18) of the neurons tested, and CNQX attenuated responding in 52% (12 of 23) (Fig. 9). Eighteen neurons were tested with both AP-5 and CNQX. Both antagonists were able to attenuate the excitatory response in 33% (6 of 18), and 78% (14 of 18) demonstrated excitatory responses that were attenuated by at least one of the antagonists; only AP-5 was found to be effective in 27% (5 of 18), whereas only CNQX was effective in 17% (3 of 18). Taken together, these data indicate that a large proportion of VP neurons receives an excitatory input from the STN, and that this input engages both NMDA and non-NMDA receptors.
Fig. 9.

Excitatory amino acid antagonists attenuated the excitatory response of ventral pallidal neurons to stimulation of the subthalamic nucleus. Data include both short and intermediate latency categories. Results presented in the control columns provide the “corrected value” (cT) calculated for excitatory evoked responses obtained when no antagonist was applied (see Materials and Methods and Fig. 8 legend). The results presented in the antagonist columns were obtained using an ejection current that selectively blocked the homotypic receptor (see Fig. 7).A, Effects of the NMDA antagonist AP-5 (15–120 nA), tested in 18 neurons. AP-5 significantly attenuated the evoked excitatory response from a mean of 97 ± 15 to 68 ± 10 spikes (paired t test; t = 4.13; *p < 0.01). B, Effects of the AMPA antagonist CNQX (15–120 nA), tested in 23 neurons. CNQX significantly attenuated the response from a mean of 98 ± 14 to 71 ± 13 spikes (paired t test; t = 3.93; *p < 0.01).
DISCUSSION
Physiological properties of the STN–VP projection
This study demonstrated that STN stimulation induces a robust excitatory response in VP neurons. We provided convergent evidence that the evoked excitations were orthodromic (transynaptically mediated): (1) the onset latency was relatively varied (antidromic spikes have strictly constant onset latencies), (2) receptor-specific antagonists attenuated the response (antidromic spikes are unaffected by neurotransmitter receptor antagonists), and (3) EPSPs preceded the evoked orthodromic spikes (antidromic spikes occur without EPSPs). Moreover, antidromic activation of globus pallidus neurons by STN stimulation is reported to occur with an onset latency of 1 msec (Kita and Kitai, 1991), and repeatable evoked spiking was not observed at this latency in the intracellular recordings of VP neurons in the present study.
The latencies of the presumed orthodromically evoked spikes ranged between 4–7.9 msec (termed SLE) and 8–21.9 msec (termed ILE). Assuming a 1–2 msec synaptic delay (Sabatini and Regehr, 1999), a tighter latency distribution might be anticipated for a monosynaptic, myelinated input from the STN to VP neurons that uses ionotropic EAA receptors. Thus, to further characterize these two categories, we compared the SLE and ILE responses using various different electrophysiological parameters. We demonstrated that the latency difference is not likely to be caused by differences in stimulation parameters or by recording distinct subclasses of VP neurons (i.e., neuronal spontaneous firing rate, firing pattern, or action potential characteristics did not delineate subpopulations). In contrast, intracellular evaluations demonstrated that the onset latency of the evoked spike decreased as the membrane was depolarized, although the EPSP onset latency was essentially constant. Thus, the SLE and ILE categories of the extracellularly determined evoked responses likely reflect the depolarization state of the neuronal membrane.
In addition to STN-evoked excitatory responses, we also extracellularly recorded inhibitory responses that occurred within the time frame of a single synapse (no short latency evoked IPSPs recorded intracellularly, for only six neurons were depolarized sufficiently to see IPSP responses). Although an inhibitory response seems counter to the proposal of an STN excitatory projection, others have reported that STN stimulation can evoke pallidal IPSPs with a fast onset (Kita and Kitai, 1991). Because many pallidal neurons are GABAergic, an obvious explanation for quick onset inhibitions is that pallidal to STN neurons were antidromically activated upon STN stimulation, and GABA was released from collaterals of neighboring neurons to hyperpolarize the recorded cell.
EAA receptor subtypes involved in STN-evoked responses
The involvement of EAA receptors in the STN-evoked responses was revealed by demonstrating that (1) the spontaneous firing rate was increased by either NMDA or AMPA in all of the STN-excited neurons tested, and (2) EAA antagonists (using ejection currents that were shown to be receptor subtype selective) attenuated the majority of the tested STN-evoked rate increases. It was interesting that although all of the STN-sensitive neurons demonstrated rate increases to EAA agonists, a few STN-evoked excitations remained insensitive to EAA antagonists. Such a response would occur if the STN-evoked response was mediated by a different excitatory transmitter for these cells. However, the very short latency of the response precludes most candidate transmitters (e.g., activation of G-protein-coupled receptors evokes responses with much slower onsets). Alternatively, because the excitations to iontophoretically applied EAA agonists were consistently attenuated, the reason that the antagonists failed to block STN-evoked excitations in some neurons likely represents differences in the morphological location of the receptors influenced by the endogenous transmitter versus exogenous antagonists. Some excitatory inputs terminate on distal VP dendrites (Zaborszky et al., 1991), and the dendritic tree of VP neurons can extend 1 mm from the soma (Pang et al., 1998). Thus, the iontophoretically applied antagonist may not have reached these distal synapses in sufficient concentrations to block the STN-evoked response. Nonetheless, the high portion of VP neurons demonstrating EAA agonist-induced rate enhancement and antagonist-sensitive STN-evoked excitations strongly argues that the STN input has a significant excitatory influence on VP transmission. Because the great majority of VP neurons tested had spontaneous firing that was enhanced by both AMPA and NMDA, and STN-evoked excitations were blocked by both CNQX and AP-5, the results also suggest that a substantial number of VP cells may co-express the NMDA and non-NMDA receptor subtypes.
Afferent regulation of VP neuronal activity
The demonstration that the STN can impact neuronal activity in the VP provides new insight into circuit-mediated mechanisms that regulate the VP and how the VP may integrate basal ganglia and limbic systems. It appears that most VP neurons are influenced by the STN (present study) as well as by EAA inputs from the amygdala and the midbrain dopaminergic projections (Maslowski-Cobuzzi and Napier, 1994; Mitrovic and Napier, 1998). In vivo dopamine iontophoresis is known to modulate both the excitatory effects of glutamate iontophoresis (Johnson and Napier, 1997) and the firing rate enhancements produced in VP neurons by activating the amygdala (Maslowski-Cobuzzi and Napier, 1994). It is likely that the STN input to the VP also is under a modulatory control by dopamine. In vitro studies of VP cells demonstrated that bath applications of dopamine readily depolarize VP neurons (our unpublished observations), and the present study revealed that VP cells must be in a depolarized state to spike after STN stimulation. When recorded in vivo, VP neurons oscillate between depolarization–hyperpolarization states (Lavin and Grace, 1996), and in striatal neurons the excitatory drive from cortical regions is sufficient to evoke action potentials only when the cell is in its depolarized state (O'Donnell and Grace, 1995). Thus, it is possible that dopamine may act to modulate the excitatory effects of STN inputs via its ability to influence the depolarization state of the VP neuron.
It is important to note that afferent influences on VP function are also likely to be modified by the activity-state of the VP neuron. For example, we demonstrated that the STN-evoked EPSP amplitude was markedly larger when evoked in spontaneously firing neurons, although the average membrane potential, input resistance, and EPSP latency were nearly identical to those of silent neurons. These observations indicate that the STN may be positioned to modulate ongoing VP activity, rather than providing an independent drive to these cells.
Functional relevance of the STN projection to the VP
This study demonstrated the robust nature of the STN influence on VP neuronal activity. When considered in the context of the putative function of the VP as a cross-road for limbic and basal ganglia systems, this projection may play a critical role in the integration of motivationally directed motor behaviors. To explore this possibility, it is useful to consider the anatomical interconnections among these systems, and the involvement of the VP in functions attributed to the limbic system (e.g., incentives) and the basal ganglia (e.g., motor behavior). Strategic to the anatomical considerations is the reciprocal nature of the STN excitatory projection to the VP and VP GABAergic projections back to the STN (Groenewegen and Berendse, 1990). Although not yet evaluated electrophysiologically, this anatomy suggests an autoregulatory circuit whereby the STN, via connections with the VP, can gate its own output to other basal ganglia structures (e.g., the external globus pallidus and the zona reticulata of the substantia nigra). This circuit may be a means by which limbic regions influence neuronal systems involved in the execution of motor behaviors. The finding that the STN exerts greater excitation on VP neurons that are already tonically active suggests a mechanism by which the VP could contribute to the strengthening of this autoregulatory function. Thus, limbic regions like the VP may fine-tune neuronal systems involved in the execution of motor behaviors. Animal studies demonstrating the involvement of the VP in motivated actions support this concept. For example, in reinforcement-motivated motor tasks, VP neuronal firing changes when a reward is anticipated and during presentation of a positive reinforcer (Wilson and Rolls, 1990). Aversive stimuli do not elicit the same response, nor is the response obtained when a positive reinforcer is presented out of context of the task (Wilson, 1991). In similar paradigms, neurons recorded from the monkey globus pallidus (Mink and Thach, 1991), striatum (Schultz and Romo, 1992), or STN (Wichmann et al., 1994) fire before or during specific movements. The temporal attributes of the neuronal responses from the VP and basal ganglia structures allow for the possibility that the VP is involved in linking the reward quality or salience of a reinforcer with the execution of appropriate motor skills to acquire the reward.
Footnotes
This work was supported by United States Public Health Service Grant MH11607 to M.S.T. and T.C.N., and the Neuroscience and MD/PhD programs at Loyola University Chicago. We thank Byron Heidenreich and Igor Mitrovic for their contributions to this project.
Correspondence should be addressed to Michael S. Turner, Department of Pharmacology, Building 102, Room 3626, 2160 S. First Avenue, Maywood, IL 60153. E-mail: mturner@luc.edu.
REFERENCES
- 1.Albin RL, Young AB, Penney JB. The functional anatomy of basal ganglia disorders. Trends Neurosci. 1989;12:366–375. doi: 10.1016/0166-2236(89)90074-x. [DOI] [PubMed] [Google Scholar]
- 2.Baunez C, Robbins TW. Bilateral lesions of the subthalamic nucleus induce multiple deficits in an attentional task in rats. Eur J Neurosci. 1997;9:2086–2099. doi: 10.1111/j.1460-9568.1997.tb01376.x. [DOI] [PubMed] [Google Scholar]
- 3.Chrobak JJ, Napier TC. Opioid and GABA modulation of accumbens-evoked ventral pallidal activity. J Neural Trans. 1993;93:123–143. doi: 10.1007/BF01245342. [DOI] [PubMed] [Google Scholar]
- 4.Chrobak JJ, Napier TC, Hanin I, Walsh TJ. The pharmacology of basal forebrain involvement in cognition. Adv Exp Med Biol. 1991;295:383–398. doi: 10.1007/978-1-4757-0145-6_22. [DOI] [PubMed] [Google Scholar]
- 5.Gong W, Justice JB, Jr, Neill D. Dissociation of locomotor and conditioned place preference responses following manipulation of GABA-A and AMPA receptors in ventral pallidum. Prog Neuropsychopharmacol Biol Psychiatry. 1997;21:839–852. doi: 10.1016/s0278-5846(97)00084-5. [DOI] [PubMed] [Google Scholar]
- 6.Grace AA, Bunney BS. Induction of depolarization block in midbrain dopamine neurons by repeated administration of haloperidol: analysis using in vivo intracellular recording. J Pharmacol Exp Ther. 1986;238:1092–1100. [PubMed] [Google Scholar]
- 7.Graybiel AM, Aosaki T, Flaherty AW, Kimura M. The basal ganglia and adaptive motor control. Science. 1994;265:1826–1831. doi: 10.1126/science.8091209. [DOI] [PubMed] [Google Scholar]
- 8.Groenewegen HJ, Berendse HW. Connections of the subthalamic nucleus with ventral striatopallidal parts of the basal ganglia in the rat. J Comp Neurol. 1990;294:607–622. doi: 10.1002/cne.902940408. [DOI] [PubMed] [Google Scholar]
- 9.Guridi J, Obeso JA. The role of the subthalamic nucleus in the origin of hemibalism and Parkinsonism: new surgical perspectives. Adv Neurol. 1997;74:235–247. [PubMed] [Google Scholar]
- 10.Haber SN, Nauta WJH. Ramifications of the globus pallidus in the rat as indicated by patterns of immunohistochemistry. Neuroscience. 1983;9:245–260. doi: 10.1016/0306-4522(83)90291-9. [DOI] [PubMed] [Google Scholar]
- 11.Heimer L, Wilson RD. Santani M, editor. The subcortical projections of the allocortex: similarities in the neural associations of the hippocampus, the piriform cortex, and the neocortex. Golgi Centennial Symposium, Proceedings. 1975. pp. 177–193.
- 12.Heimer L, Alheid GF, Zaborszky L. Basal ganglia. In: Paxinos G, editor. The rat nervous system. 1. Forebrain and midbrain. Academic; Kensington, NSW, Australia: 1985. pp. 37–86. [Google Scholar]
- 13.Johnson PI, Napier TC. GABA- and glutamate-evoked responses in the rat ventral pallidum are modulated by dopamine. Eur J Neurosci. 1997;9:1397–1406. doi: 10.1111/j.1460-9568.1997.tb01494.x. [DOI] [PubMed] [Google Scholar]
- 14.Kita H, Kitai ST. Efferent projections of the subthalamic nucleus in the rat: light and electron microscopic analysis with the PHA-L method. J Comp Neurol. 1987;260:435–452. doi: 10.1002/cne.902600309. [DOI] [PubMed] [Google Scholar]
- 15.Kita H, Kitai ST. Intracellular study of rat globus pallidus neurons: membrane properties and responses to neostriatal, subthalamic and nigral stimulation. Brain Res. 1991;564:296–305. doi: 10.1016/0006-8993(91)91466-e. [DOI] [PubMed] [Google Scholar]
- 16.Lamour Y, Dutar P, Rascol O, Jobert A. Basal forebrain neurons projecting to the rat frontoparietal cortex: electrophysiological and pharmacological properties. Brain Res. 1986;362:122–131. doi: 10.1016/0006-8993(86)91405-8. [DOI] [PubMed] [Google Scholar]
- 17.Lavin A, Grace AA. Physiological properties of rat ventral pallidal neurons recorded intracellularly in vivo. J Neurophysiol. 1996;75:1432–1443. doi: 10.1152/jn.1996.75.4.1432. [DOI] [PubMed] [Google Scholar]
- 18.Martin LJ, Blackstone CD, Levey AI, Huganir RL, Price DL. Cellular localizations of AMPA glutamate receptors within the basal forebrain magnocellular complex of rat and monkey. J Neurosci. 1993;13:2249–2263. doi: 10.1523/JNEUROSCI.13-05-02249.1993. [DOI] [PMC free article] [PubMed] [Google Scholar]
- 19.Maslowski-Cobuzzi RJ, Napier TC. Activation of dopaminergic neurons modulates ventral pallidal responses evoked by amygdala stimulation. Neuroscience. 1994;62:1103–1120. doi: 10.1016/0306-4522(94)90347-6. [DOI] [PubMed] [Google Scholar]
- 20.Mink JW, Thach WT. Basal ganglia motor control. I. Nonexclusive relation of pallidal discharge to five movement modes. J Neurophysiol. 1991;65:273–300. doi: 10.1152/jn.1991.65.2.273. [DOI] [PubMed] [Google Scholar]
- 21.Mitrovic I, Napier TC. Substance P attenuates and DAMGO potentiates amygdala glutamatergic neurotransmission within the ventral pallidum. Brain Res. 1998;792:193–206. doi: 10.1016/s0006-8993(98)00130-9. [DOI] [PubMed] [Google Scholar]
- 22.Mogenson GJ, Yang CR. The contribution of basal forebrain to limbic-motor integration and the mediation of motivation to action. Adv Exp Med Biol. 1991;295:267–290. doi: 10.1007/978-1-4757-0145-6_14. [DOI] [PubMed] [Google Scholar]
- 23.Monaghan DT, Cotman CW. Distribution of N-methyl-d-aspartate-sensitive l-[3H]glutamate-binding sites in rat brain. J Neurosci. 1985;5:2909–2919. doi: 10.1523/JNEUROSCI.05-11-02909.1985. [DOI] [PMC free article] [PubMed] [Google Scholar]
- 24.Napier TC, Simson PE, Givens BS. Dopamine electrophysiology of ventral pallidal/substantia innominata neurons: comparison with the dorsal globus pallidus. J Pharmacol Exp Ther. 1991;258:249–262. [PubMed] [Google Scholar]
- 25.Napier TC, Mitrovic I, Churchill L, Klitenick MA, Lu XY, Kalivas PW. Substance P in the ventral pallidum: projection from the ventral striatum, and electrophysiological and behavioral consequences of pallidal substance P. Neuroscience. 1995;69:59–70. doi: 10.1016/0306-4522(95)00218-8. [DOI] [PubMed] [Google Scholar]
- 26.O'Donnell P, Grace AA. Synaptic interactions among excitatory afferents to nucleus accumbens neurons: hippocampal gating of prefrontal cortical input. J Neurosci. 1995;15:3622–3639. doi: 10.1523/JNEUROSCI.15-05-03622.1995. [DOI] [PMC free article] [PubMed] [Google Scholar]
- 27.Page KJ, Everitt BJ. The distribution of neurons coexpressing immunoreactivity to AMPA-sensitive glutamate receptor subtypes (GluR1–4) and nerve growth factor receptor in the rat basal forebrain. Eur J Neurosci. 1995;7:1022–1033. doi: 10.1111/j.1460-9568.1995.tb01090.x. [DOI] [PubMed] [Google Scholar]
- 28.Pang K, Tepper JM, Zaborszky L. Morphological and electrophysiological characteristics of noncholinergic basal forebrain neurons. J Comp Neurol. 1998;394:186–204. doi: 10.1002/(sici)1096-9861(19980504)394:2<186::aid-cne4>3.0.co;2-z. [DOI] [PubMed] [Google Scholar]
- 29.Paxinos G, Watson C. The rat brain in stereotaxic coordinates. Academic; New York: 1986. [DOI] [PubMed] [Google Scholar]
- 30.Richardson RT, DeLong MR. Electrophysiological studies of the functions of the nucleus basalis in primates. Adv Exp Med Biol. 1991;295:233–252. doi: 10.1007/978-1-4757-0145-6_12. [DOI] [PubMed] [Google Scholar]
- 31.Sabatini BL, Regehr WG. Timing of synaptic transmission. Annu Rev Physiol. 1999;61:521–542. doi: 10.1146/annurev.physiol.61.1.521. [DOI] [PubMed] [Google Scholar]
- 32.Schultz W, Romo R. Role of primate basal ganglia and frontal cortex in the internal generation of movements. I. Preparatory activity in the anterior striatum. Exp Brain Res. 1992;91:363–384. doi: 10.1007/BF00227834. [DOI] [PubMed] [Google Scholar]
- 33.Shreve PE, Uretsky NJ. GABA and glutamate interact in the substantia innominata/lateral preoptic area to modulate locomotor activity. Pharmacol Biochem Behav. 1991;38:385–388. doi: 10.1016/0091-3057(91)90296-e. [DOI] [PubMed] [Google Scholar]
- 34.Smith Y, Parent A. Neurons of the subthalamic nucleus in primates display glutamate but not GABA immunoreactivity. Brain Res. 1988;453:353–356. doi: 10.1016/0006-8993(88)90177-1. [DOI] [PubMed] [Google Scholar]
- 35.Standaert DG, Testa CM, Young AB, Penny JB. Organization of N-methyl-d-aspartate glutamate receptor gene expression in the basal ganglia of the rat. J Comp Neurol. 1994;343:1–16. doi: 10.1002/cne.903430102. [DOI] [PubMed] [Google Scholar]
- 36.Whittier JR, Mettler FA. Studies of the subthalamus of the rhesus monkey. II. Hyperkinesia and other physiologic effects of subthalamic lesions with special references to the subthalamic nucleus of Luys. J Comp Neurol. 1949;90:319–372. doi: 10.1002/cne.900900304. [DOI] [PubMed] [Google Scholar]
- 37.Wichmann T, Bergman H, DeLong MR. The primate subthalamic nucleus. I. Functional properties in intact animals. J Neurophysiol. 1994;72:494–506. doi: 10.1152/jn.1994.72.2.494. [DOI] [PubMed] [Google Scholar]
- 38.Wilson FAW. The relationship between learning, memory and neuronal responses in the primate basal forebrain. Adv Exp Med Biol. 1991;295:253–266. doi: 10.1007/978-1-4757-0145-6_13. [DOI] [PubMed] [Google Scholar]
- 39.Wilson FAW, Rolls ET. Neuronal responses related to reinforcement in the primate basal forebrain. Brain Res. 1990;509:213–231. doi: 10.1016/0006-8993(90)90546-n. [DOI] [PubMed] [Google Scholar]
- 40.Zaborszky L, Cullinan WE, Braun A. Afferents to basal forebrain cholinergic projection neurons: an update. Adv Exp Med Biol. 1991;295:43–100. doi: 10.1007/978-1-4757-0145-6_2. [DOI] [PubMed] [Google Scholar]