

Abstract
Mutual synaptic interactions between GABAergic interneurons are thought to be of critical importance for the generation of network oscillations and for temporal encoding of information in the hippocampus. However, the functional properties of synaptic transmission between hippocampal interneurons are largely unknown. We have made paired recordings from basket cells (BCs) in the dentate gyrus of rat hippocampal slices, followed by correlated light and electron microscopical analysis. Unitary GABAAreceptor-mediated IPSCs at BC–BC synapses recorded at the soma showed a fast rise and decay, with a mean decay time constant of 2.5 ± 0.2 msec (32°C). Synaptic transmission at BC–BC synapses showed paired-pulse depression (PPD) (32 ± 5% for 10 msec interpulse intervals) and multiple-pulse depression during repetitive stimulation. Detailed passive cable model simulations based on somatodendritic morphology and localization of synaptic contacts further indicated that the conductance change at the postsynaptic site was even faster, decaying with a mean time constant of 1.8 ± 0.6 msec. Sequential triple recordings revealed that the decay time course of IPSCs at BC–BC synapses was approximately twofold faster than that at BC–granule cell synapses, whereas the extent of PPD was comparable. To examine the consequences of the fast postsynaptic conductance change for the generation of oscillatory activity, we developed a computational model of an interneuron network. The model showed robust oscillations at frequencies >60 Hz if the excitatory drive was sufficiently large. Thus the fast conductance change at interneuron–interneuron synapses may promote the generation of high-frequency oscillations observed in the dentate gyrusin vivo.
Keywords: GABAergic interneurons, basket cells, dentate gyrus, unitary IPSCs, paired-pulse depression, paired recording, interneuron networks, gamma oscillations, computational model
The neuronal network of the hippocampus consists of glutamatergic principal neurons (granule cells and pyramidal neurons) and GABAergic interneurons (for review, seeFreund and Buzsáki, 1996). Inhibitory interneurons that innervate the perisomatic domain of principal neurons, referred to as basket cells (BCs), have a particularly powerful influence on their postsynaptic target cells, controlling the electrical activity of the principal neuron ensemble (Cobb et al., 1995; Miles et al., 1996;Kraushaar and Jonas, 2000). Several lines of evidence indicate that GABAergic interneurons in general, and BCs in particular, also interact with each other, forming a synaptic network of inhibitory cells. First, spontaneous IPSCs have been observed in interneurons in the hippocampal CA1 region (Hájos and Mody, 1997). Second, paired recordings have demonstrated a few examples of inhibitory coupling between hippocampal interneurons (Lacaille and Schwartzkroin, 1988;Cobb et al., 1997). Finally, immunocytochemical studies have indicated a high degree of synaptic connectivity among BCs in the CA1 area and the dentate gyrus (Sik et al., 1995; Gulyás et al., 1999;Acsády et al., 2000).
In the hippocampus of the behaving rat, oscillations in the theta (3–12 Hz) and gamma (40–100 Hz) frequency range occur during exploration (Bragin et al., 1995). These oscillations are thought to provide temporally and spatially coherent clock signals for temporal encoding of information in principal neuron ensembles (for review, seeBuzsáki and Chrobak, 1995; Ritz and Sejnowski, 1997; Traub et al., 1999). Although theta frequency oscillations are driven by septal and entorhinal inputs, gamma oscillations are thought to be generated intrinsically. In vivo recordings revealed that interneurons discharge at high frequencies during epochs of gamma activity, with individual spikes time-locked to the oscillations of the field potential (Bragin et al., 1995; Penttonen et al., 1998). These results imply that interneurons have a critical role in the generation of fast oscillations. In the in vitro slice preparation, gamma oscillations in the CA1 region can be elicited in the presence of antagonists of ionotropic glutamate receptors (Whittington et al., 1995), suggesting that they are generated by inhibitory synaptic interactions between interneurons. However, simulations of interneuron network activity revealed that several conditions have to be satisfied if interneuron networks are the substrates of coherent gamma oscillations (Wang and Buzsáki, 1996; White et al., 1998;Tiesinga and José, 2000): (1) inhibitory events must be hyperpolarizing, (2) the decay time constant of the postsynaptic conductance change has to be sufficiently large (e.g., 10 msec), (3) the synaptic strength should be intermediate (e.g., 0.1 mS/cm2 total), (4) connectivity must be sufficiently high, and (5) heterogeneity of excitatory drive has to be small. Whether the properties of synaptic connections between interneurons are compatible with these constraints, however, has remained unknown.
The goal of this study was to test the implications of the network models directly by recording from pairs of synaptically connected basket cells in the dentate gyrus of rat hippocampal slices. This region shows gamma oscillations with the highest frequency and power in the entire hippocampus (Bragin et al., 1995). We found that the time course of unitary IPSCs at BC–BC synapses is rapid, faster than that of IPSCs at BC–granule cell (GC) synapses in the same microcircuit. These results further define the constraints for the generation of synchronized high-frequency oscillations in the interneuron network of the dentate gyrus.
MATERIALS AND METHODS
Paired recordings from synaptically connected interneurons. Transverse hippocampal slices (300 μm thickness) were cut from brains of 18- to 25-d-old Wistar rats using a Vibratome(DTK-1000, Dosaka). Animals were killed by decapitation, in accordance with national and institutional guidelines. Patch pipettes were pulled from borosilicate glass tubing (2 mm outer diameter, 1 mm wall thickness). When filled with intracellular solution, the resistance was 1.4–2.2 MΩ for recordings from BCs and 2.0–2.5 MΩ for recordings from GCs. Recordings were obtained from synaptically connected BC–BC and BC–GC pairs in the dentate gyrus under visual control using infrared differential interference contrast videomicroscopy (Stuart et al., 1993; Koh et al., 1995). Selected BCs had somata located at the granule cell layer–hilus border. To obtain sequential triple recordings, a paired recording was first obtained from a putative BC–BC pair. While the recording from the presynaptic BC was maintained, the patch pipette was withdrawn from the postsynaptic BC, and a recording was made from a postsynaptic GC. The maximal time elapsed between the two paired recordings was 20 min. Selected GCs had somata located in the outer third of the granule cell layer. For both BC–BC and BC–GC pairs, the distance between the somata of presynaptic and postsynaptic neuron was typically <200 μm. BC recordings with initial resting potentials more positive than −55 mV and GC recordings with initial resting potentials more positive than −65 mV were discarded. The recording temperature was 31−33°C.
Two Axopatch 200B amplifiers (Axon Instruments) were used for recording. The presynaptic neuron was held in the current-clamp mode and stimulated at a frequency of 0.1–0.3 Hz, unless specified differently. Action potentials were initiated by brief current pulses (duration 2 msec, amplitude 1–1.4 nA). The postsynaptic cell was held in the voltage-clamp mode (holding potential −70 mV) with series resistance (RS) compensation (∼65–90%; lag ∼10–35 μsec; RSbefore compensation 5–10 MΩ). The stationarity of the series resistance in the postsynaptic neuron was assessed from the amplitude of the capacitive current in response to a 5 mV pulse, and the compensation was readjusted during the experiment when necessary. Presynaptic action potentials and IPSCs were filtered at 5 kHz using the four-pole low-pass Bessel filter of the amplifiers and were digitized at 10 kHz using a 1401plus laboratory interface [Cambridge Electronic Design (CED)] interfaced to a Pentium-PC. Commercial programs from CED or homemade programs were used for stimulus generation and data acquisition.
Solutions. The physiological extracellular solution contained (in mm): 125 NaCl, 25 NaHCO3, 25 glucose, 2.5 KCl, 1.25 NaH2PO4, 2 CaCl2, and 1 MgCl2 (bubbled with 95% O2/5% CO2 gas mixture). In some experiments, slices were stored in a solution containing (in mm): 87 NaCl, 25 NaHCO3, 2.5 KCl, 1.25 NaH2PO4, 0.5 CaCl2, 7 MgCl2, 25 glucose, and 75 sucrose. 6-Cyano-7-nitroquinoxaline-2,3-dione (CNQX) (5–10 μm) was added to the bath solution to block EPSCs. The intracellular solution contained K-gluconate and KCl (at concentrations of either 110 and 40 mm, or 70 and 70 mm, respectively), 0.1 mm EGTA, 2 mmMgCl2, 2 mmNa2ATP, and 10 mm HEPES; the pH was adjusted to 7.2 with KOH, and the osmolarity was 310–315 mOsm. Bicuculline methiodide was purchased from Sigma (St. Louis, MO); CNQX was purchased from Tocris (stock solutions in either distilled water or 0.1 m NaOH). Other chemicals were from Merck (Darmstadt, Germany), Sigma, Riedel-de Haën, or Gerbu.
Data analysis. The rise time of evoked IPSCs was determined as the time interval between the points corresponding to 20 and 80% of the peak amplitude, respectively. The peak current was determined as the maximum within a window of 2–4 msec duration after the presynaptic action potential. The synaptic latency was determined as the time interval between the maximum of the first derivative of the presynaptic action potential and the onset of the IPSC; the onset point was determined from the intersection of a line through the 20 and 80% points with the baseline. The decay phase of the IPSCs was fitted with a single exponential [Aexp(−t/τm)] or with the sum of two exponentials [Aexp(−t/τ1) + Bexp(−t/τ2)], using a nonlinear least-squares fit algorithm; time constants are reported either separately or as an amplitude-weighted mean [τw = (A τ1+ B τ2)/(A +B)]. Amplitudes of electrical responses (see Fig. 6) were measured from onset to peak of the fast current components evoked by presynaptic action potentials. A trace was classified as a failure when the amplitude was less than three times the SD of the baseline (determined in a ∼5 msec window preceding the IPSC). In a few cases, traces were passed through a digital filter before display (3 kHz). Coefficients of variation (CV; SD/mean) of unitary IPSC peak amplitudes were calculated from 30–100 traces during stationary periods. CV values were not corrected for baseline noise, because the influence of a correction was very small. Values are given as mean ± SEM. Error bars in the Figures also indicate SEMs. Membrane potentials reported in the text were not corrected for junction potentials. Significance of differences was assessed by a two-tailed ttest at the significance level (p) indicated.
Fig. 6.

Electrical coupling in a subset of BC–BC pairs. A, Top panel, Electrical PSCs evoked by single presynaptic action potentials in a tentatively identified BC–BC pair. Presynaptic action potential is shown attop; single electrical PSCs are shown atbottom; six sweeps are superimposed. A,Bottom panel, Electrical PSCs evoked by a train of five presynaptic action potentials evoked with a frequency of 100 Hz (average from 15 sweeps). Note that the amplitude of the electrical PSCs is approximately constant and that the electrical PSCs are mirror images of the presynaptic action potentials. B, Postsynaptic voltage changes evoked by long depolarizing and hyperpolarizing current pulses (0.4, −0.4, and −1 nA) applied to the presynaptic interneuron. Presynaptic voltage (top), corresponding postsynaptic current (center), and pulse protocol (bottom) are depicted. Note that the current–response in the postsynaptic cell is an approximate mirror image of the voltage change in the presynaptic neuron. Same pair as in A is shown. C, Combined electrical and chemical transmission in another tentatively identified BC–BC pair. Presynaptic action potential (top), single electrical and chemical PSC traces (5 sweeps superimposed), average (from 15 sweeps), and average in the presence of 10 μm bicuculline methiodide (from 25 sweeps;bottom) are illustrated.
Morphological reconstruction and analysis. Morphological methods were similar to those reported previously (Martina et al., 2000). Presynaptic and postsynaptic neurons were filled with biocytin (0.1–0.2%) during recording. After withdrawal of the pipettes, slices were fixed in (1) 2.5% paraformaldehyde, 1.25% glutaraldehyde, 15% picric acid in 100 mm phosphate buffer (PB), pH 7.4, or (2) 1% paraformaldehyde, 0.5 or 0.1% glutaraldehyde in 50 mm PB (12 hr, 4°C). After fixation, slices were treated with hydrogen peroxide (1%, 10 min) and rinsed in PB several times. After incubation in 10 and 20% sucrose solution, slices were snap-frozen in liquid nitrogen and thawed to room temperature. The slices were then transferred to a phosphate-buffered solution containing 1% avidin–biotinylated horseradish peroxidase complex (ABC; Vector Laboratories, Camon, Wiesbaden, Germany) for ∼12 hr. Excess ABC was removed by several rinses in PB, and the slices were developed with 0.05% 3,3′-diaminobenzidine tetrahydrochloride and 0.01% hydrogen peroxide. Subsequently, slices were rinsed in PB several times and embedded in 5% agar for resectioning on a Vibratome(80–100 μm thickness). The sections were post-fixed in 1% osmium tetroxide in PB for 30 min and rinsed in PB, followed by three 10 min rinses in distilled water and block staining with a 1% aqueous solution of uranyl acetate for 30 min. The sections were washed briefly in distilled water, dehydrated between coverslips in an ascending series of ethanol, and transferred to propylene oxide two times for 10 min. Finally, the sections were embedded in Durcupan (Fluka, Buchs, Switzerland) overnight, mounted under coverslips, and left to polymerize at 56°C for 48 hr. Alternatively, some slices were not resectioned and were embedded in Mowiol (Sigma-Aldrich, Taufkirchen, Germany).
Axons and dendrites of the presynaptic and postsynaptic neuron were examined by light microscope using a 100× oil immersion objective. Putative synaptic contacts were identified as close appositions of a bouton and a dendrite in the same focal plane. In selected pairs, the morphology of presynaptic and postsynaptic neurons was reconstructed with the aid of a camera lucida. In two pairs, the contacts suggested by light microscopy (LM) were examined by electron microscopy (EM) of serial sections. In one pair, five contacts were suggested by LM, and three contacts were revealed by EM (two false positive contacts). In another pair, six contacts were suggested by LM, and seven contacts were revealed by EM (one additional contact found).
In a subset of pairs examined (14 IPSCs, 1 electrical coupling), both the presynaptic and the postsynaptic interneurons were identified morphologically as BCs. The main criteria were (1) the primary location of the axonal arborization in the granule cell layer (light microscopy) and (2) the preferential location of the synapses on somata and proximal dendrites of the target cells (electron microscopy; two BC–BC pairs) (Han et al., 1993; Buhl et al., 1994). These BC–BC pairs, referred to as “rigorously identified” in the text, were used for determining the basic properties of synaptic transmission (see Figs. 1, 5). In another subset of pairs, only one (the presynaptic) neuron was stained sufficiently (16 pairs), or the identification of the interneurons as BCs relied only on their ability to generate high-frequency trains of action potentials during sustained current injections (≥250 Hz during the first 100 msec of a depolarizing pulse; 18 pairs). These BC–BC pairs, referred to as “tentatively identified” in the text, were used together with the rigorously identified pairs in Figures 2, 6, and 7. Basic properties of synaptic transmission (latency, rise time, amplitude, and decay time constant) in rigorously and tentatively identified BC–BC pairs were not significantly different (p > 0.5 for all parameters).
Fig. 1.

Fast unitary IPSCs in synaptically connected BC–BC pairs. A, Presynaptic action potential (top), single unitary IPSCs (6 sweeps superimposed,center), and average IPSC (from 38 sweeps,bottom) at −70 mV are depicted. The schematic illustration on top illustrates the recording configuration. B, Histograms of latencies, 20–80% rise times, peak amplitudes of average unitary IPSCs (including failures), and decay time constants [amplitude-weighted mean decay time constant τw (biexponential fit) in 11 pairs and τm(monoexponential fit) in 3 pairs]. Values of latencies, rise times, amplitudes, and decay time constants were determined from average IPSCs (including >10 individual traces). For latency measurements, one pair was excluded because of high presynaptic series resistance. Shown are summary graphs of data from 14 rigorously identified BC–BC pairs.
Fig. 2.

Dynamics of transmission at inhibitory BC–BC synapses. A, PPD of IPSCs. IPSCs were evoked by two action potentials in the presynaptic BC, separated by a 20 msec interval. IPSCs shown are averages from 30 single traces (failures included). A1 andA2 were measured from the preceding baseline. B, Coefficient-of-variation analysis of PPD. The inverse of the square of the coefficient of variation (CV−2) of the amplitude of the second IPSC (A2) was plotted against the mean peak amplitude; data were normalized by the CV−2 and mean, respectively, of the amplitude of the first IPSC (A1). Interpulse interval was 20 msec (▵) or 50 msec (○). Dotted line indicates identity line. Data are from 17 pairs.C, Time course of recovery from PPD. Amplitude ratioA2/A1of unitary IPSC was plotted against the interpulse interval. Thecurve represents a fitted monoexponential function with a time constant of 0.63 sec. Data are from 17 pairs. D, Multiple-pulse depression of IPSCs. The bottom trace to the left of the double slash is an average of 10 single sweeps recorded with a stimulation frequency of 0.2 Hz; the traces to the right of thedouble slash are single sweeps (20 events at the onset, 20 events 1 sec after the onset of a 50 Hz train).E, Unitary IPSCs at an expanded time scale from the same pair as shown in D. Five consecutive IPSCs from different times (as indicated by brackets) are shown superimposed. F, Onset of depression during a 50 Hz train. Each data point represents the mean IPSC peak amplitude in three pairs, normalized to the mean peak amplitude at 0.2 Hz (479 pA on average) before the train. Each data point represents a single peak amplitude (first 10 points) or the mean of four amplitudes (all subsequent points). The curve represents the sum of two exponential components and a constant fitted to the data points, with τ1 = 25 msec (A = 0.42), τ2 = 5.1 sec (B = 0.37), and a constant component amplitude of 0.06.
Detailed passive cable simulations. Detailed passive cable modeling was performed using three biocytin-filled BC–BC pairs (Major et al., 1994; Geiger et al., 1997). The diameters and three-dimensional coordinates of all dendritic segments and the main axon of the postsynaptic BCs were reconstructed using Neurolucida (MicroBrightField, Colchester, VT). No correction was made for tissue shrinkage. Spines were largely absent on interneuron dendrites and thus were not considered in the cable model. The axonal arborization was approximated by connecting 150 cylinders (0.9 μm diameter, 42 μm length) to the main axon collaterals (Geiger et al., 1997). The electrotonic length of segments was calculated from their physical length (l) as L = l/λ, with the space constant λ = √ (Rmd/4Ri), whereRm is the specific membrane resistance, d is the diameter of the segment, andRi is the cytoplasmic resistivity.
IPSCs were simulated using NEURON version 4.2.3 or 4.3.1 (Hines and Carnevale, 1997) running on a PC under Debian Linux. The electrical properties of the interneuron were assumed to be uniform. The specific membrane capacitance Cm was assumed to be 0.8 μF/cm2,Ri was 100 Ω cm, andRm was 5500, 10750, and 11150 Ω cm2, respectively (adjusted to match the input resistance of the postsynaptic BC, measured at the soma). Because initial seal resistances were >1 GΩ and pipette withdrawal resulted in formation of outside-out patches (suggesting that the seal remained intact), shunts at the recording electrode were not considered in the model. The resting potential was set to −70 mV. The residual uncompensated RS was calculated asRS (100% − percentage of compensation) and was 2–3 MΩ. The maximum segment length was 6 μm, and the time step was 10 μsec in all simulations. The postsynaptic conductance change was represented by the functiony(t) = −exp(−t/τrise) + exp(−t/τdecay), which was divided by the maximum amplitude and multiplied by a peak conductance valuegmax.
To infer the time course of the inhibitory conductance change at the postsynaptic site, conductances were simulated at the morphologically identified contacts, and τrise, τdecay, andgmax were varied to minimize the sum of squares of differences between the simulated IPSCs and the measured average unitary IPSCs in the same pair (see Fig. 5B). Synaptic current reversal potentials were assumed to be −45 or −25 mV, similar to experimentally determined mean reversal potentials (measured in three BCs each). Minimization was made using the internal fitpraxis routine of NEURON. Different starting values gave similar results, suggesting convergence to a global minimum.
Fig. 5.
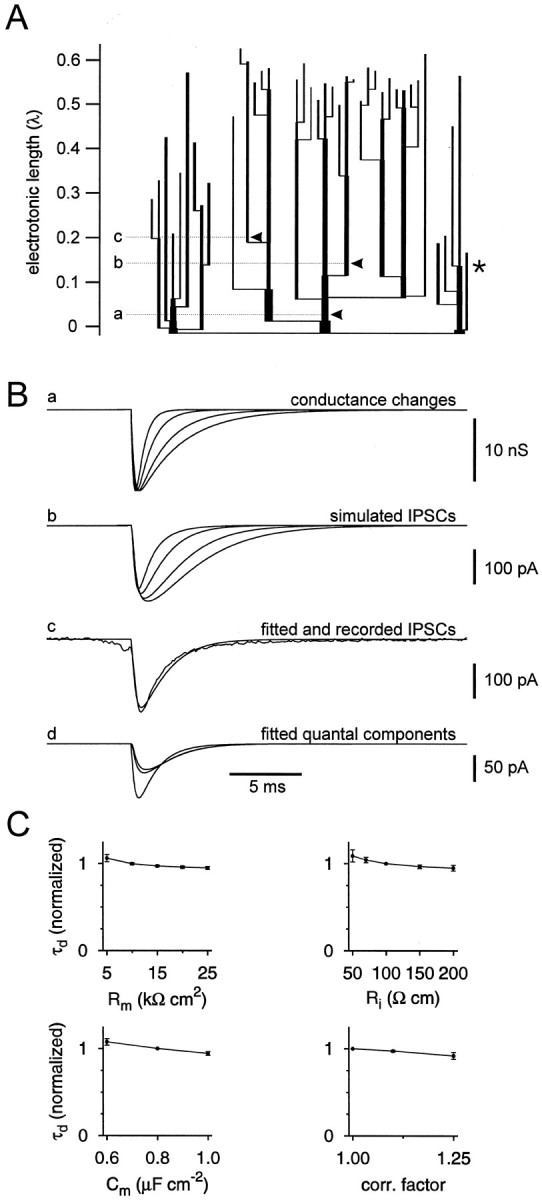
Estimation of the time course of the postsynaptic conductance change at the synaptic contacts. A, Electrotonic dendrogram of a postsynaptic BC (same cell as shown in Figs. 3, 4). Apical dendrites are represented in the center; basal dendrites are shown laterally in the dendrogram. The axon (shown truncated) is indicated by the asterisk; 150 schematic collaterals were attached to the main axon in a distributed manner (not shown). The locations of the synaptic contacts are shown byarrowheads (a, b, c). The physical and electrotonic distances of the three synaptic contacts from the soma were 17, 108, and 133 μm, and 0.03, 0.14, and 0.20 λ, respectively. B, Simulation of IPSCs in voltage-clamp mode. a, Postsynaptic conductance changes, with τrise = 0.2 msec, τdecay = 0.5, 1, 2, and 3 msec, and gmax = 15.8 nS (total conductance change for all sites). b, Resulting simulated IPSCs in the pipette compartment. Conductance changes were generated simultaneously and were assumed to have the same amplitude at all sites. c, Simulated IPSC in the pipette compartment, superimposed with the recorded average unitary IPSC in the same BC–BC pair. The postsynaptic conductance change had a τrise = 0.2 msec, τdecay = 1.02 msec, and gmax = 15.8 nS (total conductance change for all sites), which represent the results of a minimization of the sum of squares of differences between simulated and measured IPSCs. d, Quantal components of the fitted IPSCs in the pipette compartment; same parameters as inc. Note that attenuation and filtering is more pronounced for distal than for proximal sites. C, Exploration of the dependence of the fit results on the parameters of the cable model. The obtained decay time constants (τd) of the conductance change at the postsynaptic site is plotted versusRm,Ri,Cm, and tissue shrinkage correction factor. τd was normalized to the respective value for default parameters (Rm determined individually, Ri = 100 Ω cm, andCm = 0.8 μF/cm2).
Network simulations. The activity of networks of fast-spiking inhibitory interneurons was simulated using NEURON 4.3.1 running on a PC, following closely the procedures of Wang and Buzsáki (1996), referred to as the WB model. Neurons were represented as single compartments. Specific leak conductance was assumed to be 0.1 mS/cm2, identical to the value in the WB model. With the estimated somatodendritic surface area (12082 μm2; three reconstructed neurons), this gives an input resistance of 83 MΩ, comparable to experimentally observed values. Active conductances were modeled using the equations of Hodgkin and Huxley (1952) with the modifications of the WB model. Postsynaptic conductances were simulated using the NEURON class Exp2Syn, which represents conductance as the sum of two exponentials after the presynaptic action potential with a delay. Synaptic delay was set to 0.8 msec (from 0 mV crossing of the presynaptic spike), rise time constant was set to 0.16 msec, and decay time constant was set to 1.8 msec (similar to measured values; see Table 1). Synaptic peak conductance change was assumed to be 0.02 mS/cm2 per input, and synaptic reversal potential was assumed to be −75 mV. The conductance value was obtained from the experimentally determined mean unitary postsynaptic conductance change (7.6 nS) (see Table 1) and the somatodendritic surface area, which gave a specific synaptic conductance of 0.063 mS/cm2. However, a reduction in conductance caused by both low physiological Cl− concentrations (to ∼0.6 at 7.9 mm Cl−, which corresponds to the reversal potential chosen in the model) and synaptic depression (to ∼0.4 during 500 msec in 50 Hz trains) (see Fig.2F) have to be considered. Thus a specific conductance of 0.02 mS/cm2 appears to be a realistic value (also considering the perisomatic location of synapses). Thus the main differences to the WB model were the inclusion of a synaptic delay, the faster decay of the postsynaptic conductance change, and the larger peak amplitude (Msyn × 0.02 mS/cm2 vs 0.1 mS/cm2 total). The number of neurons in the network was typically 100, and neurons were connected randomly by inhibitory synapses, with MSynrepresenting the mean number of synaptic inputs per neuron. The time step in the simulations was 12.5 μsec. As initial conditions, the membrane potentials were randomly chosen from a uniform distribution (−70 to −50 mV), and gating variables were set to the corresponding steady-state values. Driving currents to individual neurons were randomly chosen from a normal distribution (with meanIμ and SDIς).
Table 1.
Summary of functional properties of unitary IPSCs generated at the BC–BC synapse
| Mean ± SEM | [Range] (n) | |
|---|---|---|
| Unitary IPSCs1-a | ||
| Latency IPSC1-b | 0.8 ± 0.05 msec | [0.6–1.2] (14) |
| 20–80% rise time of IPSC1-b | 0.3 ± 0.02 msec | [0.2–0.46] (14) |
| Decay τw of IPSC1-b,1-c | 2.5 ± 0.2 msec | [1.1–3.8] (14) |
| Decay τ11-b,1-c | 1.6 ± 0.1 msec | [1.0–2.0] (11) |
| Decay τ21-b,1-c | 11.0 ± 2.3 msec | [3.7–26.7] (11) |
| Ampl. contr. fast comp.1-b,1-c | 76.8 ± 7.8% | [21–99] (11) |
| Peak amplitude IPSC1-b,1-d | 110 ± 19 pA | [34–234] (14) |
| Percentage of failures | 10 ± 5% | [0–48] (14) |
| Paired-pulse depression1-e | ||
| PPD at 10 msec | 32 ± 4.6% | [15–52] (17) |
| Recovery from PPD, τ | 0.63 sec | (17) |
| Multiple-pulse depression (50 Hz)1-e | ||
| Onset τ1 (ampl. contr.) | 0.025 sec (42%) | (3) |
| Onset τ2 (ampl. contr.) | 5.1 sec (37%) | (3) |
| Block of IPSCs1-e | ||
| 20 μmbicuculline | 94 ± 1% | [92–97] (4) |
| Inferred postsynaptic conductance change1-a | ||
| Rise τ | 0.17 ± 0.04 msec | [0.09–0.2] (3) |
| Decay τ | 1.8 ± 0.6 msec | [1.0–2.9] (3) |
| Peak amplitude (all sites)1-f | 7.6 ± 4.2 nS | [1.9–15.8] (3) |
Data from rigorously identified BC–BC pairs.
Values were determined from average IPSCs.
Based on visual criteria, a biexponential fit was judged to be superior in 11 pairs (yielding time constant values τ1, τ2, and an amplitude-weighted decay time constant τw), whereas a monoexponential fit was adequate in the remaining 3 pairs (yielding a time constant τm). The overall value given is the mean of τw and τm values.
Including failures.
Data from both rigorously and tentatively identified BC–BC pairs.
With the surface area of the somatodendritic domain of the reconstructed BCs (mean 12082 μm2), this would correspond to a mean conductance density of 0.063 mS/cm2.
Average firing frequency (fμ) was determined from the mean interspike interval for the entire simulation period. Action potential patterns were represented in a binary format (with 0 when no action potential occurred and 1 if one or more than one action potential occurred in a given time interval τ). The population coherence measure κ was calculated as the mean of the coherence in all pairs of interneurons defined by the following equation:
| Equation 1 |
where i and j denote the two interneurons,X (l) and Y(l) are the binary action potential patterns, andK is the number of time bins. κ was determined for time intervals 400–500 msec after onset of simulations, using τ = 0.1/fμ (Wang and Buzsáki, 1996). Simulation results shown in Figure 8B–E are averages of 10–20 individual runs. Control simulations with the default parameters in the WB model (e.g., decay time constant 10 msec, no synaptic delay) were also performed and gave very similar results to those described byWang and Buzsáki (1996).
Fig. 8.

Simulation of oscillatory activity in the gamma frequency range in a network of interneurons coupled by fast inhibitory synapses. Aa, Ab, Simulated voltage traces of 15 neurons and rastergram representation of the activity of a network of 100 neurons connected randomly by rapid synapses (synaptic delay 0.8 msec; τd = 1.8 msec;gSyn = 0.02 mS/cm2;MSyn = 60). The excitatory driving current was heterogeneously distributed withIμ = 3 μA/cm2and Iς = 0.09 μA/cm2. Ac, Rastergram of the activity of a network coupled by slow inhibitory synapses (τd = 5.2 msec), as observed at the BC–GC synapse. Note the lower network frequency. Also note that the activity of 13 neurons is suppressed. B, C, Mean network frequency (fμ, B) and coherence (κ, C), plotted against the mean current drive (Iμ,Iς/Iμ = 0.03) for fast (τd = 1.8 msec, ●) and slow decay time constant of the inhibitory postsynaptic conductance change (τd = 5.2 msec, ○). Arrows indicate data points corresponding to the rastergrams shown in Ab and Ac. D, Coherence κ plotted against the heterogeneity measureIς/Iμ of the current drive for Iμ = 1, 2, 3, and 5 μA/cm2 (▪, ●, ▴, and ♦, respectively).E, Plot of network coherence κ versusMSyn and Iμ. Coherence κ increases with both MSyn andIμ. Note that critical values of the two parameters for the generation of coherent oscillations are interdependent.
RESULTS
Functional properties of unitary IPSCs at BC–BC synapses
To determine the functional properties of inhibitory synapses between hippocampal interneurons, we recorded from pairs of monosynaptically connected dentate gyrus BCs in rat brain slices at near-physiological temperatures (Fig. 1). A representative example of a recording from a BC–BC pair is shown in Figure 1A. Figure 1B shows histograms summarizing the basic properties of synaptic transmission from 14 BC–BC pairs in which the presynaptic and postsynaptic neurons were identified rigorously by light microscopy. The mean latency of unitary IPSCs, measured from the steepest point in the rise of the presynaptic action potential to the onset of the IPSC, was 0.8 ± 0.05 msec. The mean 20–80% rise time was 0.3 ± 0.02 msec, and the mean peak amplitude including failures was 110 ± 19 pA at −70 mV. The decay of unitary IPSCs could be better fitted with the sum of two exponentials in the majority of BC–BC pairs, with mean decay time constants of 1.6 ± 0.1 msec (76.8% amplitude contribution) and 11 ± 2.3 msec. The mean value of the decay time constant of the unitary IPSCs from all 14 BC–BC pairs, determined either as the weighted decay time constant τw (biexponential fit) or as the time constant τm(monoexponential fit), was 2.5 ± 0.2 msec. Synaptic transmission was very reliable; the mean percentage of failures was 10 ± 5%. Finally, unitary IPSCs were blocked by bath application of bicuculline (94 ± 1% block by 20 μm bicuculline methiodide after 10 min; four pairs; data not shown), indicating that they were mediated by GABAA receptors (GABAARs). Thus mutual inhibition in BC–BC pairs shows short latency, rapid onset, large peak conductance change, high reliability, and an extremely fast decay of unitary IPSCs (Table1).
We next examined the dynamics of transmission at BC–BC synapses during repetitive presynaptic activity (Fig. 2). As the simplest paradigm, we studied paired-pulse modulation. When two action potentials were elicited in the presynaptic BC, separated by intervals of variable duration, the amplitude of the second IPSC in the postsynaptic BC was on average smaller than that of the first (Fig.2A). The maximal paired-pulse depression (PPD), measured for 10 msec interpulse intervals, was 32 ± 4.6% (6 rigorously and 11 tentatively identified BC–BC pairs).
To determine whether PPD was generated by presynaptic factors [such as depletion of the vesicular pool (Stevens and Tsujimoto, 1995)] or by postsynaptic mechanisms [such as GABAAR desensitization (Jones and Westbrook, 1995)], a coefficient-of-variation analysis of PPD was performed (Malinow and Tsien, 1990). The inverse of the square of the coefficient of variation for the second IPSC was plotted against the mean; both were normalized to the respective values of the first IPSC. Data points were located below the identity line, suggesting that PPD was caused mainly by presynaptic changes (Fig. 2B) (17 pairs). Consistent with a presynaptic locus of PPD, the percentage of failures was 1.9-fold larger for the second than for the first IPSC (p < 0.01). Thus synaptic signaling at the BC–BC synapse showed marked PPD, which appeared to be expressed presynaptically. Recovery from PPD was complete after 5 sec; when fitted with a single exponential function, the time constant of recovery was 0.63 sec (Fig. 2C) (17 pairs).
In the intact hippocampal network, interneurons can generate high-frequency trains of action potentials during gamma oscillatory periods (Bragin et al., 1995). We therefore examined the stability of transmission at BC–BC pairs during 50 Hz trains of action potentials (Fig. 2D). The onset of train-induced depression was biexponential, with time constants of 25 msec and 5.1 sec at this stimulation frequency (Fig. 2D–F). After 1000 action potentials, the IPSC amplitude decayed to an asymptotic value, which was 6.0% of the control value. Thus, synaptic transmission at the BC–BC synapse showed marked depression in the early phase of a train but stabilized during the later phase of the train, as reported previously for the BC–GC synapse (Kraushaar and Jonas, 2000).
Morphological properties of BC–BC synaptic connections
Unitary IPSCs recorded at the soma decayed very rapidly. However, the time course of the real conductance change at the site of transmission is likely to be faster, because of imperfect voltage clamp and cable filtering. To infer the time course of the inhibitory conductance change at the site of generation, we first determined the location of the synaptic contacts. Presynaptic and postsynaptic neurons were filled with biocytin during recording and processed subsequently for light and electron microscopy. Figure3 shows a camera lucida reconstruction of a representative synaptically coupled BC–BC pair. For both the presynaptic and the postsynaptic neurons, the axonal arborization was largely confined to the granule cell layer. This identifies the interneurons as BCs (Han et al., 1993; Buhl et al., 1994). In this pair, the axon of the presynaptic BC formed three synaptic contacts on the apical dendrites of the postsynaptic BC, as confirmed by subsequent electron microscopic analysis (Fig. 4). In three reconstructed BC–BC pairs, three to seven synaptic contacts were identified, which were located on the apical dendrite at distances of 0–133 μm from the center of the soma of the postsynaptic interneuron.
Fig. 3.

Camera lucida reconstruction of a synaptically connected BC–BC pair. Soma and dendrites of the presynaptic BC are drawn in green. Axonal arborization of the presynaptic BC is drawn in red. Soma and dendrites of the postsynaptic BC are drawn in black. Axonal arborization of the postsynaptic BC is drawn in blue. Only the portions of the axons that could be unequivocally traced back to the soma are depicted. Synaptic contacts (confirmed by subsequent electron microscopy; see Fig. 4) are indicated by arrowheads. Additionally, the postsynaptic BC showed three autaptic contacts (confirmed by electron microscopy; data not shown). Note that the axonal arborization of both BCs was largely confined to the granule cell layer, identifying them as BCs. ml, Molecular layer; gcl, granule cell layer.
Fig. 4.
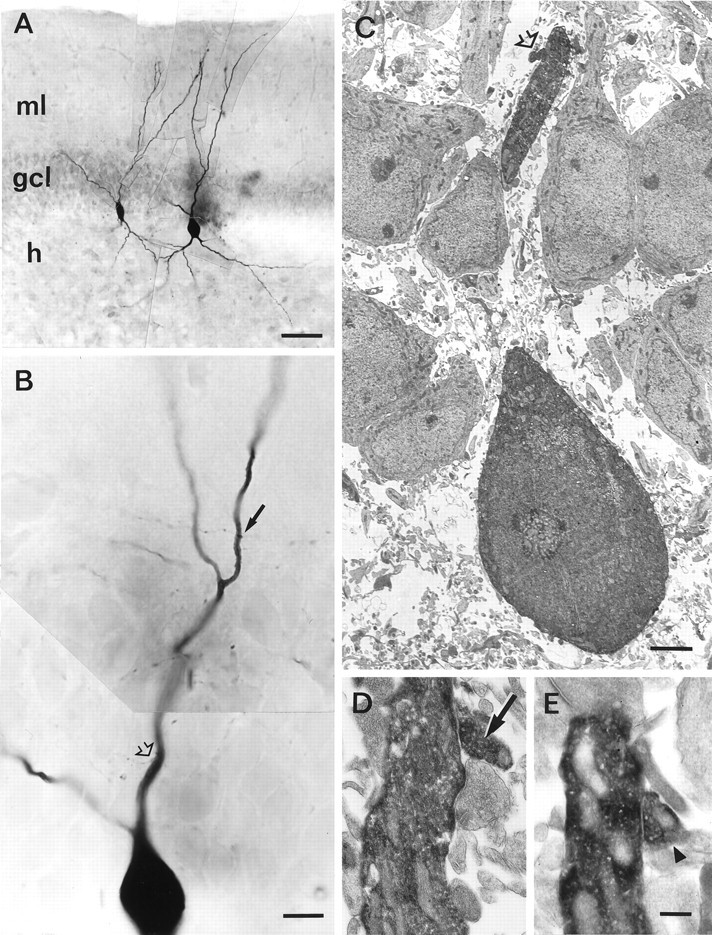
Light and correlated electron microscopical analysis of synaptic contacts in a synaptically connected BC–BC pair.A, Low-power light micrograph of the same pair shown in Figure 3. ml, Molecular layer; gcl, granule cell layer; h, hilus. Scale bar, 50 μm.B, High-power light micrograph of the soma and apical dendrite of the postsynaptic BC. Two of the three synaptic contacts in this BC–BC pair are indicated by arrow and open arrow. Scale bar, 10 μm. C, Low-power electron micrograph of the proximal synaptic contact (open arrow). Scale bar, 2.5 μm. D,E, High-power electron micrographs of the two distal contacts (arrow and arrowhead). Contacts indicated by open arrow and arrow inC and D are also visible in the micrograph in B (same symbolic code; contact inE indicated by arrowhead is not shown inB). Scale bar, 0.25 μm.
The time course of the inhibitory conductance change at the postsynaptic sites
To determine the time course of the postsynaptic conductance change at the BC–BC synapse, the somatodendritic domain and the main axon of the postsynaptic BC were reconstructed and converted into a detailed passive cable conductor model. Figure5A shows an electrotonic dendrogram of the postsynaptic BC shown in Figures 3 and 4. In this cell, the synaptic BC–BC contacts were located at electrotonic distances of 0.03, 0.14, and 0.20 λ from the soma. In three reconstructed BCs, the average electrotonic distance was 0.08 λ (range, 0–0.21 λ). Somatic IPSCs (Fig. 5Bb) decayed more slowly than the underlying postsynaptic conductance changes (Fig.5Ba) (0.5–3 msec decay time constant), in agreement with previous results for other types of neurons (Major et al., 1994;Spruston et al., 1994).
To infer the rise time, decay time constant, and amplitude of the postsynaptic conductance change, simultaneous synaptic events were simulated at all morphologically identified transmission sites, and their kinetic parameters and amplitude were varied to describe the experimentally observed average unitary IPSC in the same pair (Fig.5Bc). In the pair shown, the inferred rise and decay time constants of the conductance change at the postsynaptic site were 0.20 and 1.02 msec, respectively. In three fully analyzed pairs, the mean values of the time constants were 0.17 ± 0.04 msec (rise, corresponding to mean 20–80% rise time of 0.14 msec) and 1.8 ± 0.6 msec (decay) (Table 1). Exploration of the parameter space indicates that these estimates are relatively insensitive to the assumptions of the cable model (Fig. 5C).
Electrical coupling between hippocampal interneurons
Electrical synapses between hippocampal interneurons were suggested previously on the basis of dye coupling (Michelson and Wong, 1994) and electron microscopic analysis (Kosaka and Hama, 1985) but have not yet been demonstrated directly. In a subset of BC–BC pairs (14 of 49 pairs), electrical coupling appeared to be present (Fig.6). Both presynaptic action potentials (Fig. 6A) and voltage changes elicited by long current pulses (Fig. 6B) evoked postsynaptic currents that were approximate mirror images of the presynaptic signal. The mean amplitude of the electrical PSC evoked by presynaptic action potentials was 35.7 ± 5 pA (range 14–62 pA). Unlike GABAAR-mediated currents, electrical PSCs showed little amplitude fluctuation from trial to trial and had almost constant amplitude during trains (Fig. 6A). Electrical coupling occurred both in isolation (Fig.6A) (7 of 49 pairs) and in conjunction with chemical transmission (Fig. 6C) (7 of 49 pairs). These results demonstrate that electrical coupling between BCs occurs in the hippocampus but may be less abundant than in the neocortex (Galarreta and Hestrin, 1999; Gibson et al., 1999; Tamás et al., 2000).
Target-cell specificity in the decay time course of the unitary IPSC
The present results suggest that the measured IPSC at BC–BC synapses decays faster than that at the BC–GC synapse in the same microcircuit [amplitude-weighted decay time constant 2.5 msec (this paper) and 6.5 msec (Kraushaar and Jonas, 2000), respectively]. To rule out differences in the experimental conditions as an explanation, we compared IPSCs at BC–BC and BC–GC synapses by sequential triple recordings from a single presynaptic BC and different postsynaptic target cells in the same slice (Fig. 7). In seven sequential triple recordings, both the 20–80% rise time and the synaptic latency were not significantly different between BC–BC and BC–GC synapses (p > 0.5) (Fig.7A,C). However, the decay time constant was 2.2-fold faster for BC–BC synapses (2.4 msec) than for BC–GC synapses (5.2 msec; p ≤ 0.006) (Fig.7A,C). Furthermore, the peak amplitude of the IPSC was slightly, but not significantly, larger (p > 0.2) (Fig. 7D). Finally, the paired-pulse ratio (10 msec interval) was not significantly different (p > 0.2) (Fig.7B,D). These results indicate significant differences in the time course of the inhibitory postsynaptic conductance change that are determined by the nature of the postsynaptic target cell.
Fig. 7.

IPSC decay time constant is determined by the type of the postsynaptic target cell. A, B, Sequential triple recording from a presynaptic BC and a postsynaptic BC (left traces, first pair) and the same presynaptic BC and a postsynaptic GC (right traces, second pair obtained subsequently after pipette removal from the postsynaptic BC). Presynaptic action potential (top), single unitary IPSCs (6 sweeps superimposed, center), and average IPSC (from 22 sweeps, bottom) are depicted. Shown are single action potential in A and pair of two action potentials inB (10 msec interpulse interval). Note the difference in decay time constants but the comparable paired-pulse ratio. The fast inward current preceding the IPSC in the BC–BC traces represents putative electrical coupling. C, Summary bar graphs of 20–80% rise time, latency, and amplitude-weighted average decay time constant. D, Summary bar graphs of peak IPSC amplitude (left) and paired-pulse ratio (A2/A1, 10 msec interval, right). Bars indicate means (with SEMs). Data from seven sequential triple recordings;circles connected by lines represent data from the same triple recording. Note a significant difference in the decay time constant (**p ≤ 0.006), determined by the type of the postsynaptic target cell.
Rapid conductance changes support fast coherent network oscillations
Previous simulations indicated that gamma frequency oscillations emerge in networks of synaptically coupled inhibitory interneurons, emphasizing the importance of the time course of the postsynaptic conductance change [Wang and Buzsáki, (1996); which is referred to as WB model]. However, the properties of unitary connections determined in this paper differed from the assumptions of the WB model: first, the peak conductance change was larger (0.02 mS/cm2vs 0.1 mS/cm2/60), and second, the decay time constant was faster (1.8 vs 10 msec). We therefore examined whether a network model of inhibitory neurons with realistic synaptic properties was able to generate oscillations (Fig.8). AssumingMSyn = 60,Iμ = 3 μA/cm2, and mild heterogeneity (Iς/Iμ= 0.03), fast and synchronized oscillations were generated (Fig.8Aa,b) (fμ = 87 Hz, κ = 0.73). With a slower postsynaptic conductance change (as observed at the BC–GC synapse), the frequency of the oscillations was slower (fμ = 52 Hz), and the coherence was reduced (Fig. 8Ac) (κ = 0.51).
We next analyzed the dependence of mean frequency and coherence on the mean driving current (Fig. 8B,C). Simulations with the fast postsynaptic conductance change revealed that coherent oscillations emerge above a threshold (∼2 μA/cm2 assumingMSyn = 60 andIς/Iμ= 0.03). As coherence emerges, the frequency shows a sharp increase. Simulations with slower postsynaptic conductance changes revealed that the maximal coherence is reduced, and the frequency stays markedly below that obtained with the fast conductance change.
We further analyzed the tolerance of the oscillatory activity against heterogeneity of the excitatory drive (Fig. 8D). In the absence of heterogeneity, population coherence is close to 1 once a threshold is exceeded (Iμ = 3 μA/cm2). If heterogeneity is included, coherence declines, with an e-fold decline at a relative heterogeneityIς/Iμ= 0.12. We finally determined the requirements for connectivity (Fig.8E). Depending on the value of the mean driving current, the threshold for the generation of coherent oscillations was between MSyn = 20 andMSyn = 100 (with mild heterogeneity). These critical values of MSyn appeared to be relatively independent of the total number of neurons in the network (100–500 neurons; data not shown).
Thus, in comparison to the WB network model, our model based on experimentally determined parameter values generates synchronized oscillations at higher frequencies and demonstrates a higher degree of tolerance against heterogeneity but requires larger driving currents.
DISCUSSION
To determine the functional properties of inhibitory synaptic transmission between interneurons and to examine the factors involved in the generation of fast network oscillations in the hippocampus, we combined paired recordings, morphological analysis, and simulations. We focused on the dentate gyrus for two reasons. First, in the behaving rat, gamma oscillations in the dentate gyrus show a markedly higher power and coherence than in hippocampal CA3 or CA1 regions (Bragin et al., 1995). Second, the intrinsic electrical properties of BCs (Martina et al., 1998) and the functional characteristics of input and output synapses in this microcircuit [GC–BC synapses (Geiger et al., 1997); BC–GC synapses (Kraushaar and Jonas, 2000)] are well known. The major finding of this paper is that the time course of the postsynaptic conductance change at the BC–BC synapse is fast (1.8 msec decay time constant at 32°C). We show further that the rapid time course and the large amplitude of the postsynaptic conductance change result in the emergence of robust high-frequency oscillatory activity in interneuron networks if the driving current is sufficiently large.
Interneurons as fast signaling devices
Previous studies showed that interneurons differ from principal cells in several functional and molecular properties, which converge on a faster signaling time course in interneurons. BCs show a fast membrane time constant (∼10 msec) (Geiger et al., 1997), presumably because of the expression of a high density of leak channels. BCs have action potentials that are shorter than those in pyramidal cells and are able to generate high-frequency trains of spikes both in vitro (McCormick et al., 1985; Martina et al., 1998) and in vivo (Bragin et al., 1995; Csicsvari et al., 1999). These specific electrical properties appear to be generated by the expression of a molecularly distinct set of voltage-gated K+ channels (Martina et al., 1998). Furthermore, BCs receive extremely rapid synaptic excitation, which is caused by the expression of distinct AMPA receptor subunits (for review, see Geiger et al., 1999). The fast time course of inhibition observed here suggests that interneurons operate as coincidence detectors not only for excitation (Geiger et al., 1997) but also for inhibition. The observation of electrical coupling between interneurons, presumably via gap junction channels (Dermietzel and Spray, 1993), lends further support to the hypothesis of coincidence detection in interneurons, mediating the fastest possible form of intercellular signaling.
Target cell-specific differences in IPSC time course
The major difference between BC–BC synapses and BC–GC synapses is the time course of the postsynaptic conductance change. The mean decay time constant of the IPSC at the BC–BC synapse is approximately two-fold faster than that at the BC–GC synapse (Otis and Mody, 1992;Kraushaar and Jonas, 2000; this paper).
One possibility to explain the differences in the kinetics of IPSCs is the differential expression of GABAAR subunits in different types of postsynaptic target cells. Analysis of recombinant GABAARs revealed that α1β1γ2channels deactivate markedly faster than α2β1γ2channels (Lavoie et al., 1997). Indeed, parvalbumin-positive interneurons express the α1GABAAR subunit at higher levels than principal cells (Gao and Fritschy, 1994; Fritschy and Mohler, 1995; Nusser et al., 1995).
Alternatively, the differences in IPSC kinetics may be caused by differential modulation, dependent on the type of the postsynaptic target cell. Immunocytochemical evidence suggests that interneurons, unlike principal cells, do not express calcineurin (Sík et al., 1998). In cultured neurons, inhibitors of calcineurin were shown to accelerate the decay of autaptic IPSCs and the deactivation of GABAARs (Jones and Westbrook, 1997). Although the relation between these inhibitory neurons in culture (Jones and Westbrook, 1997) and the BCs in slices (this paper) is unclear, the results suggest the possibility that a lack of calcineurin expression may underlie the fast decay of IPSCs.
Differences in IPSC kinetics will also have direct implications for network function in vivo. Because putative BCs generate action potentials at high frequency during exploratory activity (Bragin et al., 1995; Penttonen et al., 1998), their output will lead to phasic, precisely timed inhibition of other interneurons but more tonic inhibition of principal cells under these conditions.
Presynaptic homogeneity of BC output synapses
BC–BC and BC–GC synapses show similarities in several properties that are thought to be indicators of presynaptic function. First, the reliability of transmission, as assessed by the percentage of failures, is very similar at the two synapses, implying a high release probability and the presence of multiple release sites. Second, both synapses show paired-pulse and multiple-pulse depression, with similar extent and time course (Kraushaar and Jonas, 2000; this paper). This implies that the presynaptic mechanisms underlying PPD and multiple-pulse depression are expressed homogeneously, independent of the identity of the postsynaptic target cell. One factor that could contribute to this homogeneity is the expression of the Ca2+-binding protein parvalbumin in basket cell presynaptic elements, which shapes short-term plasticity at inhibitory synapses (Caillard et al., 2000).
A functional implication of presynaptic homogeneity is that the balance between excitation and inhibition is maintained during in vivo activity patterns, where GABAergic interneurons generate action potentials over a wide range of frequencies with mean values of 10–20 Hz (Penttonen et al., 1998; Csicsvari et al., 1999). Under these conditions the strength of inhibition of interneurons and principal neurons will be modulated in a parallel manner.
Comparison with other brain regions
The difference in the IPSC decay time constant between BCs and GCs in the hippocampus resembles a previously reported difference between Purkinje and granule cells in the cerebellum (Puia et al., 1994). However, an opposite difference was suggested between stratum radiatum interneurons and pyramidal cells of the hippocampal CA1 region, based on recordings of spontaneous IPSCs (Hájos and Mody, 1997). In the somatosensory cortex, the IPSC decay time course at morphologically identified interneuron–interneuron synapses is comparable to that at interneuron–pyramidal cell synapses (decay time constant 8 msec) (Gupta et al., 2000; Tamás et al., 2000). Although the voltage-clamp conditions have remained undefined, the latter studies suggest that regional differences in target-cell specificity may exist.
Functional significance of fast IPSCs for the generation of network oscillations
Previous theoretical studies showed that networks of synaptically coupled inhibitory neurons can produce oscillations in the gamma frequency range (Wang and Buzsáki, 1996). Although the functional properties of BC–BC synapses reported here are generally consistent with the assumptions of the WB model, two major differences emerge. First, we find that the decay time course of the postsynaptic conductance change is 1.8 msec, which is at the limits of the range in which stable coherent oscillations are generated in the WB model (Wang and Buzsáki, 1996, their Fig. 10C). Second, we estimate that the unitary postsynaptic conductance change at BC–BC synapses is 0.02 mS/cm2 (see Materials and Methods). In contrast, the unitary postsynaptic conductance change in the WB model is only 0.002 mS/cm2 forMSyn = 60 (0.1 mS/cm2/MSyn).
Given these differences between experimental observations and the WB model, we have simulated the activity of an inhibitory interneuron network model with fast conductance change and high coupling strength (Fig. 8). A model based on these assumptions was able to generate coherent oscillations with high frequency (>60 Hz) but required a strong excitatory drive, resembling the scenario in the “strong coupling regime” (Neltner et al., 2000). Replacing the fast conductance change of BC–BC synapses by the slower conductance change at BC–GC synapses reduced both coherence and frequency, indicating that the fast conductance change at GABAergic synapses has a critical role in the generation of high-frequency oscillations.
Our interneuron model shows higher tolerance against heterogeneity than the WB model. An e-fold decrease in coherence corresponds to a heterogeneity ofIς/Iμ= 0.12 in our model, but to <0.05 in the WB model (Wang and Buzsáki, 1996, their Fig. 5A). Furthermore, the connectivity requirements in our simulations appear to be less strict than in the WB model; with a large excitatory drive, anMSyn of 20 is sufficient to produce coherent oscillations. Synchronized activity may be promoted by electrical coupling (Fig. 6) (Draguhn et al., 1998; P. Jonas, unpublished data) and fast synaptic excitation of interneurons (Geiger et al., 1997; Pauluis et al., 1999), but additional simulations are required to examine the quantitative influence of these factors on frequency and coherence.
Fast inhibition: the synaptic basis for gamma oscillations in the dentate gyrus in vivo?
Could our model of inhibitory interneurons be a substrate of the generation of gamma frequency oscillations in the dentate gyrusin vivo? Three lines of evidence may support this view. First, the high oscillation frequency in the model is in good agreement with that observed in the dentate gyrus in vivo (80 Hz) (Bragin et al., 1995). Second, the requirement for a strong excitatory drive may explain the disappearance of gamma oscillations after lesioning of the entorhinal input (Bragin et al., 1995, their Fig. 8). Third, synchronization develops rapidly from a perturbed state of the network, within a few cycles (Fig. 8A), suggesting that synchronization takes place in vivo under conditions in which the excitatory drive varies in a theta-modulated manner. Thus an interneuron network based on fast conductance changes, which oscillates with high frequency and coherence, may represent a clock signal for efficient and reliable temporal encoding of information in the dentate gyrus–CA3 network.
Footnotes
This work was supported by grants of the Deutsche Forschungsgemeinschaft (SFB 505/C6) and the Human Frontiers Science Program Organization (RG0017/1998-B). We thank Drs. M. V. Jones, J. Bischofberger, and U. Kraushaar for critically reading this manuscript. We also thank B. Taskin and A. Roth for advice in the use of reconstruction and modeling software, and S. Nestel, M. Winter, and A. Blomenkamp for technical assistance.
M.B. and I.V. contributed equally to this work.
Correspondence should be addressed to Dr. P. Jonas, Physiologisches Institut, Universität Freiburg, Hermann-Herder-Strasse 7, D-79104 Freiburg, Germany. E-mail: jonasp@uni-freiburg.de.
REFERENCES
- 1.Acsády L, Katona I, Martínez-Guijarro FJ, Buzsáki G, Freund TF. Unusual target selectivity of perisomatic inhibitory cells in the hilar region of the rat hippocampus. J Neurosci. 2000;20:6907–6919. doi: 10.1523/JNEUROSCI.20-18-06907.2000. [DOI] [PMC free article] [PubMed] [Google Scholar]
- 2.Bragin A, Jandó G, Nádasdy Z, Hetke J, Wise K, Buzsáki G. Gamma (40–100 Hz) oscillation in the hippocampus of the behaving rat. J Neurosci. 1995;15:47–60. doi: 10.1523/JNEUROSCI.15-01-00047.1995. [DOI] [PMC free article] [PubMed] [Google Scholar]
- 3.Buhl EH, Halasy K, Somogyi P. Diverse sources of hippocampal unitary inhibitory postsynaptic potentials and the number of synaptic release sites. Nature. 1994;368:823–828. doi: 10.1038/368823a0. [DOI] [PubMed] [Google Scholar]
- 4.Buzsáki G, Chrobak JJ. Temporal structure in spatially organized neuronal ensembles: a role for interneuronal networks. Curr Opin Neurobiol. 1995;5:504–510. doi: 10.1016/0959-4388(95)80012-3. [DOI] [PubMed] [Google Scholar]
- 5.Caillard O, Moreno H, Schwaller B, Llano I, Celio MR, Marty A. Role of the calcium-binding protein parvalbumin in short-term synaptic plasticity. Proc Natl Acad Sci USA. 2000;97:13372–13377. doi: 10.1073/pnas.230362997. [DOI] [PMC free article] [PubMed] [Google Scholar]
- 6.Cobb SR, Buhl EH, Halasy K, Paulsen O, Somogyi P. Synchronization of neuronal activity in hippocampus by individual GABAergic interneurons. Nature. 1995;378:75–78. doi: 10.1038/378075a0. [DOI] [PubMed] [Google Scholar]
- 7.Cobb SR, Halasy K, Vida I, Nyiri G, Tamás G, Buhl EH, Somogyi P. Synaptic effects of identified interneurons innervating both interneurons and pyramidal cells in the rat hippocampus. Neuroscience. 1997;79:629–648. doi: 10.1016/s0306-4522(97)00055-9. [DOI] [PubMed] [Google Scholar]
- 8.Csicsvari J, Hirase H, Czurkó A, Mamiya A, Buzsáki G. Oscillatory coupling of hippocampal pyramidal cells and interneurons in the behaving rat. J Neurosci. 1999;19:274–287. doi: 10.1523/JNEUROSCI.19-01-00274.1999. [DOI] [PMC free article] [PubMed] [Google Scholar]
- 9.Dermietzel R, Spray DC. Gap junctions in the brain: where, what type, how many and why? Trends Neurosci. 1993;16:186–192. doi: 10.1016/0166-2236(93)90151-b. [DOI] [PubMed] [Google Scholar]
- 10.Draguhn A, Traub RD, Schmitz D, Jefferys JGR. Electrical coupling underlies high-frequency oscillations in the hippocampus in vitro. Nature. 1998;394:189–192. doi: 10.1038/28184. [DOI] [PubMed] [Google Scholar]
- 11.Freund TF, Buzsáki G. Interneurons of the hippocampus. Hippocampus. 1996;6:347–470. doi: 10.1002/(SICI)1098-1063(1996)6:4<347::AID-HIPO1>3.0.CO;2-I. [DOI] [PubMed] [Google Scholar]
- 12.Fritschy J-M, Mohler H. GABAA-receptor heterogeneity in the adult rat brain: differential regional and cellular distribution of seven major subunits. J Comp Neurol. 1995;359:154–194. doi: 10.1002/cne.903590111. [DOI] [PubMed] [Google Scholar]
- 13.Galarreta M, Hestrin S. A network of fast-spiking cells in the neocortex connected by electrical synapses. Nature. 1999;402:72–75. doi: 10.1038/47029. [DOI] [PubMed] [Google Scholar]
- 14.Gao B, Fritschy JM. Selective allocation of GABAA receptors containing the α1 subunit to neurochemically distinct subpopulations of rat hippocampal interneurons. Eur J Neurosci. 1994;6:837–853. doi: 10.1111/j.1460-9568.1994.tb00994.x. [DOI] [PubMed] [Google Scholar]
- 15.Geiger JRP, Lübke J, Roth A, Frotscher M, Jonas P. Submillisecond AMPA receptor-mediated signaling at a principal neuron-interneuron synapse. Neuron. 1997;18:1009–1023. doi: 10.1016/s0896-6273(00)80339-6. [DOI] [PubMed] [Google Scholar]
- 16.Geiger JRP, Roth A, Taskin B, Jonas P. Glutamate-mediated synaptic excitation of cortical interneurons. In: Jonas P, Monyer H, editors. Ionotropic glutamate receptors in the CNS, handbook of experimental pharmacology 141. Springer; Berlin: 1999. pp. 363–398. [Google Scholar]
- 17.Gibson JR, Beierlein M, Connors BW. Two networks of electrically coupled inhibitory neurons in neocortex. Nature. 1999;402:75–79. doi: 10.1038/47035. [DOI] [PubMed] [Google Scholar]
- 18.Gulyás AI, Megías M, Emri Z, Freund TF. Total number and ratio of excitatory and inhibitory synapses converging onto single interneurons of different types in the CA1 area of the rat hippocampus. J Neurosci. 1999;19:10082–10097. doi: 10.1523/JNEUROSCI.19-22-10082.1999. [DOI] [PMC free article] [PubMed] [Google Scholar]
- 19.Gupta A, Wang Y, Markram H. Organizing principles for a diversity of GABAergic interneurons and synapses in the neocortex. Science. 2000;287:273–278. doi: 10.1126/science.287.5451.273. [DOI] [PubMed] [Google Scholar]
- 20.Hájos N, Mody I. Synaptic communication among hippocampal interneurons: properties of spontaneous IPSCs in morphologically identified cells. J Neurosci. 1997;17:8427–8442. doi: 10.1523/JNEUROSCI.17-21-08427.1997. [DOI] [PMC free article] [PubMed] [Google Scholar]
- 21.Han Z-S, Buhl EH, Lörinczi Z, Somogyi P. A high degree of spatial selectivity in the axonal and dendritic domains of physiologically identified local-circuit neurons in the dentate gyrus of the rat hippocampus. Eur J Neurosci. 1993;5:395–410. doi: 10.1111/j.1460-9568.1993.tb00507.x. [DOI] [PubMed] [Google Scholar]
- 22.Hines ML, Carnevale NT. The NEURON simulation environment. Neural Comput. 1997;9:1179–1209. doi: 10.1162/neco.1997.9.6.1179. [DOI] [PubMed] [Google Scholar]
- 23.Hodgkin AL, Huxley AF. A quantitative description of membrane current and its application to conduction and excitation in nerve. J Physiol (Lond) 1952;117:500–544. doi: 10.1113/jphysiol.1952.sp004764. [DOI] [PMC free article] [PubMed] [Google Scholar]
- 24.Jones MV, Westbrook GL. Desensitized states prolong GABAA channel responses to brief agonist pulses. Neuron. 1995;15:181–191. doi: 10.1016/0896-6273(95)90075-6. [DOI] [PubMed] [Google Scholar]
- 25.Jones MV, Westbrook GL. Shaping of IPSCs by endogenous calcineurin activity. J Neurosci. 1997;17:7626–7633. doi: 10.1523/JNEUROSCI.17-20-07626.1997. [DOI] [PMC free article] [PubMed] [Google Scholar]
- 26.Koh D-S, Geiger JRP, Jonas P, Sakmann B. Ca2+- permeable AMPA and NMDA receptor channels in basket cells of rat hippocampal dentate gyrus. J Physiol (Lond) 1995;485:383–402. doi: 10.1113/jphysiol.1995.sp020737. [DOI] [PMC free article] [PubMed] [Google Scholar]
- 27.Kosaka T, Hama K. Gap junctions between non-pyramidal cell dendrites in the rat hippocampus (CA1 and CA3 regions): a combined Golgi-electron microscopy study. J Comp Neurol. 1985;231:150–161. doi: 10.1002/cne.902310203. [DOI] [PubMed] [Google Scholar]
- 28.Kraushaar U, Jonas P. Efficacy and stability of quantal GABA release at a hippocampal interneuron-principal neuron synapse. J Neurosci. 2000;20:5594–5607. doi: 10.1523/JNEUROSCI.20-15-05594.2000. [DOI] [PMC free article] [PubMed] [Google Scholar]
- 29.Lacaille J-C, Schwartzkroin PA. Stratum lacunosum-moleculare interneurons of hippocampal CA1 region. II. Intrasomatic and intradendritic recordings of local circuit synaptic interactions. J Neurosci. 1988;8:1411–1424. doi: 10.1523/JNEUROSCI.08-04-01411.1988. [DOI] [PMC free article] [PubMed] [Google Scholar]
- 30.Lavoie AM, Tingey JJ, Harrison NL, Pritchett DB, Twyman RE. Activation and deactivation rates of recombinant GABAA receptor channels are dependent on α-subunit isoform. Biophys J. 1997;73:2518–2526. doi: 10.1016/S0006-3495(97)78280-8. [DOI] [PMC free article] [PubMed] [Google Scholar]
- 31.Major G, Larkman AU, Jonas P, Sakmann B, Jack JJB. Detailed passive cable models of whole-cell recorded CA3 pyramidal neurons in rat hippocampal slices. J Neurosci. 1994;14:4613–4638. doi: 10.1523/JNEUROSCI.14-08-04613.1994. [DOI] [PMC free article] [PubMed] [Google Scholar]
- 32.Malinow R, Tsien RW. Presynaptic enhancement shown by whole-cell recordings of long-term potentiation in hippocampal slices. Nature. 1990;346:177–180. doi: 10.1038/346177a0. [DOI] [PubMed] [Google Scholar]
- 33.Martina M, Schultz JH, Ehmke H, Monyer H, Jonas P. Functional and molecular differences between voltage-gated K+ channels of fast-spiking interneurons and pyramidal neurons of rat hippocampus. J Neurosci. 1998;18:8111–8125. doi: 10.1523/JNEUROSCI.18-20-08111.1998. [DOI] [PMC free article] [PubMed] [Google Scholar]
- 34.Martina M, Vida I, Jonas P. Distal initiation and active propagation of action potentials in interneuron dendrites. Science. 2000;287:295–300. doi: 10.1126/science.287.5451.295. [DOI] [PubMed] [Google Scholar]
- 35.McCormick DA, Connors BW, Lighthall JW, Prince DA. Comparative electrophysiology of pyramidal and sparsely spiny stellate neurons of the neocortex. J Neurophysiol. 1985;54:782–806. doi: 10.1152/jn.1985.54.4.782. [DOI] [PubMed] [Google Scholar]
- 36.Michelson HB, Wong RKS. Synchronization of inhibitory neurones in the guinea-pig hippocampus in vitro. J Physiol (Lond) 1994;477:35–45. doi: 10.1113/jphysiol.1994.sp020169. [DOI] [PMC free article] [PubMed] [Google Scholar]
- 37.Miles R, Tóth K, Gulyás AI, Hájos N, Freund TF. Differences between somatic and dendritic inhibition in the hippocampus. Neuron. 1996;16:815–823. doi: 10.1016/s0896-6273(00)80101-4. [DOI] [PubMed] [Google Scholar]
- 38.Neltner L, Hansel D, Mato G, Meunier C. Synchrony in heterogeneous networks of spiking neurons. Neural Comput. 2000;12:1607–1641. doi: 10.1162/089976600300015286. [DOI] [PubMed] [Google Scholar]
- 39.Nusser Z, Roberts JDB, Baude A, Richards JG, Sieghart W, Somogyi P. Immunocytochemical localization of the α1 and β2/3 subunits of the GABAA receptor in relation to specific GABAergic synapses in the dentate gyrus. Eur J Neurosci. 1995;7:630–646. doi: 10.1111/j.1460-9568.1995.tb00667.x. [DOI] [PubMed] [Google Scholar]
- 40.Otis TS, Mody I. Modulation of decay kinetics and frequency of GABAA receptor-mediated spontaneous inhibitory postsynaptic currents in hippocampal neurons. Neuroscience. 1992;49:13–32. doi: 10.1016/0306-4522(92)90073-b. [DOI] [PubMed] [Google Scholar]
- 41.Pauluis Q, Baker SN, Olivier E. Emergent oscillations in a realistic network: the role of inhibition and the effect of the spatiotemporal distribution of the input. J Comput Neurosci. 1999;6:27–48. doi: 10.1023/a:1008804916112. [DOI] [PubMed] [Google Scholar]
- 42.Penttonen M, Kamondi A, Acsády L, Buzsáki G. Gamma frequency oscillation in the hippocampus of the rat: intracellular analysis in vivo. Eur J Neurosci. 1998;10:718–728. doi: 10.1046/j.1460-9568.1998.00096.x. [DOI] [PubMed] [Google Scholar]
- 43.Puia G, Costa E, Vicini S. Functional diversity of GABA-activated Cl− currents in Purkinje versus granule neurons in rat cerebellar slices. Neuron. 1994;12:117–126. doi: 10.1016/0896-6273(94)90157-0. [DOI] [PubMed] [Google Scholar]
- 44.Ritz R, Sejnowski TJ. Synchronous oscillatory activity in sensory systems: new vistas on mechanisms. Curr Opin Neurobiol. 1997;7:536–546. doi: 10.1016/s0959-4388(97)80034-7. [DOI] [PubMed] [Google Scholar]
- 45.Sik A, Penttonen M, Ylinen A, Buzsáki G. Hippocampal CA1 interneurons: an in vivo intracellular labeling study. J Neurosci. 1995;15:6651–6665. doi: 10.1523/JNEUROSCI.15-10-06651.1995. [DOI] [PMC free article] [PubMed] [Google Scholar]
- 46.Sík A, Hájos N, Gulácsi A, Mody I, Freund TF. The absence of a major Ca2+ signaling pathway in GABAergic neurons of the hippocampus. Proc Natl Acad Sci USA. 1998;95:3245–3250. doi: 10.1073/pnas.95.6.3245. [DOI] [PMC free article] [PubMed] [Google Scholar]
- 47.Spruston N, Jaffe DB, Johnston D. Dendritic attenuation of synaptic potentials and currents: the role of passive membrane properties. Trends Neurosci. 1994;17:161–166. doi: 10.1016/0166-2236(94)90094-9. [DOI] [PubMed] [Google Scholar]
- 48.Stevens CF, Tsujimoto T. Estimates for the pool size of releasable quanta at a single central synapse and for the time required to refill the pool. Proc Natl Acad Sci USA. 1995;92:846–849. doi: 10.1073/pnas.92.3.846. [DOI] [PMC free article] [PubMed] [Google Scholar]
- 49.Stuart GJ, Dodt H-U, Sakmann B. Patch-clamp recordings from the soma and dendrites of neurons in brain slices using infrared video microscopy. Pflügers Arch. 1993;423:511–518. doi: 10.1007/BF00374949. [DOI] [PubMed] [Google Scholar]
- 50.Tamás G, Buhl EH, Lörincz A, Somogyi P. Proximally targeted GABAergic synapses and gap junctions synchronize cortical interneurons. Nat Neurosci. 2000;3:366–371. doi: 10.1038/73936. [DOI] [PubMed] [Google Scholar]
- 51.Tiesinga PHE, José JV. Robust gamma oscillations in networks of inhibitory hippocampal interneurons. Network: Comput Neural Syst. 2000;11:1–23. [PubMed] [Google Scholar]
- 52.Traub RD, Jefferys JGR, Whittington MA. Fast oscillations in cortical circuits. MIT; Cambridge, MA: 1999. [Google Scholar]
- 53.Wang X-J, Buzsáki G. Gamma oscillation by synaptic inhibition in a hippocampal interneuronal network model. J Neurosci. 1996;16:6402–6413. doi: 10.1523/JNEUROSCI.16-20-06402.1996. [DOI] [PMC free article] [PubMed] [Google Scholar]
- 54.White JA, Chow CC, Ritt J, Soto-Treviño C, Kopell N. Synchronization and oscillatory dynamics in heterogeneous, mutually inhibited neurons. J Comput Neurosci. 1998;5:5–16. doi: 10.1023/a:1008841325921. [DOI] [PubMed] [Google Scholar]
- 55.Whittington MA, Traub RD, Jefferys JGR. Synchronized oscillations in interneuron networks driven by metabotropic glutamate receptor activation. Nature. 1995;373:612–615. doi: 10.1038/373612a0. [DOI] [PubMed] [Google Scholar]