

Abstract
GABA receptors within the mesolimbic circuitry have been proposed to play a role in regulating alcohol-seeking behaviors in the alcohol-preferring (P) rat. However, the precise GABAAreceptor subunit(s) mediating the reinforcing properties of EtOH remains unknown. We examined the capacity of intrahippocampal infusions of an α5 subunit-selective (∼75-fold) benzodiazepine (BDZ) inverse agonist [i.e., RY 023 (RY) (tert-butyl 8-(trimethylsilyl) acetylene-5,6-dihydro-5-methyl-6-oxo-4H-imidazo [1,5a] [1,4] benzodiazepine-3-carboxylate)] to alter lever pressing maintained by concurrent presentation of EtOH (10% v/v) and a saccharin solution (0.05% w/v). Bilateral (1.5–20 μg) and unilateral (0.01–40 μg) RY dose-dependently reduced EtOH-maintained responding, with saccharin-maintained responding being reduced only with the highest doses (e.g., 20 and 40 μg). The competitive BDZ antagonist ZK 93426 (ZK) (7 μg) reversed the RY-induced suppression on EtOH-maintained responding, confirming that the effect was mediated via the BDZ site on the GABAA receptor complex. Intrahippocampal modulation of the EtOH-maintained responding was site-specific; no antagonism by RY after intra-accumbens [nucleus accumbens (NACC)] and intraventral tegmental [ventral tegmental area (VTA)] infusions was observed. Because the VTA and NACC contain very high densities of α1 and α2 subunits, respectively, we determined whether RY exhibited a “negative” or “neutral” pharmacological profile at recombinant α1β3γ2, α2β3γ2, and α5β3γ2 receptors expressed in Xenopus oocytes. RY produced “classic” inverse agonism at all α receptor subtypes; thus, a neutral efficacy was not sufficient to explain the failure of RY to alter EtOH responding in the NACC or VTA. The results provide the first demonstration that the α5-containing GABAA receptors in the hippocampus play an important role in regulating EtOH-seeking behaviors.
Keywords: ethanol, GABA, α5 subunit, reinforcement, hippocampus, alcohol-preferring (P) rat
Pharmacological studies support an involvement of GABAA receptor mechanisms in regulating EtOH-seeking behaviors (June et al., 1998a,b; McBride and Li, 1998). Direct infusion of negative GABAergic modulators [e.g., GABAA antagonists and benzodiazepine (BDZ) inverse agonists] in the extended amygdala and its afferent projection sites have provided convincing evidence supporting the role for GABAergic mechanisms in alcohol euphoric properties (Hodge et al., 1995; June et al., 1998a,b; Koob et al., 1998). However, these compounds are “nonselective” GABA antagonists and are therefore not capable of dissecting out potential roles of specific GABAA receptor subunits in regulating EtOH-seeking behaviors. Furthermore, the remarkable heterogeneity in many traditional EtOH reward substrates (Fritschy and Mohler, 1995) have precluded study of the precise GABAAsubunit(s) mediating EtOH-seeking behavior.
RY 023 (RY) [tert-butyl 8-(trimethylsilyl) acetylene-5,6-dihydro-5-methyl-6-oxo-4H-imidazo [1,5a] [1,4] benzodiazepine-3-carboxylate] is one of a series of 8-substituted imidazobenzodiazepine inverse agonists (Lui et al., 1995, 1996;Skolnick et al., 1997) developed from the anti-EtOH agent Ro 15–4513 (Suzdak et al., 1986). RY exhibits both high affinity (Ki of ∼2.7 nm) and selectivity (∼75-fold) at recombinant GABAA receptors composed of α5β2γ2 subunits (Lui et al., 1996). At recombinant α5β2γ2 receptors expressed inXenopus oocytes, it produces a small reduction in GABA binding (∼25 ± 5%), and its convulsant activity is seen only with high doses (CD50 ≥ 40 mg/kg). This contrasts the efficacy profile common to the nonselective negative GABAergic modulators [e.g., bicuculline, 2-(3-carboxypropyl)-3-amino-6-(4methoxyphenyl)pyridazinium bromide, and picrotoxin] (Lui et al., 1995, 1996). Thus, RY represents an “ideal” pharmacological tool to explore the role of the α5 subunit in the neurobehavioral effects of alcohol.
Although the α5 subunits are minor constituents of the total GABAA receptor pool, immunocytochemical,in situ hybridization, and radioligand binding studies show that the CA1, CA2, and CA3 fields are enriched in this subunit compared with other brain areas (Wisden et al., 1992; Fritschy and Mohler, 1995;Sur et al., 1999). The CA1 and CA3 hippocampal fields are particularly interesting candidate sites for the study of alcohol-motivated behaviors because projections from the CA1 and CA3 fields, via the subiculum, innervate several putative EtOH reward substrates [e.g., nucleus accumbens (NACC), amygdala, bed nucleus of the stria terminalis, hypothalamus, and olfactory tubercle] (Kelley and Domesick, 1982; Groenewegen et al., 1987; Amaral and Witter, 1995).
We tested the hypothesis that the α5 subunits of the CA1 and CA3 hippocampal fields would regulate EtOH-motivated behaviors in the alcohol preferring (P) rat. To accomplish this, the actions of bilateral and unilateral microinjections of RY in the CA1 and CA3 hippocampal fields were evaluated for their capacity to reduce EtOH-maintained responding. The degree of neuroanatomical specificity produced by RY was examined after both bilateral and unilateral control injections into the NACC and ventral tegmental area (VTA). Unlike the hippocampal fields, these brain areas possess high levels of α2 and α1 subunit activity, respectively (Wisden et al., 1992; Turner et al., 1993; Fritschy and Mohler, 1995). The specificity of RY on consummatory responding was evaluated by determining the effects of RY in P rats whose response rates for EtOH (10% v/v) and saccharin solutions (0.05% w/v) were similar at basal levels.
MATERIALS AND METHODS
Subjects
Female selectively bred P (n = 83) rats from the S47 and S48 generations (Lumeng et al., 1995) were ∼4–5 months of age at the beginning of the experiment. During this period, the rats weighed between 195 and 265 gm. No effects of estrous cycle have been observed on EtOH drinking patterns in female P rats (McKinzie et al., 1996), and female P rats maintain their body weights within a range that allows for more accurate stereotaxic placement than male P rats (Nowak et al., 1998). Animals were individually housed in wire-mesh stainless steel cages or plastic tubs. The vivarium was maintained at an ambient temperature of 21°C and was on a normal 12 hr light/dark cycle. All rats were provided ad libitum access to food and water, except during the first 2 d of the training phase wherein rats were fluid-deprived 23 hr daily (see below). Thereafter, rats were maintained on ad libitum food and water. All training and experimental sessions took place between 10:00 A.M. and 3:00 P.M. All procedures were conducted in strict adherence with the NIH Guide for the Care and Use of Laboratory Animals.
Synthesis of RY 023
Isotoic anhydride was heated with sarcosine in DMSO to provide the known intermediate 1,4-benzodiazepine. Then the aromatic ring of this 1,4-benzodiazepine was brominated by bromine in acetic acid in the presence of sodium acetate to give the 7-bromo-1,4-benzodiazepine in high yield. Conversion of the 7-bromo-1,4-benzodiazepine into the 8-bromoimidazobenzodiazepine was then accomplished according to the published work of Gu et al. (1993) and Austin et al. (1981). A Heck type coupling reaction of this 8-bromoimidazobenzodiazepine was used to install the trimethylsilyl acetylene functionality at position 8 of the imidazobenzodiazepine nucleus. The Heck coupling reaction provided RY in excellent yield.
Other drugs and solutions
EtOH (10% v/v) and saccharin solutions (0.05% w/v) were prepared for the operant chamber as described previously (June et al., 1998a,b). The competitive BDZ antagonists ZK 93426 (ZK) (Schering, Berlin, Germany), flumazenil (Ro 15–1788), and the inverse agonist Ro 15–4513 (Hoffman La Roche, Nutley, NJ) were donated as gifts.
Behavioral testing apparatus
Behavioral testing was conducted in 15 standard operant chambers (Coulbourn Instruments, Allentown, PA) equipped with two removable levers and two dipper fluid delivery systems enclosed in sound-attenuated cubicles as described previously (June et al., 1998a–c). All dipper presentations provided a 1.5 sec access to a 0.1 ml dipper, followed by a 3 sec time-out period. Above each lever, three stimulus lights (red, green, and yellow) were present, and a stimulus delivery–reinforcer was indicated by illumination of the middle (green) stimulus light. Responses and reinforcements were recorded and controlled by 486 IBM computers using the 4.0 Coulburn L2T2 operant software package.
Behavioral training in the operant chamber
A concurrent fixed-ratio (FR) schedule was used to investigate the capacity of direct microinjections of RY to selectively reduce EtOH and saccharin-maintained responding. The specific details of these procedures have been described recently (June et al., 1998f, 1999). In brief, rats were initially trained to orally self-administer EtOH and water in daily 60 min sessions on a concurrent FR1 schedule. After a period of stabilization on the FR1 schedule, the response requirement was increased to a concurrent FR4 schedule. After stabilization on the FR4 schedule, a series of preliminary studies were conducted to determine the saccharin concentration that produced response rates and profiles similar to that of EtOH (June et al., 1998f, 1999). Of the saccharin concentrations tested, the 0.025 and 0.05% w/v concentrations produced response rates and profiles of responding that were similar to those of EtOH (see below). Stabilization on the concurrent FR4 schedule for EtOH and the saccharin concentrations (0.05% or 0.025% w/v) was conducted for 3–4 additional weeks before beginning the drug treatment phase. Responding was considered stable when responses were within ±20% of the average responses for 5 consecutive days. The position of the levers and associated dippers for each reinforcer was alternated on each session to control for the establishment of lever preference under all concurrent schedules. The importance of alternative and concurrently presented reinforcers in examining the positive reinforcing properties of drugs of abuse has been discussed previously (Carroll et al., 1989;Heyman and Oldfather, 1992; Meisch and Lemaire, 1993) (for a more recent discussion, see June et al., 1998f, 1999; Rodefer et al., 1999).
Experiments 1 and 2 (Microinjection studies)
Assignment to surgical groups. Because only selected rats, despite extensive training, were capable of lever pressing concurrently for EtOH (10% v/v) and a saccharin reinforcer at relatively similar rates of responding, only rats that evidenced response rates of at least 65–80% of the alternative reinforcer were selected to evaluate the drug treatments (for more details, see June et al., 1998f, 1999). Using this criterion, 83 rats were selected to participate in the study. Of these, 14 rats lever pressed for 10% (v/v) EtOH and 0.05% (w/v) saccharin at similar rates, whereas the remaining 69 lever pressed for 10% (v/v) EtOH and 0.025% (w/v) saccharin at similar rates. Of the 69 rats, 14 were then randomly assigned to the hippocampal group, 14 to the VTA group and 14 to the NACC group. These rats were used in experiment 1 for bilateral implantation. From the remaining 27 rats, nine were randomly assigned to a second hippocampal group, nine to a second VTA group, and nine to a second NACC group. These rats were used in experiment 2 for unilateral implantation. The unilateral study was conducted to determine whether occupancy of GABAA receptors containing α5 subunits in a single hemisphere would be sufficient to produce antagonism of EtOH-maintained responding. Previously, we reported that unilateral injections in the NACC of nonselective imidazobenzodiazepines were capable of producing antagonism of EtOH-motivated responding (June et al., 1998a).
Implantation of guide cannulas. Standard stainless steel guide cannulas (26 gauge) were stereotaxically implanted bilaterally and unilaterally in the hippocampus [anteroposterior (AP), −4.8; mediolateral (ML), ±3.0; dorsoventral (DV) −3.8 (CA1); DV, −4.8 (CA3)], VTA [AP, −5.7; ML, ±1.6; DV, −9.2], and NACC [AP, +2.0; ML, ±1.4; DV, −7.2]. The coordinates are given in millimeters relative to bregma based on the Paxinos and Watson (1998) atlas. In the bilateral hippocampal group, seven received implants in the CA1, whereas the remaining seven received implants in the CA3. In the unilateral hippocampal group, five rats received implants in the CA1, whereas the remaining four received implants in the CA3. Rats were given 7 d to recover from surgery before returning to training in the operant chamber.
Microinjection procedures. The infusions were delivered immediately before the operant session with a Harvard infusion pump, during which time animals were able to move about freely in their home cages. The injection cannula extended 1 mm beyond the tip of the guide cannulas. When RY was microinjected into a brain locus, it was dissolved in artificial CSF (aCSF) (composition in mm: 120 NaCl, 4.8 KCl, 1.2 KH2PO4, 1.2 MgSO4, 25 NaHCO3, 2.5 CaCl2, and 10 d-glucose). The competitive BDZ antagonist ZK was prepared in a similar manner whether given alone or in combination with RY (for details, see June et al., 1998b). When necessary, HCl acid or NaOH was added to the solutions to adjust pH levels to ∼7.4 ± 0.1. RY (0–40 μg) or aCSF was infused bilaterally for 5 min at a rate of 0.1 μl/1 min using a 28 gauge injector cannula. The injector cannula was connected by polyethylene tubing to a 10 μl Hamilton microsyringe. The injection volume delivered to each hemisphere was 0.5 μl, with a total injection volume for both the left and right hemispheres of 1 μl. Thus, if a rat received a drug treatment of 20 μg, both the left and right hemispheres received 10 μg in a volume of 0.5 μl. Rats receiving unilateral infusions received their drug dose in a total injection volume of 1 μl. After completion of the 5 min infusion period, the injector was left in place for an additional 1 min to allow diffusion from the needle tip. In experiment 1, the competitive, β-carboline BDZ antagonist ZK (7 μg) (see Jensen et al., 1984; Duka et al., 1987; Duka and Dorow, 1995) was given 5 min before the RY (20 μg). When the combination treatment was given, rats were placed in the operant boxes immediately after infusion of the RY. The dose range of RY was selected based on previous research in our laboratory evaluating the actions of unilateral and bilateral infusions of RY in selected brain loci (June et al., 1998e; Foster et al., 1999). The 20 μg RY dose was selected for antagonism by the competitive BDZ antagonist because it produced the greatest reduction of EtOH and saccharin-maintained responding in both our preliminary work (Foster et al., 1999) and the present study. The dose of the BDZ antagonist was selected based on our preliminary work showing it was effective in antagonizing the EtOH suppression of other imidazobenzodiazepine inverse agonists (our unpublished data). To control for carry-over effects, subsequent pretreatments were not administered until both EtOH and saccharin responding had returned to their predrug baseline levels for at least 3 d, with a minimum of 3 d between all drug treatments. All aCSF and drug treatments were administered in a randomize design in each experiment. Rats received a maximum of seven bilateral infusions in experiment 1 and six unilateral infusions in experiment 2.
Histology. After the completion of the behavioral testing, animals were killed by CO2 inhalation. Cresyl violet (0.5 μl) was injected into the infusion site, and the brains were removed and frozen. The frozen brains were sliced on a microtome at 50 μm sections, and the sections were stained with cresyl violet acetate. Infusion sites were examined under a light microscope and indicated on drawings adapted from the rat brain atlas of Paxinos and Watson (1998). Rats with improper placements were excluded from the final data analysis.
Blood–alcohol concentration measurement. To ensure that animals were consuming pharmacologically relevant amounts of EtOH during operant sessions, blood–alcohol concentrations (BACs) were collected in a subset of animals on days animals did not receive drug treatment. After the first 30 min of an operant session, ∼100 μl of whole blood was collected from the rats' tail tip into a heparin-coated microsample tube. The BAC samples were collected at the 30 min time point because the majority of EtOH-maintained responding typically occurred during the first half of the 1 hr operant session (June et al., 1998a,b). After collection, the whole blood was immediately centrifuged for 5 min at 1100 rpm. Plasma samples of 5 μl were collected with a Gilson Medical Electric (Middleton, WI) Microman M-25 pipette and injected directly into a GL-5 Analyzer (Analox Instruments, Luxenburg, MA). Microanalysis consisted of measuring the oxygen consumption in the reaction between the sample of alcohol and alcohol oxidase using a Clark-type amperometric oxygen electrode. Alcohol reagent buffer solutions (pH 7.4) and alcohol oxidase enzymes were used in all samples tested. Results were calculated in units of milligram per deciliter and printed within 20 sec of each trial. To ensure accuracy of measurement, each BAC sample was calibrated twice. The mean of the two samples was used as an index of the level of BAC content for a given rat. Single-point calibrations were performed using 5 μl of aqueous 100 mg/dl (21.7mmol/l) standard.
Statistical analysis. All microinjection data were obtained and analyzed after correct histological verification under a light microscope. The operant-maintained responding data were analyzed by a single-factor repeated-measures ANOVA with drug treatment (i.e., dose) as the independent factor. The dependent variables were EtOH and saccharin-maintained responding. Each dependent variable was analyzed separately. Post hoc comparisons between individual drug treatments were made using the Newman–Keuls test in all experiments. In general, drug treatment comparisons were made against the aCSF control condition and the no injection baselines (i.e., BL1 and BL2). The BL1 condition was the average of 5 d before the animals received any drug treatment, whereas the BL2 condition was the average of 5 d after animals received their final drug treatment. The first day of the BL2 condition was taken 4–5 d after the rats' final drug treatment. The BL1 and BL2 conditions were included in the design to evaluate the reliability of our operant training procedures across the entire duration of the study and to serve as an additional control condition to compare our aCSF and drug treatment manipulations. When BL1 and BL2 are depicted in the figures, because the two did not differ statistically from each other, we will discuss these data as a single “no injection control condition,” albeit both were analyzed in the original study design. Finally, to determine the time course of antagonism across the 60 min session, a drug treatment × time analysis was conducted for the cumulative responses for both EtOH and saccharin. Correlated t tests were conducted in each experimental group to compare response rates between EtOH and saccharin-maintained responding under baseline and aCSF conditions.
Experiment 3 (Xenopus oocyte expression study)
Materials. Xenopus laevis frogs were purchased fromXenopus-1 (Dexter, MI). Collagenase B was purchased from Boehringer Mannheim (Indianapolis, IN). GABA was purchased from Research Biochemicals (Natick, MA). All compounds were prepared at a 10 mm stock solution in ethanol and stored at −20°.
cDNA clones. The rat GABAA receptor α1, α2, α5, and γ2 subunit clones were gifts from H. Luddens (Department of Psychiatry, University of Mainz, Germany). The rat GABAA receptor β3 subunit clone was a gift from L. Mahan (National Institute of Neurological Disorders and Stroke, National Institutes of Health, Bethesda, MD).
Injection of in vitro synthesized RNA intoXenopus oocytes. Capped cRNA was synthesized from linearized template cDNA encoding the subunits using mMESSAGE mMACHINE kits (Ambion, Austin, TX). Oocytes were injected with the α, β, and γ subunits in a 1:1:1 molar ratio as determined by UV absorbance.
Mature X. laevis frogs were anesthetized by submersion in 0.1% 3-aminobenzoic acid ethyl ester, and oocytes were surgically removed. Follicle cells were removed by treatment with collagenase B for 2 hr. Each oocyte was injected with 50–100 ng of cRNA in 50 nl of water and incubated at 19° C in modified Barth's saline (88 mm NaCl, 1 mm KCl, 2.4 mm NaHCO3, 0.41 mm CaCl2, 0.82 mm MgSO4, 100 μg/ml gentamicin, and 15 mm HEPES, pH 7.6). Oocytes were recorded from after 3–10 d after injection.
Electrophysiological recordings. Oocytes were perfused at room temperature in Warner Instruments (Hamden, CT) oocyte recording chamber #RC-5/18 with perfusion solution (in mm:115 NaCl, 1.8 CaCl2, 2.5 KCl, and 10 HEPES, pH 7.2) (Harvey et al., 1997). Perfusion solution was gravity fed continuously at a rate of 15 ml/min. Compounds were diluted in perfusion solution and applied until after a peak current was reached.
Current responses to GABA application were measured under two-electrode voltage clamp, at a holding potential of −60 mV. Data were collected using a GeneClamp 500 amplifier and Axoscope software (Axon Instruments, Foster City, CA). GABA concentration–response curves for the GABAA receptor subunit combinations were constructed by normalizing responses to a low concentration of GABA to minimize variability and then renormalized to the maximal response for comparison. Concentration–response data were fitted to a four-parameter logistic using GraphPad Prizm, and the EC50 for each receptor subtype was determined. Peak whole-cell current responses of a voltage-clamped oocyte to an EC50 concentration of GABA in the presence of saturating (1–10 μm) concentrations of modulators are reported as a percentage of the peak response to GABA alone (“percent GABA response” or “% control”).
RESULTS
Experiment 1: bilateral study
Histologies
Figure 1A–D shows a reconstruction of serial coronal sections of the rat brain illustrating the location of the bilateral microinjection cannulas in the CA1 and CA3 hippocampus (A, B), NACC (C), and VTA (D). Figures2A–F and3A–D show examples of representative photomicrographs for the three groups illustrating the extent of the lesions sustained as a result of the bilateral guide cannula. The cannula tracks were well localized in the CA1 or CA3 fields of the hippocampus, NACC, and VTA.
Fig. 1.

Reconstruction of serial coronal sections of the rat brain illustrating the bilateral guide cannula tips for hippocampal (n = 9) (A, B), NACC (n = 9) (C), and VTA (n = 10) (D) rats included in the data depicted in Figure 4A–C. Each rat is represented by two solid black circles: one in the left and one in the right hemisphere. Coronal sections are adapted from the rat brain atlas of Paxinos and Watson (1998), reproduced with permission from Academic Press.
Fig. 2.
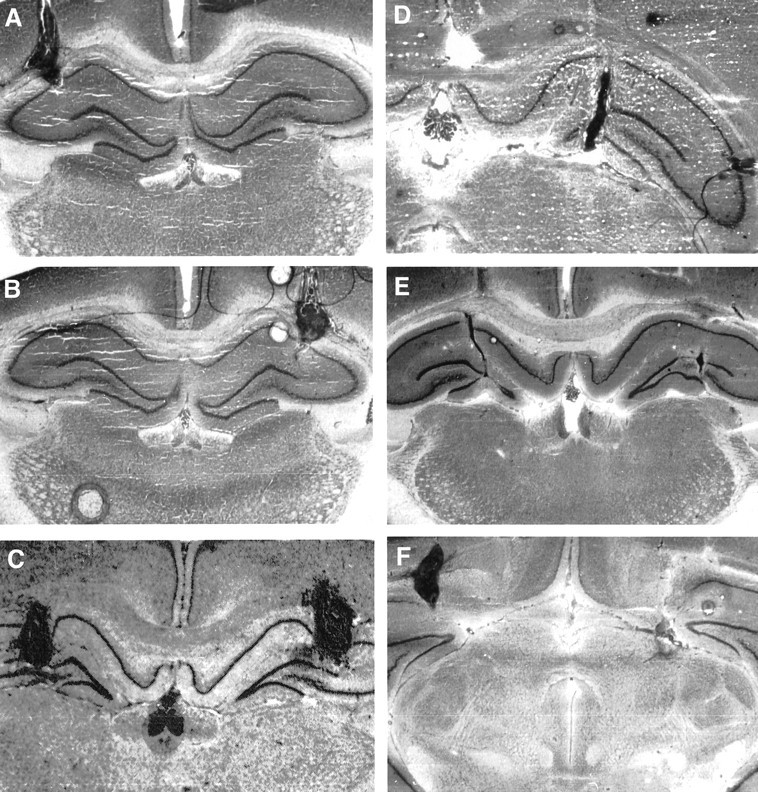
Representative histological photomicrographs for four rats illustrating coronal sections of the CA1 (dorsal) and CA3 (ventral) hippocampus. The photomicrographs depicts the guide cannula tracks and the magnitude of cellular damage caused by the bilateral cannula implantation.
Fig. 3.
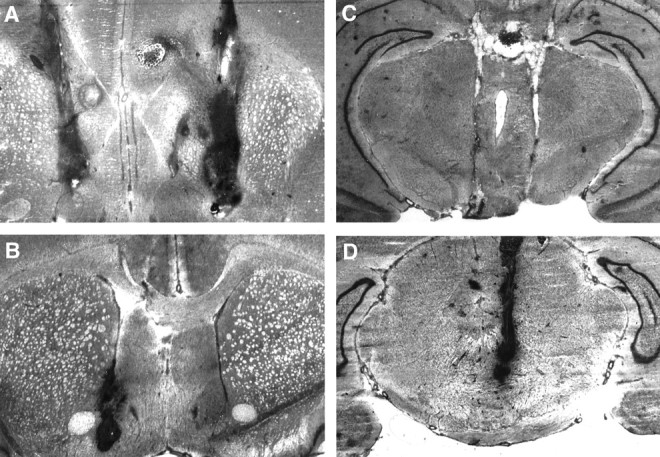
Representative histological photomicrographs of coronal sections for the NACC (n = 2) (A, B) and VTA (n = 2) (C, D) rats. A andC depict the cellular damage caused by the bilateral cannula implantation, and B and D show the effects of the unilateral implantation.
Control rates of EtOH and saccharin-maintained responding and BAC levels
Figure4A–C shows that EtOH and saccharin-maintained responding within each group were similar in the bilateral hippocampus, NACC, and VTA groups under the control conditions (p > 0.05). The BACs (i.e., in milligrams per deciliter) in the hippocampal rats (24.4–83.37 mg/dl) (n = 6) correlated significantly with EtOH-maintained responding and intake (i.e., in grams per kilogram) (r= 0.98, p < 0.01 and r = 0.99,p < 0.0, respectively). The BACs in the VTA rats (18.6–92.46 mg/dl) (n = 8) were also highly correlated with EtOH-maintained responding and intake (r = 0.98,p < 0.01 and r = 0.99,p < 0.01, respectively). However, in the NACC rats (n = 8), the correlations between the BACs (12.6–94.75 mg/dl) and EtOH-maintained responding and intake (r = 0.52, p > 0.10 and r = 0.50,p > 0.23, respectively) did not reach statistical significance.
Fig. 4.

Dose–response of bilateral infusions of RY (0.0–20 μg) in the hippocampus (n = 9) (A), NACC (n = 9) (B), and VTA (n = 10) (C) on a concurrent fixed-ratio (FR4) schedule for EtOH (10% v/v) and saccharin-maintained (0.025% w/v) (SACC) responding. Immediately after the microinfusions, rats were placed in the operant chamber to lever press for a 60 min session. *p ≤ 0.05 versus the no injection control conditions (BL1 and BL2) and aCSF control condition values by ANOVA and post hoc Newman–Keuls test (n = 9). Error bars represent ±SEM in this and subsequent figures. †p < 0.01 versus the 20 μg RY alone condition by ANOVA and post hoc Newman–Keuls test (n = 9). ZK, the competitive BDZ antagonist, completely reverses the suppression by RY on EtOH and saccharin-motivated responding. RY was without effect on EtOH or saccharin-maintained responding in the NACC and VTA (see Materials and Methods).
RY drug treatments
Hippocampus. Figure 4A shows rates of responding maintained by EtOH (top panel) after microinjection of the 1.5–20 μg doses of RY. RY produced a dose-related suppression on EtOH-maintained responding. A highly significant main effect of drug treatment emerged from these data (F(6,54) = 9.07, p < 0.0001). The Newman–Keuls post hoc tests revealed that all doses significantly suppressed EtOH responding compared with the aCSF and baseline conditions (p ≤ 0.01). Thebottom panel of Figure 4A shows rates of responding maintained by saccharin. The 10 μg dose elevated saccharin-maintained responding, whereas the 20 μg dose produced a marked suppression on responding (p < 0.01). These findings yielded a significant main effect of drug treatment (F(6,54) = 3.36, p < 0.0069).
Cumulative response profiles: time course effects of RY
Figure 4B illustrates the cumulative response profiles for EtOH under the aCSF, no injection control (e.g., BL and BL2), and RY treatment conditions. Approximately 45% of the total EtOH-maintained responding occurred during the initial 10 min of the operant session, and 88% occurred by the end of the 30 min interval under the control conditions. All RY doses disrupted the initiation of responding during the first 10 min of the operant session (p ≤ 0.05) and, thereafter, produced sustained suppression throughout the remainder of the 60 min session (p ≤ 0.05). A significant drug treatment × time interaction emerged from these data (F(6,30) = 8.98, p < 0.0001). Figure 4C illustrates the cumulative response profiles for saccharin. Approximately 36% of the total saccharin-maintained responding occurred during the initial 10 min interval, whereas 76% occurred by the end of the 30 min under the control conditions. The 10 μg dose significantly elevated saccharin responding throughout the entire 60 min interval (p ≤ 0.05), whereas the 20 μg dose significantly suppressed saccharin-maintained responding throughout the 20–60 min intervals (p ≤ 0.05). These data profiles produced a significant drug treatment × time interaction (F(6,30) = 3.43, p < 0.001).
Evaluation of the competitive BDZ antagonist (ZK) to attenuate the RY-induced suppression of EtOH and saccharin-maintained responding
In Figure 4A the β-carboline antagonist ZK (7 μg) and the combination condition (i.e., 7 μg ZK plus 20 μg RY) were compared with the aCSF and two BL control conditions. ZK was effective in reversing the attenuation produced by the 20 μg dose of RY (p < 0.01), and when given alone, it also suppressed EtOH-maintained responding (p < 0.01). These data profiles yielded a significant main effect of drug treatment (F(4,36) = 6.401,p < 0.0005). The bottom panel of Figure4A depicts the actions of ZK alone (7 μg) and in combination with the 20 μg dose of RY on saccharin-maintained responding. These data show that ZK also attenuated the RY-induced suppression on saccharin-maintained responding (p < 0.05). However, given alone, ZK did not alter saccharin-maintained responding (p > 0.05).
Neuroanatomical control sites: NACC and VTA
Figure 5A shows rates of responding maintained by EtOH (top panel) and saccharin (bottom panel) after microinjection of the 0.5–20 μg doses of RY into the NACC. Compared with the aCSF and BL control conditions, none of the RY treatments altered EtOH or saccharin-maintained responding (F(7,56) = 0.737, p > 0.05 and F(7,56) = 0.805,p > 0.05, respectively). A similar profile of effects were observed in the VTA for EtOH and saccharin-maintained responding (F(5,45) = 0.215, p > 0.05 and F(5,45) = 0.907,p > 0.05, respectively).
Fig. 5.

Cumulative time course profile across the 60 min interval for EtOH (A) and saccharin-maintained (B) responding relative to the control conditions [i.e., aCSF and no injection control (e.g., BL and BL2)]. All RY doses disrupted the initiation of responding during the first 10 min of the operant session and, thereafter, produced sustained suppression throughout the remainder of the 60 min session (p ≤ 0.05). RY was without effect on saccharin-maintained responding during the initial 10 min for the 1.5, 5, and 20 μg doses (p > 0.05); however, beginning at the 20 min interval and throughout the remainder of the 60 min session, the 20 μg dose produced a profound suppression on responding (p ≤ 0.05). In contrast, the 10 μg dose significantly elevated saccharin responding across the entire 60 min session (p < 0.05).
Experiment 2: unilateral study
Histologies
Figure 6A–C shows a reconstruction of serial coronal sections of the rat brain illustrating the location of the unilateral microinjection cannulas in the CA1 and CA3 hippocampus (A), NACC (B), and VTA (C). Representative photomicrographs are depicted in Figures 2 and 3.
Fig. 6.

Reconstruction of serial coronal sections of the rat brain illustrating the unilateral guide cannula tips for hippocampal (n = 7) (A), NACC (n = 5) (B), and VTA (n = 5) (C) rats included in the data depicted in Figure 7A–C. Each rat is represented by one solid black circle: one in the left or in the right hemisphere. Coronal sections are adapted from the rat brain atlas of Paxinos and Watson (1998), reproduced with permission from Academic Press.
Control rates of EtOH and saccharin-maintained responding and blood EtOH concentration levels
Figures 7A–C shows that EtOH and saccharin-maintained responding were similar in the hippocampal and VTA groups (p > 0.05); however, the NACC group responded significantly higher for the saccharin reinforcer (p < 0.05). The BACs in the hippocampal rats (n = 7) correlated significantly with EtOH-maintained responding and intake (r = 0.95,p < 0.01 and r = 0.95,p < 0.0, respectively). The BACs in the NACC (n = 5) and VTA (n = 5) rats were also correlated with EtOH-maintained responding and intake (r = 0.77, p < 0.05 andr = 0.79, p < 0.05; r= 0.71, p < 0.05 and r = 0.75,p < 0.05, respectively).
Fig. 7.

Dose–response of unilateral infusions of RY (0.0–40 μg) in the hippocampus (n = 7) (A), NACC (n = 5) (B), and VTA (n = 5) (C) on a concurrent fixed-ratio (FR4) schedule for EtOH (10% v/v) and saccharin-maintained (0.025% w/v) (SACC) responding. Immediately after the microinfusions, rats were placed in the operant chamber to lever press for a 60 min session. *p ≤ 0.05 versus the aCSF control condition values by ANOVA and post hoc Newman–Keuls test. Again, RY failed to alter EtOH or saccharin-maintained responding in the NACC and VTA.
RY drug treatments
Hippocampus. Figure 7A (top panel) shows that unilateral microinjection of RY produced a clear dose-dependent suppression on EtOH-maintained responding, yielding a highly significant main effect of drug treatment (F(5,30) = 42.28, p < 0.0001). Compared with the aCSF control condition, responding was reduced by 36–86% with the 1–40 μg doses (p< 0.01). The bottom panel of Figure 7A shows that only the 40 μg dose nonselectively suppressed responding maintained by saccharin (p < 0.01). This finding yielded a significant main effect of drug treatment (F(5,30) = 4.91, p < 0.0002).
Neuroanatomical control sites: NACC and VTA
Figure 7, B and C, shows rates of responding maintained by EtOH (top panel) and saccharin (bottom panel) after unilateral microinjection of the 0.01–20 μg doses of RY into the NACC and VTA, respectively. Compared with the aCSF control condition, none of the RY treatments altered EtOH or saccharin-maintained responding in the NACC (F(4,16) = 0.394, p > 0.05 and F(4,16) = 1.56,p > 0.05) or VTA (F(4,16) = 0.779, p > 0.05 and F(4,16) = 0.770,p > 0.05, respectively).
Experiment 3: Xenopus oocyte expression study
Because efficacy is defined by subunit composition (von Blankenfeld et al., 1990; Wong and Skolnick, 1992; Graham et al., 1996) and the VTA, NACC, and hippocampus contain high levels of the α1, α2, and α5 subunits, respectively, (Wisden et al., 1992;Duncan et al., 1995; Fritschy and Mohler, 1995; Charlton et al., 1997), we determined whether the failure of RY to reduce EtOH-maintained responding in the VTA and NACC was attributable to it exhibiting a “different” modulation at the α1 and α2 receptor subtypes than the α5 receptor. To determine this, the efficacy of RY was examined at recombinant GABAA receptors composed of α1β3γ2, α2β3γ2, and α5β3γ2 subunits expressed inXenopus oocytes. The anti-alcohol compound Ro 15–4513 (Suzdak et al., 1986) and several “neutral” competitive BDZ antagonists (e.g., flumazenil and ZK) were used as reference compounds. The Xenopus system is a useful tool for functional determination of the efficacy of GABAergic modulators (Puia et al., 1991).
Activities of GABA modulators at recombinant GABAA receptors
Receptors containing different GABAA α subunits (α1, α2, and α5) were coexpressed with both the β3 and γ2 subunits. To accurately compare modulator activity between receptor subtypes, we used an equi-effective (EC50) concentration of GABA for each GABAA receptor subtype: 50 μm for α1β3γ2 and α2β3γ2, and 30 μm for α5β3γ2. All modulators were examined at saturating concentrations, either 1 or 10 μm.
Figure 8A shows that RY acted as a negative modulator at the α1, α2, and α5 receptor subtypes, inhibiting GABA-evoked current responses of voltage-clampedXenopus oocytes by ∼40–55%. The relative magnitude of GABA inhibition at the α5 and α1 receptors is also depicted by the current traces illustrated in Figure 9,A and D. For comparison, the activity of the nonselective BDZ-positive modulator flunitrazepam is illustrated at both receptor subtypes in Figure 9, C and F. In contrast, flunitrazepam produced a 50% potentiation of GABA-evoked currents at the α5 and α1 receptor subtypes (155 ± 5 and 163 ± 7%, respectively).
Fig. 8.

A–D, Actions of GABAAreceptor modulators on recombinant receptor subtypes. Modulation of GABAA α1β3γ2 (white bar), α2β3γ2 (hatched bar), and α5β3γ2 (black bar) receptors by RY (A), ZK (B), Ro 15–4513 (C), and Ro 15–1788 (D). Saturating concentrations (1–10 μm) of modulator was coapplied over voltage-clamped oocytes along with an EC50 of GABA, and the whole-cell current response in the presence of modulator is reported as a percentage of the current response to GABA alone (percent GABA response, mean ± SD of 3–4 separate oocytes except for ZK on α6β3γ2, which is 7 separate oocytes).
Fig. 9.

A–F, Actions of RY, ZK, and flunitrazepam on recombinant GABAA receptor subtypes illustrated by current traces. Top, Current responses of voltage-clamped oocytes expressing GABAA α5β3γ2 receptors. A, During application of 30 μm(EC50) GABA alone for duration indicated byblack bar (left trace). Current response from the same oocyte subsequently coapplied with 30 μmGABA along with 10 μm RY for duration indicated bygray bar (right trace). B, Current response of a voltage-clamped oocyte during application of 30 μm GABA for duration indicated by black bar (left trace). Current response from same oocyte subsequently coapplied with 30 μm GABA along with 10 μm ZK for duration indicated by gray bar (right trace). C, Current response of a voltage-clamped oocyte during application of 30 μm GABA for duration indicated by black bar (left trace). Current response from same oocyte subsequently coapplied with 30 μm GABA along with 1 μm flunitrazepam (FNP) for duration indicated by gray bar (right trace).Bottom, Current responses of voltage-clamped oocytes expressing GABAA α1β3γ2 receptors. D, During application of 50 μm (EC50) GABA for duration indicated by black bar (left trace). Current response from same oocyte subsequently coapplied with 50 μm GABA along with 10 μmRY for duration indicated by gray bar (right trace). E, Current response of a voltage-clamped oocyte during application of 50 μm GABA for duration indicated by black bar (left trace). Current response from same oocyte subsequently coapplied with 50 μm GABA along with 10 μm ZK for duration indicated by gray bar (right trace).F, Current response of a voltage-clamped oocyte during application of 50 μm GABA for duration indicated byblack bar (left trace). Current response from same oocyte subsequently coapplied with 50 μm GABA along with 1 μm flunitrazepam (FNP) for duration indicated by gray bar (right trace). Calibration: A, 10 nA, 10 sec;B–F, 25 nA, 10 sec.
The efficacy of the imidazobenzodiazepines Ro 15–4513 and Ro 15–1788 (flumazenil) were also examined at the α1β3γ2, α2β3γ2, and α5β3γ2 receptors (Fig. 8C,D). These parent compounds were selected because we were interested in evaluating the degree to which modification at position 8 (which produced the α5 selectivity) (Lui et al., 1995, 1996) would change the capacity of imidazobenzodiazepine to modulate GABA at specific receptor subtypes. Ro 15–4513 was also selected because we were interested in comparing the intrinsic activity of a reference alcohol antagonist (Suzdak et al., 1986; Harris and Lal, 1988; Jackson and Nutt, 1995) with RY 023. It should be noted that the capacity of Ro 15–4513 and flumazenil to produce intrinsic effects at many of the GABAA-containing subunits are not known. As shown in Figure 8C, Ro 15–4513 produced a very modest inhibition of GABA current at the α1 and α2 subtypes (86 ± 3 and 93 ± 1% control response, respectively) but exhibited no efficacy at the α5 receptor (99.5 ± 4.1% control response). Figure8D depicts the efficacy of the competitive antagonist flumazenil (Ro15–1788) (Haefely, 1983, 1985, 1990). Ro 15–1788 acted as a modest positive modulator at the α2 subtype (115 ± 4% control response) and exhibited no efficacy at either the α1 or α5 subtypes. In contrast, Figure 8B shows that ZK, the competitive β-carboline antagonist (Jensen et al., 1984; Duka et al., 1987; Duka and Dorow, 1995), acted as a positive modulator potentiating GABA-evoked current responses at α1- and α2-containing receptors (146 ± 11 and 140 ± 13% of control, respectively); however, ZK had no efficacy at the α5 receptor subtype (95 ± 6% of control). As illustrated in Figure 9, Eand F, the relative magnitude of GABA potentiation by ZK was comparable with that of the full BDZ agonist flunitrazepam at the α1 receptor.
DISCUSSION
Microinjection studies
The results of the present study support the hypothesis that GABAA receptors containing α5 subunits in the CA1 and CA3 hippocampal fields play an important role in regulating EtOH-seeking behaviors in the genetically selected P rat. The intrahippocampal modulation of EtOH-maintained responding was site-specific; no antagonism by RY was observed after intra-NACC and intra-VTA infusions (i.e., two brain areas reported to play a significant role in regulating alcohol-motivated behaviors) (Koob and Bloom, 1988; Koob et al., 1998; McBride and Li, 1998). The reliability of the dose–effect analyses was confirmed by correspondence between the bilateral and unilateral infusions. It is possible that fewer GABAA receptors containing α5 subunits were occupied after unilateral infusions; thus, a higher dose was required to observe the same magnitude of antagonism seen after the bilateral infusions.
The GABA–BDZ systems have been implicated in the regulation of consummatory behavioral processes (Higgs and Cooper, 1995). However, RY produced a differential sensitivity in suppressing EtOH compared with saccharin-motivated responding. Specifically, unilateral and bilateral infusions were more effective in suppressing EtOH compared with saccharin-maintained responding (Figs. 4A,7A). These results are consistent with our systemic studies wherein EtOH and saccharin response rates were equally matched at basal levels (Foster et al., 1999; June et al., 1999). The nonselective suppression seen by RY with the higher doses is likely attributable to occupancy of multiple α subtype receptors. Hence, the results suggest that it is unlikely that the RY-induced suppression of EtOH responding was attributable to a general suppression on consummatory behaviors.
The bilateral and unilateral neuroanatomical control data revealed that RY infusions produced little effects on EtOH or saccharin-maintained responding in the NACC and VTA. These findings suggest that (1) these brain loci are devoid of α5 receptors or (2) the paucity of α5 receptors in these brain loci are not sufficient to regulate EtOH and saccharin-maintained responding. However, it should be noted that infusion of nonselective BDZ inverse agonists in the NACC and VTA have been reported to produce suppression on EtOH responding (June et al., 1998a,c). Thus, the NACC and VTA do, in fact, regulate EtOH responding via GABAergic mechanisms, possibly via other α receptor subtypes.
ZK, the competitive BDZ antagonist, reversed the antagonism produced by RY on both EtOH and saccharin-maintained responding. Hence, the suppression by RY appears to be mediated via an action at the BDZ component of the GABA complex. Given alone, ZK also produced a marked reduction on EtOH responding; however, it did not alter saccharin responding. That a low dose (7 μg) of ZK was capable of producing suppression on EtOH responding in the hippocampus [despite its low affinity at the α5 receptor; IC50 of ∼170 nm (I. Pribilla and M. Hillmann, personal communication, Schering, Berlin, Germany)] suggests that blockade of multiple α receptor subtypes (e.g., α1−α5) may be responsible for its suppression on EtOH-maintained responding. Nevertheless, these findings are in agreement with our previous research with systemic and oral administration of ZK (June et al., 1996, 1998b,d).
The α5 receptors within the hippocampus may reduce EtOH-maintained responding by interfering with conditioned stimuli
BDZs have long been proposed to modulate learning and memory processes via the hippocampus (Izquierdo and Medina, 1991). GABAergic mechanisms in the hippocampus also appear to mediate associations between conditioned and unconditioned stimuli (Phillips and LeDoux, 1992). Samson and Hodge (1996) proposed that response latency (i.e., the delay from the beginning of alcohol availability to the onset of responding) is an index of “initial appetitive processes” and that conditioned stimuli may play a role in initiating the onset of lever-press responding. Hence, decrements, or elevations in response latency, may be indicative of appetitive brain mechanisms. Samson and Hodge (1996) further proposed that conditioned stimuli during the “early maintenance phase” (i.e., 15–20 into the operant session) may also be paired with the CNS pharmacological effects of alcohol on previous consummatory occasions. Thus, both conditioned reinforcers and the CNS pharmacological effects of alcohol may reinforce EtOH-maintained responding. If the α5 receptors within the CA1 and CA3 hippocampal fields were functionally involved in regulating conditioned and unconditioned stimuli during the early phases of EtOH-maintained responding, it can be hypothesized that RY might reduce EtOH responding by interfering with–reducing conditioned cues that would normally be present during the operant session to sustain EtOH responding. It should be recalled that RY produced profound reductions on the onset of alcohol drinking and led to early termination of responding (Fig. 4B). Thus, blockade of the CNS pharmacological effects alone by EtOH may not fully explain the mechanisms by which RY reduces EtOH-seeking behaviors.
More recently, the hippocampus, and afferents to the hippocampus, have been proposed to play a role in the cognitive aspects of anxiety (Crestani et al., 1999; McNaughton, 1999). Thus, the reduction in alcohol drinking by RY may be related to a reduction in anxiety attributable to the ability of RY to function as an agonist at the α3, α4, and α6 subunits. Previous reports reveal that negative BDZ modulators can exhibit agonist effects at some receptor subtypes (Wong and Skolnick, 1992; Wafford et al., 1993). However, this does not seem likely because recent work in our laboratory has shown that RY also exhibits a classic inverse agonist profile at the α3, α4, and α6 receptor subtypes (Foster et al., 1999).
The α5 receptors within the hippocampus may interact with mesolimbic dopamine systems
Another possible mechanism by which RY reduces EtOH-seeking behaviors is that blockade of the α5 subtype receptors initiates tonic inhibition of dopamine (DA) neurons at the hippocampal level. RY may “mimic” the actions of EtOH on the DA system. Because the DA release induced by RY would replace–substitute the DA normally produced by EtOH responding, less alcohol would subsequently be ingested in the presence of RY (McBride and Li, 1998; Nowak et al., 1998). Systemic administration of BDZ inverse agonists have been shown to increase DA and its metabolites in subcortical and cortical areas (Scheel-Kruger, 1986; Giorgi et al., 1988; Bradberry et al., 1991;McCullough and Salamone, 1992) (for review, see Bruno and Miller, 1995). A related hypothesis may explain the capacity of ZK to attenuate EtOH-maintained responding. It should be recalled that, at the α1 and α2 receptor subtypes, ZK exhibited full agonist effects (Figs.8B, 9E).
Subunit selectivity versus intrinsic activity
Previously, we reported that rank order potencies of BDZs to attenuate EtOH intake were not correlated with rank order potencies of BDZs to inhibit GABA36Cl−conductance and enhance35S-t-butylbicyclophosphorothionate (TBPS) binding (June et al., 1995). Whereas the36Cl− flux and TBPS binding assays use heterogenous subunit populations, with the resulting value obtained representing an “average efficacy,” theXenopus oocyte system permits efficacy to be determined at any different subunit–cDNA combinations (Pritchett et al., 1989;Wafford et al., 1993).
In the present study, at saturating concentrations, Ro 15–4513 was essentially neutral at the α2 and α5 receptors and slightly negative at the α1 receptor. These data are in agreement with previous oocyte studies (Wafford et al., 1993; June et al., 1998g) and work by Wong and Skolnick (1992) using the GABA shift assay. However, the findings with Ro 15–4513 contrast those with RY and ZK, in which the GABA-evoked current is negatively and positively modulated, respectively, at the α1 and α2 receptor subtypes. Nevertheless, despite the three different intrinsic activity profiles, each ligand is highly effective in attenuating EtOH-motivated behaviors (Rassnick et al., 1993; June et al., 1994, 1995a, 1998a,b). Thus, although both efficacy and subunit selectivity may interact to effectively alter EtOH-motivated behaviors, subunit selectivity may be the critical factor in determining the capacity of a ligand to function as an effective alcohol antagonist. Several investigators suggest that efficacy is not only dependent on subunit composition but is actually defined by it (von Blankenfeld et al., 1990; Wong and Skolnick, 1992;Graham et al., 1996; Skolnick et al., 1997). Thus, efficacy may have little meaning without subunit selectivity (P. Skolnick, personal communication).
Summary
These findings provide the first demonstration that GABAA receptor-containing α5 subunits in the hippocampus play a critical role in regulating some aspects of alcohol seeking behavior. The precise GABA–hippocampal pathway(s) in which RY attenuates EtOH reinforcement is not known; however, GABAA–BDZ neuroanatomical circuits within the hippocampus may initiate activation of underlying DA substrates in the mesoaccumbens circuitry to contribute to the reinforcing properties of EtOH. The functional role of conditioning stimuli in the onset and maintenance phases of alcohol drinking may also be important. Nevertheless, we propose that the GABA–hippocampal pathway may represent an “extension” of the mesolimbic EtOH reward circuitry and may be an important target in the development of potential pharmacotherapies for alcohol addiction and dependence. TheXenopus oocyte studies demonstrated that the capacity of BDZs to attenuate EtOH-motivated responding was not directly related to their intrinsic efficacy; rather, their selectivity and differential potency to attenuate EtOH-seeking behaviors appear to be more related to their affinity and selectivity at different GABAA-containing receptor subunits.
Footnotes
This research was supported in part by National Institute of Alcohol Abuse and Alcoholism Grants AA10406 and AA11555 (H.L.J.) and National Institute of Mental Health/National Institutes of Health Grant MH 46851 (J.M.C.). K.L.F. and M.G. were supported in part by National Heart, Lung, and Blood Institute/National Institutes of Health Grant T35M (Short-Term Training Program for Minority Students in Biomedical Research). K.L.F. was also supported in part by a Minority Neuroscience Fellowship from the American Psychological Association. We thank Dr. Phil Skolnick (Eli Lilly & Co., Indianapolis, IN) for his outstanding consulting work throughout the duration of this project and for obtaining the cDNA clones from Drs. Luddens (University of Mainz, Mainz, Germany) and Mahan (National Institutes of Mental Health). We also thank Dr. T.-K. Li and the Alcohol Research Center (Indiana University School of Medicine) for supplying the P rats.
Correspondence should be addressed to Dr. Harry L. June, Department of Psychology, LD 124, Indiana University–Purdue University, 402 North Blackford Street, Indianapolis, IN 46202-3275. E-mail:hjune@iupui.edu.
REFERENCES
- 1.Amaral DG, Witter MP. The rat central nervous system, Ch 21. Academic; San Diego: 1995. Hippocampal formation. pp. 449–492. [Google Scholar]
- 2.Austin WB, Kelleghan WJ, Lau KSY. Facile synthesis of ethynylated benzoic acid derivatives and aromatic compounds via ethynyltrimethylsilane. J Organic Chem. 1981;46:2280–2286. [Google Scholar]
- 3.Bradberry CW, Lory JD, Roth RH. The anxiogenic β-carbolline FG 7142 selectively increases dopamine release in rat prefrontal cortex as measured by microdialysis. J Neurochem. 1991;56:748–752. doi: 10.1111/j.1471-4159.1991.tb01987.x. [DOI] [PubMed] [Google Scholar]
- 4.Bruno JP, Miller JE. Inhibition of GABAergic transmission: interactions with other transmitters systems. In: Sarter M, Nutt DJ, Lister RG, editors. Benzodiazepine receptor inverse agonists. Wiley; New York: 1995. pp. 41–81. [Google Scholar]
- 5.Carroll ME, Lac ST, Nygaard SL. A concurrently available nondrug reinforcer prevents the acquisition or decreases the maintenance of cocaine-reinforced behaviors. Psychopharmacology. 1989;97:23–29. doi: 10.1007/BF00443407. [DOI] [PubMed] [Google Scholar]
- 6.Charlton ME, Sweetnam PM, Fitzgerald LW, Terwilliger RZ, Nestler EJ, Duman RS. Chronic ethanol administration regulates the expression of GABAA receptor α1 and α5 subunits in the ventral tegmental area and hippocampus. J Neurochem. 1997;68:121–127. doi: 10.1046/j.1471-4159.1997.68010121.x. [DOI] [PubMed] [Google Scholar]
- 7.Crestani F, Lorez M, Baer K, Essrich C, Benke D, Laurent JP, Belzung C, Fristchy JM, Luscher B, Mohler H. Decreased GABAA-receptor clustering results in enhanced anxiety and a bias for threat cues. Nat Neurosci. 1999;2:833–839. doi: 10.1038/12207. [DOI] [PubMed] [Google Scholar]
- 8.Duka T, Dorow R. Human experimental psychopharmacology of benzodiazepine inverse agonists and antagonists. In: Sarter M, Nutt DJ, Lister RG, editors. Benzodiazepine receptor inverse agonists. Wiley; New York: 1995. pp. 243–270. [Google Scholar]
- 9.Duka T, Stephens DN, Krause W, Dorow R. Human studies on the benzodiazepine receptor antagonist beta-carboline, ZK 93426: preliminary observations on psychotropic activity. Psychopharmacology. 1987;93:421–427. doi: 10.1007/BF00207229. [DOI] [PubMed] [Google Scholar]
- 10.Duncan GE, Breese GR, Criswell HE, McCown TJ, Herbert JS, Devaud LL, Morrow AL. Distribution of {3H}zolpidem binding sites in relation to messenger RNA encoding the α1, β2 γ2 Subunits of GABAA receptors in rat brain. Neuroscience. 1995;64:1113–1128. doi: 10.1016/0306-4522(94)00433-6. [DOI] [PubMed] [Google Scholar]
- 11. Foster KL, McKay PF, Mason D, Cummings R, Garcia M, He X, Cook JM, June HL. RY023: a selective GABAA-α5-subunit ligand attenuates responding maintained by ethanol following microinjection into the CA1 and CA3 hippocampal areas. Alcohol Clin Exp Res 22 1999. 16A [Abstr 38 ]. [Google Scholar]
- 12.Fritschy JM, Mohler H. GABAA-receptor heterogenetity in the adult rat brain. Differential regional and cellular distribution of seven major subunits. J Comp Neurol. 1995;359:154–194. doi: 10.1002/cne.903590111. [DOI] [PubMed] [Google Scholar]
- 13.Giorgi O, Corda MG, Biggio G. Ro 15–4513, like anxiogenic β-carbolines, increases dopamine metabolism in the prefrontal cortex of the rat. Eur J Pharmacol. 1988;156:71–75. doi: 10.1016/0014-2999(88)90148-3. [DOI] [PubMed] [Google Scholar]
- 14.Graham D, Faure C, Besnard F, Langer SZ. Pharmacological profile of benzodizepine site ligands with recombinant GABAA receptor subtypes. Eur Neuropsychopharm. 1996;6:119–125. doi: 10.1016/0924-977x(95)00072-w. [DOI] [PubMed] [Google Scholar]
- 15.Groenewegen HJ, Vermeulen-Van Der Zee E, Te Kortschot A, Witter MP. Organization of the projections to the ventral striatum in the rat. A study using anterograde transport of phaseolus vulgaris leucoagglutinin. Neuroscience. 1987;23:103–120. doi: 10.1016/0306-4522(87)90275-2. [DOI] [PubMed] [Google Scholar]
- 16.Gu ZQ, Wong G, Dominguez C, de Costa BR, Rice KC, Skolnick P. Syntheses and evaluation of Imidazo [1,5-a][1,4]-benzodiazepines esters with high affinities and selectivities at diazepam. Insensitive (DI) benzodiazepine receptors. J Med Chem. 1993;36:1001–1006. doi: 10.1021/jm00060a007. [DOI] [PubMed] [Google Scholar]
- 17.Haefely W. Antagonists of benzodiazepine: functional aspects. In: Biggio G, Costa E, editors. Benzodiazepine recognition. Site ligands biochemistry and pharmacology. Raven; New York: 1983. p. 73. [Google Scholar]
- 18.Haefely W. Pharmacology of benzodiazepine antagonists. Pharmacopsychiatry. 1985;18:163–166. doi: 10.1055/s-2007-1017356. [DOI] [PubMed] [Google Scholar]
- 19.Haefely W. The GABAA-benzodiazepine receptor: biology and pharmacology. In: Burrows GD, Roth M, Noyes R Jr, editors. Handbook of anxiety. Elsevier Science; Amsterdam: 1990. pp. 165–188. [Google Scholar]
- 20.Harris CM, Lal H. Central nervous system effects of RO15–4513. Drug Dev Res. 1988;13:187–203. [Google Scholar]
- 21.Harvey SC, McIntosh JM, Cartier GE, Maddox FN. Determinants of alpha-conotoxin. MII on a3b2 neuronal nicotinic receptors. Mol Pharmacol. 1997;51:336–342. doi: 10.1124/mol.51.2.336. [DOI] [PubMed] [Google Scholar]
- 22.Heyman GM, Oldfather CM. Inelastic preference for ethanol in rats: an analysis of ethanol's reinforcing effects. Psychol Sci. 1992;3:122–130. [Google Scholar]
- 23.Higgs S, Cooper SJ. Benzodiazepine receptor inverse agonists and ingestive behaviors: the palatability hypothesis. In: Sarter M, Nutt DJ, Lister RG, editors. Benzodiazepine receptor inverse agonists. Wiley; New York: 1995. pp. 163–184. [Google Scholar]
- 24.Hodge CW, Chappelle AM, Samson HH. GABAergic transmission in the nucleus accumbens is involved in the termination of ethanol self-administration in rats. Alcohol Clin Exp Res. 1995;19:1486–1493. doi: 10.1111/j.1530-0277.1995.tb01012.x. [DOI] [PubMed] [Google Scholar]
- 25.Izquierdo I, Medina JH. GABAA receptor modulation of memory: the role of endogenous Benzodiazepines. Trends Pharmacol Sci. 1991;12:260–265. doi: 10.1016/0165-6147(91)90567-c. [DOI] [PubMed] [Google Scholar]
- 26.Jackson HC, Nutt DJ. Inverse agonist and alcohol. In: Sarter M, Nutt DJ, Lister RG, editors. Benzodiazepine receptor inverse agonists. Wiley; New York: 1995. pp. 243–270. [Google Scholar]
- 27.Jensen LH, Petersen EN, Braestrup C, Honore T, Kehr W, Stephens DN, Schneider H, Seidelmann D, Schmiechen R. Evaluation of the beta-carboline ZK93426 as a benzodiazepine receptor antagonist. Psychopharmacology. 1984;83:249–256. doi: 10.1007/BF00464789. [DOI] [PubMed] [Google Scholar]
- 28.June HL, Hughes RW, Spurlock HL, Lewis MJ. Ethanol self-administration in freely feeding and drinking rats: effects of RO15–4513 alone, and in combination with Ro15–1788 (flumazenil). Psychopharmacology. 1994;115:332–339. doi: 10.1007/BF02245074. [DOI] [PubMed] [Google Scholar]
- 29.June HL, Lin M, Greene TL, Lewis MJ, Murphy JM. Effects of negative modulators of GABAergic efficacy on ethanol intake: correlation of biochemical changes with pharmacological effect using behavioral paradigm. J Exp Clin Psychopharmacol. 1995;3:252–258. [Google Scholar]
- 30.June HL, Greene TL, Murphy JM, Lin M, Williams JA, Cason CR, Mellor-Burke JJ, Duemler S, Torres L, Lumeng L, Li T-K. Effects of the benzodiazepine inverse agonist RO19–4603 alone, in combination with the benzodiazepine receptor antagonists, flumazenil, ZK 93426, CGS 8216 on ethanol intake in alcohol-preferring (P) rats. Brain Res. 1996;784:19–34. [PubMed] [Google Scholar]
- 31.June HL, Torres L, Cason CR, Hwang BH, Braun MR, Murphy JM. The novel benzodiazepine inverse agonist RO19–4603 antagonizes ethanol motivated behaviors: neuropharmacological studies. Brain Res. 1998a;784:256–275. doi: 10.1016/s0006-8993(97)01380-2. [DOI] [PubMed] [Google Scholar]
- 32.June HL, Zucarelli D, Craig KS, DeLong J, Cason CR, Torres L, Murphy JM. High affinity benzodiazepine antagonists reduce responding maintained by EtOH presentation in ethanol-preferring (P) rats. J Pharmacol Exp Ther. 1998b;284:1006–1014. [PubMed] [Google Scholar]
- 33.June HL, Eggers MW, Warren-Reese C, Ricks A, Cason CR. The effects of the novel benzodiazepine receptor inverse agonist Ru 34000 on ethanol-maintained responding. Eur J Pharmcol. 1998c;350:151–158. doi: 10.1016/s0014-2999(98)00260-x. [DOI] [PubMed] [Google Scholar]
- 34.June HL, Dejaravu SL, Williams J, Cason CR, Eggers MW, Greene TL, Leviege T, Torres L, Braun MR, Murphy JM. GABAergic modulation of the behavioral actions of ethanol in alcohol-preferring (P) and nonpreferring (NP) rats. Eur J Pharmacol. 1998d;342:139–151. doi: 10.1016/s0014-2999(97)01489-1. [DOI] [PubMed] [Google Scholar]
- 35.June HL, Grey C, Johnson TB, Williams L, McKay P, Rock S, He X, Cook JM. GABAergic substrates in the nucleus accumbens and dorsal hippocampus mediate responding maintained by EtOH presentation in alcohol-preferring (P) rats. Behav Pharmacol. 1998e;9:S47. [Google Scholar]
- 36.June HL, Grey C, Warren-Reese C, Lawrence A, Thomas A, Cummings R, Williams L, McCane SL, Durr LF, Mason D. The opioid receptor antagonist nalmefene reduces alcohol motivated behaviors: preclinical studies in alcohol preferring (P) and outbred Wistar rats. Alcohol Clin Exp Res. 1998f;22:2174–2185. [PubMed] [Google Scholar]
- 37.June HL, Cason CR, Cheatham G, Ruiyan L, Gan T, Cook JM. GABAA-benzodiazepine receptors in the striatum are involved in the sedation produced by a moderate, but not an intoxicating ethanol dose in outbred Wistar rats. Brain Res. 1998g;794:103–118. doi: 10.1016/s0006-8993(98)00222-4. [DOI] [PubMed] [Google Scholar]
- 38.June HL, McCane S, Zink RW, Portoghese P, Li T-K, Froehlich JC. The δ 2 opioid receptor antagonist naltriben reduces alcohol-motivated behaviors. Psychopharmacology. 1999;147:81–89. doi: 10.1007/s002130051145. [DOI] [PubMed] [Google Scholar]
- 39.Kelley A, Domesick VB. The distribution of the projection from the hippocampal formation to the nucleus accumbens in the rat: an anterograde- and reterograde-horseradish peroxidase study. Neuroscience. 1982;7:2321–2335. doi: 10.1016/0306-4522(82)90198-1. [DOI] [PubMed] [Google Scholar]
- 40.Koob GF. The role of the striato pallidal and extended amygdala systems in drug addiction. Ann NY Acad Sci. 1998;912:445–460. doi: 10.1111/j.1749-6632.1999.tb09282.x. [DOI] [PubMed] [Google Scholar]
- 41.Koob GF, Bloom FE. Cellular and molecular mechanisms of drug dependence. Science. 1988;242:715–723. doi: 10.1126/science.2903550. [DOI] [PubMed] [Google Scholar]
- 42.Koob GF, Roberts AJ, Shulties G, Parsons LH, Heyser CJ, Hyytia P, Merlo-Pinch E, Weiss F. Neurocircuitry targets in ethanol reward dependence. Alcohol Clin Exp Res. 1998;22:3–9. [PubMed] [Google Scholar]
- 43.Lui RY, Zhang PW, McKernan R, Wafford K, Cook JM. Synthesis of a novel imidazobenzodiazepine ligands for the α5β2γ2 Bz5 GABAA receptor subtype. Med Chem Res. 1995;5:700–709. [Google Scholar]
- 44.Lui RY, Hu RJ, Zhang PW, Skolnick P, Cook JM. Synthesis and pharmacological properties of novel 8-substituted imidazobenzodiazepines: high affinity, selective probes for α5 containing GABAA receptors. J Med. 1996;39:1928–1934. doi: 10.1021/jm950887n. [DOI] [PubMed] [Google Scholar]
- 45.Lumeng L, Murphy JM, McBride WJ, Li T-K. Genetic influences on alcohol preference in animals. In: Begleiter H, Kissin B, editors. The genetics of alcoholism. Oxford UP; New York: 1995. pp. 165–201. [Google Scholar]
- 46.McBride WJ, Li T. Animal models of alcoholism: Neurobiology of high alcohol-drinking behavior in rodents. Crit Rev Neurobiol. 1998;12:339–369. doi: 10.1615/critrevneurobiol.v12.i4.40. [DOI] [PubMed] [Google Scholar]
- 47.McCullough LD, Salamone JD. Anxiogenic drugs β-CCE and FG 7142 increase extracellular dopamine levels in nucleus accumbens. Psychopharmacology. 1992;109:379–382. doi: 10.1007/BF02245888. [DOI] [PubMed] [Google Scholar]
- 48.McKinzie DL, Eha R, Murphy JM, McBride WJ, Lumeng L, Li TK. Effects of taste aversion training on the acquisition of alcohol drinking in adolescent P and HAD rat lines. Alcohol Clin Exp Res. 1996;20:682–687. doi: 10.1111/j.1530-0277.1996.tb01672.x. [DOI] [PubMed] [Google Scholar]
- 49.McNaughton N. A gene promotes anxiety in mice—and also in scientists. A partial impairment of GABAA receptor in mice causes behavioral changes that resembles generalized anxiety disorder in humans. Nat Med. 1999;5:1131–1132. doi: 10.1038/13455. [DOI] [PubMed] [Google Scholar]
- 50.Meisch RA, Lemaire GA. Drug self-administration. In: Van Haren F, editor. Methods in behavioral pharmacology. Elsevier Science; New York: 1993. pp. 257–300. [Google Scholar]
- 51.Nowak KL, McBride WJ, Lumeng L, Li TK, Murphy JM. Blocking GABAA receptors in the anterior ventral tegmental area attenuates ethanol intake of the alcohol-preferring P rat. Psychopharmacology. 1998;139:108–116. doi: 10.1007/s002130050695. [DOI] [PubMed] [Google Scholar]
- 52.Paxinos G, Watson C. The rat brain in stereotaxic coordinates. Academic; Sydney: 1998. [DOI] [PubMed] [Google Scholar]
- 53.Phillips RG, LeDoux JE. Differential contributions of amygdala and hippocampus to cued and contextual fear conditioning. Behav Neurosci. 1992;106:274–282. doi: 10.1037//0735-7044.106.2.274. [DOI] [PubMed] [Google Scholar]
- 54.Pritchett DB, Luddens H, Seeburg PH. Type I and type II GABAA: benzodiazepine receptors produced in transfected cells. Science. 1989;245:1389–1392. doi: 10.1126/science.2551039. [DOI] [PubMed] [Google Scholar]
- 55.Puia G, Vicini S, Seeburg PH, Costa E. Influence of recombinant γ-aminobutyric acidA-receptor subunit composition on the action of allosteric modulators of γ-aminobutyric acid-gated Cl− currents. Mol Pharmacol. 1991;39:691–696. [PubMed] [Google Scholar]
- 56.Rassnick S, D'Amico E, Riley E, Koob GF. GABA antagonist and benzodiazepine partial inverse agonist reduce motivated responding for ethanol. Alcohol Clin Exp Res. 1993;17:124–130. doi: 10.1111/j.1530-0277.1993.tb00736.x. [DOI] [PubMed] [Google Scholar]
- 57.Rodefer JS, Campbell UC, Cosgrove KP, Carroll ME. Naltrexone pretreatment decreases the reinforcing efficacy of ethanol saccharin but not PCP or food under concurrent progressive-ratio schedules in rhesus monkeys. Psychopharmacology. 1999;147:81–89. doi: 10.1007/s002130050854. [DOI] [PubMed] [Google Scholar]
- 58.Samson HH, Hodge CW. Neurobehavioral regulation of ethanol intake. In Pharmacological effects of ethanol on the nervous system (Deitrich RA, Erwin VG, eds), pp 203–226. CRC; New York: 1996. [Google Scholar]
- 59.Scheel-Kruger J. Dopamine-GABA interactions: evidence that GABA transmits, modulates, and mediates dopaminergic functions in the basal ganglia and limbic system. Acta Neuro Scand Suppl. 1986;107:1–54. [PubMed] [Google Scholar]
- 60.Skolnick P, Hu RJ, Cook CM, Hurt SD, Trometer JD, Lui R, Huang Q, Cook JM. [3H]RY 80: a high affinity, selective ligand for γ-aminobutyric acidA receptors containing alpha-5 subunits. J Pharmacol Exp Ther. 1997;283:488–493. [PubMed] [Google Scholar]
- 61.Sur C, Fresu L, Howell O, McKernan RM, Atack JR. Autoradiographic localization of the α5 subunit-containing GABAA receptor in rat brain. Brain Res. 1999;822:265–270. doi: 10.1016/s0006-8993(99)01152-x. [DOI] [PubMed] [Google Scholar]
- 62.Suzdak P, Glowa JR, Crawley JN, Schwartz RD, Skolnick P, Paul SM. A selective imidazodiazepine antagonist of ethanol in the rat. Science. 1986;234:1243–1247. doi: 10.1126/science.3022383. [DOI] [PubMed] [Google Scholar]
- 63.Turner JD, Bodewitz G, Thompson CL, Stephenson FA. Immunohistochemical mapping of gamma-aminobutyric acid type-A receptor alpha subunits in rat central nervous system. In: Stephens DN, editor. Anxiolytic β-carbolines: from molecular biology to the clinic. Springer; New York: 1993. pp. 29–49. [DOI] [PubMed] [Google Scholar]
- 64.von Blankenfeld G, Ymer S, Pritchett D. Differential pharmacology of recombinant GABAA receptors. Neurosci Lett. 1990;115:269–273. doi: 10.1016/0304-3940(90)90467-n. [DOI] [PubMed] [Google Scholar]
- 65.Wafford KA, Bain CJ, Whiting PJ, Kemp JA. Functional comparison of the role of γ subunits in recombinant human γ-aminobutyric acidA/benzodiazepine receptors. Mol Pharmacol. 1993;44:437–442. [PubMed] [Google Scholar]
- 66.Wisden H, Laurie DJ, Monyer H, Seeburg PH. The distribution of 13 GABAA receptor subunit mRNAs in the rat brain: telencephalon, diencephalon, mesencephalon. J Neurosci. 1992;12:1040–1062. doi: 10.1523/JNEUROSCI.12-03-01040.1992. [DOI] [PMC free article] [PubMed] [Google Scholar]
- 67.Wong G, Skolnick P. High affinity ligands for “diazepam” sensitive benzodiazepine receptors. Eur J Pharmacol. 1992;225:63–68. doi: 10.1016/0922-4106(92)90040-3. [DOI] [PubMed] [Google Scholar]