

Abstract
Glutamate and GABA are two major fast neurotransmitters (excitatory and inhibitory, respectively) in the CNS, including the hypothalamus. They play a key role in the control of excitation/inhibition balance and determine the activity and excitability of neurons in many neuronal circuits. Using neuronal cultures, whole-cell recording, Ca2+ imaging, and Northern blots, we studied the compensatory regulation of neuronal activity during a prolonged decrease in glutamate excitation. We report here that after a chronic (6–17 d) blockade of ionotropic glutamate receptors, neurons in hypothalamic cultures revealed excitatory electrical and Ca2+ synaptic activity, which was not elicited in the control cultures that were not subjected to glutamate blockade. This activity was suppressed with acetylcholine (ACh) receptor antagonists and was potentiated by eserine, an inhibitor of acetylcholinesterase, suggesting its cholinergic nature. The upregulation of ACh receptors and the contribution of ACh to the control of the excitation/inhibition balance in cultures after a prolonged decrease in glutamate activity were also demonstrated. Enhanced ACh transmission was also found in chronically blocked cerebellar but not cortical cultures, suggesting the region-specific character of glutamate–ACh interactions in the brain. We believe that in the absence of glutamate excitation in the hypothalamus in vitro, ACh, a neurotransmitter normally exhibiting only weak activity in the hypothalamus, becomes the major excitatory neurotransmitter and supports the excitation/inhibition balance. The increase in excitatory ACh transmission during a decrease in glutamate excitation may represent a novel form of neuronal plasticity that regulates activity and excitability of neurons during the glutamate/GABA imbalance.
Keywords: acetylcholine, glutamate, GABA, hypothalamus, plasticity, excitation/inhibition balance
Synaptic excitation/inhibition imbalance may occur in neuronal circuits under normal conditions such as during an increase or decrease in activity of glutamate excitatory or GABA inhibitory inputs to neurons during development. It may also occur under pathological conditions (e.g., during the degeneration of glutamate or GABA neurons and terminals) or under conditions of pharmacological blockade of glutamate or GABA receptors used for clinical purposes. Such imbalance between the excitation and inhibition may change the activity and excitability of neurons in a circuit or may also disturb circuit function and viability. It has been known for many years that a relative increase in glutamate excitation or decrease in GABA inhibition in slices or cultures obtained from different regions of the CNS lead to glutamate-dependent neuronal hyperexcitability, which, if sustained, causes cell death (Mody et al., 1992; Choi, 1994;Thompson et al., 1996). In contrast, a decrease in glutamate-mediated excitation usually leads to the immediate domination of GABA inhibition (Bradford, 1995; Belousov and van den Pol, 1997b). Because GABA is not as toxic to neurons as glutamate, neurons in cultures can survive in the absence of glutamate excitation and the presence of GABA inhibition for long periods of time (up to several months) (Furshpan and Potter, 1989; Belousov and van den Pol, 1997a,b). However, the mechanisms that regulate activity and excitability of neurons during the prolonged decrease in glutamate excitation were not studied. It is not known whether such long-term imbalance between glutamate excitation and GABA inhibition can affect neuronal properties and functions and whether during this imbalance any compensatory mechanisms can be expressed by neurons to reestablish more normal synaptic excitation/inhibition interactions.
The hypothalamus is the crucial part of the brain that regulates homeostasis throughout the body. It contains >20 active substances that could be released synaptically within this brain structure, including acetylcholine (ACh), dopamine, and several other neurotransmitters and neurohormones. Glutamate and GABA neurons and receptors are also distributed within the hypothalamus, where they control the release of neurohormones, circadian activity, and other hypothalamic functions (van den Pol et al., 1990, 1994; Meeker et al., 1994; Belousov and van den Pol, 1997b; Obrietan and van den Pol, 1998). In the present set of experiments, we used primary hypothalamic neuronal cultures to study the mechanisms of compensatory regulation of neuronal activity during a prolonged blockade of ionotropic glutamate receptors. When we examined neuronal characteristics in cultured neurons, we found a dramatic upregulation of excitatory ACh transmission after a long-term decrease in glutamate activity. Additionally, neuronal disinhibition with GABAAreceptor antagonists revealed excitotoxic effects of synaptically released ACh in cultures after a chronic glutamate receptor blockade but not in the control cultures that were not subjected to the blockade of glutamate neurotransmission. Together, our data suggest that during a long-term decrease in the glutamate-mediated excitation in hypothalamic cultures, another less predominant excitatory neurotransmitter, ACh, begins to play the role of the major excitatory neurotransmitter and to support the excitation/inhibition balance in these cultures.
MATERIALS AND METHODS
Tissue cultures. Neuronal cultures were prepared from the embryonic (day 18–19) medial hypothalamus, cerebellum, and cortex obtained from Sprague Dawley rats as described (Belousov and van den Pol, 1997a). To obtain embryonic tissue, a pregnant rat was anesthetized with Nembutal (70 mg/kg) before embryos were removed. The tissue was then treated enzymatically (10 U/ml papain, 500 μm EDTA, 1.5 mmCaCl2, 0.2 mg/ml l-cysteine in Earle's balanced salt solution) for 30 min, resuspended in standard tissue culture medium, and triturated to form a single-cell suspension. The suspension was plated onto 22-mm-square glass coverslips precoated with polylysine (540,000 Da; Sigma-RBI; St. Louis, MO). Cultures were maintained in a Napco 5430 incubator at 37°C with 5% CO2. Cells were raised in glutamate- and glutamine-free minimal essential medium (Life Technologies, Rockville, MD) supplemented with 10% fetal bovine serum, 5 mg/100 ml gentamicin, and 6 gm/l glucose. After 2 d in vitro (DIV), the proliferation of non-neuronal cells was inhibited by the application of cytosine β-d-arabinofuranoside (1 μm). Two groups of cultures were used in most experiments: (1) cultures subjected to a chronic (14–17 d) blockade of NMDA and non-NMDA (AMPA and kainate) ionotropic glutamate receptors withd,l-2-amino-5-phosphonovalerate (AP5; 100 μm) and 6-cyano-7-nitroquinoxaline-2,3-dione (CNQX; 10 μm) (“blocked cultures”) and (2) sister control cultures not subjected to a glutamate receptor blockade. In most experiments, AP5 and CNQX were added to the incubation medium of the first group of cultures beginning 4 DIV, and neurons were tested after 14–17 d in block (DIB). Some cultures were chronically incubated in the presence of other receptor antagonists or 20 mm KCl as described in the text. Tissue culture medium was changed twice a week. Only healthy looking cultures were used in experiments; unhealthy cultures were discarded.
Electrophysiology. Standard bathing solution contained (in mm): 158.5 NaCl, 2.5 KCl, 2 CaCl2, 10 HEPES, 10 glucose, and 1 × 10⁻³glycine, pH 7.3, 325 mOsm (room temperature, 20–22°C). To perfuse the cells with solutions containing different agonists and antagonists for receptors, a flow pipe perfusion system was used (Belousov and van den Pol, 1997a). It consisted of several inputs into a final single short output terminated by a 0.5 mm internal diameter glass pipette. This perfusion pipette was aimed at the recorded cells (100 μm away), which were perfused continuously with the flow rate of 1.5 ml/min from the source containing the incubating solution. To change from one solution to another, the flow of the first solution was stopped, and the flow of the second solution was started. The newly applied solution flooded the tested cell in <0.5 sec.
The whole-cell current-clamp or voltage-clamp recordings were made with an Axoclamp-2B amplifier (Axon Instruments, Foster City, CA). Glass pipettes were pulled from borosilicate glass capillaries of 2 mm diameter and 0.2 mm wall thickness and filled with an internal solution that included (in mm): 145 potassium methylsulfate, 10 HEPES, 5 MgCl2, 1.1 EGTA, 4 Na-ATP, 0.5 Na-GTP, pH 7.2, 310 mOsm. After they were filled, the electrodes had a resistance of 2–5 MΩ. The seal resistances were 8–10 GΩ. Single-electrode continuous voltage-clamp mode was used to measure the membrane input resistance (Rinput) and the activity of IPSCs as described (Belousov and van den Pol, 1997a).Rinput was measured using an application of negative square-wave voltage steps of 10 mV amplitude (in the range of 10–50 mV) from a holding potential of −60 mV. IPSCs were recorded at a holding potential of −30 mV in the presence of AP5 (100 μm) and CNQX (10 μm). Data were monitored using a Dell Pentium II XPS R400 MHz computer and pCLAMP7/DigiPack 1200–1 software (Axon Instruments) and analyzed off-line with Igor Pro (WaveMetrics, Lake Oswego, OR) and InStat software (GraphPad Software, San Diego, CA).
Fura-2 Ca2+ digital imaging. Cells were loaded for 30 min at 37°C with 5 μm fura-2 acetoxymethyl ester (Molecular Probes, Eugene, OR) in a standard perfusion solution containing (in mm): 137 NaCl, 25 glucose, 10 HEPES, 5 KCl, 1 MgCl2, 3 CaCl2, 1 × 10⁻³glycine, pH 7.4. In the case of chronically blocked cultures, AP5 (100 μm) and CNQX (10 μm) were added to the loading solution. The coverslip then was washed in a perfusion solution and held in a laminar style chamber (Warner Instrument Corporation, Hamden, CT) that allows for a rapid (5–10 sec) and complete change in the medium. Experiments were performed at room temperature (20–22°C) and at a constant perfusion rate of 1.5 ml/min. Cells were imaged on a Nikon inverted microscope with a Nikon Super Fluor 20× objective. Convention dual wavelength ratios were obtained during sequential recordings at 340 and 380 nm excitation. Switching between 340 and 380 nm excitation filters was performed by a Sutter DG-4 optical filter changer (Sutter Instrument Company, Novato, CA). Emission light was measured at 510 nm. Data were collected every 4 sec using a SensiCam Digital CCD camera. A Dell Pentium II XPS R400 MHz computer and Axon Imaging Workbench software were used to control peripheral devices. Digitized, background-subtracted, single-cell ratiometric data from many (up to 100) cells were recorded simultaneously from the same video field.
Fura-2 data were calibrated using a commercially available kit (Molecular Probes fura-2 Calcium Imaging Calibration Kit; F-6774). Solutions containing 50 μm fura-2, 100 mmKCl, 10 mm MOPS, and defined Ca2+ concentrations ranging from 0 to 39 μm were placed between two glass coverslips and imaged. Ratios for zero Ca2+(Rmin) and saturating Ca2+(Rmax) were determined after background fluorescence from a fura-2-free solution had been subtracted. The values of Rmin andRmax were substituted into Equation 5 of Grynkiewicz et al. (1985), along with the valueSf/Sb (zero calcium fluorescence at 380 nm divided by saturating calcium fluorescence at 380 nm) and the dissociation constant of fura-2 (Kd = 224 nm). Calibrated Ca2+ data were transferred to a Power Macintosh G3 computer and analyzed with Igor Pro and InStat software.
Only Ca2+ changes in cell bodies were recorded. Previous Ca2+ imaging experiments revealed that all cultured hypothalamic neurons are NMDA sensitive (Obrietan and Van den Pol, 1995). Therefore, in our experiments, neurons were recognized by their responsiveness to the application of 10 μm NMDA in a Mg2+-free solution and by their “phase-bright” appearance. The responsiveness of chronically blocked neurons to NMDA was also used in some experiments to confirm that cells were healthy and responsive. A neuron was considered as responding to a pharmacological agent (e.g., bicuculline, nicotine, muscarine, NMDA, etc.) if, during the agent application, Ca2+ increased by >10 nm from the initial background level and if the level of Ca2+ decreased to the background after the agent washout. If Ca2+ oscillations were triggered by the agent, the amplitude of Ca2+ increase was measured at peaks of oscillations.
Northern blots. Total RNA was extracted from cultures, and Northern analysis was performed for three nicotinic ACh receptor (nAChR) subunits (α4, α7, β2) and five muscarinic ACh receptors (mAChRs) (m1–m5) as described (O'Hara et al., 1999). Briefly, RNA was extracted using Trizol (BRL) reagent, fractionated on 1.2% formaldehyde/agarose gels, and transferred to Nytran membranes (Schleicher & Schuell). RNA was visualized by ethidium bromide staining and cross-linked by UV irradiation. After prehybridization, membranes were hybridized at 42°C in 5× SSC, 50% formamide, 50 mm sodium phosphate, pH 6.8, 1% SDS, 1 mm EDTA, 2.5× Denhardt's, 200 mg/ml herring sperm DNA, and 1 × 10⁷ cpm/ml of radiolabeled random-primed cDNA probe. Membranes were washed twice for 30 min at 58°C in 0.4× SSC and 0.5% SDS. Filters were then exposed to Kodak XAR5 film for 1–10 d. Quantitation/densitometry of the relevant bands corresponding to mRNA hybridization was obtained using a computer-assisted image analysis system MCID (Imaging Research, St. Catherines, Ontario, Canada). Filters were stripped and reprobed sequentially with each AChR cDNA. Each subsequent probing and resultant autoradiogram were carefully analyzed to determine whether any residual radioactivity or banding patterns were evident. All banding patterns were consistent with the previous work (O'Hara et al., 1999). A dilution series was used for comparison to assure that quantitation of autoradiograms was within the linear range for each film exposure. cDNAs for nAChR subunits were obtained from Dr. J. Patrick (Baylor University), and muscarinic cDNAs were obtained from Dr. Tom Bonner (National Institute of Mental Health). Approximately one million cells were used from coverslips to collect ∼3 μg of total RNA per sample. Units were normalized for each probing. β-actin mRNA levels were similar across conditions and served as the control.
Toxicity assay. Glutamate and ACh excitotoxicity were estimated using a LIVE/DEAD Kit (Molecular Probes). Cultures were stained for 30 min with calcein AM (1 μm), which labels only live cells, and ethidium homodimer-1 (2 μm), which labels only dead cells. The coverslips were then washed and exposed to the appropriate excitation wavelengths: 490 nm (FITC filter) for the analysis of living cells and 580 nm (Texas Red filter) for the analysis of dead cells. A Nikon inverted microscope with a Nikon Super Fluor 20× objective was used for the staining analysis. The fluorescent colors of living (green) and dead (red) cells did not overlap (Fig. 1). The number of live neurons was counted in 36 randomly chosen fields in three coverslips for each test.
Fig. 1.

Staining of live and dead cells in hypothalamic neuronal cultures. The picture contains two superimposed images that were taken from the same microscope field using two different filters. The fluorescent colors of live (green) and dead (red) cells did not overlap. Live neurons were also recognized by the characteristic round or oval cell body and processes. An arrow points at the dead cell. Scale bar, 20 μm.
Drugs and chemicals. AP5, CNQX, NMDA, cytosine β-d-arabinofuranoside, tetrodotoxin (TTX), bicuculline methiodide, picrotoxin, atropine sulfate, mecamylamine, nicotine, muscarine, pirenzepine dihydrochloride, α-bungarotoxin, 4-[[4-formyl-5-hydroxy-6-methyl-3-[(phosphonooxy)methyl]-2-pyridinyl]azo]-1,3-benzenedisulfonic acid (PPADS), suramin, propranolol, carbamylcholine chloride (carbachol), and chemicals used for the internal and perfusion solutions (e.g., HEPES, EGTA, Na-ATP, Na-GTP, etc.) were obtained from Sigma-RBI. (±)-3-(2-Carboxypiperazin-4-yl)propanephosphonic acid (CPP), (RS)-1-aminoindan-1,5-dicarboxylic acid/UPF 523 (AIDA), (2S)-α-ethylglutamic acid (EGLU), and (RS)-α-methyl-4-sulfonophenylglycine (MSPG) were obtained from Tocris (Ballwin, MO).
Data analysis. In electrophysiological and Ca2+ experiments, characteristics of all neuronal responses (e.g., amplitude, frequency, etc.) to pharmacological agents were measured between 45 and 60 sec after the beginning of agent application. Statistical analysis of the experimental data was performed using a Power Macintosh G3 computer and InStat software. Data in all experiments were compared by Student'st test, using paired data when possible. All data are reported as mean ± SEM for the number of neurons indicated.
RESULTS
Neuronal activity in control hypothalamic cultures
High-frequency spontaneous EPSPs were detected in current-clamp recordings from 24 of 25 neurons (96%) in hypothalamic cultures (18–21 DIV). All EPSPs were suppressed by the joint application of ionotropic glutamate receptor antagonists AP5 (100 μm) and CNQX (10 μm) (n = 24 of 24 cells) (Figs. 2a, 3a) and were glutamatergic. EPSPs were not affected by mAChR antagonist atropine and nAChR antagonist mecamylamine (100 μm each; n = 5 neurons tested) (Fig. 3a). The excitatory activity was potentiated by the synaptic disinhibition with the GABAA receptor antagonist bicuculline (50 μm) (Fig. 3a). The frequency of action potentials was 0.5 ± 0.2 spikes/sec before and 4.8 ± 0.6 spikes/sec after the application of bicuculline (n= 5; p < 0.001). In three of five cells, bicuculline elicited a depolarization of the membrane potential (Vm) from −59.8 ± 1.4 mV to −44.3 ± 3.4 mV (n = 3; p < 0.02) (Fig. 3a). In two other cells, bicuculline evoked large-amplitude EPSPs (15–19 mV; 0.18–0.2 Hz) with only small depolarization (2–3 mV from the initial background level of −60 mV) during inter-EPSP intervals (data not shown). No excitatory activity was detected in control hypothalamic neurons during bicuculline application in the presence of glutamate receptor antagonists (n = 19 cells tested) (Fig. 3a).
Fig. 2.
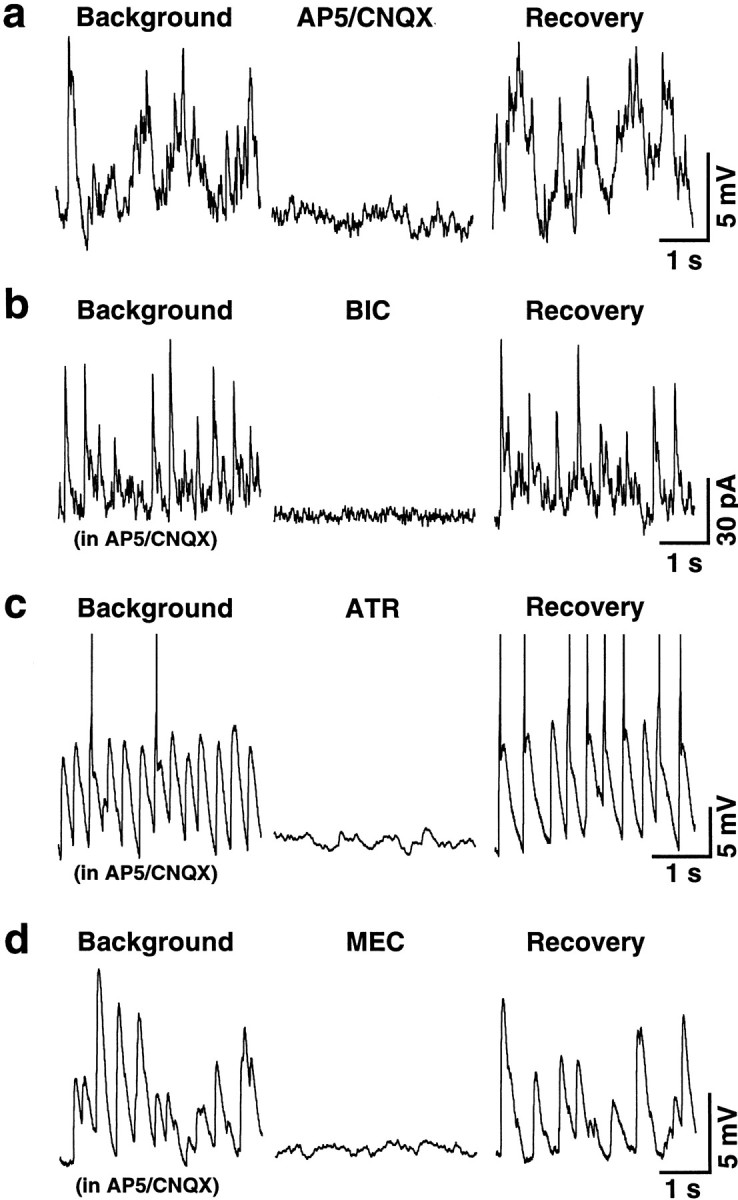
Spontaneous neuronal activity in the control cultures and cultures subjected to a chronic glutamate receptor blockade. Representative current-clamp (a,c, d) and voltage-clamp (b) recordings from two control (a, b) and two blocked (c,d) cells are shown. a, Glutamate-mediated activity recorded in this control neuron was suppressed with glutamate receptor antagonists (AP5/CNQX, 100 and 10 μm) and recovered after washout. b, GABA-mediated activity in another control cell was suppressed with bicuculline (BIC, 50 μm).c, d, ACh-dependent activity recorded in these two chronically blocked neurons was suppressed with either atropine (c, ATR, 10 μm) or mecamylamine (d, MEC, 10 μm). The following applies in all figures:Background, recording made before the applications of antagonist(s); Recovery, recording made after the antagonist(s) washout. AP5 (100 μm) and CNQX (10 μm) were in all mediums inb–d. Calibration bars: 1 sec (horizontal; a–d), 5 mV (vertical; a, c,d), 30 pA (vertical;b).
Fig. 3.

ACh-mediated electrical activity after a chronic glutamate receptor blockade. Current-clamp recordings are shown. a, This control cell revealed glutamate-dependent EPSPs after the removal of AP5/CNQX (100 and 10 μm) from the incubating medium. This activity was not affected by AChR antagonists (ATR/MEC; 100 μm each) but was potentiated by synaptic disinhibition (BIC; 50 μm). No response to bicuculline was detected in the cell in the presence of glutamate receptor antagonists. b, In this chronically blocked neuron, bicuculline revealed the sustained depolarization and increase in activity that was suppressed with atropine (100 μm). c, Large spontaneous EPSPs induced by bicuculline in another chronically blocked neuron (c-2) were suppressed with atropine (c-3) and recovered after washout (c-4). After bicuculline washout, activity recovered (c-5) to its initial low level (c-1). d, Bicuculline-induced activity in this blocked neuron (d-1) was not affected by atropine (100 μm; d-2) but was suppressed by mecamylamine (100 μm; d-3) or TTX (1 μm; d-4) and recovered after washout (d-5). Applications of antagonists ina and b are indicated by thebars above the recordings. Dashed linesin a also indicate the time periods of AP5 and CNQX application. The dotted line in brepresents the background Vm level. Thedashed line in d is the beginning of antagonist(s) application. AP5 (100 μm) and CNQX (10 μm) were in all solutions inb–d. Calibration bars are shown below the recordings.
Ca2+ imaging experiments revealed spontaneous glutamate-mediated intracellular Ca2+ oscillations in 11 of 200 (6%) control hypothalamic neurons (Fig.4a). The frequency of oscillations was 0.051 ± 0.003 Hz (n = 11; range 0.04–0.06 Hz). The average amplitude was 81.5 ± 10.2 nm Ca2+(n = 11), as measured from the background Ca2+ level that usually was 50–75 nm in different cells. Ca2+ rises were completely suppressed in the presence of glutamate receptor antagonists (AP5 and CNQX, 100 and 10 μm, respectively; n = 11). They were not affected, however, by atropine and mecamylamine (100 μm each) (Fig. 4a). After the joint application of AChR antagonists, the frequency of Ca2+ oscillations was 0.052 ± 0.003 Hz and the amplitude was 92.4 ± 12.6 nmCa2+ (n = 11; no significant difference from the control). The level of intracellular Ca2+ increased dramatically in almost all tested neurons (n = 196 of 200; 98%) in the presence of bicuculline (50 μm) (Fig. 4a). In these cells, the Ca2+ increase was 194.2 ± 5.9 nm from the initial background level. Oscillations of intracellular Ca2+, synchronous between many cells, were common in these conditions. Because the bicuculline-mediated Ca2+increases were not detected in the presence of glutamate receptor antagonists (Fig. 4a) (n = 436 cells tested), they likely represented the disinhibition of glutamate excitatory activity in cultured neurons.
Fig. 4.
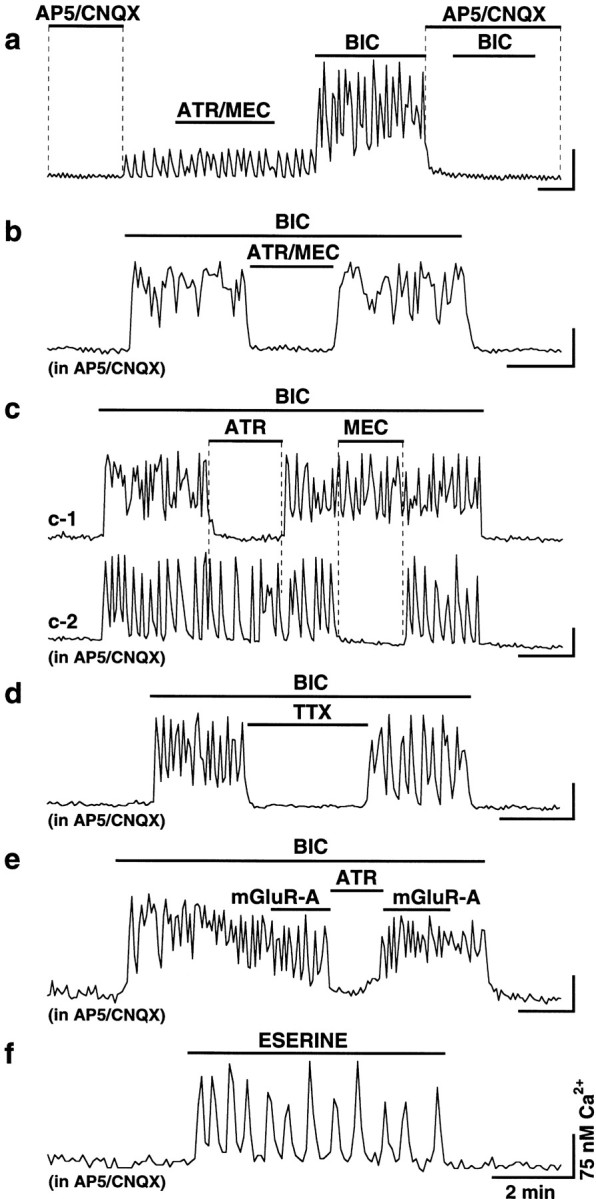
ACh-mediated Ca2+ activity in hypothalamic cultures after a chronic glutamate receptor blockade. Ca2+ digital imaging data obtained from one control (a) and six chronically blocked (b–f) neurons are presented. a, Typical control cell revealed glutamate-dependent Ca2+ rises after the removal ofAP5/CNQX (100 and 10 μm) from the incubating medium. This activity was not affected by AChR antagonists (ATR/MEC; 100 μm each) but was potentiated by synaptic disinhibition (BIC; 50 μm). No response to bicuculline was detected in the cell in the presence of glutamate receptor antagonists. b, In this blocked neuron, bicuculline increased the level of intracellular Ca2+ that was suppressed by atropine and mecamylamine (ATR/MEC; 10 μm each) applied jointly. c, Two cells in one culture responding differently to the separate application of atropine and mecamylamine (100 μm each). d, Ca2+activity was blocked with TTX (1 μm). e, The activity was not affected by metabotropic glutamate receptor antagonists (mGluR-A; see Results for details;ATR; 10 μm). f, Ca2+ activity was also induced by eserine (10 μm). AP5 and CNQX were in all solutions inb–f. Bicuculline (1 μm) was also in all solutions in f. Calibration bars: 2 min (horizontal) and 75 nmCa2+ (vertical) for all recordings.
Inhibitory neuronal activity was also detected in the control hypothalamic cultures. Voltage-clamp recordings revealed spontaneous IPSCs in 12 of 20 neurons (60%) that were completely suppressed by bicuculline (50 μm) and therefore were GABA mediated (Fig. 2b) (AP5 and CNQX were in all solutions; holding potential was −30 mV). IPSCs (n = 5 cells) and also EPSPs (n = 4 cells) were completely and reversibly suppressed by the voltage-gated Na+current blocker TTX (1 μm; data not shown). These data suggested that virtually all excitation and inhibition in the control hypothalamic cultures were caused by the synaptic release of glutamate and GABA from cultured neurons and activation of ionotropic glutamate and GABA receptors. The data also supported the idea that glutamate and GABA are two major fast neurotransmitters in the hypothalamus (van den Pol et al., 1990).
Upregulation of ACh transmission in hypothalamic cultures after a chronic glutamate receptor blockade
Chronic (14–17 d) glutamate receptor blockade with AP5 (100 μm) and CNQX (10 μm) was maintained in some hypothalamic cultures starting 4 DIV (“blocked cultures”). Cultures of the same age (18–21 DIV) not subjected to a glutamate receptor blockade served as control. When characteristics of neuronal activity were measured and compared between blocked and control cultures, no significant difference was detected in the following variables:Vm was −60.1 ± 1.9 mV (n = 20) in the control and −59.4 ± 0.6 mV (n = 84) in blocked cultures;Rinput was 1280 ± 167 MΩ (n = 20) and 1027 ± 75 MΩ (n = 84) in the control and after a chronic blockade, respectively; background levels of intracellular Ca2+were usually between 50 and 75 nm(n > 2000; half in each group); as in controls, many chronically blocked neurons (68%; n = 19 of 28) expressed spontaneous GABA-mediated IPSCs [in these experiments, IPSCs were recorded in all cells in the presence of AP5 and CNQX; other characteristics of neuronal activity (Vm,Rinput, levels of intracellular Ca2+) were measured with (blocked cultures) or without (control cultures) AP5/CNQX in the incubating medium].
Surprisingly, however, compared with the control cultures in which all excitatory activity was suppressed in the presence of AP5/CNQX (see above), recordings revealed low-amplitude (3–10 mV) spontaneous EPSPs at a frequency of 0.5–5 Hz in 54% of blocked neurons (n = 45 of 84) (Fig. 2c,d). The EPSPs were completely and reversibly suppressed by the mAChR antagonist atropine (10–100 μm) in 8 of 10 neurons (Fig.2c) or by the nAChR antagonist mecamylamine (10 μm) in 2 of 10 cells (Fig. 2d). This suggested that they were cholinergic in nature. Additionally, although no excitatory electrical activity was seen in control cultures after synaptic inhibition was blocked with bicuculline (50 μm) when AP5 and CNQX were present in the medium (n = 19) (Fig. 3a), large amplitude EPSPs, sustained depolarization, and a dramatic increase in action potentials were detected after synaptic disinhibition in 29 of 32 chronically blocked neurons (Fig. 3b–d). The frequency of action potentials was 0.3 ± 0.1 and 3.9 ± 0.5 spikes/sec before and after the application of bicuculline, respectively (n = 29; p < 0.0001). In the presence of bicuculline, spontaneous large EPSPs (16–30 mV; 0.2–0.25 Hz) were found in 17 of 29 (59%) of neurons (Fig. 3c). The rest of the cells (41%) revealed a sustained depolarization ofVm from the background level of −59.9 ± 0.8 mV to −47.7 ± 1.1 mV after bicuculline application (n = 12; p < 0.0001) (Fig.3b). The bicuculline-induced epileptiform-like hyperactivity in chronically blocked cultures was suppressed either by atropine (10–100 μm; n = 7 of 8) (Fig.3b,c) or by mecamylamine (100 μm; n = 1 of 8) (Fig.3d), suggesting that it was cholinergic in nature.
The bicuculline-induced electrical activity in blocked neurons was associated with a dramatic increase in the level of intracellular Ca2+ (Fig. 4b–e), which was not detected in control neurons in the AP5/CNQX-containing medium (Fig. 4a). In chronically blocked cultures, bicuculline increased intracellular Ca2+level in 1938 of 2335 neurons (83%). The amplitude of Ca2+ increase was in the range of 24–770 nm (average 203.2 ± 2.0 nm; n = 1938) as measured relative to the initial background Ca2+level. During bicuculline application, many of these neurons (52% of 1938) revealed Ca2+ oscillations that were usually regular and synchronized between all cells in the microscope field and were in the range of 0.02–0.06 Hz (Fig.5). Ca2+increase in other cells (48% of 1938) was steady, as shown in Figure4b. The bicuculline-induced Ca2+ activity was blocked or significantly (>50%) suppressed with the joint application of atropine and mecamylamine in 67% of 235 neurons at concentrations of 10 μm and in 94% of 161 neurons at concentrations of 100 μm (Fig. 4b, Table1). Atropine alone blocked or reduced the Ca2+ activity in 39% (of 144; 10 μm) and 69% (of 269; 100 μm) of neurons, and mecamylamine alone did that in 24% (of 90; 10 μm) and 48% (of 65; 100 μm) of cells. When atropine (100 μm) and mecamylamine (100 μm) were separately applied to the same cells, activity in 5 of 65 neurons (8%) was suppressed with mAChR but not nAChR antagonist (Fig. 4c-1), whereas in 3 of 65 cells (5%) the effect was the opposite (Fig. 4c-2).
Fig. 5.

ACh-mediated synchronous intracellular Ca2+ oscillations in blocked hypothalamic neurons. The activity of all seven cells was recorded simultaneously from one microscope field. BIC, 50 μm;ATR, 10 μm; MEC, 10 μm. AP5 and CNQX were in all solutions. Calibration bars: 2 min and 100 nm Ca2+ for all recordings.
Table 1.
Effect of some pharmacological agents on bicuculline-mediated Ca2+ increases in hypothalamic cultures subjected to a chronic glutamate receptor blockade1-a
| Number of neurons that decreased bicuculline-mediated response during pharmacological treatment (%) | Bicuculline-mediated Ca2+response, nmCa2+b | Treatment | |
|---|---|---|---|
| Before treatment | During treatment | ||
| n = 157 of 235 (67%) | 228.4 ± 8.3 | 12.4 ± 0.8*** | Atropine (10 μm) + Mecamilamine (10 μm) |
| n = 151 of 161 (94%) | 268.7 ± 7.6 | 12.3 ± 1.0*** | Atropine (100 μm) + Mecamilamine (100 μm) |
| n = 56 of 144 (39%) | 153.9 ± 12.0 | 19.6 ± 3.3*** | Atropine (10 μm) |
| n = 186 of 269 (69%) | 148.8 ± 6.4 | 11.8 ± 1.1*** | Atropine (100 μm) |
| n = 22 of 90 (24%) | 169.6 ± 8.1 | 11.2 ± 1.9*** | Mecamylamine (10 μm) |
| n = 31 of 65 (48%) | 191.8 ± 12.7 | 13.5 ± 2.7*** | Mecamylamine (100 μm) |
| n = 214 of 228 (94%) | 236.9 ± 11.3 | 7.9 ± 0.9*** | TTX (1 μm) |
| n = 9 of 303 (3%) | 192.2 ± 18.7 | 26.7 ± 11.2*** | AIDA (100 μm) + EGLU (100 μm) + MSPG (100 μm) |
| n = 0 of 122 (0%) | 0 | 0 | Suramin (100 μm) + PPADS (100 μm) |
| n = 2 of 98 (2%) | 250.5 ± 34.5 | 13.0 ± 13.0 (n.s.) | Propranolol (20 μm) |
| n = 26 of 54 (48%) | 176.5 ± 9.1 | 20.8 ± 3.9*** | Pirenzepine (5 μm) |
| n = 26 of 68 (38%) | 185.5 ± 9.6 | 15.1 ± 2.6*** | α-Bungarotoxin (100 nm) |
All tests presented here were done in the presence of 100 μm AP5 and 10 μm CNQX in all media. Bicuculline was 50 μm.
This column presents the average amplitude of bicuculline-mediated intracellular Ca2+ responses (mean ± SEM) measured before (left) and during (right) the treatment of cells with pharmacological agents that are indicated in the next column. The measurements were done relative to the background Ca2+ level. Calculations of the amplitude are shown only for neurons in which the response was reduced (by ≥50%) with the subsequent treatment. The number of these neurons is indicated in the first column. Significance of differences (Student's ttest): ***p < 0.0001; n.s., not significantly different.
The data described above supported the idea that the bicuculline-induced Ca2+ activity in blocked cultures was of a cholinergic origin. Importantly, the activity was also suppressed by TTX (1 μm) in all electrical recordings (n = 5 neurons) (Fig.3d-4) and in most of the Ca2+ imaging experiments (94% of 228 cells) (Fig. 4d), suggesting the synaptic release of ACh from cultured neurons. The activity was not significantly affected, however, by the antagonists of metabotropic glutamate receptors (AIDA, 100 μm; EGLU, 100 μm; and MSPG, 100 μm; applied together; decrease only in 3% of 303 cells) (Fig. 4e), P2 purinoreceptors (suramin, 100 μm; and PPADS, 100 μm; 0% of 122 cells; data not shown), and β-adrenoreceptors (propranolol, 20 μm; decrease in 2% of 98 cells; data not shown). Therefore, the activity was not caused by activation of these receptors.
Eserine (10 μm), an inhibitor of acetylcholinesterase (enzyme that hydrolyzes ACh), also induced Ca2+ increases in 57 of 106 (54%) chronically blocked cells (Fig. 4f). The average amplitude of Ca2+ increase during eserine application was 121.2 ± 10.0 nm, as measured from the initial background level (n = 57;p < 0.0001, calculated relative to zero; 1 μm bicuculline was in all solutions). In the meantime, in the control cultures, no Ca2+increase was detected in neurons (n = 0 of 132; data not shown) under similar conditions. These data provided further evidence for the upregulation of ACh transmission during a chronic decrease of glutamate excitation.
ACh regulation in cerebellar and cortical cultures
In our experiments, we also tested the expression of ACh-mediated Ca2+ activity in the control (18 DIV) and chronically blocked (14 DIB/18 DIV) cultures obtained from the cerebellum and cortex. Almost all (98%; n = 248 of 253) of the chronically blocked neurons but none (0%;n = 0 of 211) of the control cerebellar cells increased the level of intracellular Ca2+ (by ∼190 nm) or revealed synchronous intracellular Ca2+ oscillations (Fig.6a) during the application of bicuculline (AP5 and CNQX were in all mediums). This bicuculline-induced activity was blocked or suppressed (>50%) in 81% (n = 201 of 248) neurons by the joint application of atropine and mecamylamine (10 μm each) (Fig.6a). In cortical cultures, however, bicuculline-induced activity was detected in neither control neurons (n = 237 tested) nor neurons after a chronic glutamate receptor blockade (n = 254) (Fig. 6b).
Fig. 6.

Region-specific character of glutamate-dependent regulation of ACh transmission. a, ACh-mediated synchronous Ca2+ oscillations were detected in many cerebellar neurons after a chronic decrease in glutamate excitation. Activity of two representative cerebellar cells in a(a-1, a-2) were recorded simultaneously from the same microscope field. ATR, 10 μm; MEC, 10 μm.b, No excitatory activity was detected in chronically blocked cortical neurons. AP5 and CNQX were in all solutions except for the NMDA-containing (10 μm) but Mg2+-free solution in b that was used to confirm that the cell was healthy and responsive. Calibration bars: 1 min and 75 nm Ca2+ for all recordings.
Upregulation of ACh receptors
Two major types of AChRs have been determined previously in the mammalian CNS, including the hypothalamus: ionotropic nAChRs (directly coupled to an ionic channel) and metabotropic mAChRs (coupled to GTP-binding proteins) (Seguela et al., 1993; Wei et al., 1994; Shioda et al., 1997). In the CNS, excitatory ACh effects are usually associated with either influx of Na+and/or Ca2+ into the cell through nAChRs (α7 nAChR subunit is especially permeable for Ca2+) (Sargent, 1993; Role and Berg, 1996) or with m1 and m3 mAChR-dependent reduction of K+ conductances (Madison et al., 1987;Benson et al., 1988; Vanner et al., 1993); m1 and m3 mAChRs also increase levels of intracellular Ca2+through the mobilization of Ca2+ from intracellular stores (McKinney, 1993). We tested whether the increase in ACh transmission in hypothalamic cultures after a chronic glutamate receptor blockade was associated with the upregulation of AChRs. In control cultures, 29 (23%) and 17 (13%) of 128 neurons responded with an increase in intracellular Ca2+ to the application of nicotine and muscarine, respectively (10 μm each) (Fig.7a). Of 128 cells, 15 (12%) responded only to nicotine, 3 (2%) only to muscarine, 14 (11%) to both agonists, and 96 (75%) to neither of them. Meanwhile, 122 (83%) and 128 (87%) of 147 neurons responded to nicotine and muscarine in blocked cultures (Fig. 7b). Of 147 cells, 19 (13%) responded only to nicotine, 25 (17%) responded only to muscarine, 103 (70%) responded to both agonists, and none (0%) responded to neither of them. Such selective sensitivity of some neurons to either nicotine or muscarine, as well as selective suppression of bicuculline-mediated activity in some blocked cells by either nAChR or mAChR antagonists (Fig. 4c), may apparently represent the differential expression of two types of AChRs in various hypothalamic neurons. The amplitude of the Ca2+response to AChR agonists was also increased in neurons after a chronic glutamate receptor blockade. In blocked neurons compared with the control, Ca2+ response to nicotine was larger by 47%, and response to muscarine was larger by 102%.
Fig. 7.

Upregulation of AChRs after a chronic glutamate receptor blockade. Data from Ca2+ imaging (a, b, e,f) and Northern blot analyses (c,d) are presented. a, b, Responses of two representative control (a) and chronically blocked (b) neurons to nicotine (NIC; 10 μm) and muscarine (MUSC; 10 μm). c,d, Expression of mRNAs encoding five mAChRs (c) and three subunits of nAChRs (d) in the control (open bars;n = 4 coverslips) and chronically blocked (filled bars; n = 5 coverslips) cultures. Each bar shows the mean and SE. Significance of differences (Student's t test) relative to the control: *p < 0.05, **p < 0.001, ***p < 0.0001. e, f, Bicuculline-induced activity in two chronically blocked neurons was suppressed by pirenzepine (e, PIRENZ; 5 μm) or α-bungarotoxin (f, α-BUNG; 100 nm). AP5 and CNQX were in all solutions in Ca2+ recordings. TTX (1 μm) was in all solutions in a andb. Calibration bars: 2 min and 75 nmCa2+ for all Ca2+recordings.
The significant upregulation of mRNAs encoding two of five subtypes of mAChRs (Fig. 7c, m1 and m3) and two of three subunits of nAChRs (Fig. 7d, α4 and α7) was also detected in blocked cultures as compared with the control, as determined using Northern blots. When specific antagonists for m1 mAChR (pirenzepine, 5 μm) and α7 nAChR (α-bungarotoxin, 100 nm) were applied to chronically blocked neurons, they suppressed the bicuculline-induced Ca2+ activity in 48% of 54 neurons and 38% of 68 neurons, respectively (Fig. 7e,f, Table 1). This suggested that part of the activity was caused by activation of those AChRs.
Some insights on the mechanisms of glutamate-dependent ACh regulation
To further characterize the mechanisms responsible for the development of ACh activity in hypothalamic cultures during chronic glutamate receptor blockade, we used the partial blockade of NMDA and non-NMDA receptors with 20 μm AP5 and 2 μmCNQX for 2 weeks. Although in control cultures such concentrations of AP5 and CNQX were not sufficient to completely block the excitatory effects of externally applied glutamate (∼50% blockade;n = 78 cells) (Fig.8a), ACh-mediated Ca2+ activity was still detected in 34% of 80 cells chronically incubated in the presence of 20 μm AP5 and 2 μm CNQX (Fig. 8b, Table 2). A chronic (14 d) blockade of only NMDA glutamate receptors was sufficient for the upregulation of ACh activity in neurons: 73% of 90 cells and 69% of 106 cells expressed ACh-mediated activity in cultures subjected to NMDA receptor antagonists AP5 (100 μm) (Fig. 8c) and CPP (5 μm) (data not shown), respectively. A blockade of only non-NMDA receptors with 10 μm CNQX was not critical for the development of this activity (Fig. 8d) (only 1% of 233 neurons in such cultures revealed ACh excitation). Elevated potassium (20 mm), which is known to increase Ca2+ influx to cells through L-type voltage-gated Ca2+ channels (Bessho et al., 1994), could prevent the development of ACh activity in chronically blocked cultures. This was demonstrated in neurons subjected for 2 weeks to 100 μm AP5, 10 μm CNQX, and 20 mm KCl, which failed to express ACh-mediated activity (n = 341 tested) (Fig. 8e). Additionally, no ACh activity was found in neurons chronically (14 d) incubated in the presence of 1 μm TTX, which suppresses neuronal action potentials (n = 109) (Fig. 8f). These data suggested that the decrease in Ca2+influx through NMDA glutamate receptors, rather than activity-dependent regulation or inactivation of non-NMDA receptors, may be one mechanism responsible for the increase in ACh transmission during a chronic decrease in glutamate excitation in the hypothalamus in vitro.
Fig. 8.

Development of ACh activity in hypothalamic neuronal cultures. Representative recordings from Ca2+ imaging experiments are shown.a, Amplitude of responses of control hypothalamic neurons to externally applied glutamate (10 μm) was reduced by ∼50% in the presence of 20 μm AP5 and 2 μm CNQX (20/2). All glutamate-mediated activity recorded in the absence of glutamate receptor antagonists (0/0) was suppressed by 100 μm AP5 and 10 μm CNQX (100/10). Arrows indicate the time of antagonist introduction. b, ACh activity in culture grown in the presence of 20 μm AP5 and 2 μm CNQX. c, ACh activity in culture grown in the presence of 100 μm AP5 alone. d, Culture grown in the presence of 10 μm CNQX alone.e, Neurons grown in the presence of AP5, CNQX, and KCl (20 mm) did not reveal ACh activity, but they did express low amplitude (15–20 nm) Ca2+oscillations synchronized between all cells in the microscope field (two representative cells are shown). f, Culture grown in the presence of 1 μm TTX. g, ACh-mediated Ca2+ activity in cultures at different levels of glutamate excitation (see Results for explanation).h, Culture after 10 DIV/6 DIB. i, Culture after 74 DIV/14 DIB. All recordings inb–i were done in the presence of AP5 (100 μm) and CNQX (10 μm) in all solutions. NMDA (10 μm) solution in d,f, g-1, and g-3 did not contain Mg2+, AP5, and CNQX.b–i, BIC, 50 μm; ATR, 100 μm;MEC, 100 μm. Calibration bars: 2 min and 75 nm Ca2+ for all recordings.
Table 2.
Acetylcholine-dependent Ca2+ activity in hypothalamic cultures raised under various cell culture conditions2-a
| Culture condition | Total number of neurons responding to bicuculline | Number of neurons with the cholinergic response (%)2-b | Ca2+ response to bicuculline is reduced by AChR antagonists, nmCa2+ | |
|---|---|---|---|---|
| Bicuculline | Bicuculline + AChR antagonists | |||
| 20 μm AP5 + 2 μmCNQX | n = 30 of 80 | n = 27 of 80 (34%) | 166.9 ± 9.1 | 13.3 ± 2.1***2-c |
| 100 μmAP5 | n = 69 of 90 | n = 66 of 90 (73%) | 221.2 ± 13.6 | 22.4 ± 2.6*** |
| 5 μmCPP | n = 79 of 106 | n = 73 of 106 (69%) | 173.3 ± 9.5 | 19.8 ± 2.3*** |
| 10 μmCNQX | n = 2 of 233 | n = 2 of 233 (1%) | 156.5 ± 6.5 | 14.0 ± 4.0* |
| 100 μmAP5 + 10 μm CNQX + 20 mm KCL | n= 0 of 341 | n = 0 of 341 (0%) | 0 | 0 |
| 1 μm TTX | n = 0 of 109 | n = 0 of 109 (0%) | 0 | 0 |
| CONTROL2-d | n = 0 of 174 | n = 0 of 174 (0%) | 0 | 0 |
| BLOCK2-e (18 DIV/14 DIB) | n = 150 of 169 | n = 143 of 169 (85%) | 170.7 ± 8.1 | 21.6 ± 1.6*** |
| 10 d after BLOCKADE removal | n = 0 of 119 | n = 0 of 119 (0 %) | 0 | 0 |
| 10 d after BLOCKADE reintroduction | n = 67 of 105 | n = 57 of 105 (54%) | 112.2 ± 5.2 | 19.7 ± 2.8*** |
| BLOCK (10 DIV/6 DIB) | n = 9 of 59 | n = 7 of 59 (12%) | 135.4 ± 18.2 | 12.8 ± 5.0** |
| BLOCK (74 DIV/70 DIB) | n= 157 of 167 | n = 149 of 167 (89%) | 142.3 ± 6.2 | 25.8 ± 1.9*** |
| BLOCK (74 DIV/14 DIB) | n= 120 of 210 | n = 107 of 210 (51%) | 150.1 ± 5.8 | 11.9 ± 1.0*** |
All cells were tested with bicuculline (50 μm) in the presence of 100 μm AP5 and 10 μm CNQX in the medium.
This column presents the number of neurons that reduced (by ≥50%) bicuculline-mediated Ca2+response during the application of AChR antagonists, atropine and mecamylamine (100 μm each). The average amplitude of the response measured in these neurons before and during administration of AChR antagonists is shown in the next column.
Significance of differences (Student'st test) was calculated relative to the response mediated by bicuculline alone: ***p < 0.0001, **p< 0.001, *p < 0.05. The measurements of Ca2+ response were done relative to the initial background Ca2+ level.
CONTROL, Cells from control cultures (33 DIV). The experiment is illustrated in Figure 8g.
BLOCK, Cells from cultures chronically incubated in the presence of 100 μm AP5 and 10 μm CNQX. The time of incubation is shown in parentheses.
We tested the expression of ACh transmission in cultures at different levels of glutamate activity (Fig. 8g). Cultures in six coverslips were subjected for 14 d to glutamate receptor blockade with AP5 and CNQX. Two of those six cultures were tested and revealed ACh-mediated Ca2+ rises in 85% of 169 cells (Fig. 8g-2). In the remaining four coverslips, the concentrations of both AP5 (100 μm) and CNQX (10 μm) in the culture medium were then decreased by 20% each successive day. After 5 d, AP5 and CNQX were removed completely, and cells were cultured for 10 additional days in the absence of the glutamate receptor antagonists. When cultures in two of those four coverslips were tested, they expressed spontaneous glutamate-mediated EPSPs (n = 3 cells; data not shown) and did not reveal any ACh-dependent Ca2+activity (n = 119) (Fig. 8g-3), as did their sister control cultures that had never been subjected to chronic glutamate receptor blockade (174 cells in two coverslips; 33 DIV) (Fig.8g-1). Cultures in the other two of four coverslips were again subjected to a chronic glutamate receptor blockade for the next 10 d. When tested, ACh-mediated Ca2+activity was detected in these cultures, although in a lower percentage of neurons (54% of 105 neurons) (Fig. 8g-4). This showed the dynamic bi-directional plasticity of ACh transmission at different levels of glutamate excitation.
The chronic presence of glutamate receptor antagonists in the incubating medium is known to slow the rate of natural cell death and to increase neuronal survival in cell cultures, which is attributable most likely to a decrease in glutamate excitotoxicity (Obrietan and Van den Pol, 1995). To address the possibility that increased survival of neurons in blocked cultures may be responsible for the increase in ACh excitation, we studied the dynamics of development of ACh activity in blocked cultures. As found previously (Obrietan and Van den Pol, 1995), 10 DIV is the time when the relative number of neurons in the control and chronically blocked hypothalamic cultures is almost identical and the protective effect of glutamate receptor antagonists on neuronal survival is not yet manifested. In our experiments, ACh-mediated activity was already detected in cultures on 10 DIV/6 DIB (12% of 59 cells) (Fig. 8h). The number of neurons expressing ACh activity quickly increased to 83% in the following several days (by 14–17 DIB) and did not significantly change after almost 2.5 months of blockade (89% of 167 cells; 74 DIV/70 DIB) despite the continuous natural cell death. These data suggested that the upregulation of ACh activity was not the result of increased neuronal survival in chronically blocked cultures.
We tested whether ACh excitation can develop in cultures after their maturation or whether only immature cultures develop this activity. In these experiments, hypothalamic cultures were subjected to a chronic (14 d) glutamate receptor blockade starting at 60 DIV [i.e., well after maturation of synaptic connections in rat hypothalamic cultures (van den Pol et al., 1998)]. Although the ability of cultures to express ACh-mediated activity was reduced, 51% of 210 tested neurons still revealed ACh excitation (Fig. 8i). These data parallel those from the experiment with the reintroduction of glutamate receptor blockade to 1.5-month-old hypothalamic cultures (see above) (Fig.8g-4) and suggest the contribution of both developmental and non-developmental mechanisms to the glutamate-dependent regulation of ACh activity in the hypothalamusin vitro.
ACh supports the excitation/inhibition balance
A decrease in GABA activity in neuronal cultures or cultured slices obtained from different regions of the CNS can cause an imbalance in synaptic excitation/inhibition and, if sustained, cell death. Application of the GABAA receptor antagonists bicuculline (100 μm) and picrotoxin (500 μm) for 3 d to cultured hippocampal slices was found previously to cause a glutamate-dependent neurodegeneration that could be prevented with the NMDA and non-NMDA receptor antagonists MK-801 and CNQX (Thompson et al., 1996). This supported the idea of the contribution of glutamate and GABA to the regulation of the excitation/inhibition balance in the hippocampus. In our experiments using staining with the Live/Dead Kit, we found that bicuculline and picrotoxin, when applied in the same concentrations to the control hypothalamic cultures for 4 d (starting 18 DIV), also caused neurodegeneration. The number of live neurons per microscope field (p.m.f.) was 41.3 ± 2.1 and 34.1 ± 1.9, respectively, in cultures not treated and treated with GABAAreceptor antagonists as estimated in 36 randomly chosen microscope fields in three coverslips for each test (p < 0.001) (Fig. 9a,a-1, a-2). The neurodegeneration was prevented with glutamate receptor antagonists AP5 (100 μm) and CNQX (10 μm) (42.5 ± 1.8 live cells p.m.f.) (Fig. 9a,a-3), supporting the idea that glutamate and GABA are also involved in the regulation of the excitation/inhibition balance in the hypothalamus in vitro.
Fig. 9.
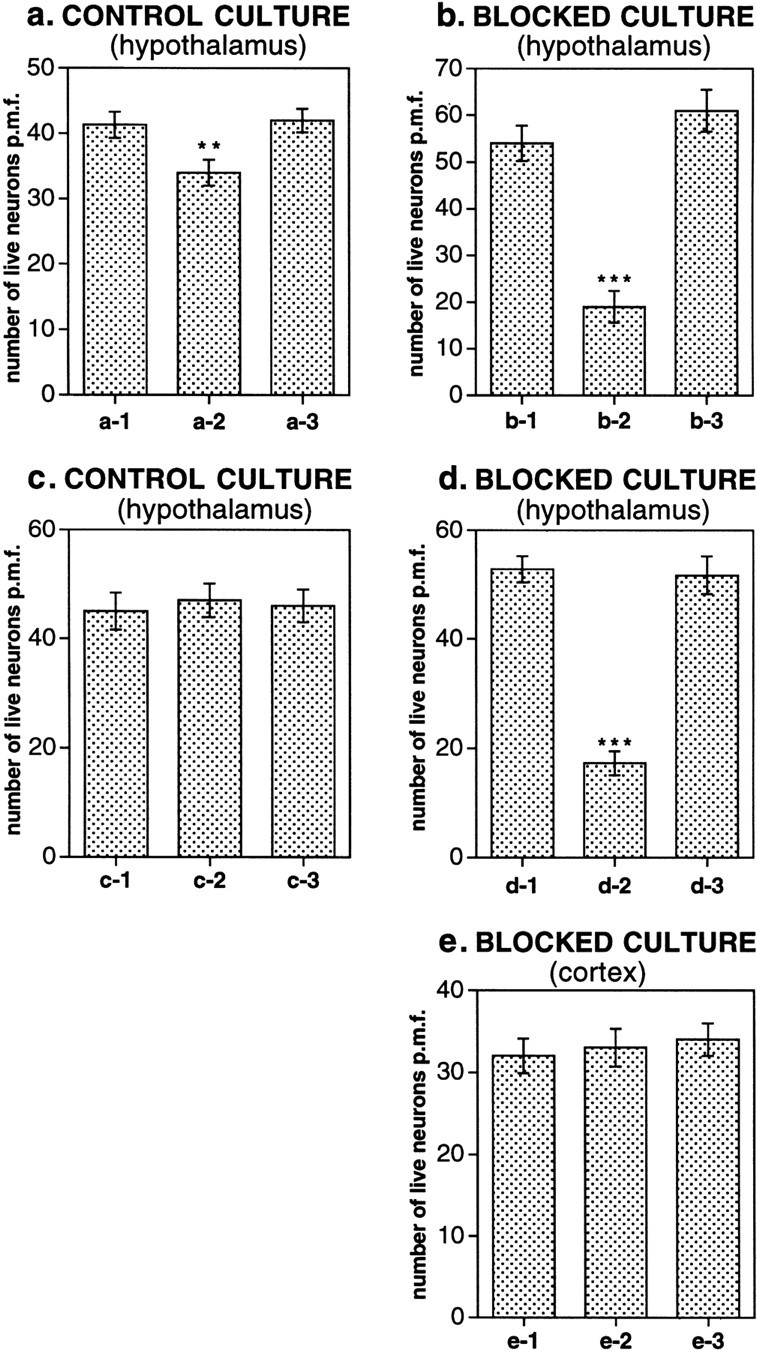
In the absence of glutamate excitation, ACh supports the excitation/inhibition balance in hypothalamic cultures. The number of live neurons per microscope field (p.m.f.) was calculated in control hypothalamic cultures (a, c), in blocked hypothalamic cultures (b, d), and in blocked cortical cultures (e). The first column in all graphs represents no treatment. a-2,b-2, e-2, Cultures treated for 4 d with bicuculline (100 μm) and picrotoxin (500 μm). a-3, b-3,e-3, Cultures treated for 4 d with bicuculline (100 μm), picrotoxin (500 μm), atropine (100 μm), and mecamylamine (100 μm).c-2, d-2, Cultures treated for 4 d with carbachol (50 μm). c-3,d-3, Cultures treated for 4 d with carbachol (50 μm), atropine (100 μm), and mecamylamine (100 μm). All control cultures were stained on 22 DIV; blocked cultures were stained on 22 DIV/18 DIB. Significance of differences relative to the corresponding group of cells that were not treated: ***p < 0.0001, **p < 0.001.
We then tested whether after a chronic glutamate receptor blockade ACh supports the excitation/inhibition balance and, namely, whether a prolonged imbalance between ACh excitation and GABA inhibition also leads to cell death. To test this hypothesis, bicuculline (100 μm) and picrotoxin (500 μm) were added for 4 d to some chronically blocked hypothalamic cultures starting 18 DIV/14 DIB. Other blocked cultures were not treated with GABAA receptor antagonists. In 4 d (22 DIV/18 DIB), all cultures were stained using the Live/Dead Kit, and the number of live cells was analyzed. In cultures not treated with GABA antagonists, 54.4 ± 3.8 live neurons p.m.f. were found (Fig.9b, b-1). Treatment of neurons for 4 d with bicuculline and picrotoxin significantly decreased the number of live neurons to 19.5 ± 3.4 p.m.f. (p < 0.0001) (Fig. 9b, b-2). The neurotoxicity mediated by GABAA receptor antagonists was prevented with atropine and mecamylamine (100 μm each; 61.5 ± 4.5 cells p.m.f) (Fig.9b, b-3), suggesting its cholinergic nature. In another experiment, when the AChR agonist carbachol (50 μm) was applied to blocked cultures for 4 d, it decreased the number of live neurons from 52.8 ± 2.4 to 17.3 ± 2.2 p.m.f. (p < 0.0001) (Fig.9d, d-1, d-2). This was prevented with atropine and mecamylamine (100 μm each; 51.7 ± 3.5 p.m.f) (Fig. 9d, d-3). Meanwhile, in control cultures (not subjected to a chronic glutamate receptor blockade) no effect of carbachol on cell survival was detected: 44.9 ± 3.43, 46.8 ± 3.09, and 45.9 ± 3.0 live neurons p.m.f. were found in nontreated cultures, carbachol-treated cultures, and cultures treated with carbachol and AChR antagonists, respectively (Fig. 9c).
In these experiments, we also tested cortical cultures subjected to a chronic glutamate receptor blockade. GABAAreceptor antagonists applied to these cultures for 4 d did not elicit neurodegeneration. The number of live neurons p.m.f. was 32.2 ± 2.1, 33.1 ± 2.3, and 34.4 ± 2.0 in nontreated cultures, cultures treated with GABAA receptor antagonists, and cultures treated with AChR and GABAA receptor antagonists, respectively (Fig.9e). The data suggest that in the absence of glutamate excitatory activity, ACh supports the excitation/inhibition balance in hypothalamic but not cortical cultures.
DISCUSSION
Taken together, our experiments demonstrated glutamate-dependent bi-directional regulation of cholinergic transmission in cultured neurons: a dramatic increase in excitatory ACh activity and upregulation of AChRs after a chronic blockade of glutamate neurotransmission and a decrease in cholinergic excitation in the presence of glutamate activity. Upregulation of ACh excitation after a decrease in glutamate activity was detected in hypothalamic and cerebellar cultures but not in cultures obtained from the cortex. These data parallel previous observations on rat pups in vivo(Facchinetti et al., 1993, 1994; Virgili et al., 1994, 1998), which also indicated a significant increase in cholinergic function in some regions of the CNS (cerebellum, spinal cord, striatum, globus pallidus, and nucleus accumbens) but not in others (cortex, hippocampus) during a chronic (3 weeks) glutamate receptor blockade. In our in vitro experiments we have determined that a decrease in Ca2+ influx into cells through NMDA glutamate receptors is the principal component responsible for the glutamate-dependent ACh upregulation in neurons. The inactivation of non-NMDA glutamate receptors or the activity-dependent mechanisms (inactivation of voltage-gated Na+channels) do not appear to contribute substantially to this upregulation.
Several different factors can cause a decrease in glutamate excitatory transmission in the CNS. Decreased glutamatergic functions in the cortex and striatum have been postulated to be a significant factor in the pathophysiology of schizophrenia (Riederer et al., 1992). Massive death of glutamatergic neurons was established in the human hippocampus during epilepsy (Babb, 1997) and stroke (Mitani et al., 1992;Inglefield et al., 1997), whereas interneurons within this sector continue to survive long term. Although the loss of cholinergic neurons of the basal forebrain was suggested to be responsible for Alzheimer's disease, degeneration of glutamatergic neurons in the hippocampus and cerebral cortex was also implied in the pathogenesis of this disease (Simpson et al., 1988; Lawlor and Davis, 1992). Massive degeneration of the hippocampal and cortical glutamate-secreting projecting neurons may likely reduce glutamate-mediated excitatory synaptic transmission in the brain and deprive target regions of excitatory inputs. Tumors and brain or spinal cord injuries can also damage or destroy glutamate neurons and projections (Llewellyn-Smith et al., 1997). Chronic ethanol exposure may reduce glutamate receptor activity by blocking NMDA receptors (Hoffman et al., 1992). Chronic application of drugs that reduce or completely suppress the activity of ionotropic glutamate receptors is used clinically for the treatment of epilepsy (Rogawski, 1992). Moreover, several clinical trials are currently being performed by National Institutes of Health for a number of NMDA and non-NMDA glutamate receptor antagonists (lamictal, eliprodil, amantadine, dextromethorphan, memantine, topiramate, CGS19755, LY300164, LY293558) for the treatment of Parkinson's disease, Huntington's chorea, orofacial neuralgias, chronic pain, drug dependence, and AIDS dementia (see http://clinicaltrials.gov/). These drugs are used for the chronic treatment of patients: e.g., LY300164 is given three times a day for 3 weeks.
In neuronal circuits, a decrease in glutamate activity usually triggers the compensatory mechanisms that are intended to increase glutamate functions of neurons: upregulation of postsynaptic glutamate receptors, regeneration and sprouting of glutamate terminals, etc. (Follesa and Ticku, 1996; van den Pol et al., 1996; Babb, 1997). Decrease in glutamate excitation may also potentially trigger other compensatory mechanisms, such as reorganization in other neurotransmitter systems, an upregulation of specific neurotrophic factors, an upregulation of certain ionic currents, and a modulation of the second messenger systems and gene expression. In the hypothalamus and some other regions of the CNS, one such compensatory mechanism may include an increase in the expression of ACh, which does not play a significant role as an excitatory neurotransmitter in the presence of glutamate excitation but begins to play this role when glutamate activity is decreased. In general, the upregulation of ACh transmission may represent the establishment of new pathways in neuronal circuits that allow neurons to continue excitatory communication even with the reduced or absent glutamate activity, which is normally responsible for the fast excitatory communication in the CNS. Consistent with this hypothesis are our data revealing neurotoxic effects of both synaptically released ACh and externally applied AChR agonist in blocked but not control hypothalamic cultures, suggesting that in the absence of glutamate, ACh supports the synaptic excitation/inhibition balance. Other observations have also revealed ACh hyperactivity, hypersensitivity, and sprouting of cholinergic projections that accompany the neurodegeneration of glutamate neurons in the hippocampus during epilepsy (Kish et al., 1988; Holtzman and Lowenstein, 1995;Correia et al., 1998). Cholinergic sprouting and ACh hypersensitivity have also been reported previously in the brain of Alzheimer's disease patients even when a minimal loss of cholinergic neurons in the basal forebrain was detected (Geddes et al., 1985). Additionally in our experiments, ACh excitation developed in hypothalamic cultures during the time frame (1–2 weeks) comparable with that of clinical treatment of patients with glutamate receptor antagonists. This suggests a possibility for the upregulation of ACh transmission in the CNS during clinical use of glutamate receptor blocking agents.
It is important to note that neuronal regeneration and development share many mechanisms and regulatory molecules that regulate axonal outgrowth and pathfinding, formation of synaptic connections, trophic interactions between synapses and target cells, and changes in neurotransmitter release and reception (Nicholls et al., 1992; Purves et al., 1997). Therefore, although the upregulation of ACh transmission can be seen as the regeneration of excitatory inputs to neurons aimed to compensate for the decrease in glutamate excitation, this may also represent the developmental aspects of ACh–glutamate interaction. In fact, in our experiments, when hypothalamic cultures were subjected to a chronic glutamate receptor blockade well after their maturation, the number of cells that revealed ACh activity in Ca2+ recordings was reduced in these cultures as compared with young cultures. This suggested the contribution of both developmental and non-developmental mechanisms to glutamate-dependent regulation of ACh transmission. Moreover, ACh appears to be the major excitatory neurotransmitter in the retina (Feller et al., 1996) and spinal cord (Milner and Landmesser, 1999) during early stages of development, before glutamate begins to play this role at the later stages. Indirect evidence also suggests high levels of cholinergic activity in the hypothalamus of rat and mouse on embryonic days 15–18 (Schambra et al., 1989; Naeff et al., 1992; Zoli et al., 1995), whereas glutamate activity in this region is not yet manifested (Chen et al., 1995). Because a chronic blockade of NMDA glutamate receptors leads to the development of a brain with immature network properties, as suggested earlier (Gorter and Brady, 1994;Scheetz et al., 1996), it is possible that such blockade may also preserve (or reestablish) ACh activity in cultures of those CNS regions where ACh excitation is typical at earlier stages of development. If this assumption is true, the expression of ACh activity during a chronic glutamate receptor blockade in retinal and spinal cultures can also be expected to occur.
Importantly, our experiments also revealed the upregulation of excitatory cholinergic neurotransmission even after a partial (∼50%) decrease in glutamate activity. Such culture conditions are probably more relevant to pathological or developmental conditions in vivo than to a total decrease in glutamate excitation.
Several possible mechanisms may potentially account for the upregulation of ACh transmission after a decrease in glutamate excitation. One possibility is a direct Ca2+-dependent regulation of cholinergic gene expression described previously for excitable cells (Walke et al., 1994). A second possibility is an increase in the expression of cholinergic differentiation factors that trigger the switch of neurons from a noncholinergic to a cholinergic phenotype. The presence of such factors in the CNS (e.g., ciliary neurotrophic factor and leukemia inhibitory factor) has been established (Landis, 1990). The ability of these factors to increase the cholinergic properties of cultured neurons was found to be prevented with elevated K+ (or increased Ca2+ influx to cells) and was less pronounced in older cultures (Landis, 1990). The development of ACh activity in chronically blocked hypothalamic cultures in our experiments was also prevented under similar depolarizing conditions and was reduced after culture maturation. A third possible mechanism may include sprouting of already existing cholinergic neurons and cholinergic synaptogenesis. The axonal sprouting, elongation of neurites, and increase in spine density have been detected previously during glutamate receptor blockade in tectal cultures (Lin and Constantine-Paton, 1998) and lateral geniculate slices (Rocha and Sur, 1995). In contrast, activation of glutamate receptors suppressed axon extension of cultured cerebellar granular neurons (Baird et al., 1996).
In conclusion, the upregulation of excitatory ACh transmission detected in our experiments on the hypothalamus in vitro appears to represent a novel form of neuronal plasticity that regulates the activity and excitability of neurons and supports the excitation/inhibition balance in many neuronal circuits in the CNS during a long-term decrease in glutamate excitation.
Footnotes
This research was supported by Tulane University funds (A.B.B.), Board of Regents Support Fund (A.B.B.), and National Institutes of Health Grant DA00187 (B.F.O.). We thank Dr. Anthony N. van den Pol and Dr. Hilary Srere for helpful discussions in the early phases of this project, and Steve Wiler and Vinh Cao for technical support.
Correspondence should be addressed to Dr. Andrei B. Belousov, Department of Cell and Molecular Biology, 2000 Percival Stern Hall, Tulane University, New Orleans, LA 70118. E-mail:belousov@tulane.edu.
REFERENCES
- 1.Babb TL. Axonal growth and neosynaptogenesis in human and experimental hippocampal epilepsy. Adv Neurol. 1997;72:45–51. [PubMed] [Google Scholar]
- 2.Baird DH, Trenkner E, Mason CA. Arrest of afferent axon extension by target neurons in vitro is regulated by the NMDA receptor. J Neurosci. 1996;16:2642–2648. doi: 10.1523/JNEUROSCI.16-08-02642.1996. [DOI] [PMC free article] [PubMed] [Google Scholar]
- 3.Belousov AB, van den Pol AN. Dopamine inhibition: enhancement of GABA activity and potassium channel activation in hypothalamic and arcuate nucleus neurons. J Neurophysiol. 1997a;78:674–688. doi: 10.1152/jn.1997.78.2.674. [DOI] [PubMed] [Google Scholar]
- 4.Belousov AB, van den Pol AN. Local synaptic release of glutamate from neurons in the rat hypothalamic arcuate nucleus. J Physiol (Lond) 1997b;499:747–761. doi: 10.1113/jphysiol.1997.sp021966. [DOI] [PMC free article] [PubMed] [Google Scholar]
- 5.Benson DM, Blitzer RD, Landau EM. An analysis of the depolarization produced in guinea-pig hippocampus by cholinergic receptor stimulation. J Physiol (Lond) 1988;404:479–496. doi: 10.1113/jphysiol.1988.sp017301. [DOI] [PMC free article] [PubMed] [Google Scholar]
- 6.Bessho Y, Nawa H, Nakanishi S. Selective up-regulation of an NMDA receptor subunit mRNA in cultured cerebellar granule cells by K(+)-induced depolarization and NMDA treatment. Neuron. 1994;12:87–95. doi: 10.1016/0896-6273(94)90154-6. [DOI] [PubMed] [Google Scholar]
- 7.Bradford HF. Glutamate, GABA and epilepsy. Prog Neurobiol. 1995;47:477–511. doi: 10.1016/0301-0082(95)00030-5. [DOI] [PubMed] [Google Scholar]
- 8.Chen G, Trombley PQ, van den Pol AN. GABA receptors precede glutamate receptors in hypothalamic development; differential regulation by astrocytes. J Neurophysiol. 1995;74:1473–1484. doi: 10.1152/jn.1995.74.4.1473. [DOI] [PubMed] [Google Scholar]
- 9.Choi DW. Glutamate receptors and the induction of excitotoxic neuronal death. Prog Brain Res. 1994;100:47–51. doi: 10.1016/s0079-6123(08)60767-0. [DOI] [PubMed] [Google Scholar]
- 10.Correia L, Amado D, Cavalheiro EA, Bentivoglio M. Persistence and atrophy of septal/diagonal band neurons expressing the p75 neurotrophin receptor in pilocarpine-induced chronic epilepsy in the rat. Brain Res. 1998;809:288–293. doi: 10.1016/s0006-8993(98)00871-3. [DOI] [PubMed] [Google Scholar]
- 11.Facchinetti F, Ciani E, Dall'Olio R, Virgili M, Contestabile A, Fonnum F. Structural, neurochemical and behavioural consequences of neonatal blockade of NMDA receptor through chronic treatment with CGP 39551 or MK-801. Brain Res Dev Brain Res. 1993;74:219–224. doi: 10.1016/0165-3806(93)90007-w. [DOI] [PubMed] [Google Scholar]
- 12.Facchinetti F, Dall'Olio R, Ciani E, Sparapani M, Virgili M, Contestabile A. Long-lasting effects of chronic neonatal blockade of N-methyl-d-aspartate receptor through the competitive antagonist CGP 39551 in rats. Neuroscience. 1994;60:343–353. doi: 10.1016/0306-4522(94)90248-8. [DOI] [PubMed] [Google Scholar]
- 13.Feller MB, Wellis DP, Stellwagen D, Werblin FS, Shatz CJ. Requirement for cholinergic synaptic transmission in the propagation of spontaneous retinal waves. Science. 1996;272:1182–1187. doi: 10.1126/science.272.5265.1182. [DOI] [PubMed] [Google Scholar]
- 14.Follesa P, Ticku MK. NMDA receptor upregulation: molecular studies in cultured mouse cortical neurons after chronic antagonist exposure. J Neurosci. 1996;16:2172–2178. doi: 10.1523/JNEUROSCI.16-07-02172.1996. [DOI] [PMC free article] [PubMed] [Google Scholar]
- 15.Furshpan EJ, Potter DD. Seizure-like activity and cellular damage in rat hippocampal neurons in cell culture. Neuron. 1989;3:199–207. doi: 10.1016/0896-6273(89)90033-0. [DOI] [PubMed] [Google Scholar]
- 16.Geddes JW, Monaghan DT, Cotman CW, Lott IT, Kim RC, Chui HC. Plasticity of hippocampal circuitry in Alzheimer's disease. Science. 1985;230:1179–1181. doi: 10.1126/science.4071042. [DOI] [PubMed] [Google Scholar]
- 17.Gorter JA, Brady RJ. NMDA receptor responses in adult hippocampal CA1 region after neonatal treatment with MK-801: comparison with NMDA receptor responses in the immature rat. Brain Res. 1994;665:63–68. doi: 10.1016/0006-8993(94)91152-5. [DOI] [PubMed] [Google Scholar]
- 18.Hoffman PL, Grant KA, Snell LD, Reinlib L, Iorio K, Tabakoff B. NMDA receptors: role in ethanol withdrawal seizures. Ann NY Acad Sci. 1992;654:52–60. doi: 10.1111/j.1749-6632.1992.tb25955.x. [DOI] [PubMed] [Google Scholar]
- 19.Holtzman DM, Lowenstein DH. Selective inhibition of axon outgrowth by antibodies to NGF in a model of temporal lobe epilepsy. J Neurosci. 1995;15:7062–7070. doi: 10.1523/JNEUROSCI.15-11-07062.1995. [DOI] [PMC free article] [PubMed] [Google Scholar]
- 20.Inglefield JR, Wilson CA, Schwartz-Bloom RD. Effect of transient cerebral ischemia on gamma-aminobutyric acidA receptor alpha 1-subunit-immunoreactive interneurons in the gerbil CA1 hippocampus. Hippocampus. 1997;7:511–523. doi: 10.1002/(SICI)1098-1063(1997)7:5<511::AID-HIPO7>3.0.CO;2-J. [DOI] [PubMed] [Google Scholar]
- 21.Kish SJ, Olivier A, Dubeau F, Robitaille Y, Sherwin AL. Increased activity of choline acetyltransferase and acetylcholinesterase in actively epileptic human cerebral cortex. Epilepsy Res. 1988;2:227–231. doi: 10.1016/0920-1211(88)90012-5. [DOI] [PubMed] [Google Scholar]
- 22.Landis SC. Target regulation of neurotransmitter phenotype. Trends Neurosci. 1990;13:344–350. doi: 10.1016/0166-2236(90)90147-3. [DOI] [PubMed] [Google Scholar]
- 23.Lawlor BA, Davis KL. Does modulation of glutamatergic function represent a viable therapeutic strategy in Alzheimer's disease? Biol Psychiatry. 1992;31:337–350. doi: 10.1016/0006-3223(92)90227-q. [DOI] [PubMed] [Google Scholar]
- 24.Lin SY, Constantine-Paton M. Suppression of sprouting: an early function of NMDA receptors in the absence of AMPA/kainate receptor activity. J Neurosci. 1998;18:3725–3737. doi: 10.1523/JNEUROSCI.18-10-03725.1998. [DOI] [PMC free article] [PubMed] [Google Scholar]
- 25.Llewellyn-Smith IJ, Cassam AK, Krenz NR, Krassioukov AV, Weaver LC. Glutamate- and GABA-immunoreactive synapses on sympathetic preganglionic neurons caudal to a spinal cord transection in rats. Neuroscience. 1997;80:1225–1235. doi: 10.1016/s0306-4522(97)00155-3. [DOI] [PubMed] [Google Scholar]
- 26.Madison DV, Lancaster B, Nicoll RA. Voltage clamp analysis of cholinergic action in the hippocampus. J Neurosci. 1987;7:733–741. doi: 10.1523/JNEUROSCI.07-03-00733.1987. [DOI] [PMC free article] [PubMed] [Google Scholar]
- 27.McKinney M. Muscarinic receptor subtype-specific coupling to second messengers in neuronal systems. Prog Brain Res. 1993;98:333–340. doi: 10.1016/s0079-6123(08)62416-4. [DOI] [PubMed] [Google Scholar]
- 28.Meeker RB, Greenwood RS, Hayward JN. Glutamate receptors in the rat hypothalamus and pituitary. Endocrinology. 1994;134:621–629. doi: 10.1210/endo.134.2.7905409. [DOI] [PubMed] [Google Scholar]
- 29.Milner LD, Landmesser LT. Cholinergic and GABAergic inputs drive patterned spontaneous motoneuron activity before target contact. J Neurosci. 1999;19:3007–3022. doi: 10.1523/JNEUROSCI.19-08-03007.1999. [DOI] [PMC free article] [PubMed] [Google Scholar]
- 30. Mitani A, Andou Y, Kataoka K. Selective vulnerability of hippocampal CA1 neurons cannot be explained in terms of an increase in glutamate concentration during ischemia in the gerbil: brain microdialysis study. Neuroscience 48 1992. 307 313[Erratum (1992) 50:251]. [DOI] [PubMed] [Google Scholar]
- 31.Mody I, Otis TS, Staley KJ, Kohr G. The balance between excitation and inhibition in dentate granule cells and its role in epilepsy. Epilepsy Res [Suppl] 1992;9:331–339. [PubMed] [Google Scholar]
- 32.Naeff B, Schlumpf M, Lichtensteiger W. Pre- and postnatal development of high-affinity [3H]nicotine binding sites in rat brain regions: an autoradiographic study. Brain Res Dev Brain Res. 1992;68:163–174. doi: 10.1016/0165-3806(92)90058-5. [DOI] [PubMed] [Google Scholar]
- 33.Nicholls JG, Martin AR, Wallace BG. A cellular and molecular approach to the function of the nervous system. Sinauer; Sunderland, MA: 1992. Denervation and regeneration of synaptic connections. pp. 388–421. [Google Scholar]
- 34.O'Hara BF, Macdonald E, Clegg D, Wiler SW, Andretic R, Cao VH, Miller JD, Heller HC, Kilduff TS. Developmental changes in nicotinic receptor mRNAs and responses to nicotine in the suprachiasmatic nucleus and other brain regions. Brain Res Mol Brain Res. 1999;66:71–82. doi: 10.1016/s0169-328x(99)00004-2. [DOI] [PubMed] [Google Scholar]
- 35.Obrietan K, van den Pol AN. Calcium hyperexcitability in neurons cultured with glutamate receptor blockade. J Neurophysiol. 1995;73:1524–1536. doi: 10.1152/jn.1995.73.4.1524. [DOI] [PubMed] [Google Scholar]
- 36.Obrietan K, van den Pol AN. GABAB receptor-mediated inhibition of GABAA receptor calcium elevations in developing hypothalamic neurons. J Neurophysiol. 1998;79:1360–1370. doi: 10.1152/jn.1998.79.3.1360. [DOI] [PubMed] [Google Scholar]
- 37.Purves D, Augustine GJ, Fitzpatrick D, Katz LC, LaMantia A-S, McNamara JO. Neuroscience. Sinauer; Sunderland, MA: 1997. [Google Scholar]
- 38.Riederer P, Lange KW, Kornhuber J, Danielczyk W. Glutamatergic-dopaminergic balance in the brain. Its importance in motor disorders and schizophrenia. Arzneimittelforschung. 1992;42:265–268. [PubMed] [Google Scholar]
- 39.Rocha M, Sur M. Rapid acquisition of dendritic spines by visual thalamic neurons after blockade of N-methyl-d-aspartate receptors. Proc Natl Acad Sci USA. 1995;92:8026–8030. doi: 10.1073/pnas.92.17.8026. [DOI] [PMC free article] [PubMed] [Google Scholar]
- 40.Rogawski MA. The NMDA receptor, NMDA antagonists and epilepsy therapy. A status report. Drugs. 1992;44:279–292. doi: 10.2165/00003495-199244030-00001. [DOI] [PubMed] [Google Scholar]
- 41.Role LW, Berg DK. Nicotinic receptors in the development and modulation of CNS synapses. Neuron. 1996;16:1077–1085. doi: 10.1016/s0896-6273(00)80134-8. [DOI] [PubMed] [Google Scholar]
- 42.Sargent PB. The diversity of neuronal nicotinic acetylcholine receptors. Annu Rev Neurosci. 1993;16:403–443. doi: 10.1146/annurev.ne.16.030193.002155. [DOI] [PubMed] [Google Scholar]
- 43.Schambra UB, Sulik KK, Petrusz P, Lauder JM. Ontogeny of cholinergic neurons in the mouse forebrain. J Comp Neurol. 1989;288:101–122. doi: 10.1002/cne.902880109. [DOI] [PubMed] [Google Scholar]
- 44.Scheetz AJ, Prusky GT, Constantine-Paton M. Chronic NMDA receptor antagonism during retinotopic map formation depresses CaM kinase II differentiation in rat superior colliculus. Eur J Neurosci. 1996;8:1322–1328. doi: 10.1111/j.1460-9568.1996.tb01594.x. [DOI] [PubMed] [Google Scholar]
- 45.Seguela P, Wadiche J, Dineley-Miller K, Dani JA, Patrick JW. Molecular cloning, functional properties, and distribution of rat brain alpha 7: a nicotinic cation channel highly permeable to calcium. J Neurosci. 1993;13:596–604. doi: 10.1523/JNEUROSCI.13-02-00596.1993. [DOI] [PMC free article] [PubMed] [Google Scholar]
- 46.Shioda S, Nakajo S, Hirabayashi T, Nakayama H, Nakaya K, Matsuda K, Nakai Y. Neuronal nicotinic acetylcholine receptor in the hypothalamus: morphological diversity and neuroendocrine regulations. Brain Res Mol Brain Res. 1997;49:45–54. doi: 10.1016/s0169-328x(97)00122-8. [DOI] [PubMed] [Google Scholar]
- 47.Simpson MD, Royston MC, Deakin JF, Cross AJ, Mann DM, Slater P. Regional changes in [3H]d-aspartate and [3H]TCP binding sites in Alzheimer's disease brains. Brain Res. 1988;462:76–82. doi: 10.1016/0006-8993(88)90587-2. [DOI] [PubMed] [Google Scholar]
- 48.Thompson SM, Fortunato C, McKinney RA, Muller M, Gahwiler BH. Mechanisms underlying the neuropathological consequences of epileptic activity in the rat hippocampus in vitro. J Comp Neurol. 1996;372:515–528. doi: 10.1002/(SICI)1096-9861(19960902)372:4<515::AID-CNE2>3.0.CO;2-7. [DOI] [PubMed] [Google Scholar]
- 49.van den Pol AN, Wuarin JP, Dudek FE. Glutamate, the dominant excitatory transmitter in neuroendocrine regulation. Science. 1990;250:1276–1278. doi: 10.1126/science.1978759. [DOI] [PubMed] [Google Scholar]
- 50.van den Pol A, Hermans-Borgmeyer I, Hofer M, Ghosh P, Heinemann S. Ionotropic glutamate-receptor gene expression in hypothalamus: localization of AMPA, kainate, and NMDA receptor RNA with in situ hybridization. J Comp Neurol. 1994;343:428–444. doi: 10.1002/cne.903430307. [DOI] [PubMed] [Google Scholar]
- 51.van den Pol AN, Obrietan K, Belousov A. Glutamate hyperexcitability and seizure-like activity throughout the brain and spinal cord upon relief from chronic glutamate receptor blockade in culture. Neuroscience. 1996;74:653–674. doi: 10.1016/0306-4522(96)00153-4. [DOI] [PubMed] [Google Scholar]
- 52.van den Pol AN, Obrietan K, Belousov AB, Yang Y, Heller HC. Early synaptogenesis in vitro: role of axon target distance. J Comp Neurol. 1998;399:541–560. doi: 10.1002/(sici)1096-9861(19981005)399:4<541::aid-cne7>3.3.co;2-u. [DOI] [PubMed] [Google Scholar]
- 53.Vanner S, Evans RJ, Matsumoto SG, Surprenant A. Potassium currents and their modulation by muscarine and substance P in neuronal cultures from adult guinea pig celiac ganglia. J Neurophysiol. 1993;69:1632–1644. doi: 10.1152/jn.1993.69.5.1632. [DOI] [PubMed] [Google Scholar]
- 54.Virgili M, Facchinetti F, Contestabile A. Chronic neonatal NMDA blockade results in long-term cholinergic increase in the rat spinal cord. NeuroReport. 1994;5:2023–2025. doi: 10.1097/00001756-199410270-00008. [DOI] [PubMed] [Google Scholar]
- 55.Virgili M, Facchinetti F, Sparapani M, Tregnago M, Lucchi R, Dall'Olio R, Gandolfi O, Contestabile A. Neuronal nitric oxide synthase is permanently decreased in the cerebellum of rats subjected to chronic neonatal blockade of N-methyl-d-aspartate receptors. Neurosci Lett. 1998;258:1–4. doi: 10.1016/s0304-3940(98)00742-3. [DOI] [PubMed] [Google Scholar]
- 56.Walke W, Staple J, Adams L, Gnegy M, Chahine K, Goldman D. Calcium-dependent regulation of rat and chick muscle nicotinic acetylcholine receptor (nAChR) gene expression. J Biol Chem. 1994;269:19447–19456. [PubMed] [Google Scholar]
- 57.Wei J, Walton EA, Milici A, Buccafusco JJ. m1–m5 muscarinic receptor distribution in rat CNS by RT-PCR and HPLC. J Neurochem. 1994;63:815–821. doi: 10.1046/j.1471-4159.1994.63030815.x. [DOI] [PubMed] [Google Scholar]
- 58.Zoli M, Le Novere N, Hill JA, Jr, Changeux JP. Developmental regulation of nicotinic ACh receptor subunit mRNAs in the rat central and peripheral nervous systems. J Neurosci. 1995;15:1912–1939. doi: 10.1523/JNEUROSCI.15-03-01912.1995. [DOI] [PMC free article] [PubMed] [Google Scholar]