Abstract
Motion-sensitive large-field neurons found at higher processing stages in many species often exhibit a remarkable selectivity for particular flow fields. However, the underlying neural mechanisms are not yet understood. We studied this problem in the so-called lobula plate tangential cells (LPTCs) of the fly. Investigating the connectivity between LPTCs by means of dual recordings, we find two types of connections: (1) heterolateral connections between LPTCs of both hemispheres and (2) ipsilateral connections between LPTCs within one lobula plate. The circuit is suitable to amplify incoming, dendritic signals in the case of rotatory flow fields and to reduce them in the case of other flow-field structures. In addition to feedforward connectivity, thus, the flow-field selectivity of LPTCs may be significantly attributable to recurrent excitation involving the network of large-field neurons in both brain hemispheres.
Keywords: network interactions, motion detection, insect, vision, electrophysiology, dendrite
For visual course control, motion cues play a dominant role. Therefore, it is not surprising to find motion-sensitive neurons with large and often complex receptive fields at higher processing stages in the visual system of many species, like area MST in monkeys (Tanaka and Saito, 1989; Tanaka et al., 1989; Duffy and Wurtz, 1991a,b), the lateral suprasylvian cortex of cats (Rauschecker et al., 1987), the nucleus BOR (Wylie and Frost, 1999) or nucleus rotundus (Wang and Frost, 1992) of pigeons, and the lobula plate of flies (Hausen, 1984; Krapp and Hengstenberg, 1996;Krapp et al., 1998). Such receptive field structures can in principle arise via input from respectively oriented small-field elements alone. However, the response selectivity may be further enhanced via network interactions between various large-field neurons. Because within each hemisphere of the blowfly the lobula plate contains only ∼60 individually identifiable such neurons [lobula plate tangential cells (LPTCs)] (Hausen, 1982a,b; Hengstenberg, 1982; Hengstenberg et al., 1982; Borst and Haag, 1996), this system lends itself well to a detailed analysis of the mechanisms underlying flow-field selectivity of motion-sensitive large-field neurons.
Almost all LPTCs respond to visual motion in a directionally selective way (Borst and Egelhaaf, 1989, 1990; Single et al., 1997; Single and Borst, 1998). Among them are the graded potential horizontal system (HS) and centrifugal horizontal (CH) cells. HS cells differ from CH cells by their active membrane properties (Hengstenberg, 1977; Haag and Borst, 1996; Haag et al., 1997) as well as with respect to their synaptic organization (Hausen et al., 1980; Eckert and Meller, 1981;Gauck et al., 1997). There exist two CH cells in each brain hemisphere [a dorsal CH (dCH) and a ventral CH (vCH)] and three HS cells [the HS northern (HSN), the HS equatorial (HSE), and the HS southern (HSS) cell]. The different members of each family occupy different regions within the lobula plate and, because of the retinotopic organization, have different but often overlapping receptive fields together covering almost completely the visual space surrounding the animal.
In contrast to HS and CH cells, which restrict their ramifications to one brain hemisphere, the H1 and H2 cells (Eckert, 1980; Hausen, 1981) are purely spiking neurons and project with their axon toward the other brain hemisphere (“heterolateral elements”). The H1 cell has been used in many studies to explore the nature of the neural code (Bialek et al., 1991; de Ruyter van Steveninck et al., 1997; Haag and Borst, 1997, 1998). H1 and H2 cells connect to HS and CH cells, thus conveying motion information from one-half of the visual surround to neurons that receive motion information on their main dendrite about the other half of the visual surround (Hausen, 1977, 1981, 1984; Eckert and Dvorak, 1983; Haag, 1994; Haag et al., 1999; Horstmann et al., 2000). As a result, HS and CH cells respond not only to motion in front of the ipsilateral eye but also to motion in front of the contralateral eye.
In the following, we investigate the connectivity between LPTCs within one lobula plate as well as between the lobula plates of both brain hemispheres. We find that a large number of recurrent feedback loops exists involving cells of both hemispheres that support and stabilize the selectivity for rotatory flow fields over translatory ones.
MATERIALS AND METHODS
Preparation and setup. Female blowflies (Calliphora vicina) were briefly anesthetized with CO2 and mounted ventral side up with wax on a small preparation platform. The head capsule was opened from behind; the trachea and air sacs that normally cover the lobula plate were removed. To eliminate movements of the brain caused by peristaltic contractions of the esophagus, the proboscis of the animal was cut away, and the gut was pulled out. This allowed stable intracellular recordings of up to 45 min. The fly was then mounted on a heavy recording table looking down onto the stimulus monitors. The fly brain was viewed from behind through a fluorescence microscope (Axiotech Vario 100 HD; Zeiss).
Stimulation. Stimuli were generated on Tektronix 608 monitors by an image synthesizer (Picasso; Innisfree) and consisted of a one-dimensional grating of 16.7° spatial wavelength and 87% contrast displayed at a frame rate of 200 Hz. The mean luminosity of the screen was 11.2 cd/m2. The intensity of the pattern was square wave modulated along its horizontal axis. The stimulus field extended from 16 to 42° for the left eye and from 16 to 48° for the right eye in the horizontal direction and from −30 to +30° in the vertical direction of the fly.
Electrical recording. For intracellular recordings of the cells, electrodes were pulled on a Brown-Flaming micropipette puller (P-97) using thin-wall glass capillaries with an outer diameter of 1 mm (Clark; GC100TF-10). The tip of the electrode was filled with 8.8 mm Ca-green (Ca-green-1 hexapotassium salt; Molecular Probes, Eugene, OR). The shaft of the electrode was filled with a 2 m KCl solution. Resistances were ∼15 MΩ. For dual intracellular recordings of two cells in the same brain hemisphere (see Fig. 6), one electrode was filled with the green fluorescent dye Ca-green, and the other electrode was filled with the red fluorescent dye Alexa 568 (Molecular Probes). A SEL10 amplifier (npi electronics) that was operated in the bridge mode was used throughout the experiments. In the experiments with dual intracellular recordings, we used an additional SEL10 amplifier. When we accompanied the intracellular recording with a simultaneous extracellular recording from a spiking neuron, we used standard tungsten electrodes with a resistance of ∼2 MΩ. Extracellular signals were amplified, bandpass filtered, and subsequently processed by a threshold device delivering a 100 mV pulse of 1 msec duration on each spike detected. For data analysis the output signal of the amplifiers (SEL10 and SEL10/threshold device) was fed to a PIII personal computer via a 12 bit analog-to-digital converter (DAS-1602/12; Computerboards, Middleboro, MA) at a sampling rate of 5 kHz and stored on a hard disk.
Fig. 6.
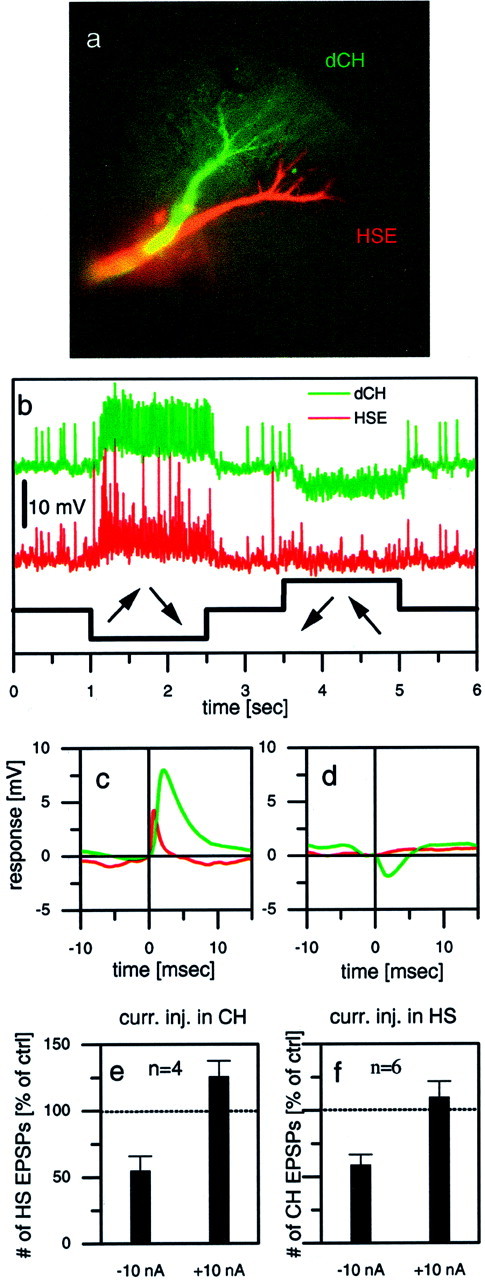
Dual intracellular recording of two LPTCs in the same brain hemisphere. a–e, Example responses from a dCH–HSE pair. a, Fluorescent micrograph of both cells, one filled with Ca-green and the other with Alexa 568 (both from Molecular Probes). b, Visual responses of both cells to a rotatory motion stimuli in front of the fly. Because both cells have the same preferred direction, they jointly respond to motion in one direction with a depolarization and in the other direction with a hyperpolarization. c, Averaged HSE signals (red) triggered by large-amplitude EPSPs in the dCH cell (green). d, Averaged HSE signals (red) triggered by IPSPs in the dCH cell (green). e, Average effect (mean ± SEM) of current injection into CH cells on the EPSP frequency observed in HS cells. Hyperpolar- ization of CH cells led to a decreased EPSP frequency in HS cells, whereas depolarization led to only a small increase in EPSP frequency. Data are from four experiments comprising the following cell pairs: dCH–HSN (n = 1), vCH–HSE (n = 1), and dCH–HSE (n = 2). f, Average effect (mean ± SEM) of current injection into HS cells on the EPSP frequency observed in CH cells. Hyperpolarization of HS cells led to a decreased EPSP frequency in CH cells, whereas depolarization led to an EPSP frequency that was almost unchanged. Data are from six experiments comprising the following cell pairs: dCH–HSN (n = 2), vCH–HSN (n = 2), and dCH–HSE (n = 2).
The signals were evaluated off-line by a program written in Delphi (Borland). The number of EPSPs and IPSPs (see Figs. 4, 6) in the intracellular recorded responses were detected by high-pass filtering (t = 10 msec) the response traces and applying a threshold operation.
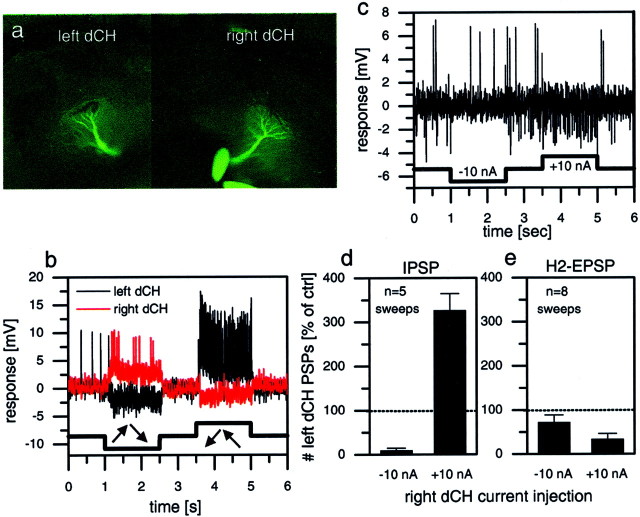
Fig. 4.
Simultaneous intracellular recordings of two dCH cells, one in the left and one in the right lobula plate.a, Fluorescence image of the cells filled with Ca-green.b, Visual responses of both cells to rotatory motion stimuli in front of the fly. c, Single-response trace of the left dCH cell in response to hyperpolarization and depolarization of the right dCH cell. Hyperpolarization led to a decreased IPSP frequency compared with resting; depolarization led to an increased IPSP frequency and a decreased EPSP frequency. d, e, These effects quantified further. Hyperpolarization of the right dCH cell suppressed IPSP frequency of the left dCH almost completely (d) but had no significant effect on its EPSP frequency (e). Depolarization of the right dCH cell led to a threefold increase of IPSP frequency in the left dCH cell (d) and decreased the EPSP frequency to ∼30% of the control condition (e).
RESULTS
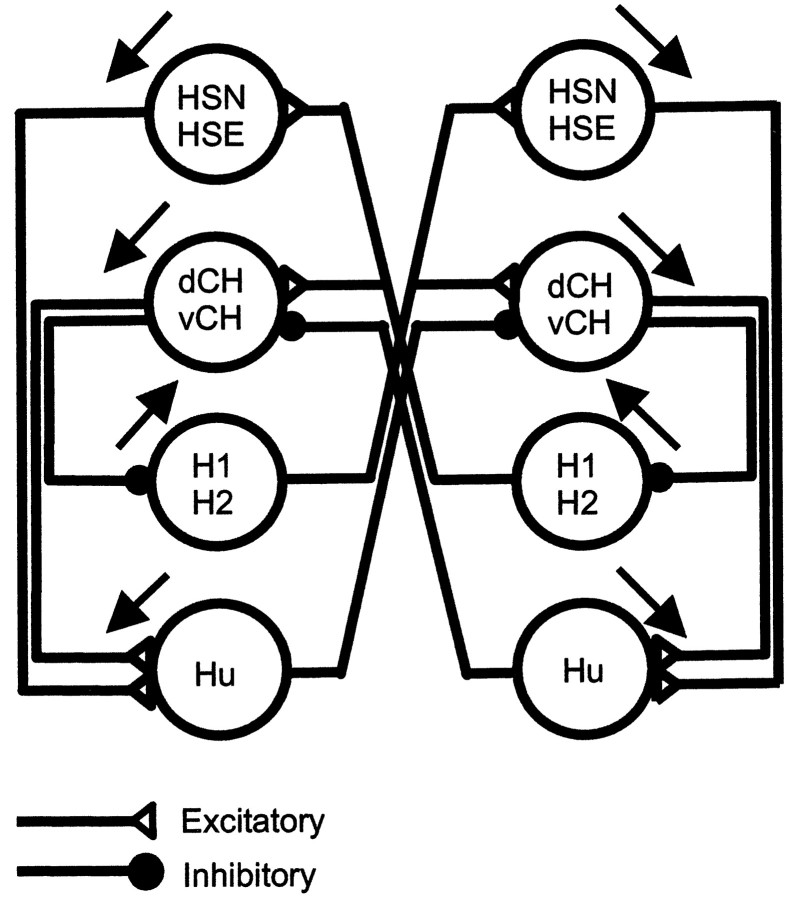
Our findings are summarized in the circuit diagram presented in Figure 1. For the sake of simplicity, each neuron is represented by a circle. We, thus, do not specify where on the neuron another neuron is making contacts and is eliciting postsynaptic potentials. Because H1 and H2 cells have identical properties in many respects, we do not differentiate between them in this scheme. From the HS cell family, the HSS cell is omitted because it does not receive contralateral input (Hausen, 1982a; Haag, 1994). The top two cell groups shown are the graded potential neurons of the HS and CH cell family; below are the heterolateral spiking neurons H1, H2, and Hu [called “U” in Hausen (1984)]. The first characteristic of the circuit is that both HS and CH cells receive contralateral input from H1 and H2; CH cells in addition receive from Hu. These connections form the basis for the sensitivity of both HS and CH cells to visual motion stimuli presented in front of the contralateral eye. As we will show below, HS and CH cells influence those heterolateral spiking neurons the dendrites of which are located on the ipsilateral side. The ipsilateral connections are such that they excite those heterolateral neurons that have the same preferred direction and inhibit the ones with the opposite preferred direction. This leads to a suppression of the activity of the contralateral HS and CH cells after excitation of HS and CH cells on the ipsilateral side of the brain. The circuit, thus, favors motion stimuli that lead to an inhibition on one side and to an excitation on the other side. Such bilateral interactions indeed have been described previously in the literature (McCann and Foster, 1971). Furthermore, following the connections through a complete loop, from one side to the other side of the brain and back again, we see that positive, recurrent feedback loops are implemented in the circuit; whatever way one chooses, activity in one cell will never lead to its own inhibition, because one complete loop comprises always two inhibitory synapses. Evidence supporting these ideas will now be presented.
Fig. 1.
Summary diagram about the connections between large-field lobula plate neurons characterized in this study. Excitatory connections are shown as open triangles; inhibitory connections are shown as filled circles.Black arrows indicate the preferred direction of visual motion on the ipsilateral side of the cells.
Contralateral input
The intracellular recording from a dCH cell and the simultaneous extracellular recording from the spiking H2 cell of the other brain hemisphere showed that the spikes of the H2 cell and the large-amplitude EPSPs in the dCH cell coincide (Fig.2a). Each spike in the H2 cell was followed by an EPSP in the dCH cell. This is further substantiated by the spike-triggered average (Fig. 2b) in which each spike of the H2 cell was used to cut out a stretch of dCH signals that were all subsequently averaged. A similar double recording was made from a dCH cell and an H1 cell. Figure 2c shows the spike-triggered average of the dCH signal with the H1 spikes as a trigger. This demonstrates that the two differently sized EPSPs in dCH cells can be attributed unequivocally to spikes in H1 and H2 cells. The absence of failures and the negligible delay between the action potentials and the EPSPs indicate a monosynaptic connection between H1, H2, and the dCH cell. The same type of experiment was done for a vCH cell and for two cells of the horizontal system, the HSE and HSN cells (data not shown). We found that all of these cells receive identical excitatory input from the spiking heterolateral neurons H1 and H2 (see also Fig. 6). However, IPSPs could be detected only in vCH and dCH cells but not in HS cells (see Fig. 6d). The neuron eliciting the IPSPs has not yet been determined. In this manuscript we will refer to it as Hu (u for unknown).
Fig. 2.
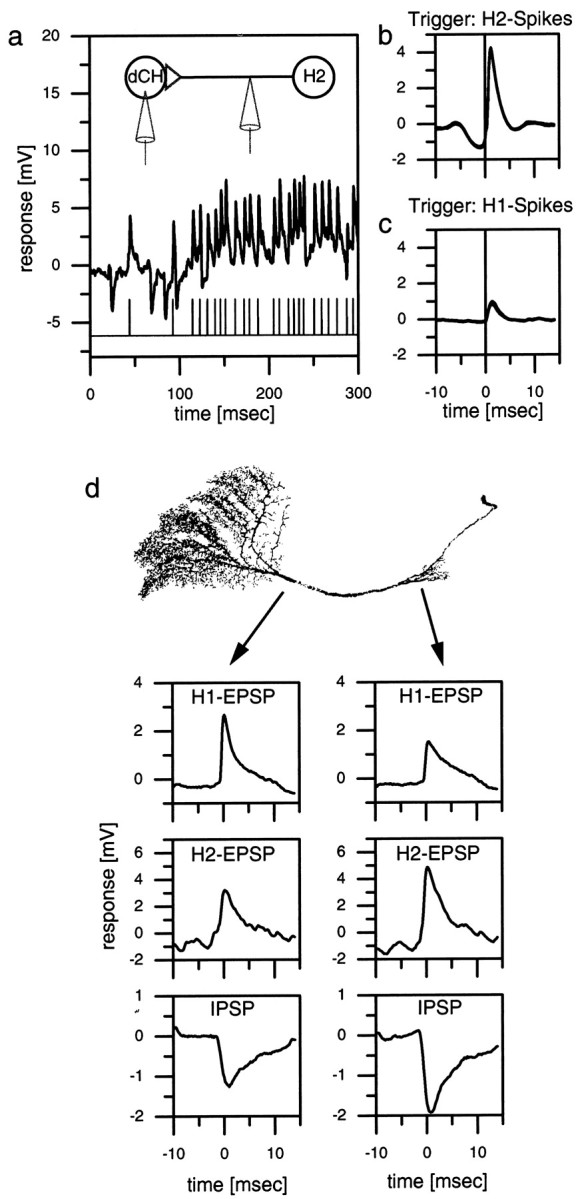
a–c, Double recording of an H1 or an H2 cell and a dCH cell. a, Singletrace of an intracellular dCH cell recording and an extracellular H2 recording. Each extracellular recorded spike in the H2 elicits an large-amplitude EPSP in the dCH cell.b, H2 spike-triggered average of the dCH cell signal. The peak of the EPSP occurs ∼1 msec after the spike of the H2 (vertical line). c, H1 spike-triggered average of the dCH cell signal. The amplitude of the averaged EPSP is only one-third that of the H2-triggered EPSP.d, Dual electrode intracellular recording from a dCH cell. The location of the recording electrodes indicated by the origin of the arrows on a reconstructed dCH cell is shown.Left plots, The averaged H1 EPSPs (top), H2 EPSPs (middle), and IPSPs (bottom) of the lobula plate electrode. Right plots, The respective signals of the protocerebral electrode. In the dendritic recording, the amplitude of H1 EPSPs is larger than that of the protocerebral recording. H2 EPSPs and IPSPs are larger in the protocerebral recording. Similar data have been obtained in three additional preparations (dCH, n = 2; vCH,n = 1).
Because the axonal terminals of the H1 cell are located in the lobula plate, whereas H2 terminates in the protocerebrum, it was expected that CH cells receive the H1 input on the arborizations in the lobula plate, whereas the input of the H2 cell impinges on the arborization in the protocerebrum. For the reasons outlined above, no knowledge was available for the likely origin of the IPSPs. To investigate where on the CH cell the IPSPs originate and to verify the location of the input of H1 and H2 cells on the CH cells, we performed dual intracellular recordings of a dCH cell with one electrode in the axon near the lobula plate (LP electrode) and the other electrode in the axon near the protocerebral ramifications (PC electrode) (Fig. 2d). In the case of the H1 input, the EPSPs recorded with the LP electrode were found to have a larger amplitude than the H1 EPSPs recorded with the PC electrode (Fig. 2d, top plots). The opposite is true for the H2 input. For these EPSPs, the PC electrode recorded bigger EPSP amplitudes (Fig. 2d, middle plots). The IPSPs seem to originate in the protocerebral ramifications of the CH cell because the signals recorded with the PC electrode were larger than the ones recorded with the LP electrode (Fig. 2d,bottom plots). In summary, this indicates that the dCH cell receives the H1 input via its lobula plate arborization, whereas the H2 input and the input responsible for the IPSPs are located at the protocerebral arborization. These findings support the anatomical observations in the case of the H1 and H2 inputs and show that the site of the synaptic connection between the dCH and the Hu is likely to be the protocerebral ramification of the CH cell.
Ipsilateral output
Whereas the above results demonstrated the effects of the contralateral spiking cells on the CH and HS cells, the next series of experiments dealt with the effect of CH and HS cells on the ipsilateral counterparts of these spiking cells, i.e., H1 and H2 cells that have their dendrites within the same lobula plate as the CH and HS cells. To investigate these ipsilateral connections, we recorded intracellularly from CH cells and extracellularly from H1 and H2 on the same side of the brain. Figure 3 shows the effect of depolarization of a dCH cell on the resting firing frequencies of an H1 cell (Fig. 3a,b) and the effect of depolarization of a vCH cell on an H2 cell (Fig. 3d,e). Depolarization of CH cells resulted in a strong reduction of the mean firing frequency of the H1 cell as well as of the H2 cell. In contrast, hyperpolarization of the CH cells seemed to have only a small, if any, effect. In contrast to CH cells, the depolarization of HS cells did not have any effect on the firing frequency of the H1 or H2 cells (data not shown, but see Fig.5).
Fig. 3.
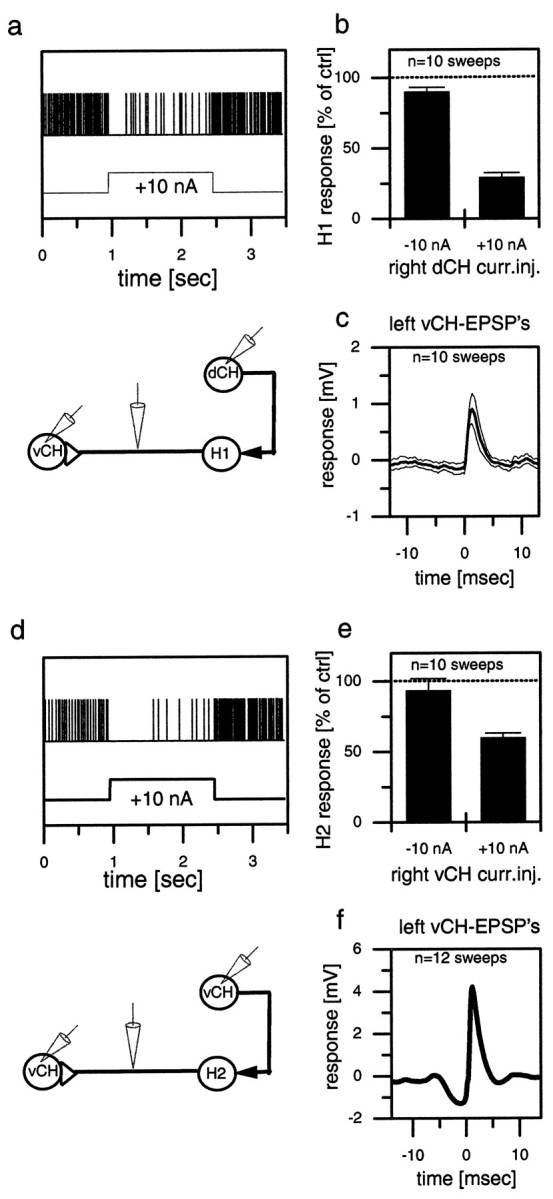
Extracellular recording of a spiking neuron and simultaneous intracellular recording of a CH cell in the same brain hemisphere (a, b, d, e) or in the opposite hemisphere (c, f). The top graphs (a–c) show results obtained from a dCH→H1→vCH cell recording; the bottom graphs (d–f) show the results for the vCH→H2→vCH cell recording. a, d, Single-responsetrace of H1 (a) and H2 (d) in response to current injected into the ipsilateral CH cell. b, e, Spike frequency of H1 (b) and H2 (e) as a function of depolarization or hyperpolarization of the CH cell. The error bars show the average and the SEM of 10 sweeps for H1 (b) and 10 sweeps for H2 (e). c, f, Spike-triggered average and SEM of the membrane potential of the contralateral CH cell, recorded within the same fly in the opposite brain hemisphere. Similar data have been obtained in four other experiments comprising all combinations at least once. They demonstrate that depolarization of the dCH as well as the vCH cell reduces spike activity in the H1 as well as the H2 cell. ctrl, Control; curr.inj., current injection.
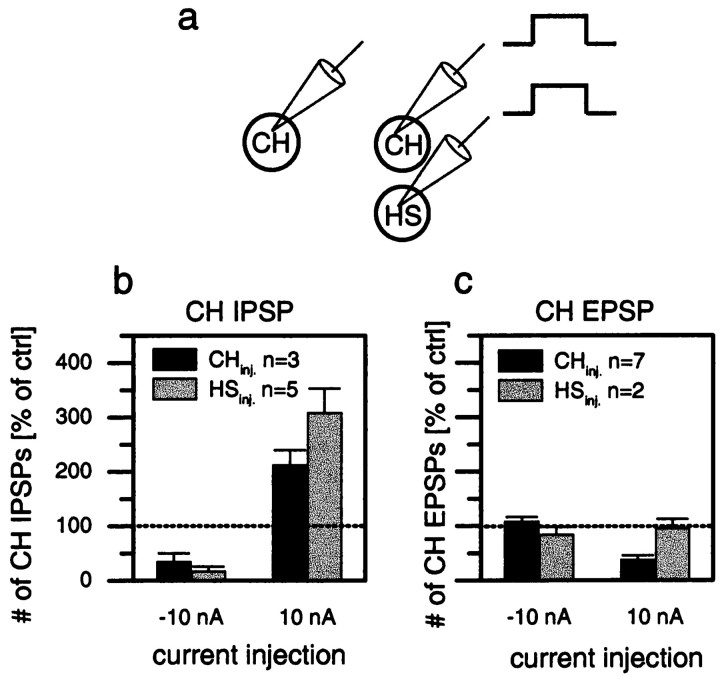
Fig. 5.
Summary of the effects of hyperpolarization and depolarization of CH cells (black bars) and HS cells (gray bars) on the frequency of IPSPs (b) and EPSPs (c) of CH cells in the opposite brain hemisphere. b, Depolarization and hyperpolarization of HS cells had a stronger effect on the frequency of IPSPs than the depolarization and hyperpolarization of CH cells had. c, In contrast, the frequency of EPSPs was not affected by current injection in HS cells, whereas depolarization of CH cells decreased the frequency of EPSPs. Data are compiled from a total of 10 experiments performed on different flies that comprise the following cell pairs: dCH–dCH (n= 1), dCH–HSN (n = 1), dCH–vCH (n = 3), dCH–HSE (n = 2), vCH–HSE (n = 2), and vCH–vCH (n = 1). inj., Injection.
Because the identification of an individual cell type may be problematic in extracellular recordings, we performed additional control experiments to overcome this limitation. Having established the inhibitory connection of the CH onto the spiking cell, the intracellular electrode was withdrawn from the CH cell, and a CH cell on the other side of the brain was recorded. The extracellular electrode remained in place. The spike-triggered average of the extracellularly recorded cell and the CH cell revealed the EPSPs (Fig.3c,f) shown above in Figure 2, b andc. This experiment was done for the two combinations shown here, i.e., right dCH→right H1→left vCH (Fig. 3a–c) and right vCH→right H2→left vCH (Fig. 3d–f). The results unequivocally demonstrate that exactly those spiking cells that are inhibited by CH cells on the same side of the brain are responsible for the EPSPs in CH cells on the other side of the brain.
Bilateral interactions
From the above experiments, CH cells of one brain hemisphere are expected to influence the response of the CH cells on the opposite half of the brain via H1 and H2 cells. In the following set of experiments, we directly tested these bilateral interactions in dual intracellular recordings from two CH cells with one electrode in the left and one in the right brain hemisphere. The experiments furthermore were aimed to investigate the influence of CH cells on Hu cells because the latter could not be directly recorded but were made visible via the IPSPs they elicit in the contralateral CH cells.
The example that is shown in Figure 4 was performed on two dCH cells. Both cells were filled with Ca-green to allow for their anatomical characterization (Fig. 4a). Because both cells have the same preferred direction (front to back), rotatory motion in one direction excited one cell and inhibited the other and vice versa (Fig. 4b). As can be seen in the singletrace (Fig. 4c), injection of current into one CH cell had a strong effect on the occurrence of IPSPs in the CH cell of the opposite brain hemisphere; injection of hyperpolarizing current reduced the number of IPSPs, whereas the injection of depolarizing current increased the number of IPSPs (Fig. 4d). As expected from the experiments shown in Figure 3, injection of current in one CH cell also altered the frequency of EPSPs in the other CH cell; whereas hyperpolarization had only a weak effect, depolarization of the dCH cell decreased the frequency of the H2 EPSPs recorded in the other cell substantially (Fig. 4e). As is also expected from the recordings shown in Figure 3, depolarization of one CH cell affected not only the frequency of H2 EPSPs in the other CH cell but also the frequency of H1 EPSPs. This was shown in other recordings that allowed for a distinction between H1- and H2-elicited EPSPs (data not shown).
Figure 5 summarizes the effects of current injection into HS and CH cells on one side of the brain on CH cells on the other side of the brain (Fig. 5a) from a total of 10 experiments performed in different flies. Injection of hyperpolarizing current into CH or HS cells led to a decrease in IPSP frequency; injection of depolarizing current into CH or HS cells led to an increase in IPSP frequency (Fig. 5b). Thus, CH and HS cells had the same effect on the IPSP frequency in the CH cell of the opposite brain hemisphere; the only difference was that the effects of current injected into HS cells were found to be more pronounced than when current was injected into CH cells. In contrast, depolarization of HS cells had no effect on the frequency of EPSPs in CH cells, whereas injection of depolarizing current into CH cells reduced the EPSP frequency significantly (Fig. 5c). In both CH and HS cells, injection of hyperpolarizing current did not affect the EPSP frequency in CH cells of the opposite brain hemisphere.
In summary the experiments presented above demonstrate that the CH cells on opposite sides of the brain influence each other via the heterolateral elements H1, H2, and Hu. By inhibiting the elements with the opposite preferred direction on the ipsilateral side, i.e., H1 and H2, CH cells inhibit the excitatory input onto the opposite CH cells during front-to-back motion. Hyperpolarization, however, does not have an effect on EPSP frequency in the opposite CH cell. In contrast, the influence of CH cells on the Hu cell is an excitatory one and operates in both directions; inhibition of CH cells inhibits Hu activity, and excitation of CH cells leads to an excitation of Hu. This, in turn, increases the IPSP frequency in the opposite CH cell. Interestingly, although CH and HS cells have identical preferred directions for ipsilateral motion stimuli, the ipsilateral output connections of HS cells are different in some respect. In contrast to CH cells, HS cells do not influence the activity of the ipsilateral H1 or H2 cells. This agrees with the finding that CH cells are presumably GABAergic, whereas HS cells are not (Meyer et al., 1986; Strausfeld et al., 1995). On the other hand, HS cells have a stronger influence on the Hu cell than do the CH cells. This influence is excitatory and goes both ways; i.e., depolarization excites Hu, and hyperpolarization inhibits Hu.
Going around one loop
If CH and HS cells on different sides of the brain can influence one another via their action on the heterolateral elements, then this influence should actually come back into the lobula plate from which the activity started because the same circuit exists twice in a mirror-symmetrical manner. To test this idea of “going around one loop,” we performed experiments involving dual intracellular recordings from two cells within the same lobula plate, injecting current into one of them and observing the effect of this manipulation in the other one. The experiment shown in Figure6a–d gives one example of a recording from a cell pair, a dCH cell and an HSE cell (anatomy shown in Fig. 6a). Both cells were located in the right brain hemisphere and responded to rotatory motion stimuli the same way; they were excited by clockwise motion and inhibited by motion in the opposite direction (Fig. 6b). Because the EPSPs occurred simultaneously in the two recorded cells, we conclude that both cells receive input from the identical contralateral H1 and H2 cells. The simultaneous intracellular recording also allowed for a quantitative evaluation of postsynaptic signals in both cells. Figure 6cshows the result of the average membrane potential in the HSE cell triggered by the large EPSPs (H2 input) in the dCH cell. Clearly, as expected from the example trace in Figure 6b, both signals rise simultaneously, with the EPSPs in the HSE cell being somewhat faster than those in the dCH cell. When the IPSPs in the dCH cell were used to trigger the signal average in the HSE cell, no significant PSPs were obtained (Fig. 6d). In contrast to CH cells, thus, HS cells do not seem to receive inhibitory input from the Hu cell.
In such a way, we performed dual intracellular recordings from two LPTCs within the same lobula plate in a total of 10 different flies, injected current of either polarity into one of them, and evaluated the resulting change of EPSP frequency in the respective other neuron. The results are summarized in Figure 6, e and f. Indeed, we found a strong effect of current injection on the EPSP frequency in the respective other neuron. Depolarization as well as hyperpolarization of either CH or HS cells led to a change in EPSP frequency that had the same sign as the current injected; if the cell became more excited, the number of EPSPs slightly increased, and if the cell became more hyperpolarized, the number of EPSPs decreased. However, the effects were not of equal strength; hyperpolarizing the cell had a much more pronounced effect than had depolarizing the cell.
DISCUSSION
The circuit diagram (Fig. 1) summarizes our present knowledge about the connectivity of lobula plate neurons. While the heterolateral connections had been described previously (Hausen, 1977, 1981, 1984;Eckert and Dvorak, 1983; Haag, 1994; Haag et al., 1999; Horstmann et al., 2000), the experiments presented above add, as an important novel feature, ipsilateral connections to the circuit, leading to recurrent feedback loops in the system. Clearly, this kind of connectivity supports motion stimuli that lead to an asymmetric activity level in the lobula plates in both hemispheres such as rotatory motion.
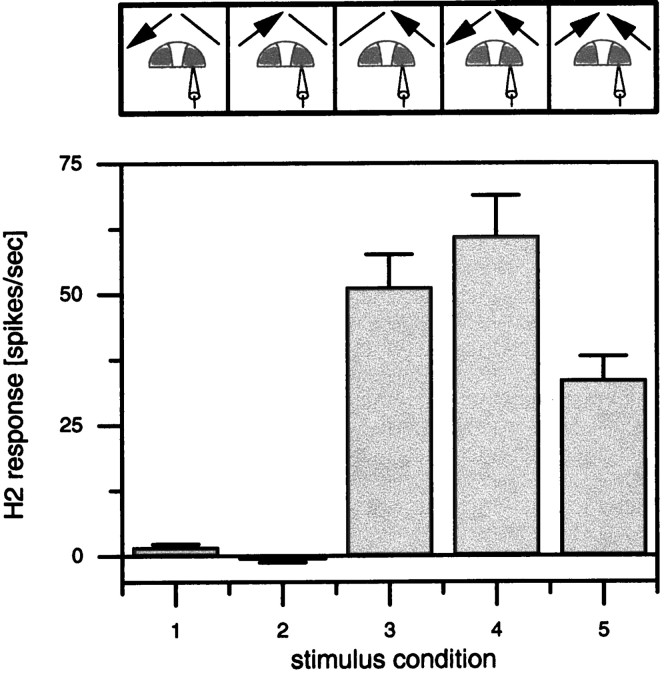
In this context, an interesting question is whether we can assign a specific functional significance to the ipsilateral connections over the heterolateral ones. Would the neurons respond any differently without the ipsilateral connections, i.e., in a strict feedforward way without feedback? In the case of CH cells, the graded response component to binocular motion stimuli could be approximately explained as the sum of their responses to monocular stimuli (Egelhaaf et al., 1993). In this respect, thus, CH cells behave rather linear as, in a first approximation, would be expected from a feedforward circuitry without additional threshold nonlinearities. However, H2 neurons are different in this respect. As is illustrated in Figure7, H2 responses to binocular stimuli are not a linear combination of their responses to monocular stimuli. Whereas the contralateral stimulus does not influence H2 activity at all when presented alone (Fig. 7, columns 1, 2), it does so strongly when given together with a monocular excitatory one (Fig. 7,columns 4, 5). Basically the same results were obtained when the contrast of the pattern was lowered from 87 to 20% (data not shown). This finding is hard to explain without the ipsilateral connectivity between LPTCs as shown in Figure 1. Besides its role in tuning the lobula plate neurons to rotatory motion stimuli, another possible role of the ipsilateral connections might be to enhance directional contrast within the visual field of one eye (Hausen, 1984), such as that occurring, e.g., during relative motion between objects and background or lateral expansions. Such a function would have been undetected by the flow fields used in the present study in which one eye was always stimulated homogeneously. Thus, to explore further the functional significance of the ipsilateral connections, more complex visual stimuli need to be applied in conjunction with single-cell ablation studies and quantitative modeling of the circuit. The latter two strategies are presently being pursued.
Fig. 7.
Average responses of five H2 cells ± SEM during a 2 sec presentation of the visual stimulus. Top, The stimulus conditions. Bottom, The responses. Note that although the cells do not respond to unilateral motion in front of the left eye in either direction (columns 1, 2), addition of this stimulus to a back-to-front stimulus in front of the right eye influences the response in a directionally selective way (compare columns 4, 5).
Another question pertains to the functional role of specific neurons in the lobula plate, like, e.g., the H2 cell. In addition to its function as a heterolateral element, the H2 cell could also provide synaptic input directly onto descending neurons, thus being of more immediate behavioral relevance. Because the location where H2 has its axon terminals and contacts CH and HS cells is also the place where descending neurons have their dendritic ramifications (Gronenberg et al., 1995; Strausfeld et al., 1995), such a scenario seems completely feasible. Another more indirect role of H2 cell activity could be via its EPSPs, either in CH cells or in HS cells where the large EPSPs are known to often elicit action potentials (Haag et al., 1999). Such a possibility, however, is purely speculative because, at present, it is not known what aspects of the electrical signals in either the CH cells or HS cells are passed preferentially onto postsynaptic neurons.
Compared with the exclusive responsiveness of some descending neurons recorded, e.g., in the cervical connective (Borst, 1991), the selectivity described here for LPTCs is less pronounced. It seems that the flow-field specificity is being built up gradually in the fly visual system, from the neurons in the lobula plate, which display some nonlinear receptive field features such as expressed, e.g., in the strong preference in H2 cells for binocular rotatory motion stimuli, up to later processing stages. In any case, with its limited number of neurons and their accessibility for simultaneous electrical and/or optical recordings, the circuit of lobula plate neurons will provide a good model system in which the mechanisms underlying receptive field properties can be studied in great detail, leading to a precise understanding of how the response selectivity of visual interneurons for specific flow fields occurs.
Footnotes
This work was supported by National Institutes of Health Grant 1RO1MH61598-01 to A.B. We are grateful to Dr. Michael Dickinson for critically reading this manuscript.
Correspondence should be addressed to Dr. Alexander Borst, 201 Wellman Hall, ESPM-Division of Insect Biology, University of California, Berkeley, CA 94720-3112. E-mail: borst@nature.berkeley.edu.
REFERENCES
- 1.Bialek W, Rieke F, de Ruyter van Steveninck R, Warland D. Reading a neural code. Science. 1991;252:1854–1857. doi: 10.1126/science.2063199. [DOI] [PubMed] [Google Scholar]
- 2.Borst A. Fly visual interneurons responsive to image expansion. Zool Jb Physiol. 1991;95:305–313. [Google Scholar]
- 3.Borst A, Egelhaaf M. Principles of visual motion detection. Trends Neurosci. 1989;12:297–306. doi: 10.1016/0166-2236(89)90010-6. [DOI] [PubMed] [Google Scholar]
- 4.Borst A, Egelhaaf M. Direction selectivity of fly motion-sensitive neurons is computed in a two-stage process. Proc Natl Acad Sci USA. 1990;87:9363–9367. doi: 10.1073/pnas.87.23.9363. [DOI] [PMC free article] [PubMed] [Google Scholar]
- 5.Borst A, Haag J. The intrinsic electrophysiological characteristics of fly lobula plate tangential cells. I. Passive membrane properties. J Comput Neurosci. 1996;3:313–336. doi: 10.1007/BF00161091. [DOI] [PubMed] [Google Scholar]
- 6.de Ruyter van Steveninck R, Lewen GD, Strong SP, Koberle R, Bialek W. Reproducibility and variability in neural spike trains. Science. 1997;275:1805–1808. doi: 10.1126/science.275.5307.1805. [DOI] [PubMed] [Google Scholar]
- 7.Duffy CJ, Wurtz RH. Sensitivity of MST neurons to optic flow stimuli. I. A continuum of response selectivity to large-field stimuli. J Neurophysiol. 1991a;65:1329–1345. doi: 10.1152/jn.1991.65.6.1329. [DOI] [PubMed] [Google Scholar]
- 8.Duffy CJ, Wurtz RH. Sensitivity of MST neurons to optic flow stimuli. II. Mechanisms of response selectivity revealed by small-field stimuli. J Neurophysiol. 1991b;65:1346–1359. doi: 10.1152/jn.1991.65.6.1346. [DOI] [PubMed] [Google Scholar]
- 9.Eckert H. Functional properties of the H1-neurone in the third optic ganglion of the blowfly, Phaenicia. J Comp Physiol [A] 1980;135:29–39. [Google Scholar]
- 10.Eckert H, Dvorak DR. The centrifugal horizontal cells in the lobula plate of the blowfly Phaenicia sericata. J Insect Physiol. 1983;29:547–560. [Google Scholar]
- 11.Eckert H, Meller K. Synaptic structures of identified, motion-sensitive interneurones in the brain of the fly, Phaenicia. Verh Dtsch Zool Ges. 1981;1981:179. [Google Scholar]
- 12.Egelhaaf M, Borst A, Warzecha AK, Flecks S, Wildemann A. Neural circuit tuning fly visual neurons to motion of small objects. II. Input organization of inhibitory circuit elements revealed by electrophysiological and optical recording techniques. J Neurophysiol. 1993;69:340–351. doi: 10.1152/jn.1993.69.2.340. [DOI] [PubMed] [Google Scholar]
- 13.Gauck V, Egelhaaf M, Borst A. Synapse distribution on VCH, an inhibitory, motion-sensitive interneuron in the fly visual system. J Comp Neurol. 1997;381:489–499. [PubMed] [Google Scholar]
- 14.Gronenberg W, Milde JJ, Strausfeld NJ. Oculomotor control in calliphorid flies: organization of descending neurons to neck motor neurons responding to visual stimuli. J Comp Neurol. 1995;361:267–284. doi: 10.1002/cne.903610206. [DOI] [PubMed] [Google Scholar]
- 15.Haag J. PhD thesis. Tuebingen; 1994. Aktive und passive Membraneigenschaften bewegungsempfindlicher Interneurone der Schmeissfliege Calliphora erythrocephala. [Google Scholar]
- 16.Haag J, Borst A. Amplification of high-frequency synaptic inputs by active dendritic membrane processes. Nature. 1996;379:639–641. [Google Scholar]
- 17.Haag J, Borst A. Encoding of visual motion information and reliability in spiking and graded potential neurons. J Neurosci. 1997;17:4809–4819. doi: 10.1523/JNEUROSCI.17-12-04809.1997. [DOI] [PMC free article] [PubMed] [Google Scholar]
- 18.Haag J, Borst A. Active membrane properties and signal encoding in graded potential neurons. J Neurosci. 1998;18:7972–7986. doi: 10.1523/JNEUROSCI.18-19-07972.1998. [DOI] [PMC free article] [PubMed] [Google Scholar]
- 19.Haag J, Theunissen F, Borst A. The intrinsic electrophysiological characteristics of fly lobula plate tangential cells. II. Active membrane properties. J Comput Neurosci. 1997;4:349–369. doi: 10.1023/a:1008804117334. [DOI] [PubMed] [Google Scholar]
- 20.Haag J, Vermeulen A, Borst A. The intrinsic electrophysiological characteristics of fly lobula plate tangential cells. III. Visual response properties. J Comput Neurosci. 1999;7:213–234. doi: 10.1023/a:1008950515719. [DOI] [PubMed] [Google Scholar]
- 21.Hausen K. PhD thesis. Tuebingen; 1977. Struktur, Funktion und Konnektivität bewegungsempfindlicher Interneurone im dritten optischen Neuropil der Schmeissfliege Calliphora erythrocephala. [Google Scholar]
- 22.Hausen K. Monocular and binocular computation of motion in the lobula plate of the fly. Verh Dtsch Zool Ges. 1981;74:49–70. [Google Scholar]
- 23.Hausen K. Motion sensitive interneurons in the optomotor system of the fly. I. The horizontal cells: structure and signals. Biol Cybern. 1982a;45:143–156. [Google Scholar]
- 24.Hausen K. Motion sensitive interneurons in the optomotor system of the fly. II. The horizontal cells: receptive field organization and response characteristics. Biol Cybern. 1982b;46:67–79. [Google Scholar]
- 25.Hausen K. The lobula-complex of the fly: structure, function and significance in visual behaviour. In: Ali MA, editor. Photoreception and vision in invertebrates. Plenum; New York: 1984. pp. 523–559. [Google Scholar]
- 26.Hausen K, Wolburg-Buchholz K, Ribi WA. The synaptic organization of visual interneurons in the lobula complex of flies. Cell Tissue Res. 1980;208:371–387. doi: 10.1007/BF00233871. [DOI] [PubMed] [Google Scholar]
- 27.Hengstenberg R. Spike response of “non-spiking” visual interneurone. Nature. 1977;270:338–340. doi: 10.1038/270338a0. [DOI] [PubMed] [Google Scholar]
- 28.Hengstenberg R. Common visual response properties of giant vertical cells in the lobula plate of the blowfly Calliphora. J Comp Physiol [A] 1982;149:179–193. [Google Scholar]
- 29.Hengstenberg R, Hausen K, Hengstenberg B. The number and structure of giant vertical cells (VS) in the lobula plate of the blowfly Calliphora erytrocephala. J Comp Physiol [A] 1982;149:163–177. [Google Scholar]
- 30.Horstmann W, Egelhaaf M, Warzecha AK. Synaptic interactions increase optic flow specificity. Eur J Neurosci. 2000;12:2157–2165. doi: 10.1046/j.1460-9568.2000.00094.x. [DOI] [PubMed] [Google Scholar]
- 31.Krapp HG, Hengstenberg R. Estimation of self-motion by optic flow processing in single visual interneurons. Nature. 1996;384:463–466. doi: 10.1038/384463a0. [DOI] [PubMed] [Google Scholar]
- 32.Krapp HG, Hengstenberg B, Hengstenberg R. Dendritic structure and receptive-field organization of optic flow processing interneurons in the fly. J Neurophysiol. 1998;79:1902–1917. doi: 10.1152/jn.1998.79.4.1902. [DOI] [PubMed] [Google Scholar]
- 33.McCann GD, Foster S. Binocular interactions of motion detection fibres in the optic lobes of flies. Kybernetik. 1971;8:193–203. doi: 10.1007/BF00291121. [DOI] [PubMed] [Google Scholar]
- 34.Meyer E, Manute C, Streit P, Naessel D. Insect optic lobe neurons identifiable with monoclonal antibodies to GABA. Histochemistry. 1986;84:207–216. doi: 10.1007/BF00495784. [DOI] [PubMed] [Google Scholar]
- 35.Rauschecker JP, von Grünau MW, Poulin C. Centrifugal organization of direction preferences in the cat's lateral suprasylvian visual cortex and its relation to flow field processing. J Neurosci. 1987;7:943–958. doi: 10.1523/JNEUROSCI.07-04-00943.1987. [DOI] [PMC free article] [PubMed] [Google Scholar]
- 36.Single S, Borst A. Dendritic integration and its role in computing image velocity. Science. 1998;281:1848–1850. doi: 10.1126/science.281.5384.1848. [DOI] [PubMed] [Google Scholar]
- 37.Single S, Haag J, Borst A. Dendritic computation of direction selectivity and gain control in visual interneurons. J Neurosci. 1997;17:6023–6030. doi: 10.1523/JNEUROSCI.17-16-06023.1997. [DOI] [PMC free article] [PubMed] [Google Scholar]
- 38.Strausfeld NJ, Kong A, Milde JJ, Gilbert C, Ramaiah L. Oculomotor control in calliphorid flies: GABAergic organization in heterolateral inhibitory pathways. J Comp Neurol. 1995;361:298–320. doi: 10.1002/cne.903610208. [DOI] [PubMed] [Google Scholar]
- 39.Tanaka K, Saito H. Analysis of motion of the visual field by direction, expansion/contraction, and rotation cells clustered in the dorsal part of the medial superior temporal area of the macaque monkey. J Neurophysiol. 1989;62:626–641. doi: 10.1152/jn.1989.62.3.626. [DOI] [PubMed] [Google Scholar]
- 40.Tanaka K, Fukada Y, Saito H. Underlying mechanisms of the response specificity of expansion/contraction and rotation cells in the dorsal part of the medial superior temporal area of the macaque monkey. J Neurophysiol. 1989;62:642–656. doi: 10.1152/jn.1989.62.3.642. [DOI] [PubMed] [Google Scholar]
- 41.Wang Y, Frost BJ. Time to collision is signalled by neurons in the nucleus rotundus of pigeons. Nature. 1992;356:236–238. doi: 10.1038/356236a0. [DOI] [PubMed] [Google Scholar]
- 42.Wylie DRW, Frost BJ. Responses of neurons in the nucleus of the basal optic root to translation and rotational flowfields. J Neurophysiol. 1999;81:267–276. doi: 10.1152/jn.1999.81.1.267. [DOI] [PubMed] [Google Scholar]


