

Abstract
The ability to express a behavior during the postnatal period may be related to developmental changes in the recruitment of particular neural systems. Here, we show that developmental changes in the functional interactions involving three cortical regions (the medial prefrontal cortex, orbitofrontal cortex, and anterior cingulate cortex) are associated with maturation of extinction behavior in infant rats. Postnatal day 17 (P17) and P12 pups were trained in a straight-alley runway on an alternating schedule of reward and nonreward [patterned single alternation (PSA)] or on a pseudorandom schedule of partial reinforcement (PRF); the pups were then injected with fluorodeoxyglucose (FDG) and shifted to continuous nonreward (extinction). Handled control groups exposed to the same training environment but not trained on a particular schedule were included. Among P17 pups, extinction proceeded faster in PSA pups relative to PRF pups. No differences were found between P12 groups. FDG uptake, an index of acute changes in functional activity, was quantified in the three cortical regions and 27 other brain regions of interest. A multivariate covariance analysis, seed partial least squares, revealed that functional relationships involving the three cortical regions and large-scale systems of regions throughout the rostrocaudal extent of the brain changed with training in P17 pups. The cortical regions were primarily uncoupled in the younger group. The data suggest that functional maturation of the frontal cortical regions and their interactions with other brain systems are related to the maturational shift in behavior.
Keywords: brain imaging, frontal cortex, covariance, extinction, development, rat
An emerging view of associative learning is that behavioral change arises as a consequence of the concerted activity, or interactions, between large-scale distributed neural systems (McIntosh and Gonzalez-Lima, 1998). In altricial species such as rats or humans, the inability to learn a particular behavior in the early postnatal period could be related to the absence of such large-scale interactions, perhaps because of the immaturity of particular regions comprising the system. In our ongoing work, we have assessed functional brain interactions during behavior at successive postnatal ages to understand maturational changes in the integrative properties of particular neural systems (Nair and Gonzalez-Lima, 1999).
In preweanling rats, the ability to readily modify behavior in response to different reinforcement schedules is impaired early in development. For example, whereas postnatal day 17 (P17) rat pups' behavior during continuous nonreward (extinction) is dependent on the schedule of reward and nonreward during acquisition training, P12 pups seem unable to use previous learning to flexibly respond when switched to extinction (Lilliquist et al., 1999). The frontal and limbic cortices are well known to be associated with adaptability of behavior to environmental changes. In particular the medial prefrontal cortex (mPFC), orbitofrontal cortex (OFC), and anterior cingulate cortex (ACC) appear to be important for switching response strategies, attaching reward value to events, or learning to avoid aversive situations (Poremba and Gabriel, 1997; Woodward et al., 1999; Tremblay and Schultz, 2000). Given the substantial structural and physiological maturation of these regions between P12 and P17, it was hypothesized that their functional maturation contributes to the age-related behavioral differences. Specifically, the inability of these regions to engage in concerted functional activity with other regions of the brain may be related to the behavioral impairments at the younger age.
Previously, we used metabolic mapping using fluorodeoxyglucose (FDG) in conjunction with covariance analysis to assess task- and age-dependent changes in the functional connectivity of brain regions (Nair and Gonzalez-Lima, 1999). In an analysis of functional connections, regions are assumed to interact or form components of the same functional network by virtue of their correlated activity (McIntosh and Gonzalez-Lima, 1994). Here, we used a multivariate extension of the covariance analysis, seed partial least squares (PLS) (McIntosh et al., 1996) to identify, in a data-driven manner, regions showing differences or similarities in functional connections with the cortical regions across age and training conditions. P12 and P17 rat pups were injected with FDG and shifted to extinction after acquisition training on an alternating schedule of reward and nonreward [patterned single alternation (PSA)], on a pseudorandom schedule [random partial reinforcement (PRF)], or after handling [handled controls (HC)]. After quantification of FDG uptake in the three frontal cortical regions and 27 other regions of interest (ROIs), we applied seed PLS to identify regions showing task- and age-dependent covariance changes with the cortical regions. Training-dependent changes in covariances involving the three cortical regions occurred among the P17 groups but not in the P12 groups. The regions were generally uncoupled in the younger age group.
MATERIALS AND METHODS
Sixty rat pups of the Holtzman strain, aged P11–P12 or P16–P17 and raised in our colony at the Animal Resource Center at the University of Texas at Austin were used. The day of birth was designated as P0. All experimental procedures were approved by the University of Texas Institutional Animal Care and Use Committee and conformed to all Federal and National Institutes of Health guidelines. Six groups of animals were included [P12 pups trained on PSA, PRF, or HC and P17 pups trained on PSA, PRF, or HC]. There were 10 pups in each group. Seven pups in each of the PSA groups and five pups in each of the HC groups had been used previously (Nair and Gonzalez-Lima, 1999). All animals were trained under identical conditions using the same apparatus, ambient temperature, lighting, and time of day.
Behavioral training
All training was conducted in a clear Plexiglas straight-alley runway as described by Nair and Gonzalez-Lima (1999). The runway was composed of a start box (13 × 7.5 × 12 cm), alley (60 × 7.5 × 12 cm for P17 pups or 45 × 7.5 × 12 cm for P12 pups), and goal box (17 × 25 × 12 cm). The goal box was bisected into front and rear chambers by a metal gate. An anesthetized dam placed in the rear compartment was accessible on reward trials. On reward (r) trials, pups attached to a nipple, and milk was delivered via an infusion pump into an oral cannula fitted on the pup. On nonreward (n) trials, pups were confined to the front chamber of the goal box. Photocells were used to record running speed. Reward schedules and the goal gate were controlled by a Fortran program running on an IBM computer (Lilliquist et al., 1999). Running speeds were recorded by the same computer for later analysis.
On the day before training (day 0), pups from separate litters were fitted with the oral cannula and familiarized with the training apparatus. On days 1 and 2, pups were trained on PSA or PRF for 200 trials (five sessions of 40 trials each across 2 d). HC pups were exposed to the same environmental conditions and given the same amount of reward, but outside the runway apparatus. They were merely placed in and out of the runway for acquisition and extinction sessions. Therefore, they were exposed to essentially the same training sessions, but were not trained on a schedule. After acquisition all, subjects were injected with FDG and given one reward trial followed by 49 nonreward (extinction) trials. The intertrial interval for both acquisition and extinction trials was 8 sec.
FDG autoradiography
The FDG protocol of Gonzalez-Lima (1992) was used. Immediately before the extinction session (session 6), subjects were injected intraperitoneally with 18 μCi/100 gm body weight of14C(U)-FDG (specific activity, 300 mCi/mmol; American Radiolabeled Chemicals, St. Louis, MO) in 0.1 ml of physiological saline. Animals were trained for ∼50 min (the duration of the extinction session). After completion of the test period, the animal was removed from the chamber and rapidly decapitated. The brain was then quickly removed and frozen in −40°C isopentane for ∼2–3 min. Sections of the brain at 40 μm were taken in a cryostat at −20°C (Reichert–Jung 2800 Frigocut E). Slices used for FDG were picked up on slides and immediately dried on a hot plate at 60°C.
The FDG slides were apposed to Kodak EB-1 film and placed inside Kodak X-O-Matic cassettes (Eastman Kodak, Rochester, NY) for 2 weeks. Plastic microscale standards of known 14C concentrations (Amersham Pharmacia Biotech, Arlington Heights, IL) were placed with each film. The standards were used to calculate14C concentrations (nanoCuries per gram of tissue). Films were developed in Kodak D-19 for 2 min, rinsed in 2% acetic acid for 1 min, and fixed for 8 min. Selected sections were stained with cresyl violet after autoradiographic exposure to delineate regions morphologically.
Quantitative image analysis
Incorporation of FDG was quantified using Java image-analysis software (version 1.4; Jandel Scientific, San Rafael, CA). Images from the film were placed on a direct current-powered light box and captured through a black-and-white video camera (Javelin JE2362; Meyers Instruments, Houston, TX). The analog signal from the camera was transmitted to a frame grabber (Targa M-8; Meyers Instruments) mounted in an Everex 486/25 (Meyers Instruments) computer in which the image is digitized. The image was corrected for film background and optical distortions from the camera through subtraction of the background. A calibration curve was created based on the absolute gray levels of the 14C standards on the film. Subsequent densitometric measures taken from brain images were then automatically expressed in terms of isotope incorporation per gram of tissue (nanoCuries per gram).
Normalized values were used for analysis of covariance patterns for each group because subject-to-subject differences in global FDG uptake are a potential source for spurious correlations (Horwitz et al., 1992). 14C values from each brain area were divided by the average 14C value for the whole brain of each animal (whole-brain ratio).
Regions of interest
FDG incorporation was sampled in 30 regions (the 3 cortical regions and 27 other ROIs across the brain) (Table 1). The atlas of Sherwood and Timiras (1970) was used to delimit the regions measured. Measures from each brain region of interest were taken from three adjacent sections, and four adjacent readings covering each area were taken in each section. The value for each brain area from each subject was then computed as the mean of all readings from the three adjacent sections.
Table 1.
Regions of interest
| Medial prefrontal cortex (mPFC) |
| Orbitofrontal cortex (OFC) |
| Anterior cingulate cortex (ACC) |
| Perirhinal cortex (PRH) |
| Retrosplenial cortex (RSC) |
| Posterior cingulate cortex (PCG) |
| Subiculum (Sub) |
| CA1 |
| CA3 |
| Dentate gyrus (DG) |
| Basolateral amygdala (BLA) |
| Central amygdala (CEA) |
| Medial amygdala (MEA) |
| Mediodorsal thalamus (MD) |
| Centromedian nucleus, thalamus (CM) |
| Anterior dorsal thalamic nucleus (AD) |
| Paratenial nucleus (PT) |
| Medial habenula (MHB) |
| Lateral habenula (LHB) |
| Dorsal raphe (DR) |
| Pedunculopontine tegmental nucleus (PTG) |
| Gigantocellular nucleus (GIG) |
| Nucleus accumbens (NAC) |
| Caudate putamen (CPU) |
| Globus pallidus (GP) |
| Substantia nigra (SN) |
| Ventral tegmental area (VTA) |
| Anterior parietal cortex (PAR) |
| Ventrobasal complex (VB) |
| Spinal trigeminal nucleus (SPT) |
Statistical analyses
Behavior. For analysis of behavioral data, acquisition and extinction trials were combined into five-trial blocks. Behavioral effects for acquisition were evaluated using a repeated-measures ANOVA followed by tests for simple effects. Correction for multiple comparisons was performed using a modified Bonferroni procedure (Hochberg, 1988). Extinction rates were evaluated using the following equation:
to obtain a value k, the rate of extinction. This equation is commonly used in pharmacological studies to derive a nonlinear curve describing the rate of substrate elimination, wherey is equal to the concentration of a substrate, Ais equal to the initial concentration of a substrate, k is equal to the rate of elimination, and t is time. When applied to extinction data, y is equal to run speed,A is a constant indicating magnitude of run speed, andk is a rate constant indicating the magnitude of the rate of change in run speed across time (t). An advantage of this approach is that the k value reflects the rate of change of responding independent of the run speed (which is carried by the constant A). A larger k value indicates a more exponential decrease in the rate of responding, whereas a smallerk value indicates a more gradual, linear decrease in responding. A nonlinear curve-fitting routine was used to fit each subject's extinction curve (the raw run speed on each block) to this equation, which yielded values for A and k for each subject. Two ANOVAs were then performed on the k values to evaluate whether there were differences in the rate constant between PSA and PRF groups at each age.
Seed PLS. The large, rich data sets obtained from neuroimaging data allow one to measure the activation, simultaneously, of regions throughout the rostrocaudal extent of the brain during a task or experimental condition. This affords the capability to assess not only activational changes but also covariance relationships between regions throughout the entire brain. However, using a hypothesis-driven approach to identify the significant effects can become complicated with such large data sets. Hence, data-driven approaches may be used to essentially identify, without a priori hypotheses, the nature of the changes in an efficient, unbiased, and elegant manner. These issues served as the impetus for using the seed PLS approach in this report.
Six seed PLS analyses were performed, one for each of the three cortical regions (the “seed ROIs”) within each age group. The seed PLS analysis identifies sets of regions whose covariances with the seed ROI change across tasks or are common to tasks (McIntosh and Gonzalez-Lima, 1998). A cross-correlation matrix between a vector of FDG uptake values for a single seed ROI (e.g., mPFC) and another set of vectors containing the values for the other ROIs was calculated. A cross-correlation matrix was calculated for each experimental group (e.g., PSA17, PRF17, and HC17) within an age and then stacked into a single matrix. A singular value decomposition (SVD) of the cross-correlation matrix returned mutually orthogonal latent variables (LVs) and a set of corresponding singular values (SVs). SVD summarizes large covariance structures in terms of a smaller number of components (Reyment et al., 1996) and is the algorithm used for other multivariate techniques such as the principal components analysis. For a comprehensive review of the PLS methodology, see McIntosh et al. (1996).
Each LV is composed of two vectors of weights or saliences associated with the original set of variables. The saliences contained within the first “contrast” vector describe a particular pattern of interregional covariance change across the three training groups associated with a single seed ROI. The saliences in the second (ROI) vector indicate those ROIs most associated with that pattern (i.e., those regions showing patterns of covariance changes with the seed ROI as described by the first vector). The covariance between the two vectors is optimized by PLS, and so the two vectors simultaneously describe the dominant pattern of training-related covariance changes involving a seed ROI within an age and the regions maximally contributing to the effect.
As implemented here, the seed PLS returns three latent variables. Each LV describes a unique experimental effect, orthogonal to the others. Each LV accounts for successively less of the sum of squares of the original stacked cross-correlation matrix [or sum of squares cross-block correlation (SSCB)]. The SV corresponding to each LV indexes the SSCB; the sum of squares of the SVs is equal to the SSCB. Hence, each singular value indicates the proportion of the cross-block correlation (% SSCB) accounted for by the vector pairs within each corresponding LV. In this manner, seed PLS in a single, omnibus step identifies all of the experimental effects for each seed ROI.
To summarize, six separate singular value decompositions of six stacked correlation matrices were performed. The stacked matrices were composed of three vectors of correlations (corresponding to the PSA, PRF, and HC groups) between a seed region (mPFC, OFC, or ACC) and the other 27 ROIs. After each SVD, permutation tests were performed to evaluate the statistical significance of each LV returned in each analysis.
Seed PLS statistical significance. The statistical significance of each LV was assessed via a permutation test of the singular value corresponding to the pair (McIntosh et al., 1996). The subject-to-group assignment for the seed ROIs was randomized, and the PLS was recomputed. This was repeated 5000 times, and the probability of a singular value greater than or equal to the original was computed. Those singular values with a probability of <0.01 were considered significant. The individual saliences were tested in the same way. Because all regions are considered simultaneously by the PLS analysis, there is no need to correct for multiple comparisons in the permutation tests.
Cohort effects. With the addition of three animals to the PSA groups and five to each control group, it is possible that behavioral and covariance changes could be driven by the newly added animals. Alternatively, the effects could be attributable mainly to the previously used animals. To test for behavioral effects of cohort, we compared the extinction rates of the previously trained animals with the combined data set of previous and new animals.
We also statistically compared correlation coefficients derived from the previously used animals with the combined data set using the following formula (Smillie, 1996):
in which za andzb are z-transformed correlation coefficients for the previously trained animals and combined data sets, respectively, andna andnb are sample sizes corresponding to each group. Coefficients were z-transformed using the following equation (Horwitz et al., 1992):
ln is natural logarithm and rijis the correlation coefficient in regions i andj. Because the seed PLS identifies dominant patterns of covariance changes, comparing correlation coefficients will indicate whether the seed PLS output would have changed with the addition of new animals.
RESULTS
Behavioral tests
Acquisition
Acquisition run speeds were converted to percentage of maximum run speed on reward trials for both age groups, because P12 animals ran substantially slower than P17 animals. (The running ability of the P12 group is compromised because their ventral side is in contact with the floor.) Analysis of reward versus nonreward was then performed on converted and raw values. The same effects were obtained using either raw or converted values.
PSA
Analysis of PSA17 acquisition speeds revealed a significant interaction between blocks and reward (F(19,342) = 31.73; p< 0.05). Tests for simple effects revealed that subjects were significantly (p < 0.05) faster on reward versus nonreward trials on blocks 1, 11, 12, and 14–20 (Fig.1B). A significant interaction (F(19,342) = 4.01;p < 0.05) between blocks and reward was also found for the PSA12 groups. Subjects demonstrated significantly (p < 0.05) increased run speeds on reward trials on blocks 8, 10–11, 14–16, and 18–20 (Fig.1A).
Fig. 1.

PSA acquisition effects. Both PSA12 pups (A) and PSA17 pups (B) discriminated reward (r) and nonreward (n) trials by the end of training. *Indicates significantly increased run speeds on reward trials relative to nonreward trials (p < 0.05).
PRF
No differences in running speeds between reward and nonreward trials were found for either PRF group across the 20 blocks of trials (Fig. 2A,B).
Fig. 2.

PRF acquisition effects. PRF12 pups (A) and PRF17 pups (B) demonstrated no differences in run speed between reward (r) and nonreward (n) trials.
Extinction
Extinction run speeds were converted to percentage of terminal acquisition speed. Extinction run speeds were markedly different between PSA17 and PRF pups, such that PSA17 pups demonstrated faster extinction rates throughout training. ANOVA revealed significantly greater k values (F(1,18) = 8.29; p < 0.01) in the PSA17 pups (k = 0.10) relative to the PRF17 pups (k = 0.04), indicating faster extinction among PSA pups. Despite a transient difference in extinction rates between blocks 2 and 4 of extinction, kvalues were not significantly different between PSA12 (k = 0.05) and PRF12 (k = 0.05) groups (F(1,18) = 0.023; p = 0.88). A plot of percentage run speeds is presented in Figure3.
Fig. 3.

Extinction effects. A graph of run speeds for all trained groups is shown. PSA17 pups demonstrated significantly larger extinction rate constants relative to PRF17 pups, indicating that the former extinguished their responding faster than the latter. No differences were found in the P12 groups.
Behavioral cohort effects
Analysis of run speeds using only the seven previously used PSA17 pups revealed a significant interaction between blocks and reward (F(19,228) = 33.28; p< 0.05). Tests for simple effects revealed that subjects were significantly (p < 0.05) faster on reward versus nonreward trials on blocks 1, 8, 10–12, and 14–20. Therefore, the previous animals showed significant differences on reward versus nonreward trials for two additional blocks (8 and 10), whereas the addition of the new animals removed this effect. Given that there were no differences, however, in the last two sessions of training (the last 80 trials), acquisition performance was essentially the same by the end of training.
A significant interaction (F(19,228) = 4.41; p < 0.05) between blocks and reward was also found for the seven previous PSA12 pups. Subjects demonstrated significantly (p < 0.05) increased run speeds on reward trials on blocks 7, 8, 10–12, 14–16, and 18–20. Therefore, the previous animals demonstrated more robust responding on blocks 7 and 12. However, there were no differences in the last two sessions of training, indicating that behavioral performance was the same in the additional animals by the end of the acquisition sessions. No differences were found between reward and nonreward trials for either PRF group. Therefore, the acquisition results were essentially the same using either the previous PSA17 and PSA12 animals or the combined data sets; in both situations, PSA pups distinguished between reward and nonreward by the end of training.
Extinction effects obtained using the previous animals were the same as those found using the combined data set. PSA17 animals demonstrated significantly greater extinction rates relative to PRF17 animals (F(1,15) = 10.426; p = 0.005). No significant differences were found between previously used PSA12 pups and PRF12 animals (F(1,15)= 0.580; p = 0.458). Therefore, no significant change in extinction behavior occurred with the addition of the new subjects.
FDG uptake and seed PLS
Permutation tests of singular values revealed that the LV1 returned in each seed PLS analysis for the P17 groups was significant (p < 0.01). In summary, the analyses identified (1) a pattern of covariance change involving the mPFC that distinguished the PSA17 group from the PRF17 and HC17 groups, (2) covariances involving the OFC that were higher in PSA17 pups, and (3) an ACC covariance pattern that distinguished PSA17 and PRF17 pups from controls. The mPFC, OFC, and ACC contrast vectors and those regions demonstrating significant saliences (according to permutation tests;p < 0.01) are presented Figures4, 5, and6, respectively.
Fig. 4.

Seed PLS analysis of mPFC.A, The graph of seed LV1 indicates that covariances between the mPFC were generally high across regions in the PSA17 group, whereas they were less coupled in the PRF17 and HC17 groups. The regions significantly contributing to this effect according to the permutation tests are indicated in the autoradiographic images inB. The values of the saliences are indicated next to each label. Note that all saliences are positive, indicating positive covariance relationships.
Fig. 5.

Seed PLS analysis of OFC covariances.A, The graph of seed LV1 indicates that covariances between the OFC and sampled regions were generally high across all three P17 groups but slightly higher in the PSA17 pups. The regions significantly contributing to this effect according to the permutation tests are indicated in the autoradiographic images in B. The values of the saliences are indicated next to each label.
Fig. 6.

Seed PLS analysis of ACC covariances. A, The graph of seed LV1 indicates that covariances between the anterior cingulate cortex and sampled regions were generally similar between PSA17 and PRF17 pups, although the latter group's covariances were somewhat weaker. The regions were generally uncoupled in the HC17 pups. The regions significantly contributing to this effect according to the permutation tests are indicated in the autoradiographic images in B. The values of the saliences are indicated next to each label.
No significant LVs were returned by any of the seed PLSs performed for the P12 groups. Hence, whereas PLS identified functional interactions that distinguished or were common to the P17 groups, there were no significant covariance patterns associated with the P12 groups.
mPFC
In the seed PLS analysis for the mPFC, LV1 (% SSCB = 80) revealed a difference between PSA17 and the other two conditions (Fig.4A). The regions significantly contributing to this pattern were the nucleus accumbens, posterior cingulate, medial habenula, lateral habenula, subiculum, and CA1 (the salience values associated with each region are presented in Fig.4B, next to each label). These results indicate that these six regions were most correlated with the mPFC in the PSA17 group relative to the PRF17 and HC17 groups.
OFC
LV1 (% SSCB = 88) revealed higher covariances in the PSA17 group relative to the PRF17 and HC17 groups. Covariances were similar between PRF17 and HC17 pups. The contrast vector and salient brain regions associated with the OFC are presented in Figure 5, Aand B, respectively. The regions significantly contributing to this pattern were the anterior parietal cortex, anterior dorsal, medial dorsal, centromedian, and ventrobasal thalamic nuclei, posterior cingulate cortex, lateral habenula, ventral tegmental area, and gigantocellular nucleus.
ACC
For the ACC, LV1 (% SSCB = 82) distinguished the PSA17 and PRF17 groups from the HC17 groups. The contrast vector is presented in Figure 6A. The regions significantly contributing to this pattern were the medial amygdala, subiculum, CA1, CA3, perirhinal cortex, and the pedunculopontine nucleus (Fig.6B). Hence, although covariances between these regions and the anterior cingulate were similarly positive between PSA17 and PRF17 groups (although somewhat higher in the PSA17 pups), they were lower in the HC17 case.
Pearson product correlation maps illustrating these effects are presented in Figure 7. Each color-coded map indicates the correlation between the seed ROI and salient regions for each training group. It should be noted that the PLS analysis considers the covariance of a set of regions with the seed ROI simultaneously. That is, how well a set of regions, as a group, covary with the seed ROI. The individual bivariate correlations are presented only to illustrate these dominant effects and should therefore not be viewed as a formal test statistic.
Fig. 7.
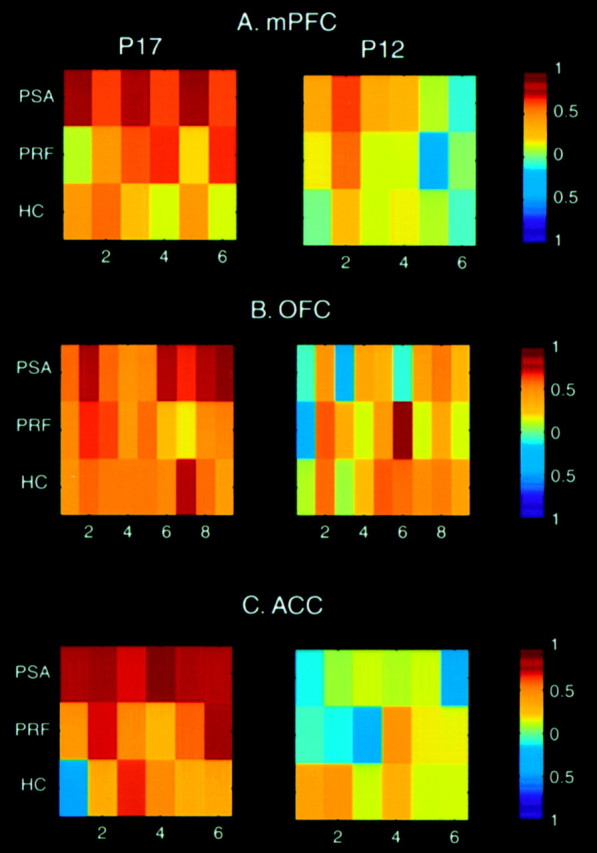
Color-coded correlation maps representing covariance changes involving the mPFC (A), OFC (B), and ACC (C). We present the pattern of changes in correlations to help illustrate the results returned by the seed PLS analyses. However, it is emphasized that PLS evaluates the covariation between a set of regions and the seed ROI simultaneously, and therefore is different from assessing bivariate correlations between regions individually. Eachcolored block represents a Pearson product moment correlation, the magnitude of which is indicated by thebar to the right of each map. They-axis in each map corresponds to the PSA, PRF, and HC groups (top to bottom), whereas thex-axis indicates the regions significantly contributing to the covariance changes indicated by PLS. Note that although the patterns of correlations change across groups in the P17 case, correlations involving the three cortical regions are generally uncoupled in P12 groups. A, 1, Nucleus accumbens; 2, posterior cingulate; 3, medial habenula; 4, lateral habenula; 5, subiculum; 6, CA1. Correlations between the mPFC and these regions were high in PSA17 group but less coupled in the PRF17 pups. Correlations were generally even lower in the HC17 group.B, Note that the dominant OFC pattern is characterized by positive correlations across the three P17 groups. However, covariances involving the last four regions were higher, presumably accounting for the PLS results. 1, anterior parietal cortex; 2, anterior dorsal thalamic nucleus;3, posterior cingulate cortex; 4, lateral habenula; 5, medial dorsal thalamus;6, centromedian nucleus, thalamus;7, ventrobasal complex; 8, ventral tegmental area; 9, gigantocellular nucleus.C, Correlative patterns involving ACC. 1, medial amygdala; 2, subiculum; 3, CA1;4, CA3; 5, perirhinal cortex;6, pedunculopontine tegmental nucleus.
Cohort effects on covariances
Comparison of correlation coefficients between previously used PSA17 and PSA12 subjects, and the combined data set revealed no significant change in any correlation coefficients between the two groups. No significant changes were found for the handled control groups either. Based on these results, it can be assumed that no significant changes in the PLS output would have occurred by the addition of the new animals.
To summarize, although both P17 and P12 animals demonstrated similar acquisition behavior, behavioral differences during extinction were found only in P17 pups. PRF17 pups were persistent relative to PSA17 pups, as indicated by analysis of extinction k constants. The results of the six seed PLS analyses revealed covariance patterns describing training-related effects, as well as covariances common to all three groups in P17 pups. Although the 27 regions included in the analyses contribute to the overall patterns identified by seed PLS, we focused on those regions returned as significant according to the permutation tests (i.e., those maximally contributing to the effects).
The first training-related change involved the mPFC and indicated a system of regions that showed high correlations in the PSA17 group. Coupling between mPFC activity and the activities of the nucleus accumbens, subiculum, CA1, habenular nuclei, and posterior cingulate cortex was associated with the rapid PSA extinction behavior. The same set of regions showed positive correlations in the PRF17 groups, but were less coupled across the system of regions. They were largely uncoupled in the HC17 group. Hence, the recruitment of these regions changed depending on the particular experimental condition and appeared to be most related to the performance differences between P17 groups.
PLS identified regions whose covariances with the OFC were similar between PRF17 and HC17 groups but higher in the PSA17 groups. Examination of the covariance maps (Fig. 7) suggests that the stronger saliences associated with the PSA17 pups may be related to the covariances involving the centromedian nucleus, ventrobasal complex, ventral tegmental area, and gigantocellular nucleus, which appeared to be stronger among those animals. The other regions (anterior parietal cortex, anterior dorsal thalamic nucleus, posterior cingulate, lateral habenula, and mediodorsal thalamic nucleus) appeared to be similarly coupled across the P17 groups. This effect is similar to the effect associated with the mPFC, although lesser in magnitude.
In the case of the ACC, the seed PLS identified a pattern of covariance change distinguishing PSA17 and PRF17 pups from controls. Covariances were generally low in the nonextinction HC groups. The regions associated with this particular pattern of covariances during extinction behavior were the hippocampus, perirhinal cortex, medial amygdala, and pedunculopontine tegmental nucleus.
DISCUSSION
The P17 seed PLS analyses implicate the mPFC, OFC, ACC, and their interactions with regions distributed throughout the rostrocaudal extent of the brain in supporting the differential extinction responding among the older pups. The rapid behavioral extinction of PSA17 pups may be related to covariances involving the mPFC and OFC. The similarity in ACC covariance relationships between PSA17 and PRF17 groups suggests that they may be related to behavioral extinction processes common to both groups but not found in the HC pups. There were no dominant patterns of covariances that were similar or different between P12 groups, indicating that at the younger age, the three cortical regions are operating differently. In fact, their functional dissociation may underlie the behavioral differences found among the younger group.
P17 mPFC effects
The weaker covariances of the hippocampus (subiculum and CA1), habenular nuclei, and nucleus accumbens with the mPFC in the PRF17 pups and the general uncoupling of these regions in the HC17 group suggest that the interactions are unique to the rapid behavioral inhibition demonstrated by the PSA17 pups. This finding is in accordance with work demonstrating a role for this system in reacting to and modifying behavior in a changing environment. Hippocampal damage results in a loss of behavioral flexibility (Day et al., 1999). The habenular nuclei appear important for coping strategies related to stress, because their damage results in increased anxiety, arousal, and a general impairment of stress responding (Murphy et al., 1996). Berridge and Robinson (1998) have proposed that the mesolimbic dopaminergic system, a crucial component being the nucleus accumbens, plays an important role in ascribing the incentive salience (or “wanting”) of stimuli and linking the incentive value of an outcome with a particular response. Accumbens interactions with the mPFC play an important role in the regulation of stress responding (Brake et al., 2000). That the seed PLS identified these regions as showing the strongest covariances with the mPFC in PSA17 pups is in line with their behavior. Amsel (1992)suggested that animals trained on predictable reward schedules similar to PSA have not learned to overcome “frustrative” or aversive cues related to nonreward, as have PRF-trained animals. These cues arise when the expectation of reward delivery is not met in extinction and so they immediately inhibit responding. Together, this functional system of regions and, importantly, their interactions with the mPFC, may constitute part of the functional circuitry for coping with the different reward contingency in the PSA17 pups.
P17 OFC effects
The mediodorsal thalamus is linked to predicting the onset of particular events (Sakurai and Sugimoto, 1986), whereas the anterior dorsal thalamic nucleus and posterior cingulate are part of a limbic–thalamocortical system implicated in inhibitory avoidance behavior (Poremba and Gabriel, 1997; Freeman and Gabriel, 1999). It is therefore reasonable that these regions may be functionally associated with the OFC because it is linked to encoding the reward value of stimuli and detecting changes in this value (Rolls, 1996).
The stronger covariances involving the ventral tegmental area, centromedian thalamic nucleus, ventrobasal complex, and gigantocellular nucleus appear to be related to the higher PSA17 salience. Therefore, the degree to which these latter regions are recruited with the aforementioned limbic thalamic and cortical components may be importantly related to the behavioral effects. Nociceptive information is relayed to the centromedian from the gigantocellular nucleus (Jones, 1995), and the ventral tegmental area is an important component of the mesolimbic dopaminergic system that supports anticipatory behavior (Berridge and Robinson, 1998). Stronger covariances involving these regions may further reflect PSA17 pups' responding to the discrepancy in reward delivery.
Interestingly, the covariances involving the somatosensory regions (anterior parental cortex and ventrobasal complex) suggest their recruitment during extinction responding, which is in accordance with other reports implicating sensory regions as sites of learning-related plasticity (McIntosh and Gonzalez-Lima, 1993; Wilson and Sullivan, 1994; Weinberger, 1998). It is speculated that aspects of reward associated with the dam may have gained associative significance in the trained animals and are encoded in the somatosensory system. Although milk is the primary reinforcer, it is linked to stimuli associated with the dam, much of which is tactile. The OFC receives substantial somatosensory input (Rolls, 1996), and so it is possible that the coordinated activity of the somatosensory system and OFC may be a mechanism through which subjects attend to the change in reward contingency. Additional studies will be required to test these hypotheses.
P17 ACC effects
The saliences associated with the ACC were relatively similar (i.e., high positive correlations) between PSA17 and PRF17 groups, although somewhat less in magnitude in the latter group. Given the similarity in covariances, they could be related to similar behavioral extinction processes not present in HC pups that are not undergoing extinction. The rate of extinction of the PSA17 and PRF17 groups is different, so the covariances may not be related to the extinction rate per se. Given that the ACC and several of the regions covarying with it [amygdala (Poremba and Gabriel, 1997), pedunculopontine tegmental nucleus, and perirhinal cortex (Gonzalez-Lima and Sadile, 2000)] are linked to instrumental learning, their interactions may be reflecting the changed reward contingency, independent of the explicit behavioral output.
Previously, we have shown unique covariance patterns within the septohippocampal system in the PSA17 group relative to the handled controls and younger PSA group (Nair and Gonzalez-Lima, 1999). The subiculum and CA1, as in the case of the mPFC, were recruited into the functional system interacting with the ACC in PSA17 pups. Therefore, frontal cortical interactions with the hippocampus, in addition to the septohippocampal interactions, may also be important in guiding the extinction behavior of PSA17 pups.
The present results also suggest that subicular and CA1 interactions may play a role in PRF17 pups. This finding is in accordance with work showing that both persistence and inhibition of behavior during extinction are attenuated in hippocampal-lesioned animals (Diaz-Granados et al., 1994). However, large-scale interactions involving these hippocampal components are different in PRF17 pups, because their general pattern of interactions with the mPFC and ACC, when examining the correlation maps, seems to be different from PSA17 pups. Therefore, the CA1 and subiculum appear to be engaged in both extinction groups, but differences in their interactions with the mPFC and ACC appear to contribute to the behavioral differences between PSA17 and PRF17 animals.
P12 effects
The functional interactions of the cortical regions in the P12 pups are markedly different relative to the P17 pups. In fact, they appear to be largely uncoupled, suggesting that the behavioral differences among the younger groups could be related to the absence of frontal cortical recruitment. The differences in covariance relationships may be related to a different reaction to extinction; perhaps the experience is less aversive to these animals. However, it has been shown previously that P12 pups emit ultrasound during extinction (Amsel et al., 1977), an indication of an aversive reaction to the changed reward contingency. Therefore, younger pups do in fact mount an aversive response to the changed reward contingency; however, they appear to have problems with coordinating an explicit behavioral inhibition with this reaction.
Alternatively, we argue that the functional immaturity of these regions is likely to underlie their weak recruitment into behavior, and hence the absence of covariance patterns and differential behavior as demonstrated by the older pups. Substantial structural changes (e.g., synaptogenesis) and physiological changes (e.g., alterations in transmitter systems such as GABA) occur between P12 and P17 in the frontal cortical regions (Miller and Schwartz, 1993; Vincent et al., 1995; Verwer et al., 1996). Such extensive changes in structure and physiology are likely to dramatically change the operability of these regions and the behavioral capabilities between the two ages. Here, our examination of functional interactions during behavior provides direct support for this idea.
Conclusions
These results suggest that functional development of frontal cortical regions may underlie the postnatal emergence of behavioral flexibility demonstrated by P17 pups. The nature of the behavioral differences between PSA17 and PRF17 pups appears to lie in the functional interactions of primarily the mPFC and OFC, whereas the ACC region may govern common extinction processes in the two groups. In the future, other techniques will be required to further assess the operations of these functional systems, including causal influences (or effective connectivity) (McIntosh and Gonzalez-Lima, 1994) between regions comprising the systems.
Footnotes
This work was supported by National Institutes of Health Grants RO1 NS37755 (F.G.-L.) and F31 MH11968 (H.P.N.). We thank Dr. A. R. McIntosh for his advice and technical assistance through the course of this study and Dr. Abram Amsel for providing his facilities for the behavioral work.
Correspondence should be addressed to Dr. F. Gonzalez-Lima, Mezes Hall 330, University of Texas at Austin, Austin, TX 78712. E-mail: gonzalez-lima@psy.utexas.edu.
H. P. Nair's present address: Center for Behavioral Neuroscience, Emory University, Atlanta, GA 30322.
J. D. Berndt's present address: Neuroscience program, University of Wisconsin, Madison, WI 53706.
REFERENCES
- 1.Amsel A. Frustration theory. Cambridge UP; New York: 1992. [Google Scholar]
- 2.Amsel A, Radek CC, Graham M, Letz R. Ultrasound emission in infant rats as an indicant of arousal during appetitive learning and extinction. Science. 1977;197:786–788. doi: 10.1126/science.560717. [DOI] [PubMed] [Google Scholar]
- 3.Berridge KC, Robinson TE. What is the role of dopamine in reward: hedonic impact, reward learning, or incentive salience? Brain Res Rev. 1998;28:308–367. doi: 10.1016/s0165-0173(98)00019-8. [DOI] [PubMed] [Google Scholar]
- 4.Brake WG, Flores G, Francis D, Meaney MJ, Srivastava LK, Gratton A. Enhanced nucleus accumbens dopamine and plasma corticosterone stress responses in adult rats with neonatal excitotoxic lesions to the medial prefrontal cortex. Neuroscience. 2000;96:687–695. doi: 10.1016/s0306-4522(00)00002-6. [DOI] [PubMed] [Google Scholar]
- 5.Day LB, Weisand M, Sutherland RJ, Schallert T. The hippocampus is not necessary for a place response but may be necessary for pliancy. Behav Neurosci. 1999;113:914–924. doi: 10.1037//0735-7044.113.5.914. [DOI] [PubMed] [Google Scholar]
- 6.Diaz-Granados JL, Greene PL, Amsel A. Selective activity enhancement and persistence in weanling rats after hippocampal X-irradiation in infancy: possible relevance for ADHD. Behav Neural Biol. 1994;61:251–259. doi: 10.1016/s0163-1047(05)80008-1. [DOI] [PubMed] [Google Scholar]
- 7.Freeman JH, Jr, Gabriel M. Changes of cingulothalamic topographic excitation patterns and avoidance response incubation over time following initial discriminative conditioning in rabbits. Neurobiol Learn Mem. 1999;72:259–272. doi: 10.1006/nlme.1998.3896. [DOI] [PubMed] [Google Scholar]
- 8.Gonzalez-Lima F. Brain imaging of auditory learning functions in rats: studies with fluorodeoxyglucose autoradiography and cytochrome oxidase histochemistry. In: Gonzalez-Lima F, Finkenstadt TH, Scheich H, editors. Advances in metabolic mapping techniques for brain imaging of behavioral and learning functions. Kluwer; Boston: 1992. pp. 39–109. [Google Scholar]
- 9.Gonzalez-Lima F, Sadile AG. Network operations revealed by brain metabolic mapping in a genetic model of hyperactivity and attention deficit: the Naples high- and low-excitability rats. Neurosci Biobehav Rev. 2000;24:157–160. doi: 10.1016/s0149-7634(99)00049-4. [DOI] [PubMed] [Google Scholar]
- 10.Hochberg Y. A sharper Bonferroni procedure for multiple tests of significance. Biometrics. 1988;75:800–802. [Google Scholar]
- 11.Horwitz B, Soncrant TT, Haxby JV. Covariance analysis of functional interactions in the brain using metabolic and blood flow data. In: Gonzalez-Lima F, Finkenstadt TH, Scheich H, editors. Advances in metabolic mapping techniques for brain imaging of behavioral and learning functions. Kluwer; Boston: 1992. pp. 189–212. [Google Scholar]
- 12.Jones BE. Reticular Formation: cytoarchitecture, transmitters, and projections. In: Paxinos G, editor. The rat nervous system. Academic; New York: 1995. pp. 155–169. [Google Scholar]
- 13.Lilliquist MW, Nair HP, Gonzalez-Lima F, Amsel A. Extinction after regular and irregular reward schedules in the infant rat: influence of age and training duration. Dev Psychobiol. 1999;34:57–70. [PubMed] [Google Scholar]
- 14.McIntosh AR, Gonzalez-Lima F. Network analysis of functional auditory pathways mapped with fluorodeoxyglucose: associative effects of a tone conditioned as a Pavlovian excitor or inhibitor. Brain Res. 1993;627:129–140. doi: 10.1016/0006-8993(93)90756-d. [DOI] [PubMed] [Google Scholar]
- 15.McIntosh AR, Gonzalez-Lima F. Structural equation modeling and its application to network analysis in functional brain imaging. Hum Brain Mapp. 1994;2:2–22. [Google Scholar]
- 16.McIntosh AR, Gonzalez-Lima F. Large-scale functional connectivity in associative learning: interrelations of the rat auditory, visual, and limbic systems. J Neurophysiol. 1998;80:3148–3162. doi: 10.1152/jn.1998.80.6.3148. [DOI] [PubMed] [Google Scholar]
- 17.McIntosh AR, Bookstein FL, Haxby JV, Grady CL. Spatial pattern analysis of functional brain images using partial least squares. NeuroImage. 1996;3:143–157. doi: 10.1006/nimg.1996.0016. [DOI] [PubMed] [Google Scholar]
- 18.Miller MW, Schwartz JH. Development of cingulate cortex: proteins, neurons, and afferents. In: Vogt BA, Gabriel M, editors. Neurobiology of cingulate cortex and limbic thalamus. Birkhauser; Boston: 1993. pp. 151–180. [Google Scholar]
- 19.Murphy CA, DiCamillo AM, Haun F, Murray M. Lesion of the habenular efferent pathway produces anxiety and locomotor hyperactivity in rats: a comparison of the effects of neonatal and adult lesions. Behav Brain Res. 1996;81:43–52. doi: 10.1016/s0166-4328(96)00041-1. [DOI] [PubMed] [Google Scholar]
- 20.Nair HP, Gonzalez-Lima F. Extinction of behavior in infant rats: development of functional coupling between septal, hippocampal, and ventral tegmental regions. J Neurosci. 1999;19:8646–8655. doi: 10.1523/JNEUROSCI.19-19-08646.1999. [DOI] [PMC free article] [PubMed] [Google Scholar]
- 21.Poremba A, Gabriel M. Amygdalar lesions block discriminative avoidance learning and cingulothalamic training-induced neuronal plasticity in rabbits. J Neurosci. 1997;17:5237–5244. doi: 10.1523/JNEUROSCI.17-13-05237.1997. [DOI] [PMC free article] [PubMed] [Google Scholar]
- 22.Reyment RA, Joreskog KG, Marcus LF. Applied factor analysis in the natural sciences. Cambridge UP; Boston: 1996. [Google Scholar]
- 23.Rolls ET. The orbitofrontal cortex. Philos Trans R Soc Lond B Biol Sci. 1996;351:1433–1443. doi: 10.1098/rstb.1996.0128. [DOI] [PubMed] [Google Scholar]
- 24.Sakurai Y, Sugimoto S. Multiple unit activity of prefrontal cortex and dorsomedial thalamus during delayed go/no-go alternation in the rat. Behav Brain Res. 1986;20:295–301. doi: 10.1016/0166-4328(86)90229-9. [DOI] [PubMed] [Google Scholar]
- 25.Sherwood NM, Timiras PS. A stereotaxic atlas of the developing rat brain. University of California; Berkeley: 1970. [Google Scholar]
- 26.Smillie KW. An introduction to regression and correlation. Academic; New York: 1966. [Google Scholar]
- 27.Tremblay L, Schultz W. Reward-related neuronal activity during go-nogo task performance in primate orbitofrontal cortex. J Neurophysiol. 2000;83:1864–1876. doi: 10.1152/jn.2000.83.4.1864. [DOI] [PubMed] [Google Scholar]
- 28.Verwer RW, Van Vulpen EH, Van Uum JF. Postnatal development of amygdaloid projections to the prefrontal cortex in the rat studied with retrograde and anterograde tracers. J Comp Neurol. 1996;376:75–96. doi: 10.1002/(SICI)1096-9861(19961202)376:1<75::AID-CNE5>3.0.CO;2-L. [DOI] [PubMed] [Google Scholar]
- 29.Vincent SL, Pabreza L, Benes FM. Postnatal maturation of GABA-immunoreactive neurons of rat medial prefrontal cortex. J Comp Neurol. 1995;355:81–92. doi: 10.1002/cne.903550110. [DOI] [PubMed] [Google Scholar]
- 30.Weinberger NM. Physiological memory in primary auditory cortex: characteristics and mechanisms. Neurobiol Learn Mem. 1998;70:226–251. doi: 10.1006/nlme.1998.3850. [DOI] [PubMed] [Google Scholar]
- 31.Wilson DA, Sullivan RM. Neurobiology of associative learning in the neonate: early olfactory learning. Behav Neural Biol. 1994;61:1–18. doi: 10.1016/s0163-1047(05)80039-1. [DOI] [PubMed] [Google Scholar]
- 32.Woodward DJ, Chang JY, Janak P, Azarov A, Anstrom K. Mesolimbic neuronal activity across behavioral states. Ann NY Acad Sci. 1999;877:91–112. doi: 10.1111/j.1749-6632.1999.tb09263.x. [DOI] [PubMed] [Google Scholar]