

Abstract
Commonly used inbred murine strains differ substantially in their vulnerability to excitotoxic insults. We investigated whether differences in dendritic Ca2+ signaling could underlie the differential vulnerability of C57BL/6 (resistant to kainate excitotoxicity) and C57BL/10 strains (vulnerable). A striking difference was found in fine dendrite Ca2+ responses after kainate exposure. Ca2+ signals in distal dendrites were large in C57BL/10 neurons, and, if a threshold concentration of ∼1.5 μm was reached, a region of sustained high Ca2+ was established in the distal dendritic tree. This region then served as an initiation site for a degenerative cascade, producing high Ca2+ levels that slowly spread to involve the entire neuron and led to cell death. Dendritic Ca2+ signals in C57BL/6 neurons were much smaller and did not trigger these propagating secondary responses. Strain differences in dendritic Ca2+ signaling were also evident after tetanic stimulation of Schaffer collaterals. Ca2+ responses were much larger and peaked earlier in distal dendrites of C57BL/10 compared with those in C57BL/6. Neurons from both strains had similar membrane properties and responded to kainate with intense action potential firing. Degenerative Ca2+ responses were seen in both strains if soma Ca2+ could be sustained above 1.5 μm. The early phases of secondary Ca2+ responses were attributable to Ca2+ influx and were abolished rapidly by buffered zero Ca2+ saline. Taken together, these data indicate that the substantial difference in Ca2+ signals in fine distal dendrites and in the initiation of spreading secondary responses may underlie the selective vulnerability of these neurons to excitotoxic insults.
Keywords: excitotoxicity, kainate, hippocampus, mouse strain, CA1 dendrite, calcium, optical indicator
Excitatory amino acid toxicity is of critical importance in the neuronal death that occurs after stroke, traumatic brain injury, and a range of other CNS pathologies. During an insult the excessive stimulation of glutamate receptors opens calcium-permeable channels capable of allowing massive Ca2+ influx and also can trigger the release of Ca2+ from intracellular stores (Rothman and Olney, 1986; Choi, 1995). A number of potential factors leading to cell death might be activated by severe Ca2+ elevations. Among them are calcium-activated proteases (Brorson et al., 1995; Lipton, 1999), phosphatases (Rao et al., 1997; Wang et al., 1999), and more complex cascades involving Ca2+-activated factors such as MAP kinase (Murray et al., 1998) and Ca2+ calmodulin kinases (Picone et al., 1989; Aronowski et al., 1992; Churn et al., 1992).
One of the most widely used model systems to investigate cascades triggered by excitotoxic stimuli involves the systemic administration of the neurotoxin kainate. In rats, kainate causes repeated seizure activity and ultimately leads to well defined patterns of destruction of hippocampal CA3 pyramidal neurons and hilar neurons (Ben-Ari, 1985). Variants of the procedure also can produce extensive neuron loss in area CA1 (Balchen et al., 1993). This model increasingly is being applied to mice, particularly as transgenic approaches are developed to investigate mechanisms of neurodegeneration. In the course of these studies it has emerged that substantial differences exist among commonly used inbred murine strains in their vulnerability to kainate. Some inbred strains (e.g., C57BL/10, FVB/N) are well suited for studies of excitotoxicity and behave in may respects like rat, in that systemic kainate exposure results in extensive cell death of CA3 and CA1 pyramidal neurons. In contrast, other strains (e.g., C57BL/6) are remarkably resistant to these same insults and, despite experiencing similar seizure activity, show virtually no cell death (Schauwecker and Steward, 1997; Steward et al., 1999). These observations are important for the design of murine studies of neurodegeneration. They suggest that inbred strain differences could be exploited to evaluate the role of excitotoxic cell death in a variety of injury models (e.g., ischemia and mechanical trauma), as well as suggesting which cellular properties might be most important in determining vulnerability or resistance to excitotoxic insults.
To exploit murine strain differences, we believe it is important to understand at what level in excitotoxic cascades these strains differ. In the present study we tested the hypothesis that vulnerable and resistant strains have important differences in one of the early steps in excitotoxic cell death, that of dendritic Ca2+ influx resulting from excitotoxic stimuli. In this scenario Ca2+ levels in vulnerable neurons would exceed a threshold required to initiate degenerative mechanisms, whereas neurons from resistant strains would not achieve this threshold and survive similar excitatory stimuli. Alternatively, if no differences in Ca2+signaling were observed between these strains, this might suggest that important strain differences exist downstream of Ca2+ entry, potentially involving mechanisms common to other cell death pathways. All experiments were performed in slice preparations to investigate the threshold and propagation of excitotoxic Ca2+ increases in intact dendritic processes.
MATERIALS AND METHODS
C57BL/6J mice were chosen as representative of strains resistant to excitotoxicity, because they are used widely as a background strain for transgenic studies. Of the vulnerable strains, the 129SvEMS line is of interest because of its use in the generation of embryonic stem cells used for generating many knock-out mutant lines. However, there is well documented genetic variability within this line (Threadgill et al., 1997), which is likely to account for the some of the reported differences in kainate vulnerability with this strain (Schauwecker and Steward, 1997; Faherty et al., 1999). Therefore, for the purposes of this study the C57BL/10J strain was chosen as a representative of strains vulnerable to excitotoxicity. Mice of either sex were obtained from Jackson Laboratories (Bar Harbor, ME) at 4–6 weeks of age and were housed in standard conditions (12 hr light/dark cycle) before death. Experiments on the two strains were interleaved throughout the study. Numbers in the study refer to numbers of neurons, each obtained from a different experimental animal for each protocol. For slice preparation the mice were anesthetized deeply with a mixture of ketamine and xylazine (85 and 15 mg/ml, respectively; 150 μl subcutaneously) and decapitated. Brains were removed and placed in ice-cold cutting solution. Cutting solution contained (in mm) 3 KCl, 1.25 NaH2PO4, 6 MgSO4, 26 NaHCO3, 0.2 CaCl2, 10 glucose, 220 sucrose, and 0.43 ketamine. Coronal sections (350 μm) were cut with a Vibratome(Technical Products, St. Louis, MO), and the slices were transferred into room temperature artificial CSF [aCSF; containing (in mm): 126 NaCl, 3 KCl, 1.25 NaH2PO4, 1 MgSO4, 26 NaHCO3, 2 CaCl2, and 10 glucose, equilibrated with 95%O2/5%CO2]. Cutting and recording solutions were both 315–320 mOsm. After being warmed to 34°C and being held for 1 hr, the aCSF was changed again, and the slices were held at room temperature until they were used for recording. Individual slices were transferred to the recording chamber and were perfused with warmed (35°C), oxygenated aCSF at 1.7–2 ml/min. Intracellular recordings were made from single CA1 pyramidal neurons by using glass microelectrodes, which were advanced with a Nanostepper micropositioner (SPI, Germany). Voltage recordings were made with an Axoclamp 2A amplifier (Axon Instruments, Foster City, CA), recorded onto magnetic tape, and analyzed after being digitized at 4.5 kHz (Superscope II, GW Instruments, Somerville, MA). Cells were accepted for filling and analysis if they had steady resting membrane potentials (RMPs) greater than −60 mV and generated action potentials >60 mV in response to depolarizing current pulses. The basic electrophysiological properties (RMP, input resistance, action potential amplitude, and duration) were not significantly different between the strains (see Results).
To provide adequate resolution of Ca2+ in dendrites, we microinjected individual neurons with the Ca2+ indicator bis fura-2 (Molecular Probes, Eugene, OR). The recording/injection microelectrodes were tip-filled with 10 mm bis fura-2 in 0.5 mK-acetate/0.5 m KCl and back-filled with 3 mKCl. These microelectrodes had resistances of ∼100 MΩ when filled with 3 m KCl and >200 MΩ initially when filled with the injection mixture. After a stable impalement was made, the indicator was injected by passing hyperpolarizing current (300–500 pA) for 10–20 min. Neurons were visualized and imaged with a water immersion objective (40×, numerical aperture 0.8; Olympus), the indicator was excited at 350/380 nm (100 msec duration at each wavelength), and fluorescence emission (510 nm center λ) was detected with a cooled CCD camera (CH250, Photometrics, Tucson, AZ). Excitation and image acquisition were controlled by using custom software as described previously (Petrozzino et al., 1995). For analysis, data from regions of interest 2.2 × 2.2 or 3.3 × 3.3 μm were background-subtracted first for each frame. For figure presentation the images were background-subtracted first; then ratio images were generated and filtered by using 3 × 3 pixel averaging. Final images were masked by using an image generated from raw 380 nm fluorescence images. Conversion to estimated Ca2+ concentrations was done by using unfiltered pixel values, as described in Grynkiewicz et al. (1985), using in vitro Ca2+concentration standards. The Ca2+indicator (bis fura-2) has an intermediate Ca2+ sensitivity (Kd ∼525 nm in 1 mm Mg2+) and provides sensitive monitoring of Ca2+levels near rest (∼100 nm) as well as at levels up to ∼5 μm (∼10-fold above theKd of 525 nm in 1 mm Mg2+). Levels above this likely are underestimated because of the saturation of the indicator and are represented at >2.5 μm in some of the figures.
In most of the Ca2+-imaging experiments, particularly those involving repetitive kainate exposures or repetitive electrical stimulation of synaptic inputs, the filling electrode was withdrawn before the neuron was stimulated. This procedure minimized the possibility of Ca2+ changes because of changes in impalement quality during intense activation of the slice or during long periods of repeated stimulation. In a small number of cases electrode withdrawal led to membrane rupture, immediate irrecoverable Ca2+ influx, and dye loss; these cells were discarded. In a series of experiments to test the influence of rapid, transient reduction of extracellular [Ca2+], the Ca2+ buffer BAPTA was applied to the slice by pressure ejection. BAPTA (Na+ salt, 10 mm) in modified aCSF (CaCl2substituted with MgCl2) was loaded into a glass micropipette (tip, ∼10 μm) and placed at the slice surface within ∼100 μm of the cell of interest. The pipette was connected to a Picospritzer (General Valve, Fairfield, NJ), and 1–3 sec pressure pulses were applied at 15–20 psi. There was a small movement of the slice and moderate defocus of dendrites during the outflow of fluid from the pipette that recovered within 1 sec of flow cessation. Local application of physiological saline producing the same movement had no effect on Ca2+ levels.
Kainate was obtained from A. G. Scientific (San Diego, CA) and was applied as a constant perfusion (10 min, 10 μm) in some experiments. To investigate transient responses to brief kainate exposures, we introduced a bolus of kainate (25 μl, 5 mmstock) into the perfusion line. The maximum peak concentration in the recording chamber was estimated at 100 μm with this procedure. All other drugs and salts were obtained from Sigma (St. Louis, MO) and were diluted in the aCSF perfusate. Bipolar stimulating electrodes were used for stimulation of Schaffer collateral fibers. Platinum tips (50 μm in diameter) were placed in stratum radiatum ∼100 μm from the pyramidal cell layer. Stimuli were delivered with a Master 8 controller, DC supply, and constant current isolation unit (AMPI, Jerusalem, Israel). Group data are presented as mean ± SEM and significant differences were evaluated by using Student's ttests, with p < 0.05 considered significant.
RESULTS
Strain differences exist in dendritic Ca2+ signaling
In the first series of experiments we determined whether there are significant strain differences in dendritic Ca2+ signals in response to endogenously released glutamate. Synaptically evoked Ca2+ transients were compared in hippocampal slices prepared from two inbred murine strains: C57BL/6J (resistant to in vivo kainate excitotoxicity, referred to as Bl/6 hereafter) and C57BL/10J (vulnerable to in vivokainate, referred to as Bl/10 hereafter). Intracellular Ca2+ was monitored during and after tetanic stimulation of the stratum radiatum (2 sec, 50 Hz train of 70 μsec stimuli). Experiments were performed in the presence of 25 μm bicuculline to minimize the influence of GABA input to the pyramidal neurons and 1 mm TEA for a partial block of K+ channels to accentuate Ca2+ increases after stimulation. Figure 1Aillustrates Ca2+ transients in representative neurons from the two strains. Before the records that are shown were made, at least four tetanic stimuli were applied to the cells at 1 min intervals to saturate potentiation effects. Care also was taken to position the field stimulus electrode at the same distance (100 μm) from stratum pyramidal in both groups. From a uniform resting Ca2+ concentration of ∼100 nm, peak transients in the Bl/6 strain were restricted to the proximal apical dendrite and cell soma before returning to resting values after the stimulus. In contrast, Ca2+ transients in the Bl/10 strain showed marked differences after identical stimuli. Peak Ca2+ transients in the Bl/10 strain occurred in more distal dendrites and were substantially larger than transients in the Bl/6 strain (Fig. 1A).
Fig. 1.
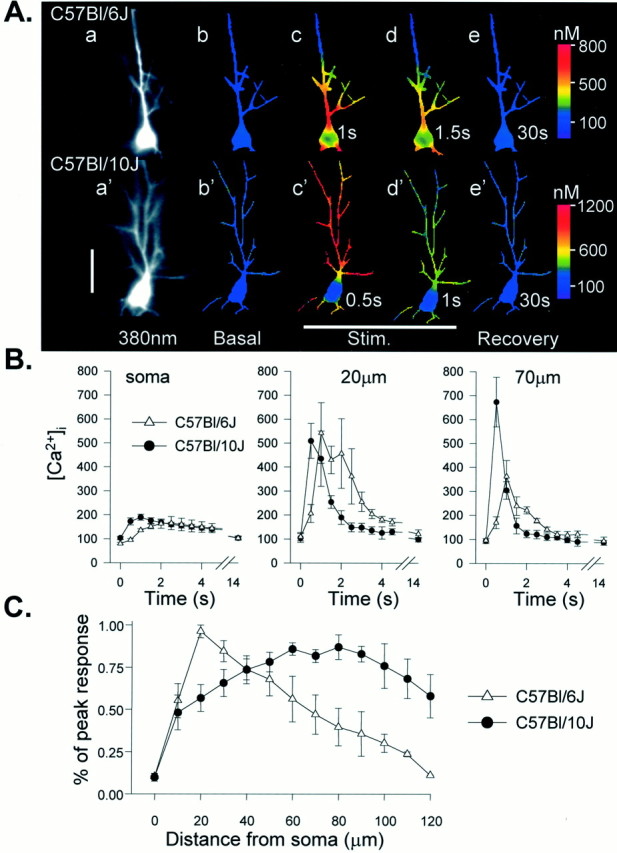
Strain difference in dendritic Ca2+ responses after tetanic stimulation of Schaffer collateral inputs. A, Examples of intracellular Ca2+ transients in Bl/6 (top panels) and Bl/10 (bottom panels) neurons in response to a single tetanus applied to the stratum radiatum (50 Hz, 2 sec). Fluorescence images (a, a′) show bis fura-2 excited at 380 nm. Right panels are ratio images (350/380 nm excitation) showing Ca2+ levels as false color images (calibration at right). Resting levels are shown in b, b′, and subsequent frames were taken at the times indicated after the onset of the tetanus. In the Bl/6 neuron the peak Ca2+ increases during the tetanus (c) were restricted to the proximal apical dendrite and soma before declining during the stimulus (d) and recovering to near-resting levels 30 sec after the stimulus (e). In contrast, the same stimulus produced substantially larger Ca2+ transients in the distal dendrites of the Bl/10 neuron, and peak responses throughout the Bl/10 neuron occurred sooner than transients in the Bl/6 cell (c′) before recovery to resting levels (d′, e′). Scale bar, 50 μm. B, Group data showing the time course of Ca2+ concentrations at three locations in response to 50 Hz, 2 sec tetani. Peak concentrations are similar in soma and proximal dendritic regions of both groups (soma and 20 μm) but substantially larger in Bl/10 neurons at more distal sites (70 μm). Dendritic Ca2+ signals also peak earlier after the onset of the tetanus in the Bl/10 strain (20 μm and70 μm; n = 6 Bl/10 neurons andn = 5 Bl/6 neurons). C, Responses normalized to peak responses in each cell, illustrating that peak Ca2+ responses in Bl/6 neurons were observed close to the soma in the proximal apical dendrite, but peak responses in Bl/10 cells were observed much further from the soma (n = 6 and 5 for Bl/10 and Bl/6, respectively).
These differences in the spatial distribution of Ca2+ increases were also clear in the population data of Figure 1, B and C, where Ca2+ increases at the peak of the synaptic response were plotted as a function of distance along the apical dendrite from the soma. In the Bl/6 group large increases were limited to the proximal dendrite, whereas in the Bl/10 strain the largest increases occurred in the more distal branches. Furthermore, the Ca2+ concentrations achieved in distal dendrites (>50 μm from soma) were significantly greater in the Bl/10 strain.
Secondary Ca2+ responses generated in dendrites after kainate exposure show strain differences
Having found a significant difference in Ca2+ signals after synaptic stimulation, we next tested whether excessive Ca2+entry produced by the excitotoxin kainate (KA) would result in strain differences in degenerative Ca2+signaling. Bicuculline and TEA were not included in these experiments. CA1 neurons from both inbred strains responded with large Ca2+ increases during KA exposure, but significant strain differences in the time course and distribution were observed.
Figure 2 shows intracellular Ca2+ profiles in exemplar neurons of the Bl/6 (Fig. 2A, top panels) and Bl/10 (Fig.2A, bottom panels) lines responding to bath-applied KA (10 μm, 10 min). Routinely, two or more of these challenges were presented to slices; here, responses to initial exposures are shown. The response patterns are different in significant ways. At the peak of the response (∼3.5 min after exposure onset) both neurons showed strong increases in Ca2+ in the proximal apical dendritic region. However, Ca2+ increases in the distal dendrites (>50 μm from the soma) were much larger in the Bl/10 neuron than in the Bl/6 (Fig. 2Ac,c′). The most striking strain differences were observed late in the KA exposure period and after washout. Ca2+ throughout the Bl/6 neuron rapidly recovered to resting levels (Fig.2Ae). In contrast, Ca2+levels in a portion of the apical dendritic tree of the Bl/10 neuron remained elevated (Fig. 2Ae′). The Ca2+ concentration in this site was estimated at 1550 nm. It is significant that this region of elevated Ca2+ was very restricted, and near-resting Ca2+ levels (100–200 nm) were observed in dendrites within 30 μm of the high Ca2+ region. Analogous dendritic regions of high Ca2+ levels remaining long after agonist washout have been described previously and termed “secondary” Ca2+ responses (Connor et al., 1988; Wadman and Connor, 1992), so this terminology will be used hereafter. Figure 2B follows the development of the secondary Ca2+ response in the same neuron as it propagated and engulfed the entire neuron over a 25 min period after KA washout. It can be seen that the propagation occurred both toward the soma and away from the soma as branch points with uninvolved dendrites were reached. Figure 2C (red trace) tracks the advance of the secondary response down the main dendrite by plotting the location at which Ca2+ first reached a benchmark value of 1.5 μm. The black trace tracks soma Ca2+ over the same period to emphasize that there was an initial full recovery to resting levels, which was maintained until the secondary response arrived from the distal dendrite. Thus Ca2+ levels in the soma recovered to near-resting levels (105 nm) 5 min after KA washout, and only ∼22 min later was Ca2+ elevated significantly in the cell soma.
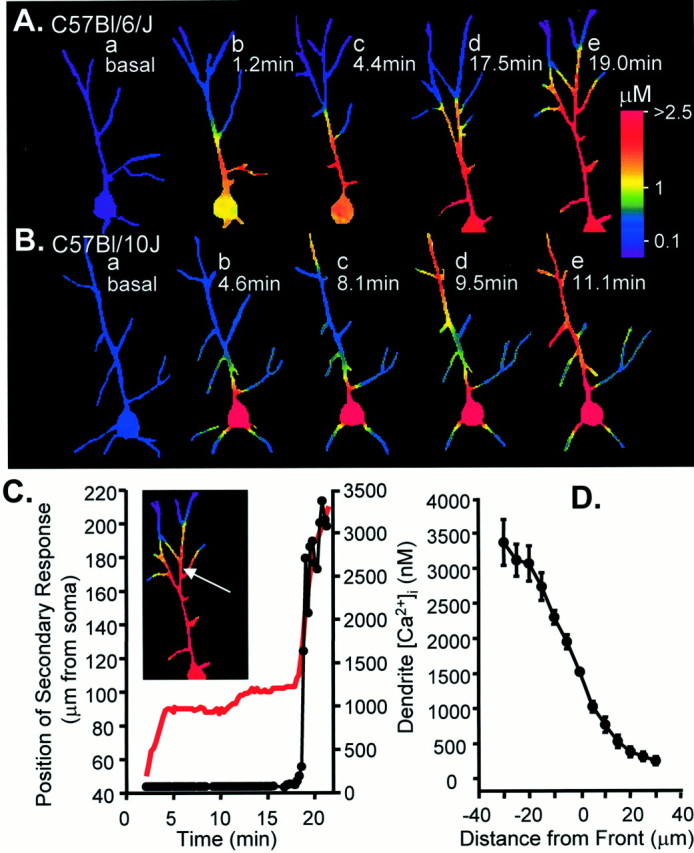
Fig. 2.
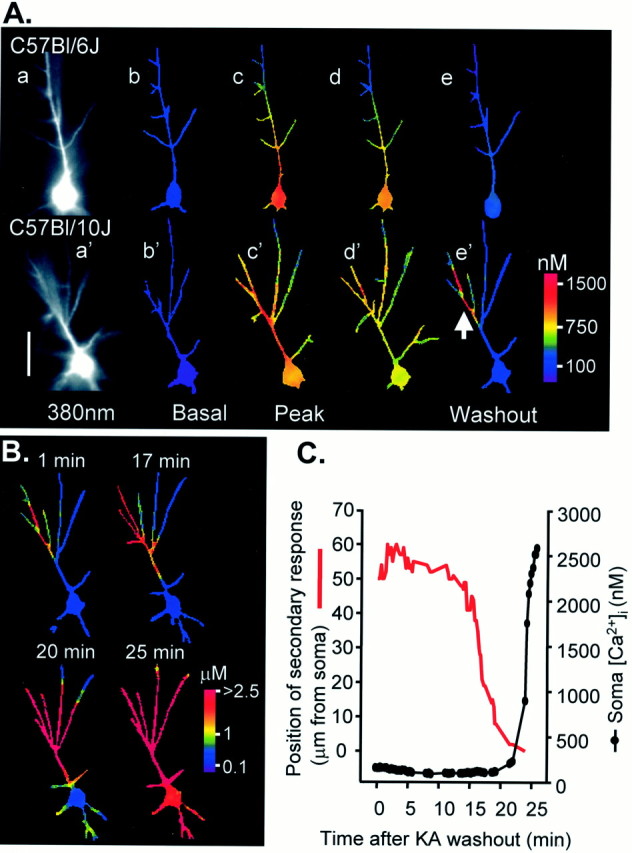
Strain differences in dendritic Ca2+ signaling after prolonged kainate (KA) exposure. A, Examples of responses to KA perfusion (10 μm, 10 min) in a Bl/6 neuron (top panels) and Bl/10 neuron (bottom panels). Fluorescence images (a, a′) show bis fura-2 excited at 380 nm. Right panels show resting and stimulated Ca2+levels as false color images. Resting Ca2+ levels (b, b′) were similar in both strains. Approximate peaks of the responses in KA are shown in c, c′. Neurons from both strains showed strong increases in Ca2+ in the proximal apical dendrite; however, Ca2+ increases in the distal dendrites (>50 μm from the soma) are much larger in the Bl/10 neuron. Dendritic Ca2+ responses also are more sustained in the Bl/10 neuron (d, d′; 15 sec after peak responses). By the beginning of the washout (e, e′) Ca2+ had returned to resting levels throughout the Bl/6 neuron. In contrast, Ca2+ levels in a portion of the apical dendritic tree of the Bl/10 neuron remain elevated (arrow in e′). Scale bar, 50 μm. B, After KA washout, Ca2+levels remain very high in this restricted dendritic region of the Bl/10 neuron and then slowly propagate throughout the neuron. Ca2+ profiles at the times indicated, in minutes, after KA washout are illustrated in the four panels. Note the change in color calibration. C, Plot showing progression of secondary Ca2+ response toward the soma (red line) and the Ca2+ levels measured in the cell soma (filled circles) during the same time course. Soma Ca2+ remains low until the secondary response reaches the soma (∼22 min after KA washout) and then rapidly rises to irrecoverably high levels.
This strain difference in generation of dendritic secondary responses was observed in neurons from a group of six Bl/6 slices and seven Bl/10 slices after the bath perfusion protocol (10 μm, 10 min). From similar resting Ca2+ levels (79.6 ± 22.0 and 83.6 ± 17.5 nm in Bl/6 and Bl/10, respectively), initial peak Ca2+responses measured in somata during the KA exposure were not significantly different (1266.5 ± 238.8 and 1434.9 ± 306.7 nm for Bl/6 and Bl/10, respectively). Three Bl/6 slices were exposed to single KA perfusions, and three were exposed to multiple trials of three perfusions each, separated by 15 min periods of washout. Importantly, after KA washout the secondary dendritic Ca2+ responses were never observed in any of the six Bl/6 neurons. In contrast, six of seven Bl/10 neurons developed secondary Ca2+ responses in dendrites. Three developed dendritic secondary responses on the initial KA exposure, the initiation site being visible within the field of view (i.e., within ∼160 μm from the cell soma) immediately after KA washout and subsequently propagating throughout the cell and invading the cell soma. In another two of the seven cells the secondary responses were initiated after either the second or third KA perfusion. The propagating secondary response originating in the distal dendritic tree (>160 μm from the soma) was seen in an additional Bl/10 neuron after 10 min of KA (10 μm) perfusion after the neuron was exposed previously to multiple, brief KA bolus applications (see below). In contrast to the resistant Bl/6 neurons, only one of seven Bl/10 neurons failed to initiate dendritic secondary responses after this protocol of 10 min, 10 μm KA perfusion.
We next asked whether this difference was attributable to persistent actions of KA during extended bath perfusions or whether strain differences were also apparent after much shorter KA exposures. Bolus application of KA at a higher concentration (see Materials and Methods) has the advantages that an effective concentration of KA is reached more rapidly and normal aCSF is restored more rapidly, making the separation of direct KA actions from secondary effects more prominent. A disadvantage, that the concentration a given neuron sees is a more serious function of depth into the slice, is minimized by the fact that neurons had to be within ∼60–70 μm from the surface for well defined images of the dendrites to be obtained. This procedure also resulted in secondary Ca2+ responses being generated selectively in Bl/10 dendrites, but in all cases the application of multiple boli was required to initiate the responses. Thus for this series of experiments an experiment was considered successful if soma Ca2+ levels returned to resting levels between successive applications. This was achieved in six Bl/10 and five Bl/6 neurons subjected to multiple KA bolus challenges. Secondary Ca2+ responses were initiated in distal dendrites in five of six of the Bl/10 neurons and required a range of three to eight KA exposures (mean 5.5). The remaining one Bl/10 neuron in the group did not produce a secondary response after eight KA bolus challenges. None of the Bl/6 neurons produced secondary responses originating in dendrites (zero of five), where the mean number of KA exposures that were tested was 6.2 (range 3–12).
Figure 3 illustrates secondary responses initiated in the distal dendrites of two Bl/10 neurons after KA bolus exposure. Figure 3A shows the common situation (four of five neurons) for which a secondary response, triggered after six bolus exposures, ended up invading the cell soma. In this case the secondary response originated outside the field of view in the distal dendritic tree, and only the progressive phase of the event is observed in the principal apical dendrite. Figure 3B shows the fifth neuron for which a secondary response (Ca2+concentration at the front, ∼1500 nm) propagated toward the soma but recovered, and resting Ca2+ levels (∼100 μm) were restored throughout the apical dendrite. We surmise that recovering secondary responses could be initiated with greater frequency if appropriate intermediate strength stimuli could be determined. Taking the perfusion and bolus KA data together, dendritic secondary responses were evoked in 11 of 13 Bl/10 neurons and 0 of 11 Bl/6 neurons.
Fig. 3.
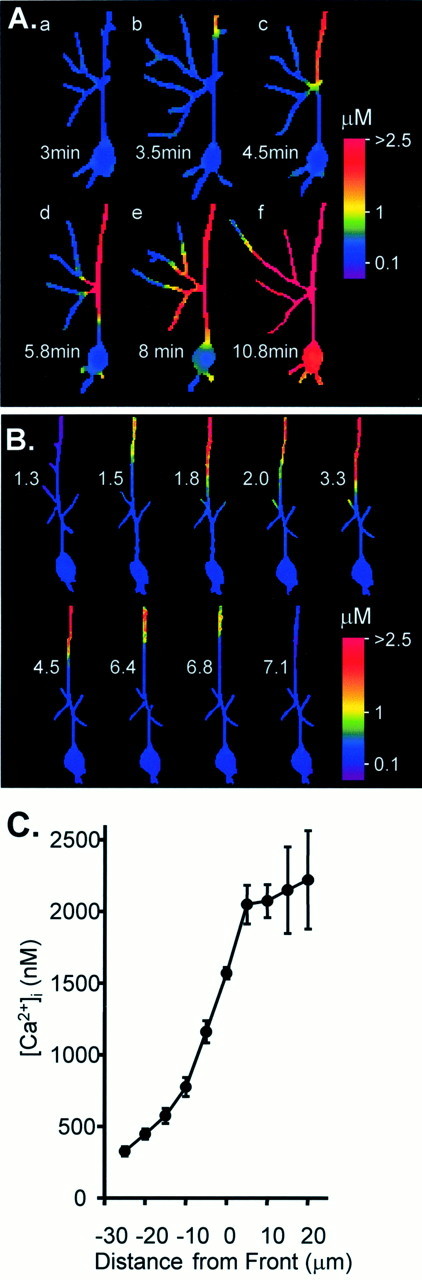
Secondary Ca2+ responses in Bl/10 dendrites after repetitive bolus KA exposure.A, Ca2+ images at the times indicated after washout of the third of three KA bolus applications. Dendrites within the field of view had recovered to resting levels 3 min after KA washout (a). With the passage of time a secondary response invaded the dendrite within the field of view (b, top). The response then propagated along the apical dendrite and invaded secondary dendrites as they were encountered (c, d) before arriving at (e) and involving the cell soma (f). B, A secondary Ca2+ response was generated by six bolus KA applications. The response originated in distal dendrites, progressed toward the soma, and then receded until the neuron recovered to prestimulus Ca2+ levels. The numbersin each panel indicate the time (in minutes) after the initial peak Ca2+ response in the proximal apical dendrite during the final KA exposure. C, Mean data illustrating the steep Ca2+ concentration across the front of propagating secondary responses. Data were derived from regions 50–100 μm from the cell soma after secondary responses were initiated in the distal dendrites (n = 9 Bl/10 neurons).
Characteristics of secondary Ca2+ responses generated in dendrites of C57BL/10J neurons
Because dendritic secondary responses that follow KA exposure have not been described previously, we exploited the Bl/10 strain to investigate the thresholds, progression, and sources of Ca2+ involved in these responses. The characteristics of these responses were very consistent among the group of Bl/10 cells. They all showed a similarly steep Ca2+ concentration gradient that was maintained at the leading edge of the response as it moved through all dendritic regions (Fig. 3C). Because of the difficulty in making reliable measurements in fine secondary and tertiary dendrites, this gradient was determined in a region of the primary apical dendrite 50–100 μm from the soma. In all cases the estimated Ca2+ concentration just behind the leading edge of the response was close to 1500 nm, and this point was used as a benchmark concentration to define the position of the front. The similarity with Ca2+concentrations observed at initiation sites (see above) suggests that this sustained elevation to ∼1500 nm represents a threshold concentration required for the establishment of secondary Ca2+ responses in Bl/10 dendrites.
When propagating secondary responses were observed, they progressed in all directions along neuron processes. Thus, when a dendrite branch point was reached by a propagating response, the response spread into uninvolved dendritic regions irrespective of direction with respect to the cell soma (e.g., Figs. 2B, 3A). Once a branch point had been reached, the rate of progression slowed and often stalled temporarily. This behavior and the branching nature of CA1 apical dendrites made it difficult to determine the mean rate of progression of secondary responses. Similar to the situation of reaching a dendrite branch point, there was also a substantial slowing of the progression of the secondary response as it reached the soma. Nevertheless, the overall progression rate over the last 100 μm was 2.67 ± 1.1 μm/sec for six neurons. The indicator bis fura-2 was retained within dendritic processes after the invasion of a region for periods up to ∼30 min after the involvement of a dendritic process. However, rapid indicator loss was observed after the secondary response had spread to involve the entire neuron, indicating a clear loss of viability.
Sources of Ca2+ involved in triggering and propagation of dendritic secondary responses
Because previous studies have shown that NMDA receptors contribute to the generation of secondary responses (Connor et al., 1988; Wadman and Connor, 1992; Chen et al., 1997), the effect of aminophosphonovalerate (APV; 100 μm) was tested on repetitive, sustained KA perfusions in Bl/10 slices. In these experiments APV was present throughout the experiment because we had demonstrated previously that dendritic secondary responses could be initiated on the first KA exposure. Thus no direct assessment could be made of the effectiveness of APV on initial peak Ca2+ responses within each slice. In three experiments KA was applied for 3 × 10 min perfusions (10 μm) at 20 min intervals in the presence of APV; in all cases no secondary dendritic response was initiated, in contrast to the results described above with normal aCSF. Thus indirect actions of KA appear to be critical in triggering the secondary response, possibly by causing the release of glutamate from presynaptic or other sources. Future studies will be required to determine whether the differences seen here are attributable to strain differences in the NMDA receptor complement or other receptors and pathways, e.g., factors that would limit dendrite depolarization and hence block Ca2+ influx through the receptor (Mayer et al., 1984; MacDermott et al., 1986). These factors could include GABA receptor-mediated differences or differences in muscarinic– cholinergic inputs that dramatically can increase dendritic Ca2+ signals generated either by antidromic or orthodromic stimulus (Müller and Connor, 1991;Egorov et al., 1999).
An additional series of experiments was performed to assess the importance of Ca2+ influx in the progression of secondary responses. This was accomplished by pressure application of BAPTA/zero Ca2+ aCSF to the cell, using a small pressure pipette positioned adjacent to the neuron of interest (see Materials and Methods). In near-surface neurons such as we use for imaging, this allowed rapid, local removal of extracellular Ca2+ and abolished Ca2+ transients when it was applied during initial KA responses (data not shown). BAPTA/zero Ca2+ effects were tested in five Bl/10 neurons (five animals) in which secondary responses had been initiated by bolus applications of KA as before. At the time of application the secondary responses were in the process of spreading through the dendritic tree. The pipette tip containing BAPTA/zero Ca2+ aCSF was positioned generally to be near the propagation front of the secondary response. In all five experiments the local application of BAPTA-zero Ca2+ aCSF produced an immediate reduction in Ca2+ levels in cellular regions near the pipette opening. After termination of flow from the pipette and attendant recovery of extracellular Ca2+, the intracellular Ca2+ levels quickly increased to levels that equaled or exceeded those before the BAPTA/zero Ca2+ test. The time course and spatial profile of such reductions are illustrated in Figure4, A and B. Figure4A shows intracellular Ca2+ dynamics for three successive BAPTA/zero Ca2+ applications. After this, no further applications were made, and the secondary response invaded the soma over the time course shown in the figure.
Fig. 4.
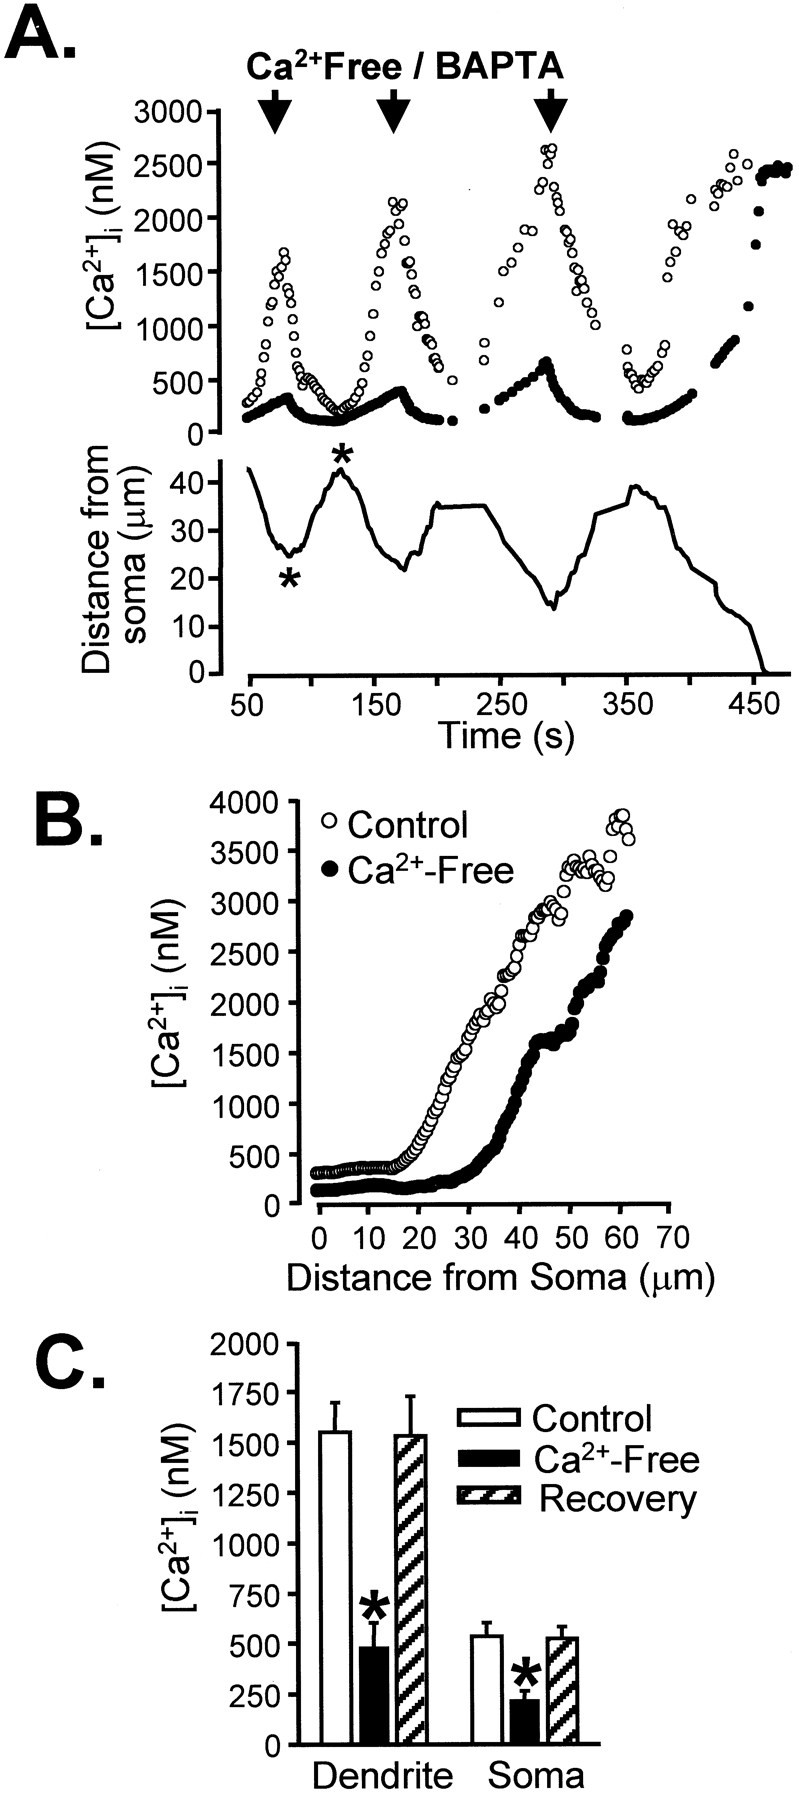
Rapid localized reduction of extracellular [Ca2+] quenches secondary intracellular [Ca2+] increases in Bl/10 neurons.A, Shown are the effects of three successive pressure applications of BAPTA/zero Ca2+ solution (arrows) applied during the progression of a secondary response toward the soma. Dendrite Ca2+ measured ∼30 μm from the soma (open circles) dropped sharply and then recovered after each BAPTA/zero Ca2+application. As a consequence of the close proximity of the dendrite secondary response, soma Ca2+ levels also were elevated significantly (filled circles) and also were reduced during BAPTA/zero Ca2+ application. The position of the leading edge of the secondary response is indicated by the solid line and shows that, after the three zero-Ca2+ applications, the secondary response was allowed to proceed into the cell soma. B, Profile of Ca2+ concentrations as a function of distance from the soma at the times marked by the asterisks inA. C, Mean data from a group of five neurons showing mean Ca2+ concentrations in soma and dendrite (30–50 μm from soma) before, during, and 2 min after a brief (3 sec) BAPTA/zero Ca2+ exposure (*p < 0.005).
This observation strongly suggests that the propagating increase of intracellular Ca2+ does not result from a progressive failure of regulatory mechanisms to cope with normal Ca2+ influx but, instead, results from a progressive increase in Ca2+ influx such as might occur from a change in the characteristics or number of Ca2+-carrying channels in the plasmalemma, overwhelming the normal regulation. During the brief applications of BAPTA/zero Ca2+ saline that are shown (Fig. 4A,B), intracellular Ca2+ levels did not recover completely to pre-KA stimulus values. Longer-term exposures to zero Ca2+, using complete bath exchange, allowed intracellular Ca2+ levels to drop to pre-KA levels or below (data not shown).
To allow for a comparison of group data (Fig. 4C), we allowed secondary responses to progress to a common region in the apical dendrite ∼30–50 μm from the cell soma. Once this point had been reached, a 3 sec application of BAPTA/zero Ca2+ produced a rapid and dramatic retraction of the response. In all cases the responses recovered within 2 min and continued propagating toward the soma.
Electrophysiological properties of neurons from the two strains are similar
We next examined whether strain differences in Ca2+ signaling could be attributed to some difference in active or passive membrane properties. Electrophysiological properties recorded from CA1 somata were very similar in the two strains. RMP was not significantly different between the strains (65.0 ± 0.7 and 66.0 ± 1.1 mV for Bl/6 and Bl/10, respectively). Input resistance was measured by using small hyperpolarizing current pulses (100 pA) applied at resting membrane potential and was almost identical for the groups (100.2 ± 4.3 and 103.9 ± 3.0 MΩ for Bl/10 and Bl/6, respectively;n = 6). Depolarizing current applied at −65 mV produced trains of action potentials and similar spike frequency adaptation in both strains during long stimuli (Fig.5A). The degree of adaptation was determined during 1 sec trains, 200 pA applied at −65 mV and was not different between the strains (Fig. 5B), suggesting that spike-driven Ca2+ influx and coupling to Ca2+-dependent K+ currents in somata are similar during trains of antidromically driven action potentials. Similarly, afterhyperpolarizations measured at the completion of spike trains were not different between the strains (3.5 ± 0.7 and 4.3 ± 0.4 mV for Bl/10 and Bl/6, respectively). There was no difference in action potential amplitude (69.5 ± 3.2 and 70.4 ± 2.1 mV) or duration (1.38 ± 0.05 and 1.37 ± 0.04 msec). These results indicate that there is no demonstrable difference in membrane properties as recorded from somata of the two strains; electrophysiological evidence for Ca2+influx (spike frequency adaptation) further supports conclusions from indicator measurements that soma Ca2+dynamics are similar between the strains. We also examined paired-pulse facilitation as one indicator of differences in presynaptic regulation of transmitter release, a factor that could contribute to strain differences in postsynaptic Ca2+responses. Postsynaptic responses during electrical stimulation of Schaffer collateral inputs produced discrete excitatory postsynaptic potentials in both strains, and decreasing the interval between pairs of pulses produced similar paired-pulse facilitation (Fig.5C), suggesting that the regulation of transmitter release after electrical stimulation is similar between the strains.
Fig. 5.
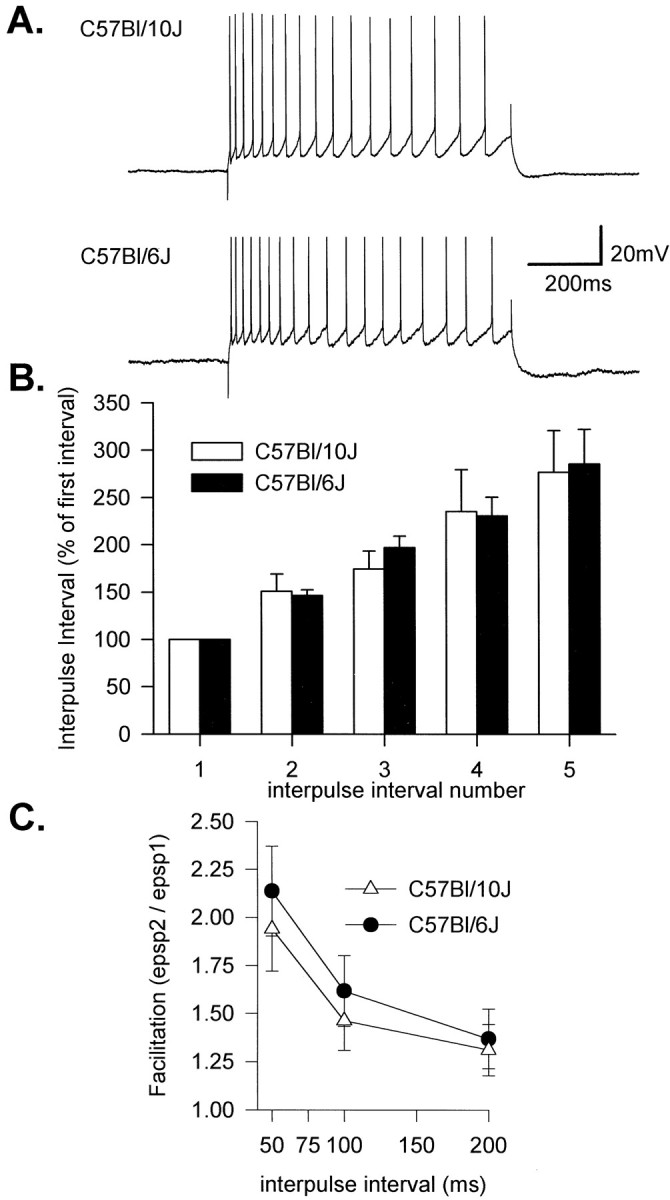
Similarity of action potential trains and synaptic inputs in Bl/6 and Bl/10 mice. A, Representative trains of action potentials evoked by current injection (200 pA, 1 sec from −65 mV). Neurons from both strains show strong spike frequency adaptation. Mean adaptation is shown in B, where the mean interspike interval is plotted for the first six events (n = 6 for each group). C, Paired-pulse facilitation of EPSPs evoked by pairs of shocks applied to the stratum radiatum was not significantly different between the strains (n = 4 for each group).
Finally, firing patterns during KA exposure were examined. Because of KA-induced swelling (see Andrew and MacVicar, 1994) it was seldom possible to maintain microelectrode penetrations for more than a few minutes after KA exposure; nonetheless, electrical recordings were made in three Bl/6 and three Bl/10 neurons for durations up to 4 min. During this time period KA initiated a sustained barrage of action potential firing and prominent EPSP activity recorded in CA1 neurons. Thus, standard electrical measurements fail to reveal differences that might account for differential vulnerability.
A somatodendritic spread of secondary Ca2+responses can be induced under certain conditions in both strains
Taken together, the results above suggest that the ability to generate dendritic Ca2+ levels sustained above a threshold of ∼1.5 μm underlies the strain difference in excitotoxic vulnerability. However, in addition to differences in peak Ca2+ influx during excitotoxic stimuli, neurons of the Bl/10 strain also may have unique intrinsic properties that promote the propagation of secondary responses throughout the neuron, a feature required for coupling discrete secondary responses to acute cell death. The resistant strain may lack the cellular mechanism(s) required to maintain and propagate secondary responses. The final set of data argues against this possibility because, under appropriate experimental conditions, sustained Ca2+ responses could be initiated in soma/proximal apical dendrites of Bl/6 neurons and spread outward throughout dendritic processes.
This was achieved in five Bl/6 neurons in which sustained high (>1.5 μm) Ca2+ elevations were achieved in the soma/proximal apical dendrite region. A primary contributor to the development of these large responses was the experimental factor relating to electrode impalement and withdrawal. In some cells the removal of the injection microelectrode caused a transient disruption of the soma membrane and a significant Ca2+ increase in the soma and proximal apical dendrite regions. The soma Ca2+disturbance then recovered in 5–6 min, after which the levels recovered to prewithdrawal values, were uniform throughout the neuron, and remained there in the absence of stimulation. These neurons invariably produced large soma/proximal apical dendrite Ca2+ transients (peak, 2264 ± 256 nm;n = 5) during subsequent bolus KA exposures, and the focus of the response was often at the microelectrode impalement site. Because soma Ca2+ did not recover between successive KA exposures, these “primed” neurons were not useful for studying secondary responses in dendritic processes that were initiated after the transient response during KA exposure (see above). However, data from these neurons are included here to demonstrate that Bl/6 neurons are capable of generating propagating secondary Ca2+ responses after threshold Ca2+ concentrations have been reached.
Figure 6A illustrates the propagating secondary response in a Bl/6 neuron after the third challenge with a KA bolus. In stark contrast to secondary responses originating in Bl/10 dendrites, the direction of propagation of the high Ca2+ front is outward, beginning at the soma/proximal dendrite region and proceeding toward the distal dendrites. The secondary response stalled at a branch point, and the subsequent addition of a further bolus resulted in further propagation throughout the dendritic tree. Figure 6C shows that Ca2+ levels in the distal dendrites remained at resting levels until the arrival of the secondary response (∼20 min). The occurrence of secondary responses initiated in somata of Bl/10 neurons was much less frequent, usually because these neurons were killed by events originating in distal dendrites. Nonetheless, in three Bl/10 neurons in which somata were primed after electrode withdrawal, soma-originating responses were established. Figure6B illustrates the progression of events in one such Bl/10 neuron in which propagating responses developed both in the soma and distal dendrite. The secondary response originating in the soma was seen first (Fig. 6Bb), beginning to propagate outward into the apical dendrite. The initiation site of the dendrite secondary response was beyond the field of view, and the front was not seen until Figure 6Bc. It then propagated toward the soma (Fig.6Bc–e) until it collided with the outgoing response. The elapsed time from when the invasion was first visible in the distal dendrite until the fronts collided in the proximal dendrite was ∼4 min. It will be noted that the length of the dendrite connecting the two active regions maintained near-normal resting Ca2+ levels until the fronts became very near each other. This region of the apical dendrite normally responds to depolarizations with large Ca2+increases, indicating the presence of voltage-gated Ca2+ channels, so dendritic depolarization cannot be the primary factor driving the Ca2+ increases. Also because the intervening levels are low between the two fronts, Ca2+ cannot be spreading passively from one location to the other.
Fig. 6.
Secondary Ca2+responses originating in somata of both Bl/10 and Bl/6 neurons.A, Ca2+ in a Bl/6 neuron after repeated KA bolus applications. The numbers indicate the time (in minutes) after the application of the third KA bolus to this neuron. Ca2+ remained high within the soma and proximal apical dendrite and then progressed to a point ∼80–100 μm from the soma, where the response stalled at a branch point (c). An additional KA bolus added betweenc and d triggered further progression of the front along the dendritic tree (d, e). The response ultimately invaded all resolvable dendrites. Differences in apparent length and configuration of dendrite branches are attributable to different focal planes at the different time points. B, Bl/10 neuron with secondary responses initiated in both the soma (b) and distal dendrites (c) after KA boli. The two sites progressed simultaneously, converging ∼50 μm from the cell soma (e). C, Progression of secondary Ca2+ in the Bl/6 neuron illustrated inA. The red line indicates the position of the secondary response as a function of time after the initial peak response during KA application. Ca2+ levels in a dendritic region 130 μm from the soma (site indicated by white arrow on inset) are plotted over the same time course (filled circles). Note that Ca2+ remained low at this location until the arrival of the secondary response (∼19 min after the initial response).D, Mean data illustrating the steep Ca2+ concentration across the front of propagating secondary responses originating in the soma or proximal apical dendrite. Data were derived from regions 50–100 μm from the cell soma (n = 9; six Bl/6 and three Bl/10 neurons).
Importantly, the characteristics of the secondary responses originating in somata were similar in all of the neurons (six Bl/6 and three Bl/10) after bolus KA exposures and were very similar to the secondary responses described above in dendrites of Bl/10 neurons, with the obvious difference in direction. After the initiation of secondary responses in somata, dendrite Ca2+ was maintained at low levels in advance of the propagating front, creating a steep Ca2+ gradient. In neurons with soma secondary responses, determining the range of this value was straightforward because measurements could be made in the relatively large proximal dendrite (Fig. 6C). This value appears almost identical to the threshold value required to trigger progressive secondary responses in dendrites of Bl/10 neurons (see above). The outward progression also was retarded by the presence of dendrite branch points, and, in cases in which the response invaded the entire neuron (eight of nine neurons), indicator loss and cell death were observed.
To summarize, under conditions in which soma Ca2+ responses were transient, only neurons of the Bl/10 line were killed by KA and then only after establishment and propagation of secondary responses from distal dendrites (described above; see Figs. 2, 3). However, both strains were capable of showing progressive secondary responses if threshold concentrations were reached under experimental conditions in which the soma/proximal dendrite were primed. This suggests that the strain difference rests in the ability to achieve the threshold concentration in Bl/10 dendrites rather than in some downstream characteristic that permits consolidation and progression of secondary responses leading to cell death.
DISCUSSION
The results of this study suggest that substantial differences in dendritic Ca2+ signaling contribute to the differential vulnerability of murine strains to excitotoxic insults. After KA exposure in the vulnerable Bl/10 strain, sustained Ca2+ increases developed in restricted regions of the dendritic tree and persisted long after agonist washout, a behavior not seen in the resistant Bl/6 strain. These responses (termed secondary Ca2+ responses) then slowly propagated throughout the dendritic tree, ultimately killing the cell on arrival at the soma. Dendritic secondary Ca2+ responses have not been described previously after KA exposure and appear to be maintained by sustained Ca2+ elevations above a threshold of ∼1.5 μm (see below). Electrophysiological properties and Ca2+ signaling recorded in somata of the two strains were almost identical. The fact that Ca2+ increases in distal dendrites of Bl/6 neurons were significantly smaller in response to both endogenous glutamate and exogenous KA and did not reach this threshold appears to explain why neurons from this strain survive similar excitotoxic insults.
Thresholds for triggering degenerative Ca2+ signaling
Secondary Ca2+ responses spread in a uniform and predictable manner, slowly in all directions through the dendritic processes. In all cases a rather remarkable consistency existed in the sustained [Ca2+] that appeared to trigger the secondary response (∼1.5 μm; measured with bis fura-2) and also was found at the leading edge of spreading secondary responses. This value is at the upper measurement range of fura-2, the indicator that commonly has been used in Ca2+ excitotoxicity measurements (cf.Wadman and Connor, 1992; Dubinsky, 1993; Weiss et al., 1993). Thus it is not possible to compare the 1.5 μm threshold measured here by using bis fura-2 with many previous findings other than those of Hyrc et al. (1997), who reported a critical level for toxicity of >5 μm Ca2+ in cortical cultures.
Our results show that initiation sites of this excitotoxic Ca2+ signaling can involve very restricted regions of dendrite, and, in cases in which we could visualize initiation sites after KA exposure, Ca2+levels remained at high concentrations (>1.5 μm) for periods up to 20 min before beginning to propagate throughout the neuron. This contrasts greatly with the time course of Ca2+ transients after the stimulation of synaptic inputs to CA1 neurons. In the present study tetanic stimulation of inputs excitatory to CA1 neurons of KA-vulnerable neurons produced large Ca2+ responses in distal dendrites, but they were rapidly decaying. These responses never led to secondary responses or degeneration. Higher resolution imaging has demonstrated much larger Ca2+increases (e.g., 40–60 μm) in small spiny dendrites of CA1 neurons during physiological activity (Petrozzino et al., 1995). Again, these rapidly decaying events were reproducible and did not lead to secondary responses nor to overt cell damage (see also Helmchen et al., 1999; Yuste et al., 1999). Taken together, these observations suggest that the time course of Ca2+transients is a critical determinant in separating normal Ca2+-dependent physiology from pathological cascades. Because recovering dendritic secondary responses as long as 300–400 sec were encountered (see Fig. 3B), the safety factor for this separation could be >100. In the case of repeated seizure activity after in vivo KA exposure (Faherty et al., 1999; Steward et al., 1999), we would predict that Ca2+ would remain elevated in the fine dendritic structures of Bl/10 neurons (but not Bl/6 neurons) for periods sufficient to initiate secondary responses and consequent excitotoxic cell death.
Relationship between secondary responses and cell death
If differences in the generation of secondary Ca2+ responses explain differential vulnerability, then these responses should lead to cell death in the slice preparation. Acute toxicity in the slice preparation is unequivocal. In those cases in which a cell loses its contents of a 1007 molecular weight indicator (bis fura-2), it is seriously compromised and reasonably may be considered irrecoverable. This acute toxicity never occurred without the development of the secondary propagating response invading the entire neuron, indicating that these secondary responses underlie differential vulnerability to KA, at least in the slice preparation. An additional conclusion is that acute toxicity is not the direct result of the initial agonist-induced Ca2+ load but appears to be a consequence of intrinsic processes in the neuron. As a result of the long delay involved in the progression of dendritic secondary responses, poststimulation soma Ca2+ often recovered to levels indistinguishable from prestimulus levels until the secondary response invaded. This finding emphasizes the necessity of monitoring Ca2+ signals in apical, and possibly basal, dendrites as well as soma levels to avoid misinterpretation. For example, without dendrite measurements it might appear that Ca2+-independent processes were involved in the secondary soma Ca2+ rise and cell death, when this is clearly not the case here.
Secondary responses initiated in somata of both strains
Our results show that outwardly propagating secondary responses could be generated in both strains, under conditions in which soma Ca2+ levels were elevated above a threshold for a sufficient duration. Once outwardly propagating responses were established in somata, their characteristics, Ca2+ gradient steepness, propagation velocity, and slowing at branch points were very similar to those of inward propagation from Bl/10 dendrites. In the Bl/6 neurons the secondary responses were induced most readily by KA after an overt Ca2+ priming transient caused by withdrawal of the injection electrode. It is arguable that some Ca2+ leak always occurs either at penetration, which would be undetectable, or at withdrawal. Consequently, it is possible that Bl/6 neurons would never develop secondary responses to KA at the doses used here. Future work will attempt to address the question by using noninvasive loading techniques (Connor and Cormier, 2000). In the Bl/10 strain the outward propagating pattern was difficult to demonstrate under normal conditions because distal dendritic initiation occurred and dominated subsequent behavior. In extraordinary circumstances, as when the soma membrane had been “primed” by Ca2+leakage, outward and inward propagation of the secondary responses collided in Bl/10 neurons (see Fig. 5B). These findings imply that the differential vulnerability between strains is not attributable to differences in the intrinsic machinery producing the secondary responses. Rather, it suggests that the important difference with respect to KA vulnerability is the difference in ability to generate large, sustained Ca2+ elevations in distal dendrites where a favorable surface-to-volume ratio exists.
Future studies will be required to determine whether differences in initial responses involve differences that regulate membrane excitability (e.g., K+ channel expression or regulation) or glutamate receptor expression (e.g., NMDA receptors; see Results) and/or differences in intracellular Ca2+ buffering. Such differences do not appear to be specific to KA stimulation, because prominent strain differences also were observed after the release of glutamate from Schaffer stimulation. It is also important to note that strain differences may not be evident for electrophysiological measurements (see Fig. 5) or imaging studies that concentrate on somata, rather than on distal dendrites.
Mechanisms of dendritic secondary responses
The ability to evoke secondary responses reproducibly in the Bl/10 strain provided the first opportunity to characterize KA-induced dendritic secondary responses. An immediate question is whether the progression of the secondary Ca2+ response is reversible or whether it reflects irreversible loss of membrane integrity or metabolic competence. Figure 3B argues in favor of reversible modifications, because it illustrates a case in which a region of dendrite was invaded by a secondary response, but after a period of 3–4 min Ca2+ spontaneously recovered to resting levels. Stronger evidence comes from the effects of extracellular Ca2+ removal. After initiation of secondary dendritic responses, we locally and briefly removed extracellular Ca2+ and observed dramatic, transient reductions in cytoplasmic Ca2+ (see Fig. 4). This indicates (1) that influx of extracellular Ca2+ is critical in establishing the secondary response, and (2) that extrusion and/or sequestration mechanisms remain viable for a considerable time after invasion of secondary responses and are able to clear cytoplasmic Ca2+ rapidly, if influx can be prevented. These conclusions are consistent with previous studies of tissue culture and acutely isolated neurons (Randall and Thayer, 1992; Wadman and Connor, 1992) and suggest that selective inhibition of dendritic Ca2+ influx may be an effective strategy to limit excitotoxic cell death.
Sustained Ca2+ elevations could activate a number of critical molecules. Because propagation of the secondary response is reasonably fast (minutes, not hours) and supported by Ca2+ influx, it is probable that existing channels are modified and produce the increased influx. Protein kinase C phosphorylation of calcium-carrying channels that increases open probability at small depolarizations was suggested initially (Connor et al., 1988). A second attractive hypothesis involves the activation of calpain, which has been shown to modify voltage-dependent Ca2+ channels in CA1 neurons, resulting in substantially increased Ca2+ influx (Hell et al., 1996). Calpain has been shown to contribute to KA excitotoxicity in cultured neurons (Brorson et al., 1994, 1995) and may contribute to dendritic remodeling after excitotoxic injury (Faddis et al., 1997). Alternatively, it is possible that the Ca2+-dependent insertion of novel channels into the membrane occurs, given recent findings on the speed of this process (Wan et al., 1997). Finally, the effects of secondary Ca2+ responses on mitochondrial function are unknown, but long-lasting Ca2+elevations should contribute to the dysfunction that is associated with excitotoxic cell death (Stout et al., 1998; Reynolds, 1999).
Footnotes
This work was supported by National Institutes of Health Grant NS 35644.
Correspondence should be addressed to Dr. C. W. R. Shuttleworth, Department of Neurosciences, University of New Mexico School of Medicine, 915 Camino de Salud, NE, Albuquerque, NM 87131. E-mail: bshuttleworth@salud.unm.edu.
REFERENCES
- 1.Andrew RD, MacVicar BA. Imaging cell volume changes and neuronal excitation in the hippocampal slice. Neuroscience. 1994;62:371–383. doi: 10.1016/0306-4522(94)90372-7. [DOI] [PubMed] [Google Scholar]
- 2.Aronowski J, Grotta JC, Waxham MN. Ischemia-induced translocation of Ca2+/calmodulin-dependent protein kinase II: potential role in neuronal damage. J Neurochem. 1992;58:1743–1753. doi: 10.1111/j.1471-4159.1992.tb10049.x. [DOI] [PubMed] [Google Scholar]
- 3.Balchen T, Berg M, Diemer NH. A paradox after systemic kainate injection in rats: lesser damage of hippocampal CA1 neurons after higher doses. Neurosci Lett. 1993;163:151–154. doi: 10.1016/0304-3940(93)90369-v. [DOI] [PubMed] [Google Scholar]
- 4.Ben-Ari Y. Limbic seizure and brain damage produced by kainic acid: mechanisms and relevance to human temporal lobe epilepsy. Neuroscience. 1985;14:375–403. doi: 10.1016/0306-4522(85)90299-4. [DOI] [PubMed] [Google Scholar]
- 5.Brorson JR, Manzolillo PA, Miller RJ. Ca2+ entry via AMPA/KA receptors and excitotoxicity in cultured cerebellar Purkinje cells. J Neurosci. 1994;14:187–197. doi: 10.1523/JNEUROSCI.14-01-00187.1994. [DOI] [PMC free article] [PubMed] [Google Scholar]
- 6.Brorson JR, Marcuccilli CJ, Miller RJ. Delayed antagonism of calpain reduces excitotoxicity in cultured neurons. Stroke. 1995;26:1259–1266. doi: 10.1161/01.str.26.7.1259. [DOI] [PubMed] [Google Scholar]
- 7.Chen QX, Perkins KL, Choi DW, Wong RKS. Secondary activation of a cation conductance is responsible for NMDA toxicity in acutely isolated hippocampal neurons. J Neurosci. 1997;17:4032–4036. doi: 10.1523/JNEUROSCI.17-11-04032.1997. [DOI] [PMC free article] [PubMed] [Google Scholar]
- 8.Choi DW. Calcium: still center-stage in hypoxic–ischemic neuronal death. Trends Neurosci. 1995;18:58–60. [PubMed] [Google Scholar]
- 9.Churn SB, Taft WC, Billingsley MS, Sankaran B, DeLorenzo RJ. Global forebrain ischemia induces a post-translational modification of multifunctional calcium- and calmodulin-dependent kinase II. J Neurochem. 1992;59:1221–1232. doi: 10.1111/j.1471-4159.1992.tb08431.x. [DOI] [PubMed] [Google Scholar]
- 10.Connor JA, Cormier RJ. Cumulative effects of glutamate microstimulation on Ca2+ responses of CA1 hippocampal pyramidal neurons in slice. J Neurophysiol. 2000;83:90–98. doi: 10.1152/jn.2000.83.1.90. [DOI] [PubMed] [Google Scholar]
- 11.Connor JA, Wadman WJ, Hockberger PE, Wong RK. Sustained dendritic gradients of Ca2+ induced by excitatory amino acids in CA1 hippocampal neurons. Science. 1988;240:649–653. doi: 10.1126/science.2452481. [DOI] [PubMed] [Google Scholar]
- 12.Dubinsky JM. Intracellular calcium levels during the period of delayed excitotoxicity. J Neurosci. 1993;13:623–631. doi: 10.1523/JNEUROSCI.13-02-00623.1993. [DOI] [PMC free article] [PubMed] [Google Scholar]
- 13.Egorov AV, Gloveli T, Müller W. Muscarinic control of dendritic excitability and Ca2+ signaling in CA1 pyramidal neurons in rat hippocampal slice. J Neurophysiol. 1999;82:1909–1915. doi: 10.1152/jn.1999.82.4.1909. [DOI] [PubMed] [Google Scholar]
- 14.Faddis BT, Hasbani MJ, Goldberg MP. Calpain activation contributes to dendritic remodeling after brief excitotoxic injury in vitro. J Neurosci. 1997;17:951–959. doi: 10.1523/JNEUROSCI.17-03-00951.1997. [DOI] [PMC free article] [PubMed] [Google Scholar]
- 15.Faherty CJ, Xanthoudakis S, Smeyne RJ. Caspase-3-dependent neuronal death in the hippocampus following kainic acid treatment. Brain Res Mol Brain Res. 1999;70:159–163. doi: 10.1016/s0169-328x(99)00143-6. [DOI] [PubMed] [Google Scholar]
- 16.Grynkiewicz G, Poenie M, Tsien RY. A new generation of Ca2+ indicators with greatly improved fluorescence properties. J Biol Chem. 1985;260:3440–3450. [PubMed] [Google Scholar]
- 17.Hell JW, Westenbroek RE, Breeze LJ, Wang KK, Chavkin C, Catterall WA. N-methyl-d-aspartate receptor-induced proteolytic conversion of postsynaptic class C L-type calcium channels in hippocampal neurons. Proc Natl Acad Sci USA. 1996;93:3362–3367. doi: 10.1073/pnas.93.8.3362. [DOI] [PMC free article] [PubMed] [Google Scholar]
- 18.Helmchen F, Svoboda K, Denk W, Tank DW. In vivo dendritic calcium dynamics in deep-layer cortical pyramidal neurons. Nat Neurosci. 1999;2:989–996. doi: 10.1038/14788. [DOI] [PubMed] [Google Scholar]
- 19.Hyrc K, Handran SD, Rothman SM, Goldberg MP. Ionized intracellular calcium concentration predicts excitotoxic neuronal death: observations with low-affinity fluorescent calcium indicators. J Neurosci. 1997;17:6669–6677. doi: 10.1523/JNEUROSCI.17-17-06669.1997. [DOI] [PMC free article] [PubMed] [Google Scholar]
- 20.Lipton P. Ischemic cell death in brain neurons [review]. Physiol Rev. 1999;79:1431–1568. doi: 10.1152/physrev.1999.79.4.1431. [DOI] [PubMed] [Google Scholar]
- 21.MacDermott AB, Mayer ML, Westbrook GL, Smith SJ, Barker JL. NMDA-receptor activation increases cytoplasmic calcium concentration in cultured spinal cord neurones. Nature. 1986;321:519–522. doi: 10.1038/321519a0. [DOI] [PubMed] [Google Scholar]
- 22.Mayer ML, Westbrook GL, Guthrie PB. Voltage-dependent block by Mg2+ of NMDA responses in spinal cord neurones. Nature. 1984;309:261–263. doi: 10.1038/309261a0. [DOI] [PubMed] [Google Scholar]
- 23.Müller W, Connor JA. Cholinergic input uncouples Ca2+ changes from K+ conductance activation and amplifies intradendritic Ca2+ changes in hippocampal neurons. Neuron. 1991;6:901–905. doi: 10.1016/0896-6273(91)90230-w. [DOI] [PubMed] [Google Scholar]
- 24.Murray B, Alessandrini A, Cole AJ, Yee AG, Furshpan EJ. Inhibition of the p44/42 MAP kinase pathway protects hippocampal neurons in a cell-culture model of seizure activity. Proc Natl Acad Sci USA. 1998;95:11975–11980. doi: 10.1073/pnas.95.20.11975. [DOI] [PMC free article] [PubMed] [Google Scholar]
- 25.Petrozzino JJ, Pozzo Miller LD, Connor JA. Micromolar Ca2+ transients in dendritic spines of hippocampal pyramidal neurons in brain slice. Neuron. 1995;14:1223–1231. doi: 10.1016/0896-6273(95)90269-4. [DOI] [PubMed] [Google Scholar]
- 26.Picone CM, Grotta JC, Earls R, Strong R, Dedman J. Immunohistochemical determination of calcium-calmodulin binding predicts neuronal damage after global ischemia. J Cereb Blood Flow Metab. 1989;9:805–811. doi: 10.1038/jcbfm.1989.114. [DOI] [PubMed] [Google Scholar]
- 27.Randall RD, Thayer SA. Glutamate-induced calcium transient triggers delayed calcium overload and neurotoxicity in rat hippocampal neurons. J Neurosci. 1992;12:1882–1895. doi: 10.1523/JNEUROSCI.12-05-01882.1992. [DOI] [PMC free article] [PubMed] [Google Scholar]
- 28.Rao A, Luo C, Hogan PG. Transcription factors of the NFAT family: regulation and function. Annu Rev Immunol. 1997;15:707–747. doi: 10.1146/annurev.immunol.15.1.707. [DOI] [PubMed] [Google Scholar]
- 29.Reynolds IJ. Mitochondrial membrane potential and the permeability transition in excitotoxicity. Ann NY Acad Sci. 1999;893:33–41. doi: 10.1111/j.1749-6632.1999.tb07816.x. [DOI] [PubMed] [Google Scholar]
- 30.Rothman SM, Olney JW. Glutamate and the pathophysiology of hypoxic–ischemic brain damage. Ann Neurol. 1986;19:105–111. doi: 10.1002/ana.410190202. [DOI] [PubMed] [Google Scholar]
- 31.Schauwecker PE, Steward O. Genetic determinants of susceptibility to excitotoxic cell death: implications for gene targeting approaches. Proc Natl Acad Sci USA. 1997;94:4103–4108. doi: 10.1073/pnas.94.8.4103. [DOI] [PMC free article] [PubMed] [Google Scholar]
- 32.Steward O, Schauwecker PE, Guth L, Zhang Z, Fujiki M, Inman D, Wrathall J, Kempermann G, Gage FH, Saatman KE, Raghupathi R, McIntosh T. Genetic approaches to neurotrauma research: opportunities and potential pitfalls of murine models. Exp Neurol. 1999;157:19–42. doi: 10.1006/exnr.1999.7040. [DOI] [PubMed] [Google Scholar]
- 33.Stout AK, Raphael HM, Kanterewicz BI, Klann E, Reynolds IJ. Glutamate-induced neuron death requires mitochondrial calcium uptake. Nat Neurosci. 1998;1:366–373. doi: 10.1038/1577. [DOI] [PubMed] [Google Scholar]
- 34.Threadgill DW, Yee D, Matin A, Nadeau JH, Magnuson T. Genealogy of the 129 inbred strains: 129/SvJ is a contaminated inbred strain. Mamm Genome. 1997;8:390–393. doi: 10.1007/s003359900453. [DOI] [PubMed] [Google Scholar]
- 35.Wadman WJ, Connor JA. Persisting modification of dendritic calcium influx by excitatory amino acid stimulation in isolated CA1 neurons. Neuroscience. 1992;48:293–305. doi: 10.1016/0306-4522(92)90491-j. [DOI] [PubMed] [Google Scholar]
- 36.Wan Q, Xiong ZG, Man HY, Ackerley CA, Braunton J, Lu WY, Becker LE, MacDonald JF, Wang YT. Recruitment of functional GABAA receptors to postsynaptic domains by insulin. Nature. 1997;388:686–690. doi: 10.1038/41792. [DOI] [PubMed] [Google Scholar]
- 37.Wang HG, Pathan N, Ethell IM, Krajewski S, Yamaguchi Y, Shibasaki F, McKeon F, Bobo T, Franke TF, Reed JC. Ca2+-induced apoptosis through calcineurin dephosphorylation of BAD. Science. 1999;284:339–343. doi: 10.1126/science.284.5412.339. [DOI] [PubMed] [Google Scholar]
- 38.Weiss S, Hochman D, MacVicar BA. Repeated NMDA receptor activation induces distinct intracellular calcium changes in subpopulations of striatal neurons in vitro. Brain Res. 1993;627:63–71. doi: 10.1016/0006-8993(93)90749-d. [DOI] [PubMed] [Google Scholar]
- 39.Yuste R, Majewska A, Cash SS, Denk W. Mechanisms of calcium influx into hippocampal spines: heterogeneity among spines, coincidence detection by NMDA receptors, and optical quantal analysis. J Neurosci. 1999;19:1976–1987. doi: 10.1523/JNEUROSCI.19-06-01976.1999. [DOI] [PMC free article] [PubMed] [Google Scholar]