Abstract
Nucleus accumbens neurons show membrane potential fluctuations between a very negative resting membrane potential and periodical plateau depolarizations. Because action potential firing occurs only during the depolarized state, the control of transitions between states is important for information processing within this region, with an impact on accumbens-related behaviors. It has been proposed that ensembles of active neurons in the nucleus accumbens could be based on a population of cells depolarizing simultaneously into the UP state. In this study, in vivo intracellular recordings from accumbens neurons were performed simultaneously with local field potential recordings to examine whether the nucleus accumbens can exhibit synchronization of membrane potential states in a population of neurons. These simultaneous recordings indicated that local field potential shifts occurred synchronously with transitions to the UP state. Furthermore, manipulations that evoked prolonged plateau depolarizations also evoked field potentials of similar duration. Such signals likely occurred because of simultaneous membrane potential changes in a population of neurons. Together with our previous studies, these results suggest that membrane potential states in the nucleus accumbens can be synchronized by synaptic inputs from the hippocampus.
Keywords: nucleus accumbens, membrane potential, dopamine, ensemble, in vivo intracellular recording, field potentials
The nucleus accumbens (NAcc), also known as the ventral striatum, participates in high-order brain functions, including reward, motivation, learning, and memory (Apicella et al., 1991; Kelley, 1999). A dysfunction of this region may be involved in conditions such as schizophrenia (O'Donnell and Grace, 1998) and drug addiction (Koob and Bloom, 1988). Medium-sized, densely spinous neurons are the projection neurons within the NAcc and comprise >90% of its population (Chang and Kitai, 1985). These neurons show robust membrane potential shifts between a negative DOWN state and a depolarized UP state (O'Donnell and Grace, 1995). Similar membrane potential fluctuations have also been observed in dorsal striatal (Wilson, 1993) and cortical (Steriade et al., 1993a; Lampl et al., 1999; Lewis and O'Donnell, 2000) neurons. It has been reported recently that such membrane potential shifts in complex cells of the primary visual cortex can be affected by presentation of visual stimuli (Anderson et al., 2000), suggesting that membrane fluctuations in these neurons may be related to sensory processing. The physiological role of those membrane potential oscillations in other regions, including the NAcc, is not yet understood.
Unveiling information-processing mechanisms in the NAcc has been a goal in many laboratories over recent years. Whereas traditional electrophysiological studies have focused on individual cell firing, increasing attention is being given to the activity of neural ensembles (O'Donnell, 1999). Neuronal ensembles can be readily detected in behaving animals with chronically implanted multiple extracellular electrodes (Deadwyler et al., 1996; Riehle et al., 1997; Jog et al., 1999). Recent studies have shown that UP–DOWN state transitions in striatal medium spiny neurons are correlated with frontal cortical EEGs (Mahon et al., 2001) and that transitions to the UP state in NAcc neurons are correlated with population activity in the ventral hippocampus (Goto and O'Donnell, 2001). These results suggest that coherent synaptic inputs can produce synchronous membrane potential fluctuations, defining active neural ensembles. In the NAcc, such inputs are primarily originated in the hippocampus. Furthermore, synchronous membrane potential oscillations have been reported between pairs of dorsal striatal neurons (Stern et al., 1998), suggesting that a large number of these neurons can go into the UP state simultaneously. If a population of neurons depolarizes synchronously by 10–20 mV, a substantial field potential would be produced. In this study, we took advantage of detecting population activity with local field potentials and combined these recordings with simultaneous intracellular recordings from NAcc neurons in vivo to determine the presence of neural network activity arising from ensembles of depolarized neurons.
MATERIALS AND METHODS
Animals. Simultaneous in vivointracellular and local field potential recordings were performed in 55 rats. Sprague Dawley male adult rats (230–450 gm) were obtained from Taconic Farms (Germantown, NY). All experimental procedures were performed according to the United States Public Health ServiceGuide for the Care and Use of Laboratory Animals and approved by the Albany Medical College Institutional Animal Care and Use Committee. Rats were anesthetized with chloral hydrate (400 mg/kg, i.p.) and placed on a stereotaxic apparatus (David Kopf Instruments, Tujunga, CA). Temperature was monitored with a rectal temperature probe (Fine Science Tools, Foster City, CA) and maintained between 36 and 38°C. Supplemental anesthesia (chloral hydrate, 24–30 mg/hr) was continuously delivered during the recording session via a cannula inserted intraperitoneally and a minipump (Bioanalytical Systems, West Lafayette, IN). Bupivacaine (0.25%) was applied subcutaneously before any skin incision was made. Burr holes were drilled into the skull for electrode placement.
Recordings. Intracellular and extracellular electrodes were made from 1 mm outer diameter Omegadot borosilicate glass tubing (World Precision Instruments, Sarasota, FL) pulled with a P-97 Flaming-Brown puller (Sutter Instrument Company, Novato, CA). Intracellular electrodes were filled with 2 mpotassium acetate and 2% neurobiotin and had a resistance of 31–103 MΩ. Extracellular electrodes were filled with 2m NaCl and 2% pontamine sky blue and had an impedance of 3–8 MΩ. Intracellular electrodes were lowered into the NAcc [anteroposterior (AP): bregma, +1.4 to +2.1 mm; lateral, 1.0–2.0 mm; vertical, −5.8 to −8.4 mm], and extracellular electrodes were also lowered in the vicinity using a second electrode holder angled 30° from the vertical (AP: bregma, +1.5 mm; lateral, 1.5 mm; vertical, −7.0 mm). Both recording electrodes were advanced by hydraulic manipulators (Trent Wells, Coulterville, CA; David Kopf Instruments); at the same time, their activity was monitored on a Philips PM3337 oscilloscope (Fluke, Everett, WA). Intracellular signals were amplified using an IR-283 Neurodata amplifier (Cygnus Technology, Delaware Water Gap, PA) and filtered at 0.3–3 kHz with an eight-pole Bessel filter (FLA-01; Cygnus). Extracellular signals were amplified 10,000 times with an AC amplifier (Warner Instrument Corporation, Hamden, CT) and passed through a Humbug noise eliminator. Both intracellular and extracellular signals were digitized with an interface board (DAP3215a; Microstar Labs, Bellevue, WA) at 10 kHz and fed to a computer (Gateway PII 266; Gateway, North Sioux City, SD) for off-line analyses. Once a stable impalement was obtained with the intracellular electrode, simultaneous intracellular and extracellular baseline recordings were performed. Only neurons showing at least −50 mV resting membrane potential and overshooting action potentials were analyzed and included in the study. All data handling was performed using custom-made software (Neuroscope).
Electrical stimulation. Concentric bipolar electrodes with 0.5 mm between tips (NE-100X; Rhodes Instruments) were used for electrical stimulation. The electrodes were placed in the ventral tegmental area (VTA) (AP: bregma, −5.8 mm; lateral, 0.5 mm; vertical, −8.4 mm). Current pulses were generated by stimulus isolation units driven by a Master 8 Stimulator (AMPI, Jerusalem, Israel). Stimulation protocols were controlled by the computer using Neuroscope. Electrical stimulation was performed by delivering five 0.1–0.5 mA current pulses (0.1 msec each) at 20 Hz every 10 sec, to mimic dopamine (DA) cell burst firing.
Drug administration. The D1 antagonist SCH23390 and D2 antagonist sulpiride were purchased from Sigma (St. Louis, MO). SCH23390 was dissolved in distilled water to a final concentration of 0.25 mg/ml. Sulpiride was first dissolved in a drop of NaOH and then diluted in distilled water to final concentration of 20 mg/ml. pH was adjusted just before administration. All drugs were administered intraperitoneally.
Histology. After completion of the experiments, recording sites were marked by ejection of pontamine sky blue from extracellular electrodes and neurobiotin from intracellular electrodes by passing positive current (1.0 nA, 200 msec pulses at 2 Hz) for at least 5 min. Animals were given a lethal dose of pentobarbital (100 mg/kg) and transcardially perfused with ice-cold saline followed by 4% paraformaldehyde. Brains were removed from the skull, cryoprotected in 30% sucrose, and sectioned using a freezing microtome. Serial 50-μm-thick sections were cut coronally. Neurobiotin-injected sections were further incubated in 0.4% Triton X-100 (Sigma) in PBS for 1–2 hr, followed by 2 hr in Vectastain Elite avidin–biotin complex reagent (Vector Laboratories, Burlingame, CA). After a series of rinses, sections were reacted with 3,3′-diaminobenzidine (DAB) and urea–hydrogen peroxide (Sigma Fast DAB set). All sections were mounted on gelatin-coated slides, air-dried for 24 hr, cleared in xylene, coverslipped in Permount, and examined on an Olympus Optical (Tokyo, Japan) CH30 microscope. The locations of intracellularly and extracellularly recorded neurons were identified according to the atlas of Paxinos and Watson (1998).
Data analysis: Gaussian fit for membrane potential distribution. Membrane potential distribution was calculated by determining membrane potential values every 0.1 msec in 20 sec epochs of recording. Two-peak Gaussian fit analyses were performed using the following equation:
where A1 andA2 are total areas under the curve from baseline,X−1 andX−2 are the peaks of the histograms, and W1 andW2 are two SDs (W1 = 2ς1; W2 = 2ς2).
Cross-correlation. Cross-correlation analyses were performed to explore the correlation between transitions to the UP state and local field potential shifts. First, cross-correlograms were constructed using onset time points of UP membrane potential states and negative shifts of local field potentials. Calculation and construction of the histogram were based on the methods described by Perkel et al. (1967). Bin width was 100 msec. A Poisson distribution was assumed for the correlograms, and the correlation peaks were judged significant if they were three SDs (p < 0.013) above baseline. The strength of each pair of correlations (Sccr) was defined as:
where Nc is the number of coincident events between membrane potential and local field potential shifts occurring within 100 msec as measured by the peak cross-correlogram, Nb is the chance level of coincident events given by the shuffled random cross-correlogram, and Nmp andNlfp are the total number of events in membrane potential and local field potential shifts, respectively.
In addition, spectral analyses were performed in both recordings using a fast Fourier transform routine with Statistica software (Statistica, Tulsa, OK). Cross-spectral density was also calculated using Statistica. Coherence between similar-frequency peaks in the individual spectra was calculated by standardizing the cross-amplitude values. Cross-spectral densities were squared and divided by the product of spectral densities of each recording. The result was interpreted as a squared correlation coefficient (r2) for statistical purposes. High coherence values (>0.75) were taken as indicators of oscillatory activity at that particular frequency being synchronized.
RESULTS
Intracellular recordings from NAcc medium spiny neurons
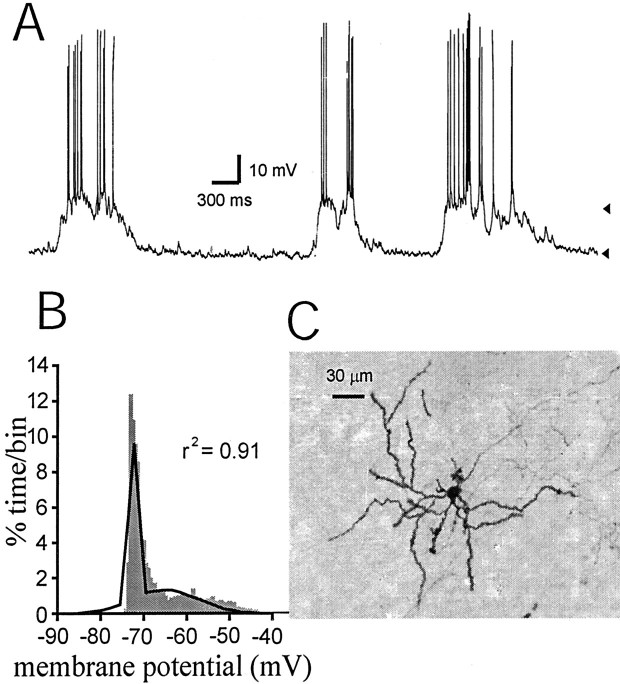
In vivo intracellular recordings were performed from 62 neurons in the core (n = 55) and shell (n = 7) regions of the NAcc. Fifty-four of 62 cells (87%) showed UP and DOWN membrane potential states (Fig.1A). These were determined when a histogram of time spent at different membrane potential values revealed a bimodal distribution that could be fitted with high confidence to a dual Gaussian function (Fig.1B). The DOWN and UP membrane potential states were −76.8 ± 9.1 mV (mean ± SD) and −64.2 ± 9.3 mV, respectively. Onset time points of UP events were determined when the membrane potential crossed the trough in the membrane potential distribution histogram (e.g., −64 mV in Fig. 1B) for at least 100 msec. The frequency of transitions to the UP state was 0.64 ± 0.30 Hz. Neurobiotin staining revealed that these were medium spiny neurons (Fig. 1C).
Fig. 1.
Nucleus accumbens medium spiny neurons exhibit a membrane potential with UP and DOWN states. A, A representative trace of a neuron with alternating DOWN (−72 mV;bottom arrowhead) and UP (−59 mV; top arrowhead) membrane potential states. B, Membrane potential distribution of the trace shown in Areveals two peaks that correspond to the UP and DOWN states. This histogram fits to a two-peak Gaussian distribution (black line; r2 = 0.91).C, Neurobiotin staining revealed morphology typical of medium spiny neurons.
The membrane properties of some neurons exhibiting a bistable membrane potential were also investigated by intracellular current injection (n = 27). The input resistance of these neurons was 46.2 ± 18.5 MΩ, measured from the DOWN state. Most cells (n = 20) showed an inward rectification with depolarizing current injections, similar to what had been reported in NAcc core, but not shell, medium spiny neurons (O'Donnell and Grace, 1993). The time constant was 5.4 ± 1.7 msec, measured as the time required to reach 63% of the maximal hyperpolarization in response to a negative current pulse. These values were within the range reported previously.
Simultaneous local field potentials and intracellular recordings in the NAcc in vivo
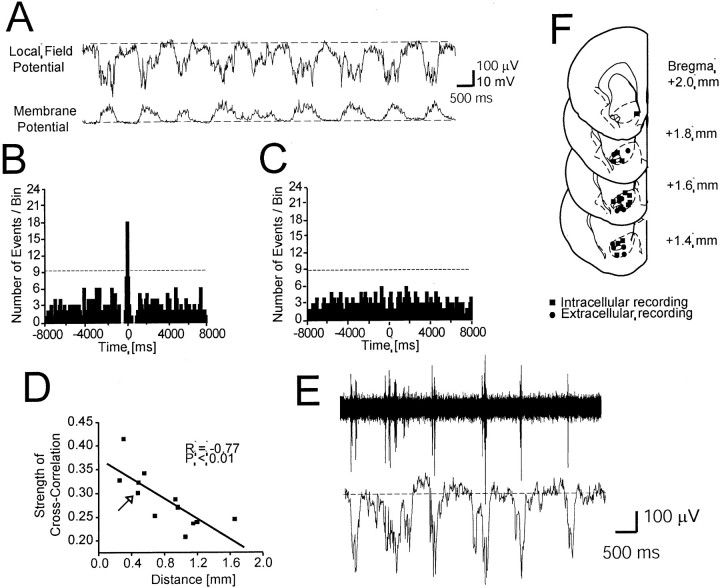
Simultaneous intracellular and local field potential recordings were acquired from 12 pairs. In all cases, local field potentials exhibited large periodical negative shifts (Fig.2A) similar to what has been reported previously (Leung and Yim, 1993). The frequency of these events was 0.50 ± 0.19 Hz, which is similar to that of intracellular membrane potential state transitions.
Fig. 2.
Membrane potential transitions are correlated with local field potentials in the NAcc.A, Example of a local field potential recording showing negative shifts (top trace, dashed lineindicates 0 V) simultaneously with UP state transitions in the NAcc neurons (bottom trace, dashed lineindicates the DOWN state, −78 mV). High-frequency components including spike firing were removed from both traces by low-pass filtering (<50 Hz). B, Cross-correlogram from the pair illustrated inA (bin width = 100 msec) showing a peak at time 0 bin. The dashed line indicates 3 SDs above the mean.C, A control cross-correlogram was made using shuffled periods of intracellular and local field potential recordings.D, Linear regression analysis between the distances separating intracellular from extracellular recording electrodes and strength of cross-correlation showing decreasingSccr with increasing distances. Thearrow indicates the case shown in A.E, Multiunit recordings showing spike firing occurring during negative shifts of local field potential. Both traces are the same data sample; the top trace was high-pass filtered (>50 Hz) to reveal spike firing, whereas the bottom trace was low-pass filtered (<50 Hz) to show slow negative local field potential shifts. F, Locations of intracellular and local field potential recording sites. All intracellular recordings were obtained from the core region except one that was located in the shell. All local field potential recordings were performed in the core region.
Cross-correlograms were created to ascertain the correlation between onset times of transitions to the UP state and local field potential negative shifts (Fig. 2B). Statistically significant peaks (three SDs above baseline; p < 0.013; normal distribution was assumed for the histograms) were detected at time 0 with a bin width of 100 msec in every pair, indicating that the potential shifts of these two parameters occurred within <100 msec. Cross-correlograms between shuffled time epochs did not result in such peaks (Fig. 2C), ruling out artifactual components in the histogram peaks.
The cross-correlation strength (Sccr) was calculated using the equation indicated in Materials and Methods, based on the ratio of the number of coincident events to the total number of events. The average strength from 12 pairs was 0.29 ± 0.06, whereas a shuffledSccr was only 0.05 ± 0.02 (p < 1.0 × 10⁻¹¹; paired t test;n = 12). Linear regression analyses revealed a significant negative correlation (r = −0.77;p < 0.01) betweenSccr and the distance between intracellular and extracellular electrodes (Fig. 2D). Nonetheless, even in the pair with the longest interelectrode distance (i.e., 1.7 mm), the cross-correlation strength was still very high (Sccr = 0.25). In some cases, multiunit activity was simultaneously collected with the local field potential (n = 3). In all cases, spikes were observed only during the negative local field potential shifts (Fig.2E), supporting the idea that these events were a reflection of UP membrane potential transitions.
Power spectral density analyses were performed for every pair of recordings. In all cases, the highest density peaks were observed at ∼1 Hz, corresponding to the frequencies of UP membrane transitions and negative shifts of local field potential (Fig.3A,B). The synchrony between the pairs of recordings was then analyzed by coherence analyses from power density spectra, which are the frequency domain of correlation analysis. Cross-spectral density analysis revealed a significant peak at the same frequency as the individual spectra (Fig. 3C). Normalizing the cross-spectral density to individual signal densities revealed a coherence close to 1.0 at the frequency showing the highest peaks of power spectra, suggesting that correlation between every pair was very high at that frequency (r2 = 0.97 ± 0.12).
Fig. 3.
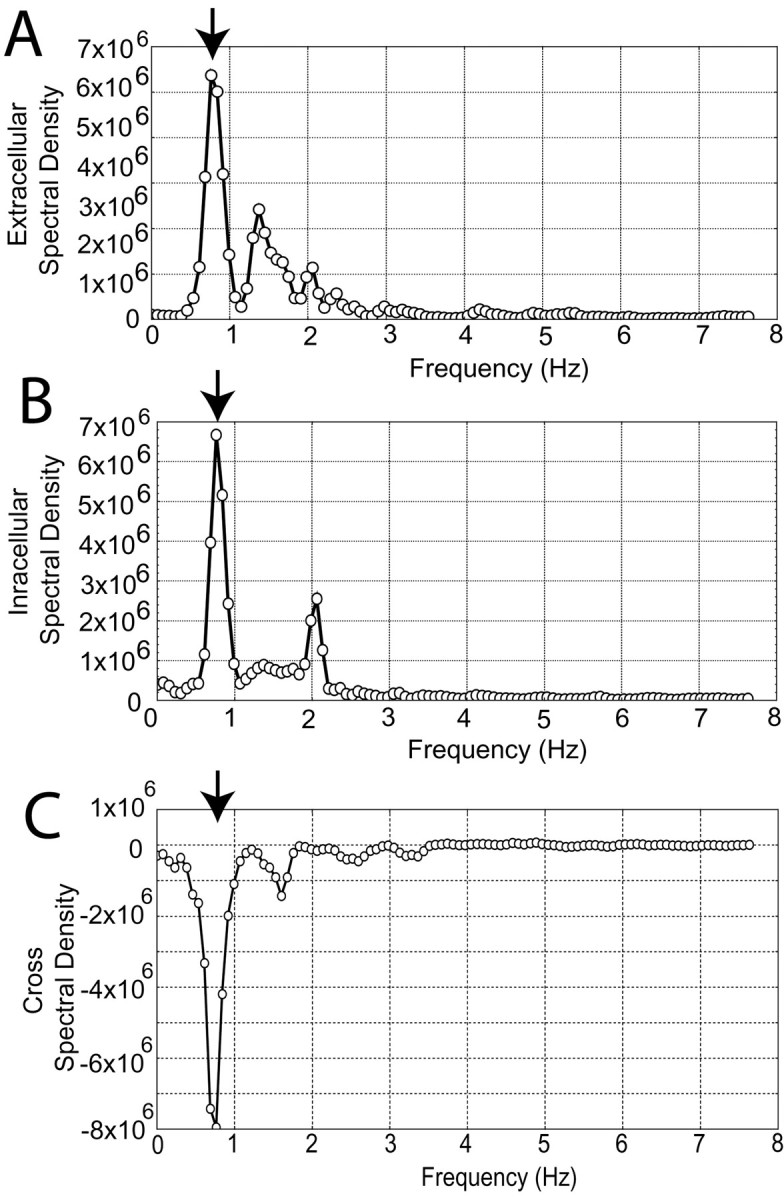
Spectral density coherency analyses reveal high synchrony between intracellular recordings and local field potential fluctuations. A, Spectral density of the extracellular recording shown in Figure 2A. Thearrow indicates the peak that corresponds to the frequency of local field potential shifts (0.76 Hz). B, Spectral density of an intracellular recording obtained simultaneously. A peak (arrow) is observed at the same frequency as inA. C, Cross-spectral density revealed a peak (arrow) at the same frequency as inA and B. Zero is the value expected for nonsynchronous components. The near 1 Hz peak has a negative value in this case, resulting from the 180° off-phase of both waveforms. (The intracellular signal depolarizes as the field potential turns more negative.) All graphs plot microvolts per square second over Hz.
Fimbria–fornix transection abolished negative shifts in the NAcc local field potential
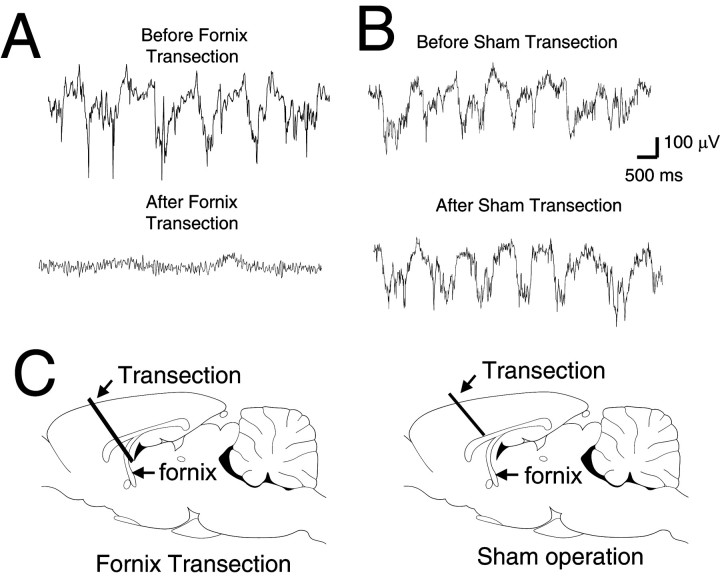
We had reported previously that a fornix transection eliminates UP membrane potential states in NAcc neurons (O'Donnell and Grace, 1995). To further explore the possibility that negative local field potential shifts reflect transitions to the UP state in NAcc neurons, local field potentials were also recorded before and after the fornix was cut with a glass microknife (n = 4). This procedure eliminated periodical negative shifts in NAcc local field potentials (Fig.4A). In one case, a small regular oscillation with a range of ∼5 Hz appeared after the transection (data not shown), corresponding to theta frequency. A sham operation (n = 5) did not affect local field potentials (Fig. 4B,C).
Fig. 4.
A fornix transection eliminated local field potentials in the NAcc. A, Traces of local field potential before (top) and after (bottom) fornix transection. B, Traces of local field potential before (top) and after (bottom) a transection that spared the fornix. C, Schematic description of fornix and sham transections. In the sham operation, the transection was stopped before the knife reached the fornix.
Responses to ventral tegmental area stimulation
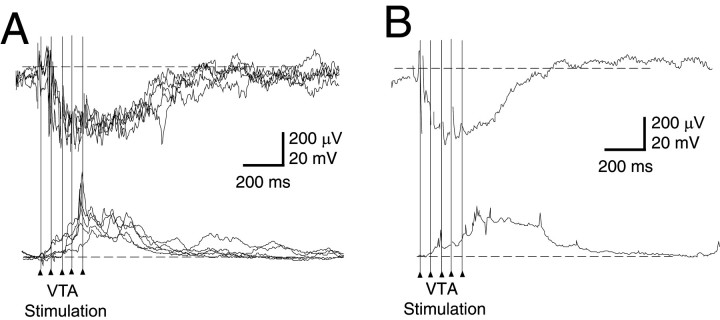
Activation of the VTA, the source of DA projections to the NAcc and prefrontal cortex (PFC) (Thierry et al., 1973; Voorn et al., 1986), has been shown to evoke a prolonged transition to the UP state in PFC pyramidal neurons (Lewis and O'Donnell, 2000). To explore whether a similar response occurs in the NAcc and whether it could be reflected as prolonged negative local field potential, simultaneous intracellular and extracellular recordings were performed in the NAcc while electrically stimulating the VTA. Trains of five 0.1 mA pulses at 20 Hz, mimicking DA neuron burst firing, evoked simultaneous membrane and local field potential transitions (Fig.5A,B). The duration of responses (measured as the decay to half the amplitude of the maximal response) was 499 ± 249 msec (268–1090 msec; n = 10) in the intracellular recordings and 453 ± 217 msec (237–955 msec; n = 10) in the local field potential.
Fig. 5.
Simultaneous intracellular and extracellular responses to VTA stimulation recorded in the NAcc.A, Typical example of simultaneously recorded traces. Trains of five pulses delivered to the VTA appear as sets of vertical lines. Top, Overlay of five local field potentials showing negative shifts in response to VTA stimulation.Bottom, Overlay of five intracellular recordings simultaneously recorded with local field potentials shown in top traces. B, Averaged signals from 15 responses to VTA stimulation. Evoked field potential negative shifts (top) were observed simultaneously with membrane potential depolarizations (bottom).
Potential shifts evoked by VTA stimulation in the NAcc depend on activation of both D1 and D2 receptors
Electrical VTA stimulation can activate both DA and non-DA projections to the NAcc. To elucidate whether the responses observed were dependent on DA and the receptor subtypes involved, some VTA stimulation experiments were repeated in the presence of selective D1 and D2 antagonists. Administration of either the D1 antagonist SCH23390 (0.5 mg/kg, i.p.) or the D2 antagonist sulpiride (40 mg/kg, i.p.) failed to affect the duration and amplitude of both membrane potential and local field potential responses (Fig.6, Table1). However, combined administration of D1 and D2 antagonists reduced the duration of VTA-evoked states (repeated-measures ANOVA;F(3,23) = 4.29; p < 0.05) (post hoc Tukey test; p < 0.05). Local field potential shifts were reduced when the D1 and D2 antagonists were combined, although this reduction was not statistically significant (F(3,35) = 2.82; p = 0.053) (Fig. 5, Table 1). The amplitude of extracellular responses was reduced with combined administration of SCH23390 and sulpiride (F(3,35) = 6.54; p < 0.005) (post hoc Tukey test; p < 0.005). Spontaneous membrane potential transitions and local field potential shifts were not altered by either antagonist (data not shown).
Fig. 6.
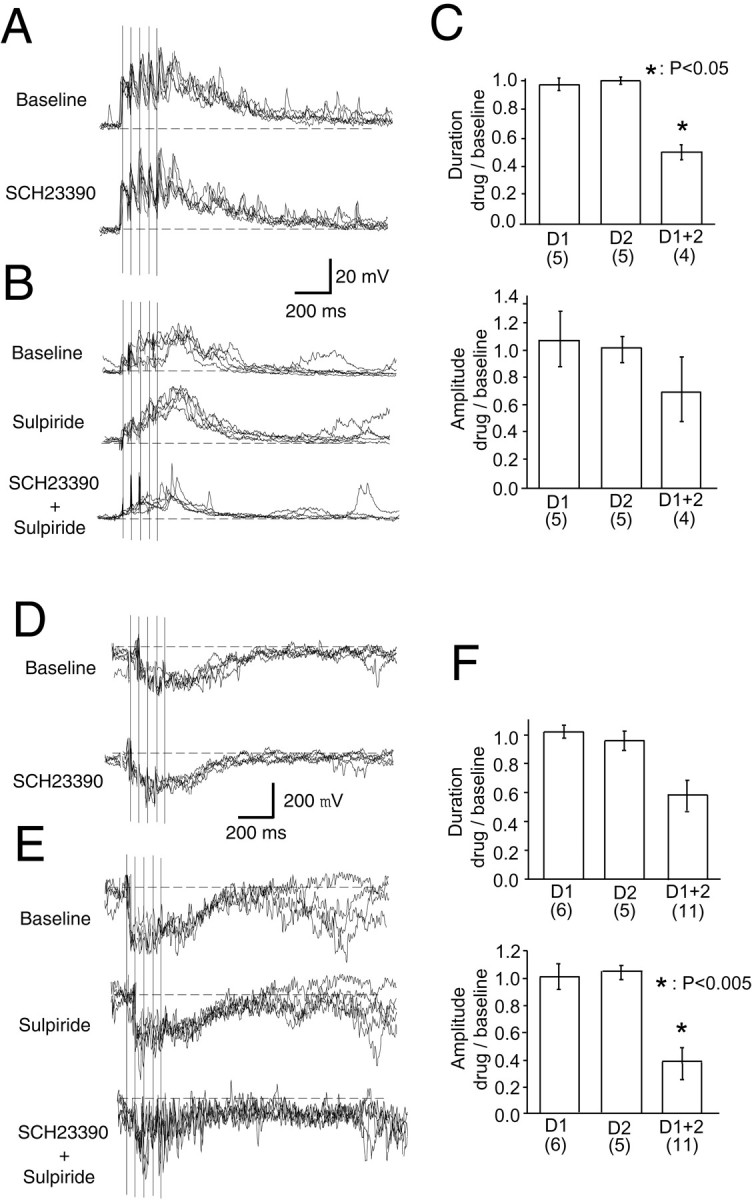
Dopamine antagonists altered responses to VTA stimulation. A, Traces showing a prolonged depolarization resembling the UP state in response to VTA stimulation (vertical lines) before (top) and after (bottom) applying the dopamine D1 antagonist SCH23390 (0.5 mg/kg). Both traces are overlays of five responses.B, Traces from another cell showing a similar response in control conditions (top), with the D2antagonist sulpiride (40 mg/kg) (middle), and with the D1 and D2 antagonists combined (bottom). C, Bar graphs showing the duration and amplitude of VTA-evoked depolarization obtained in the presence of these drugs as a proportion of the baseline responses. A combined administration of D1 and D2antagonists reduced the duration of VTA-evoked responses.Numbers in parentheses indicate the number of samples. D, Negative field potential shifts evoked by VTA stimulation in control conditions (top) and in the presence of SCH23390 (bottom). Traces are overlays of five responses. E, Similar response before (top) and after drug administration (middle, with sulpiride; bottom, with a combination of SCH23390 and sulpiride). Again, traces are overlays of five responses. F, Bar graphs summarizing changes in the duration and amplitude of VTA-evoked events with dopamine antagonist treatment. As with intracellular recordings, a combined administration of D1 and D2 antagonists reduced the duration of local field potential responses.
Table 1.
NAcc membrane and local field potential responses to VTA stimulation with dopamine antagonists
| NAcc membrane potential shifts | NAcc local field potential shifts | |
|---|---|---|
| VTA stimulation: Before drug | (n = 13) | (n = 17) |
| Duration (msec) | 462 ± 146 (283:740) | 475 ± 210 (297:1173) |
| Amplitude (mV, μV) | 15.6 ± 6.4 (8.0:27.2) | 224 ± 96.8 (86.7:420) |
| VTA stimulation: SCH23390 | (n = 5) | (n = 6) |
| Duration (msec) | 508 ± 161 (N.S.) (361:746) | 506 ± 316 (N.S.) (285:1136) |
| Amplitude (mV, μV) | 15.8 ± 5.4 (N.S.) (11.3:23.3) | 147 ± 35.3 (N.S.) (98.3:193) |
| VTA stimulation: Sulpiride | (n = 5) | (n = 5) |
| Duration (msec) | 440 ± 76.0 (N.S.) (377:550) | 377 ± 75.4 (N.S.) (290:453) |
| Amplitude (mV, μV) | 15.2 ± 5.1 (N.S.) (10.7:24.0) | 231 ± 54.5 (N.S.) (150:293) |
| VTA stimulation: SCH23390 plus sulpiride | (n = 4) | (n = 11) |
| Duration (msec) | 222 ± 30.4 (p < 0.05) (193:260) | 278 ± 106 (p = 0.062) (83.3:397) |
| Amplitude (mV, μV) | 10.1 ± 2.1 (N.S.) (7.8:12.5) | 112 ± 40.2 (p < 0.005) (67.7:213) |
Duration, Time required to reach half of maximum amplitude.
Mean ± SD, range (minimum:maximum). Repeated-measures ANOVA withpost hoc Tukey test; N.S., Statistically not significant.
DISCUSSION
Our data indicate that transitions to the UP membrane potential state in NAcc neurons occur simultaneously with negative shifts in local field potentials detected with extracellular electrodes located up to 2 mm apart from the intracellular electrode. Furthermore, manipulations that altered membrane potential state transitions also changed local field potentials. A fornix transection had been reported to eliminate UP states in NAcc neurons recorded intracellularly (O'Donnell and Grace, 1995). In this study, a similar lesion also eliminated negative shifts of local field potentials in the NAcc. VTA stimulation evoked prolonged UP states as well as prolonged negative shifts in local field potentials. These results support the possibility that periodic local field potential shifts in the NAcc are a reflection of a population of neurons in the vicinity of the recording electrodes entering into the UP state simultaneously. This suggests that the NAcc has a network in which neural ensembles are based on the membrane potential state of their neurons.
Synchronous membrane potential fluctuations in NAcc neurons observed as local field potentials may be produced by population activities in the ventral hippocampus (Goto and O'Donnell, 2001). Because the recordings were performed using electrodes located up to 1.7 mm apart, it is unlikely that the neuronal activity synchrony detected is elicited by a single common input. Rather, the synchrony of UP–DOWN transitions in a NAcc network may be reflection of synchronous activity in a distributed assembly of hippocampal neurons.
DA may exert different modulations of membrane potential states in NAcc and PFC neurons. In PFC pyramidal neurons, the prolonged UP state transition evoked by VTA stimulation was shortened by administration of a D1 antagonist (Lewis and O'Donnell, 2000). In that study, a similar UP state transition in PFC neurons was evoked by intra-VTA NMDA administration, indicating that cell depolarization by VTA stimulation does not involve antidromic activation of PFC fibers. Here we have shown that the duration of VTA-evoked UP states and field potential shifts in the NAcc was reduced by a combined administration of D1 and D2 antagonists.In vitro studies have indicated that NAcc neurons depolarize in the presence of combined D1 and D2 receptor activation (O'Donnell and Grace, 1996). A synergistic D1–D2enhancement of glutamatergic excitatory synaptic responses has also been observed in the striatum in vivo (Hu and White, 1997). These results suggest that whereas DA may modulate UP events in the PFC via D1 receptors, in the NAcc, a similar effect of DA requires coactivation of D1 and D2 receptors.
The periodicity and synchrony of membrane potential state transitions raise the question of whether these phenomena are derived from the use of anesthetized animals. Our data indicate that membrane potential transitions occur in the presence of chloral hydrate; however, a number of studies have reported similar membrane potential oscillations in the striatum with a variety of anesthetic agents (Wilson, 1993; Stern et al., 1998; Mahon et al., 2001). On the other hand, some pieces of evidence argue against these fluctuations being anesthesia-induced or sleep-related. First, similar membrane potential oscillations had been also observed in dorsal striatal neurons of locally anesthetized awake rats (Wilson and Groves, 1981). Second, step-like membrane potential shifts in visual cortical neurons can be modified by presentation of visual stimuli (Douglas et al., 1991; Anderson et al., 2000), indicating that they participate in encoding sensory information in these neurons. In addition, although large local field potential shifts typically appear during slow-wave sleep, they have also been observed in animals in a quiet, yet awake, state in the NAcc (Leung and Yim, 1993) and hippocampus (Chrobak and Buzsáki, 1994). According to our results, such field potential shifts are a reflection of UP–DOWN membrane potential state transitions of neurons in these regions. Although speculative, it is conceivable that relatively periodical (<1 Hz) UP and DOWN membrane potential fluctuations are a characteristic of an idling system during slow-wave sleep or quiet awake state and that they reflect a widely synchronized network activity (Destexhe et al., 1999). However, whenever a situation arises that demands the attention of the animal, an ensemble of neurons would go into the depolarized state. This could be accomplished by activation of attention-related pathways such as DA (Lewis and O'Donnell, 2000), noradrenergic, or cholinergic (Steriade et al., 1993b) systems. Indeed, ensemble coding has been observed in the hippocampus of awake animals, in neurons encoding spatial location (place cells) (Eichenbaum et al., 1989;Deadwyler and Hampson, 1995). Place cells have also been reported in the NAcc (Lavoie and Mizumori, 1994). It is possible that ensemble activity in the hippocampus defines the neural ensemble in the NAcc. Unveiling the functional roles of such ensembles could be attempted by measuring field potential activity in behaving animals, a measure that according to our results would be indicative of synchronous membrane potential state transitions in a neural ensemble.
Footnotes
This work was supported by United States Public Health Service Grants MH57683 and MH60131. We thank Barbara L. Lewis for her excellent technical assistance, M. Gustavo Murer and Luis Riquelme (Universidad de Buenos Aires, Buenos Aires, Argentina) for help with the cross-correlation analysis, and Brian Lowry (University of Pittsburgh, Pittsburgh, PA) for developing and providing the software used for data acquisition and analysis (Neuroscope).
Correspondence should be addressed to Patricio O'Donnell, Albany Medical College (MC-136), Center for Neuropharmacology and Neuroscience, Albany, NY 12208. E-mail: odonnep@mail.amc.edu.
REFERENCES
- 1.Anderson J, Lampl I, Reichova I, Carandini M, Ferster D. Stimulus dependence of two-state fluctuations of membrane potential in cat visual cortex. Nat Neurosci. 2000;3:617–621. doi: 10.1038/75797. [DOI] [PubMed] [Google Scholar]
- 2.Apicella P, Ljungberg T, Scarnati E, Schultz W. Responses to reward in monkey dorsal and ventral striatum. Exp Brain Res. 1991;85:491–500. doi: 10.1007/BF00231732. [DOI] [PubMed] [Google Scholar]
- 3.Chang HT, Kitai ST. Projection neurons of the nucleus accumbens: an intracellular labeling study. Brain Res. 1985;208:112–116. doi: 10.1016/0006-8993(85)90894-7. [DOI] [PubMed] [Google Scholar]
- 4.Chrobak JJ, Buzsáki G. Selective activation of deep layer (V-VI) retrohippocampal cortical neurons during hippocampal sharp waves in the behaving rat. J Neurosci. 1994;19:6160–6170. doi: 10.1523/JNEUROSCI.14-10-06160.1994. [DOI] [PMC free article] [PubMed] [Google Scholar]
- 5.Deadwyler SA, Hampson RE. Ensemble activity and behavior: what's the code? Science. 1995;270:1316–1318. doi: 10.1126/science.270.5240.1316. [DOI] [PubMed] [Google Scholar]
- 6.Deadwyler SA, Bunn T, Hampson RE. Hippocampal ensemble activity during spatial delayed-nonmatch-to-sample performance in rats. J Neurosci. 1996;16:354–372. doi: 10.1523/JNEUROSCI.16-01-00354.1996. [DOI] [PMC free article] [PubMed] [Google Scholar]
- 7.Destexhe A, Contreras D, Steriade M. Spatiotemporal analysis of local field potentials and unit discharges in cat cerebral cortex during natural wake and sleep states. J Neurosci. 1999;19:4595–4608. doi: 10.1523/JNEUROSCI.19-11-04595.1999. [DOI] [PMC free article] [PubMed] [Google Scholar]
- 8.Douglas R, Martin K, Whitteridge D. An intracellular analysis of the visual responses of neurons in cat visual cortex. J Physiol (Lond) 1991;440:659–696. doi: 10.1113/jphysiol.1991.sp018730. [DOI] [PMC free article] [PubMed] [Google Scholar]
- 9.Eichenbaum H, Wiener SI, Shapiro ML, Cohen NJ. The organization of spatial coding in the hippocampus: a study of neural ensemble activity. J Neurosci. 1989;9:2764–2775. doi: 10.1523/JNEUROSCI.09-08-02764.1989. [DOI] [PMC free article] [PubMed] [Google Scholar]
- 10. Goto Y, O'Donnell P. Synchronous activity in the hippocampus and nucleus accumbens in vivo. J Neurosci 21 2001. RC131 (1–5). [DOI] [PMC free article] [PubMed] [Google Scholar]
- 11.Hu X-T, White FJ. Dopamine enhances glutamate-induced excitation of rat striatal neurons by cooperative action of D1 and D2 class receptors. Neurosci Lett. 1997;224:61–65. doi: 10.1016/s0304-3940(97)13443-7. [DOI] [PubMed] [Google Scholar]
- 12.Jog MS, Kubota Y, Connolly CI, Hillegaart V, Graybiel AM. Building neural representations of habits. Science. 1999;286:1745–1749. doi: 10.1126/science.286.5445.1745. [DOI] [PubMed] [Google Scholar]
- 13.Kelley AE. Neural integrative activities of nucleus accumbens subregions in relation to learning and motivation. Psychobiology. 1999;27:198–213. [Google Scholar]
- 14.Koob GF, Bloom FE. Cellular and molecular mechanisms of drug dependence. Science. 1988;242:715–723. doi: 10.1126/science.2903550. [DOI] [PubMed] [Google Scholar]
- 15.Lampl I, Reichova I, Ferster D. Synchronous membrane potential fluctuations in neurons of the cat visual cortex. Neuron. 1999;22:361–374. doi: 10.1016/s0896-6273(00)81096-x. [DOI] [PubMed] [Google Scholar]
- 16.Lavoie AM, Mizumori SJ. Spatial, movement-, and reward-sensitive discharge by medial ventral striatum neurons of rats. Brain Res. 1994;638:157–168. doi: 10.1016/0006-8993(94)90645-9. [DOI] [PubMed] [Google Scholar]
- 17.Leung LS, Yim CY. Rhythmic δ-frequency activities in the nucleus accumbens of anesthetized and freely moving rats. Can J Physiol Pharmacol. 1993;71:211–220. doi: 10.1139/y93-049. [DOI] [PubMed] [Google Scholar]
- 18.Lewis BL, O'Donnell P. Ventral tegmental area afferents to the prefrontal cortex maintain membrane potential “up” states in pyramidal neurons via D1 dopamine receptors. Cereb Cortex. 2000;10:1168–1175. doi: 10.1093/cercor/10.12.1168. [DOI] [PubMed] [Google Scholar]
- 19.Mahon S, Deniau J-M, Charpier S. Relationship between EEG potentials and intracellular activity of striatal and cortico-striatal neurons: an in vivo study under different anesthetics. Cereb Cortex. 2001;11:360–373. doi: 10.1093/cercor/11.4.360. [DOI] [PubMed] [Google Scholar]
- 20.O'Donnell P. Ensemble coding in the nucleus accumbens. Psychobiology. 1999;27:187–197. [Google Scholar]
- 21.O'Donnell P, Grace AA. Physiological and morphological properties of accumbens core and shell neurons recorded in vitro. Synapse. 1993;13:135–160. doi: 10.1002/syn.890130206. [DOI] [PubMed] [Google Scholar]
- 22.O'Donnell P, Grace AA. Synaptic interactions among excitatory afferents to nucleus accumbens neurons: hippocampal gating of prefrontal cortical input. J Neurosci. 1995;15:3622–3639. doi: 10.1523/JNEUROSCI.15-05-03622.1995. [DOI] [PMC free article] [PubMed] [Google Scholar]
- 23.O'Donnell P, Grace AA. Dopaminergic reduction of excitability in nucleus accumbens neurons recorded in vitro. Neuropsychopharmacology. 1996;15:87–98. doi: 10.1016/0893-133X(95)00177-F. [DOI] [PubMed] [Google Scholar]
- 24.O'Donnell P, Grace AA. Dysfunctions in multiple interrelated systems as the neurobiological bases of schizophrenic symptom clusters. Schizophr Bull. 1998;24:267–283. doi: 10.1093/oxfordjournals.schbul.a033325. [DOI] [PubMed] [Google Scholar]
- 25.Paxinos G, Watson C. The rat brain in stereotaxic coordinates, Ed 4. Academic; San Diego: 1998. [Google Scholar]
- 26.Perkel DN, Gerstein GL, Moore GR. Neuronal spike trains and stochastic point processes. II. Simultaneous spike trains. Biophys J. 1967;7:419–440. doi: 10.1016/S0006-3495(67)86597-4. [DOI] [PMC free article] [PubMed] [Google Scholar]
- 27.Riehle A, Grün S, Diesmann M, Aertsen A. Spike synchronization and rate modulation differentially involved in motor cortical function. Science. 1997;278:1950–1953. doi: 10.1126/science.278.5345.1950. [DOI] [PubMed] [Google Scholar]
- 28.Steriade M, Núñez A, Amzica F. Intracellular analysis of relations between the slow (<1 Hz) neocortical oscillation and other sleep rhythms of the electroencephalogram. J Neurosci. 1993a;13:3266–3283. doi: 10.1523/JNEUROSCI.13-08-03266.1993. [DOI] [PMC free article] [PubMed] [Google Scholar]
- 29.Steriade M, Amzica F, Núñez A. Cholinergic and noradrenergic modulation of the slow (∼0.3 Hz) oscillation in neocortical cells. J Neurophysiol. 1993b;70:1385–1400. doi: 10.1152/jn.1993.70.4.1385. [DOI] [PubMed] [Google Scholar]
- 30.Stern EA, Jaeger D, Wilson CJ. Membrane potential synchrony of simultaneously recorded striatal spiny neurons in vivo. Nature. 1998;394:475–478. doi: 10.1038/28848. [DOI] [PubMed] [Google Scholar]
- 31.Thierry AM, Blanc G, Sobel A, Stinus L, Glowinski J. Dopaminergic terminals in the rat cortex. Science. 1973;182:499–501. doi: 10.1126/science.182.4111.499. [DOI] [PubMed] [Google Scholar]
- 32.Voorn P, Jorritsma Byham B, Van Dijk C, Buijs RM. The dopaminergic innervation of the ventral striatum in the rat: a light- and electron-microscopical study with antibodies against dopamine. J Comp Neurol. 1986;251:84–99. doi: 10.1002/cne.902510106. [DOI] [PubMed] [Google Scholar]
- 33.Wilson CJ. The generation of natural firing patterns in neostriatal neurons. In: Arbuthnott GW, Emson PC, editors. Chemical signaling in the basal ganglia. Elsevier; Amsterdam: 1993. pp. 277–297. [DOI] [PubMed] [Google Scholar]
- 34.Wilson CJ, Groves PM. Spontaneous firing patterns of identified spiny neurons in the rat neostriatum. Brain Res. 1981;220:67–80. doi: 10.1016/0006-8993(81)90211-0. [DOI] [PubMed] [Google Scholar]


