Abstract
Human infants can discriminate the orientation of lines within the first week after birth (Atkinson et al., 1988; Slater et al., 1988) but have immature orientation-selective pattern masking until after 6 months of age (Morrone and Burr, 1986). Here the development of orientation processing is further examined using a visual-evoked potential paradigm and normalization models of pattern masking. Contrast response functions were measured for 1 cycle per degree (cpd) gratings, counterphase-reversed in contrast at either 3.3 or 5.5 Hz. A second 1 cpd, 20% contrast, 8.3 Hz grating of either the same or orthogonal orientation was added as a mask. Evoked responses associated with the test grating, the mask, and intermodulation between the two were individually extracted using spectral analysis of the scalp-recorded EEG. Adults exhibited orientation selectivity in the masking of their test component responses and in nonlinear intermodulation between the test and mask stimuli. Infants <5 months old, however, demonstrated nonselective masking or a reversed selectivity in their responses to the test component, with adult-like orientation selectivity in their intermodulation responses. Within the context of a normalization model of pattern masking, the results are consistent with the existence of oriented filters early in life the responses of which are normalized immaturely until ∼5 months of age.
Keywords: visual development, pattern masking, orientation selectivity, human infant, visual-evoked potentials, visual cortex, normalization models
Humans can discriminate line orientations a week after birth (Atkinson et al., 1988; Slater et al., 1988). Such performance implies the existence of orientation-selective neurons, as found in newborn cat (Blakemore and Van Sluyters, 1975;Sherk and Stryker, 1976; Bonds, 1979; Albus and Wolf, 1984;Braastad and Heggelund, 1985) and monkey (Wiesel and Hubel, 1977; LeVay et al., 1980; Blasdel et al., 1995; Chino et al., 1997).
Most studies of orientation selectivity in human infants have used single patterns presented at different locations or in rapid succession. For example, infants will consistently look at a novel stimulus orientation presented beside a repeatedly viewed one, indicating that the two orientations were discriminated (Atkinson et al., 1988; Slater et al., 1988; see also Maurer and Martello, 1980;Manny, 1992; Braddick, 1993). Similarly, the development of single-unit orientation tuning has been determined with single bars or gratings.
In its habitual environment, however, the visual system must typically extract stimulus orientation from a complex array of inputs. Competition between superimposed stimuli, in the form of masking, has been widely studied in human adults. Masking studies indicate that the adult visual system is highly tuned for orientation; two overlapping stimuli produce the most significant effect on the visibility of each other when the stimuli are oriented within ∼20° of each other (Campbell and Kulikowski, 1966; Phillips and Wilson, 1984; Foley, 1994).
Little is known about the development of this orientation-selective pattern masking. Morrone and Burr (1986) recorded visual-evoked potentials (VEPs) from three human infants. They concluded that one signature of cross-orientation inhibition develops only after 6 months of age. Held et al. (1989) used a behavioral procedure. They found an equal masking effect for parallel and orthogonal masks at 1 month of age. Thus, these studies found immature masking at ages well after basic orientation discrimination has been documented.
Morrone and colleagues also studied the development of masking in single-unit and VEP studies of cat (Morrone et al., 1982, 1991). In general agreement with their human data, they found that orthogonal masks did not become effective until 40 d after birth in kittens, whereas parallel masks increased their masking strength from 20 to 50 d after birth. Green et al. (1996), however, found effective cross-orientation (orthogonal) inhibition in single-unit recordings from 28-d-postnatal kittens, the only age tested.
Our goal was to compare orientation discrimination and masking in individual infants and to test qualitative predictions derived from current masking models. VEP data were recorded from human adults and 2- to 6-month-old infants. Using a nonlinear analysis technique, we find that orientation-selective pattern masking develops after basic orientation tuning and that cross-orientation interactions develop at an earlier age than noted by Morrone and Burr (1986). Within the context of a normalization model of pattern masking, the results are consistent with the existence of oriented filters early in life the responses of which are normalized immaturely until ∼5 months of age.
MATERIALS AND METHODS
Nonlinear analysis of VEP pattern masking
Masking is a nonlinear phenomenon in that the response to the test component depends on whether the mask is present or not. Nonlinear processes will produce distortion products if the test and mask inputs are modulated at different frequencies; the output of the nonlinearity will contain frequencies not present in the input (Burton, 1973; Regan and Regan, 1987). As an illustration, consider a simple squaring nonlinearity. Passing two sinusoidally modulating inputs, one of frequency f1 and amplitudeA and the other of frequencyf2 and amplitude B, through this nonlinearity yields the following output spectrum:
The output of this nonlinearity contains new frequencies, at 2f1, 2f2,f1 −f2, andf1 +f2, with 2f1 and 2f2 being known as the self terms (harmonics of the two stimulus frequencies) andf1 −f2 andf1 +f2 being known as the difference and sum intermodulation frequencies, respectively. The particular self and intermodulation frequencies produced, and their magnitudes, depend on the specific form of the nonlinearity and the number of frequency components in the input (Regan and Regan, 1987).
In the current study, two stimuli were modulated at different temporal frequencies, and the self and intermodulation terms were extracted from the VEP responses. The stimulus set consisted of three conditions, a “test” stimulus presented alone and in the presence of parallel and orthogonal “masks.” Sensitivity to the test stimulus was recorded in each condition at the self harmonics of the test stimulus modulation frequency. This measurement is analogous to the sensitivities to the test stimulus measured in previous psychophysical masking studies. Responses were also assessed at the self harmonics of the mask and at the intermodulation frequencies. The test stimulus was identical across conditions, and the mask stimulus only differed in orientation. Therefore, differences in the intermodulation responses across conditions should only be caused by underlying masking differences in the orientation domain (one control experiment, described in Results, was conducted to confirm this).
The test stimulus alone can only generate responses at harmonics of its modulation frequency, and the mask alone can only generate responses at harmonics of its (different) modulation frequency. If the frequencies are chosen properly, the two stimuli will not generate responses at the self harmonics of each other. Masking of these “self” components in the presence of the other stimulus, therefore, indicates nonlinear effects of one stimulus on the response to the other rather than linear cancellation of test and mask responses at the same frequency as the two responses are conducted to the scalp. The intermodulation components can also only be generated when the time-locked responses from both stimuli meet at a single nonlinearity (and not by linear combination during volume conduction or postsynaptic linear summation of membrane potentials).
Experimental procedure
Visual stimuli. Highly visible temporal and spatial frequencies were chosen to form the stimulus pairs. Two 1 cycle per degree (cpd) spatial gratings were presented, one after the other, on alternate frames of a video monitor with a 66.7 Hz frame rate. The test grating was swept logarithmically from 0.4 to 17.1% Michelson contrast over a 10 sec trial, and the mask grating was fixed at 0 or 20% contrast. The test grating was square wave, counterphase-reversed at one temporal frequency, at either 3.3 or 5.5 Hz, and the mask was reversed at another frequency, always 8.3 Hz. These temporal frequencies were submultiples of the video frame rate, and multiples of the test and mask frequencies were nearly incommensurate. The stimuli were generated using a NuVista graphics board and were presented on a Dotronix M2400 monochrome monitor (mean luminance, 108 cd/m2). The monitor was fitted with an attenuator circuit for accurate rendition of contrasts (Pelli and Zhang, 1991), and a regularly calibrated γ-correction lookup table was used to compensate for screen nonlinearities. A circular aperture (diameter of 11°) was placed over the screen to ensure that the stimulus covered the same visual angle at all orientations.
EEG recording. No data were recorded for the first second after the stimulus appeared on the screen to remove the transient response to stimulus onset. The EEG was recorded from three occipital bipolar derivations O1, Oz, and O2 vs Cz, over a passband of 1–100 Hz (−6 dB). The EEG data were sampled at 397 Hz to 16-bit accuracy, and a recursive least squares adaptive filter was used to calculate the amplitude and phase of the contrast response function at each of the analysis temporal frequencies (Tang and Norcia, 1995). For each subject and analysis frequency, the data were coherently averaged over all trials in a stimulus condition (maintaining phase information) to form an average response function for each condition.
Observers. Eight adults and 45 infants, from 7 to 26 weeks of age, participated as observers. The infants were recruited from local birth records and participated with the informed consent of their parents. No abnormalities or complications had been noted at birth, and no significant ocular abnormalities were detected at data collection. Forty-one infants were included in the data analysis (91% success rate for testing). A number of infants returned for two visits [to collect data at the other temporal frequency pair (<1 week between visits) or to test at another age (>3 months between visits)]. Data from a visit were excluded if the infant did not complete three stimulus conditions in the visit because of sleepiness, fussiness, or poor responses.
Procedure. The observers sat 114 cm from the screen. The adults wore their best optical correction for the distance, and the infants were uncorrected. The test sine wave was always aligned at the same orientation (pseudo-randomized to vertical or horizontal). Three stimulus conditions were presented for each temporal frequency pair: test presented alone, the mask presented parallel to the test (same spatial phase), and the mask presented orthogonal to the test. Ten trials were collected from the adults, in two blocks of five trials, for each condition and temporal frequency pair. The order of the set of blocks was pseudo-randomized across observers. The infants were only presented with one temporal frequency pair per visit and were presented two blocks of three trials pseudo-randomized across the three stimulus conditions. Twenty of the infants completed the two temporal frequency pairs in two visits (their distribution was even with age).
A number of studies have proposed that the receptive fields of individual neural mechanisms may change in spatial scale during development, chiefly because of photoreceptor migration [Wilson (1988)proposed a factor of 4.6 decrease in spatial scale between newborns and adults]. Therefore, four of the adults were tested again at a spatial frequency of 4 cpd, four times higher than the 1 cpd infant stimuli. This was done to determine whether any differences between 1 cpd adult and infant responses could be explained purely by the proposed shift in spatial scale of individual mechanisms during development.
RESULTS
Spectral analysis
Counterphase modulation of a spatial stimulus typically produces a VEP at even harmonics (multiples) of the input temporal frequencyf1, with the second harmonic 2f1 being dominant. The strong second harmonic response and lack of first harmonic are commonly attributed to an effective full-wave rectification of the response across the population of responding neurons. In a mass response such as the surface-recorded VEP, complex cells, which are full-wave rectifiers, would be expected to generate only even-order response components to counterphase modulation. Simple cells, on the other hand, generate both even- and odd-order response components to this stimulus. The odd-order responses vary with the phase relationship between the stimulus and the receptive field, dropping to near zero at a particular null phase (Movshon et al., 1978; Reid et al., 1987, 1991; Jagadeesh et al., 1997). In the volume-conducted mass response, the responses of simple cells with all relative spatial phase relationships will combine in complementary pairs to form even-order responses only; the odd-order components will cancel.
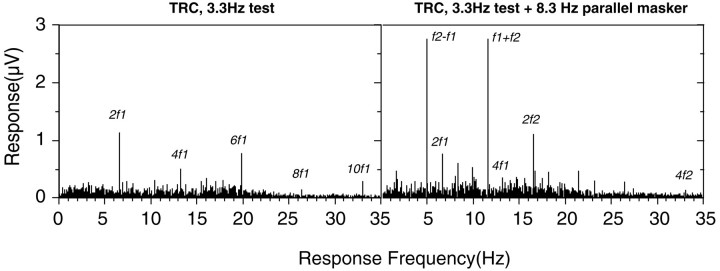
Figure 1, left, shows a typical adult response spectrum for a 20% contrast, 1 cpd spatial sine wave counterphase reversing at 3.3 Hz. Response components (significantly greater than the level of EEG noise at adjacent frequencies) can be seen at even multiples of the stimulation frequency. Figure 1, right, shows the response to the same sine wave, plus a 20% contrast parallel mask. Responses to the test are reduced in the presence of the mask (peaks labeled 2f1 and 4f1). Responses to the mask are found at 2f2 and 4f2, and large second-order intermodulation responses are apparent at frequencies corresponding tof1 −f2 andf1 +f2. In the rest of the analysis, only the second-order frequency responses (second harmonic self terms and sum intermodulation frequency) are described, because these were the largest and most robust signals.
Fig. 1.
Example of temporal frequency spectra recorded from an adult (TRC). Left, Data recorded using a 20% contrast, 1 cpd grating, reversed in contrast at 3.3 Hz. The voltage response is plotted as a function of analysis frequency. Right, The response to a two-input stimulus composed of two 20% contrast, 1 cpd gratings, one reversed at 3.3 Hz and the other at 8.3 Hz. The two gratings were vertical and were aligned in spatial phase.
Masking of the test stimulus
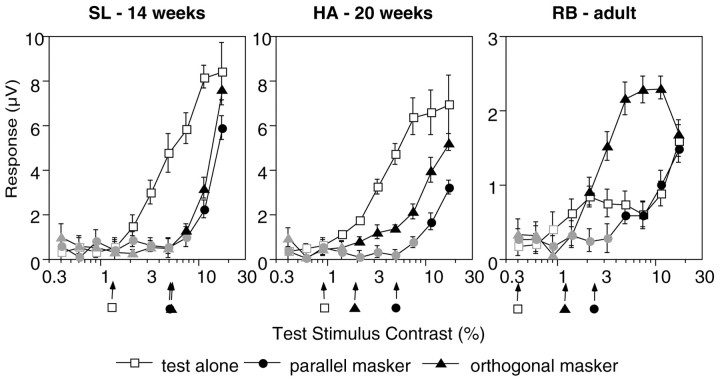
Psychophysical orientation-masking studies have gauged masking by measuring contrast sensitivity for the test stimulus in the presence of a mask. In the present study, the principle response to the test stimulus lies at the second harmonic of its modulation frequency, 2f1 (at 11 or 6.6 Hz). Figure2 shows the response at 2f1 as a function of contrast of the 5.5 Hz test stimulus. Functions are plotted for three observers for the test-alone (open squares), orthogonal mask (filled triangles), and parallel mask (filled circles) conditions. One difference between the adult and infant functions is in the amplitude of the responses. The adult responses are all much smaller in amplitude than are those of the infants, which is typical in the scalp-recorded VEP (Morrone and Burr, 1986). The infant contrast response functions for the test-alone condition are monotonically increasing, whereas the adult generated a two-limbed function. Two-limbed contrast response functions are common in adult humans (Campbell and Maffei, 1970; Murray and Kulikowski, 1983; Bobak et al., 1984; Norcia and Tyler, 1985) and in adult macaque monkeys (Nakayama and Mackeben, 1981). In the infants, masking is evident as a pure rightward shift of the entire contrast response function. In the adult, the point at which the response emerges from the noise is shifted rightward, but the contrast response function also changes shape.
Fig. 2.
VEP contrast response functions for two individual infants (HA, SL) and an adult (RB). The voltage response at the second harmonic 2f1 of the test stimulus reversal rate is plotted as a function of contrast of the test stimulus. Open squares represent the response in the test-alone condition,filledtriangles represent the orthogonal mask condition, and filled circles represent the parallel mask condition. Mask contrast was 20%. Contrast thresholds (arrows) were estimated by extrapolating to zero from the linear portion of the contrast response function (filled symbols). Portions of the curve where the signal was not significantly different from 0 V (p < 0.05) are shown in gray[tcirc statistic (Victor and Mast, 1991)]. In the adult, the test-alone threshold was estimated from the first monotonically increasing portion of the record.
Contrast threshold measures of masking
VEP contrast response functions may represent the combined responses of multiple mechanisms in the underlying cortical tissue, especially at suprathreshold contrasts (recruitment of additional mechanisms at high-contrast levels may explain the two-limbed contrast response functions in adults shown in Figs. 2,3). To retain an analogy with psychophysical masking studies, contrast threshold was estimated here as a summary of the effects of oriented masks. VEP amplitude is an approximately linear function of log contrast over the low-contrast range, and accurate predictions of psychophysical contrast threshold can be derived by extrapolating the linear portion of the function to zero amplitude (Campbell and Maffei, 1970; Seiple et al., 1984; Norcia et al., 1990).
Fig. 3.
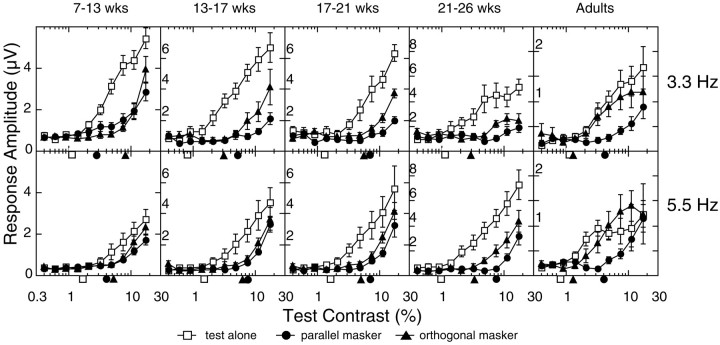
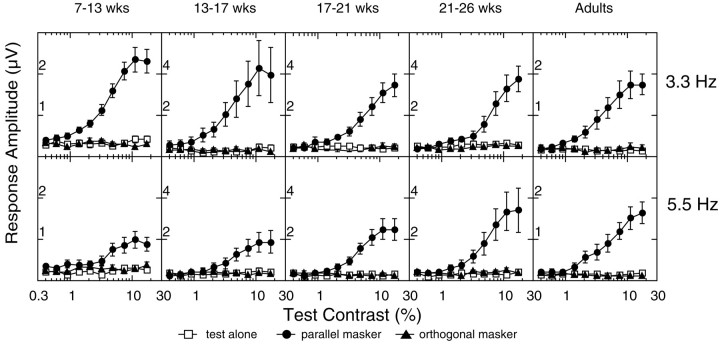
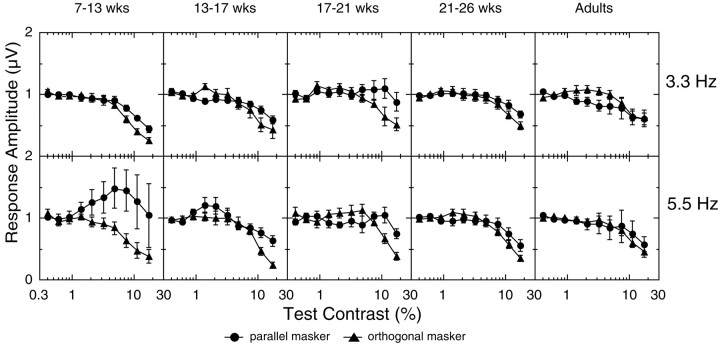
Average VEP contrast response functions at the test stimulus frequency 2f1. The amplitude functions were averaged incoherently across all observers in each of five age groups [7–13 weeks (n = 10), 13–17 weeks (n = 8), 17–21 weeks (n= 8), 21–26 weeks (n = 8), and adult (n = 8)]. Data from the 3.3 and 8.3 Hz and the 5.5 and 8.3 Hz stimulus pairs are shown in the topand bottom rows, respectively. Contrast thresholds extrapolated from these average functions are plotted for each condition on the x-axis. Open squaresrepresent the response in the test-alone condition, filled triangles represent the orthogonal mask condition, andfilled circles represent the parallel mask condition.wks, Weeks.
Contrast threshold for the test stimulus in the test-alone condition improves with age across the three subjects shown in Figure 2(extrapolated thresholds are indicated by arrows in the figure). The threshold improves from 1.29% for SL (14 weeks of age) to 0.91% for HA (20 weeks of age) to 0.39% for RB (adult). The addition of an orthogonally oriented mask elevated the threshold for the 2f1 component by a factor of 4.0 for SL, 2.1 for HA, and 3.0 for the adult RB. A mask of the sameorientation produced threshold elevation equal to the orthogonal one in the 14-week-old infant (a factor of 3.9) but substantially more threshold elevation in the 20-week-old infant (a factor of 5.4) and the adult (a factor of 5.9). Threshold masking of the test response is thus orientation selective in the 20-week-old infant and the adult but not in the 14-week-old infant.
Figure 3 shows contrast response functions, averaged across all of the observers, for five different age groups (columns). Averaging was performed incoherently on the amplitude values (amplitude only, without phase). The 3.3 and 5.5 Hz data are presented in the top and bottom rows, respectively. These data demonstrate that the mask stimulus masks the test response at all ages, as the masked functions move rightward to higher contrast. However, the averaged masked functions show the same developmental trend as the individuals in Figure 2; the parallel and orthogonal condition functions are almost superimposed at the youngest ages and gradually split apart over the first few months to show orientation selectivity of masking.
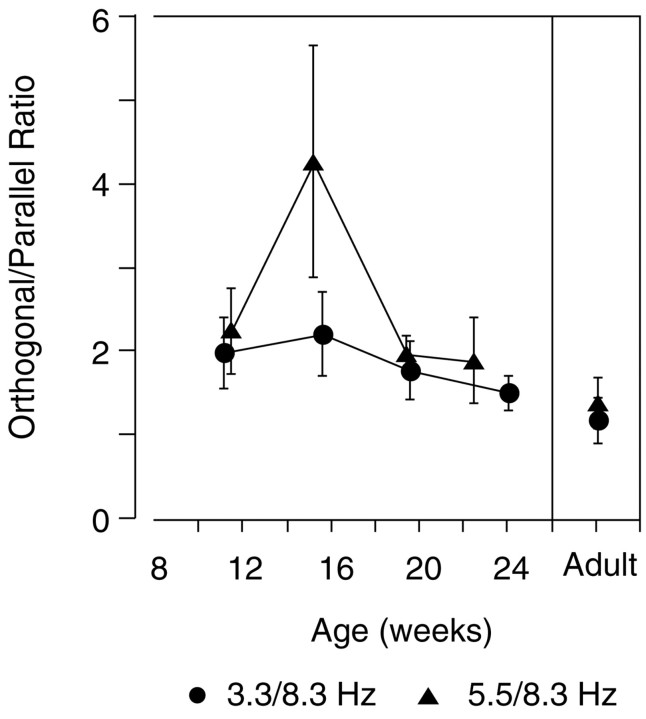
Extrapolated thresholds are plotted, for each average function, on thex-axis of the graphs in Figure 3. These thresholds are comparable with the values obtained by extrapolating the response functions of each individual observer and then averaging thresholds across observers. The averages of the individual thresholds are shown in Figure 4. Again, data from all observers are grouped according to age. The left panelpresents the data recorded with the 5.5 and 8.3 Hz frequency pair, and the right panel shows data from the 3.3 and 8.3 Hz pair. The ratio of the average individual threshold (Fig. 4) to the threshold of the averaged functions (Fig. 3) varied ≤0.42 from a value of 1 in all conditions (mean difference was 0.18, with a SD of 0.11). Because the order of extrapolation and averaging had minimal effect on the threshold estimate, detailed analysis was performed on the averaged individual thresholds, because error variance could be estimated for these sampled distributions.
Fig. 4.
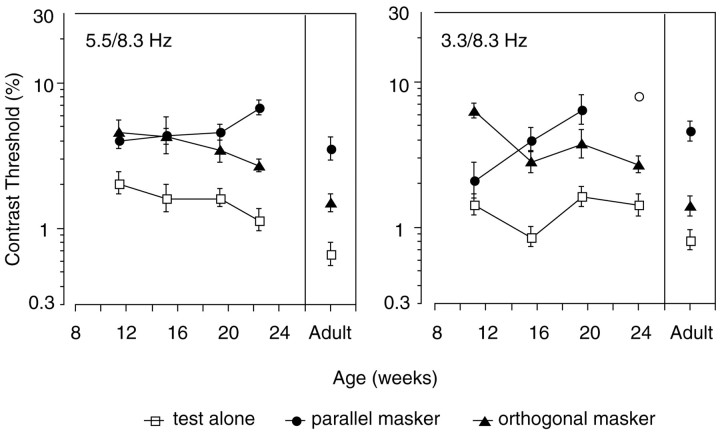
Contrast threshold extrapolations from the 2f1 functions of individual observers, averaged into the five age groups plotted in Figure 3 [7–13 weeks (n = 10), 13–17 weeks (n = 8), 17–21 weeks (n = 8), 21–26 weeks (n = 8), and adult (n = 8)]. The left and right panels present data from the 5.5 and 8.3 Hz and the 3.3 and 8.3 Hz temporal frequency pairs, respectively. Open squares represent the response in the test-alone condition, filled triangles represent the orthogonal mask condition, and filled circlesrepresent the parallel mask condition. Thresholds were not measurable with the parallel mask in the oldest 3.3 and 8.3 Hz infant age group (the open circle is plotted at the threshold of the one infant who provided a significant signal; see Results, Masking of the test stimulus).
The average individual thresholds in Figure 4 for the test-alone condition (square symbols) were similar at the two test temporal frequencies. The infant mean thresholds range between 0.86 and 2.06%, and the adult mean thresholds are 0.67 and 0.81%. Thus, there is a small but significant decrease with age, consistent with previous reports (Norcia et al., 1990) (two-way ANOVA, temporal frequency vs age for the test-alone thresholds; no main effect of temporal frequency; a main effect of age, df = 4, F = 7.80,p < 0.0001; and no interaction between temporal frequency and age).
Although the contrast threshold improved with age in both the test-alone and orthogonal mask conditions, the ratio of the contrast thresholds in the two conditions remained constant with age; orthogonal masks masked threshold by constant factors across age (2.6 at 3.3 Hz and 2.1 at 5.5 Hz). Thus the threshold with the cross-oriented mask improves in concert with the unmasked threshold, perhaps limited by a common factor [three-way ANOVA, temporal frequency vs stimulus (test vs orthogonal) vs age; no main effect of temporal frequency; a main effect of age, df = 4, F = 23.52,p < 0.0001; a main effect of stimulus, df = 1,F = 135. 11, p < 0.0001; and no significant interactions].
The parallel mask had a very different effect over the period of visual development studied here. With the 5.5 Hz test, the parallel mask produced a factor of 2.0 masking effect in the youngest age group compared with a factor of 5.3 in adults. With the 3.3 Hz test, the parallel mask produced a factor of 1.4 masking effect in the youngest infants compared with a factor of 5.6 in adults. The efficacy of a parallel mask therefore increases with age for both the 5.5 and 8.3 Hz and the 3.3 and 8.3 Hz combinations. In fact, the youngest infants actually had better contrast sensitivity than adults in the 3.3 and 8.3 Hz parallel-masking condition, an unprecedented finding [three-way ANOVA, temporal frequency vs stimulus (test vs parallel) vs age; no main effect of temporal frequency; a main effect of age, df = 4,F = 4.37, p < 0.002; a main effect of stimulus, df = 1, F = 162.07, p < 0.0001; an age-by-stimulus interaction, df = 4, F= 6.26, p < 0.0001; and an age-by-temporal frequency interaction, df = 4, F = 2.930, p< 0.0233].
The youngest infants also consistently demonstrated “paradoxical” masking for the 3.3 and 8.3 Hz combination; contrast thresholds werelower in the parallel-masking condition than they were in the orthogonal condition (8 of 10 individual infants had orthogonal masked thresholds at least twice the parallel masked threshold value) (Candy et al., 1999).
There is no 3.3 Hz parallel mask datum for the 21–26 week age group in Figure 4 because only one (the youngest) infant provided a significant signal in the presence of the parallel mask. This absence of signal is not evidence of poor overall responsiveness, however, as indicated in the average functions in Figure 3. These infants provided responses in the test-alone and orthogonal mask conditions but were completely masked in the parallel condition. It may have been possible to record a threshold for a contrast sweep of a higher range, but this would have risked introducing different masking dynamics for the one condition.
As shown in Figure 4, the adult pattern of stronger masking with a parallel mask than with an orthogonal one emerged at 21–26 weeks for the 5.5 and 8.3 Hz combination and at 17–21 weeks for the 3.3 and 8.3 Hz combination. The absolute threshold elevation ratios are very similar to adult levels at 21–26 weeks for the 5.5 Hz test stimulus but are not fully adult-like at 17–21 weeks for the 3.3 Hz test stimulus. At 21–26 weeks, however, the 3.3 and 8.3 Hz masking ratios cannot be distinguished from adult levels of masking.
Four of the adult subjects were also presented with stimuli of 4 cpd. Their data were little different from the adult data at 1 cpd. Both the orthogonal and parallel masks reduced sensitivity to the test stimulus, and the parallel mask was more effective than the orthogonal mask in all cases [two-way ANOVA (temporal frequency vs spatial frequency) for ratios of 2f1 contrast threshold with parallel vs orthogonal mask; no main effect of spatial frequency (p < 0.23) or temporal frequency (p < 0.69)]. In other words the nonselective and paradoxical masking observed in infants cannot be explained by this change in spatial scale in adults. The 4 cpd adult data show the same trends as the 1 cpd adult data in all of the analyses; therefore, only 1 cpd data are presented in the figures.
Intermodulation measures of orientation selectivity
The nonselective 2f1 masking results in young infants would be predicted if infants had no orientation-selective mechanisms. The orientation discrimination literature described above, however, suggests that human infants as young as a week of age demonstrate orientation selectivity. Orientation-selective cells are also present in the visual cortex of newborn cats and primates. Do the infants with nonselective masking have evidence of orientation-selective mechanisms?
A direct test for orientation selectivity was performed in all of the subjects by analyzing the intermodulation (IM) responses. The presence of IM in the VEP indicates that two temporal frequencies have converged at a single nonlinearity (e.g., the spike-generating nonlinearity of a cell). Although a nonlinearity that is not selective for orientation would produce IM to any combination of test and mask orientation, an orientation-selective site would produce different amplitudes of IM depending on the mask orientation (Regan and Regan, 1988).
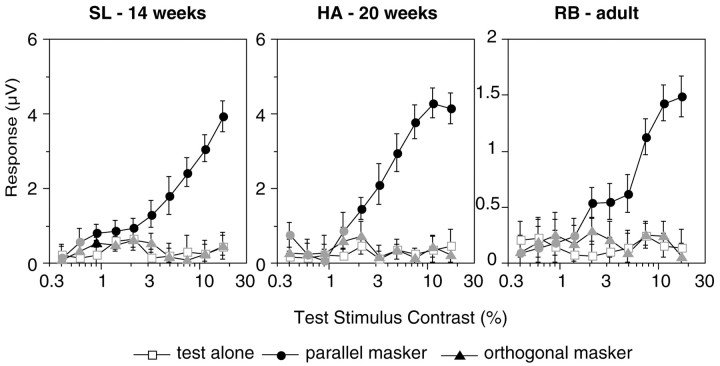
Figure 5 plots contrast response functions for the second-order sum frequencyf1 +f2 from the same recordings that are plotted in Figure 2. As previously, the open squaresrepresent the test-alone condition, the filled circlesrepresent the parallel mask condition, and the filled triangles represent the orthogonal mask condition. In all three subjects there were no significant f1+ f2 responses to the test-alone or orthogonal configurations. IM was generated, however, in the parallel mask configuration. This result generalized across the other subjects and temporal frequency pair (Fig. 6 shows the averaged amplitude functions forf1 +f2, in the style of the 2f1 responses in Fig. 3). The data suggest that all subjects, even the youngest, had orientation selectivity, consistent with the previous human orientation discrimination results. In summary, the data simultaneously demonstrate nonselective masking in the 2f1response and orientation selectivity in thef1 +f2 response in the same infants.
Fig. 5.
Individual contrast response functions for the sum intermodulation frequency f1 +f2. Response voltage is plotted as a function of test stimulus contrast. The conventions and recordings are the same as in Figure 2. The test-alone function (open symbols) represents the experimental noise level because no mask was present.
Fig. 6.
Average VEP contrast response functions at the sum intermodulation frequency f1 +f2. The conventions and recordings are the same as in Figure 3. The test-alone function (open symbols) represents the experimental noise level because no mask was present.
Comparing the 2f1 andf1 +f2 responses also reveals that thef1 +f2 intermodulation component response is present at much lower test stimulus contrasts than is the masked 2f1 response. This implies that low-contrast information related to the test stimulus is reaching the nonlinearity that generates the intermodulation, although it is not present in the VEP recording. In fact, the contrast threshold for thef1 +f2 component response is very similar to the unmasked test-alone threshold at 2f1. Even the 21–26 week age group in the 3.3 Hz parallel mask condition, who generate no apparent 2f1 response in the VEP recording, produce a f1 +f2 response at low contrasts.
There are numerous nonlinearities throughout the visual system, starting in the photoreceptors; therefore it is not surprising to find IM in the VEP (e.g., from any intensity nonlinearity capable of contributing to the recorded signal). Nonlinearities before the primate visual cortex are not highly selective for stimulus orientation and would produce IM in both mask configurations. The important result here, therefore, is the absence of IM in the orthogonal configuration. Could this difference in IM between parallel and orthogonal configurations be an artifact of the spatial arrangement of the stimuli? Consider an intensity nonlinearity with a small circularly symmetric receptive field that integrates over less than one cycle of the grating stimulus (luminance adaptation in a photoreceptor for example). This type of nonlinearity will produce IM to temporal modulation between dim and bright luminances in its receptive field. When the test and mask stimuli are in parallel, 50% of the stimulus is at the brightest luminance, whereas, in the orthogonal configuration, only 25% of the stimulus is at the maximum luminance at one time. One could propose that the greater area modulating in-phase in the parallel configuration would produce a greater IM signal than in the orthogonal configuration although the proposed local luminance nonlinearity is not orientation selective.
A control experiment in adults was conducted to address this question. A test stimulus combined with a mask oriented between parallel and orthogonal is a distorted version of the orthogonal mask checkerboard; the stimulus is composed of rhombuses instead of squares. In all nonparallel cases 25% of the stimulus is at the brightest luminance at one time if the two gratings are infinite in extent. [The stimulus was actually circularly apertured down to 11°, which constrains the number of rhombuses presented. At a mask orientation offset of 10° relative to the test, this only introduces an error in the apertured stimulus of <3% in the 25% area estimate (geometric calculation). The error is even smaller at greater offsets because the rhombuses are longest for small test or mask offsets.] Here, test and mask combinations were presented at a number of different mask offsets between parallel and orthogonal (0, 5, 10, 20, 45, 65, and 90°). If the IM is generated by an intensity nonlinearity, one would predict that the amplitude of the IM would vary little between mask orientations of 10° and orthogonal, because the brightest area remains very close to 25%.
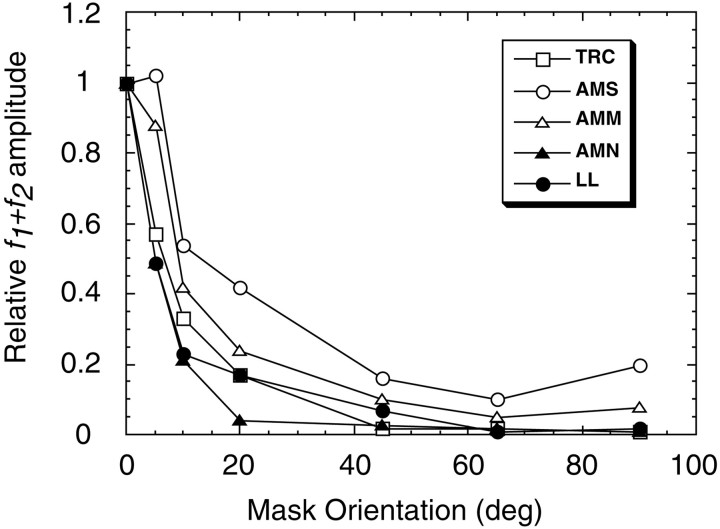
Normalized IM amplitude is plotted as a function of mask orientation for five adults in Figure 7. In all five subjects the amplitude of the f1 +f2 response diminished with an increasing offset between test and mask orientation. However, four of the five subjects do not reach the level of IM in the orthogonal configuration (no significant signal) until 45° of offset, and all subjects produce strong IM responses at small nonparallel mask orientation offsets. Furthermore, the ratio of IM amplitudes between parallel and orthogonal mask conditions is much greater than the simplest 2:1 ratio prediction from the 50:25% ratio of in-phase stimulus areas (the ratios in Fig. 7 are ∼10:1). The bandwidth of the IM in Figure 7 also falls in the range of primate single-unit and human psychophysical estimates of orientation channel bandwidth (Campbell and Kulikowski, 1966; Schiller et al., 1976; DeValois et al., 1982;Phillips and Wilson, 1984). It is proposed, therefore, that the recorded IM was generated by orientation-selective mechanisms.
Fig. 7.
Orientation tuning of the sum intermodulation response in five adults (AMM, AMN,AMS, LL, TRC). The normalized sum response is plotted as a function of mask offset. Each observer's response function was normalized to the amplitude for the parallel-masking condition (0 orientation offset). The intermodulation response has dropped to 50% of maximum at ∼10° of orientation offset.
Masking of the mask by the test stimulus
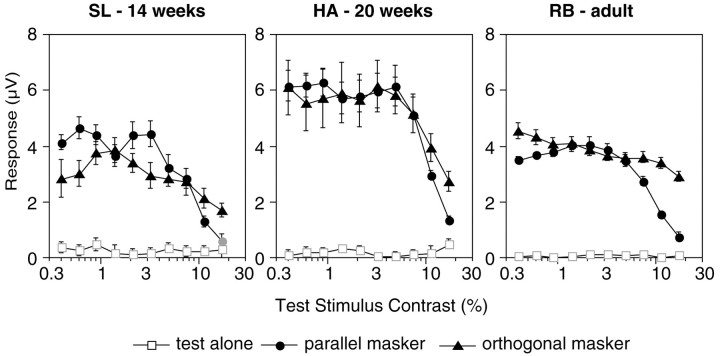
The response to the mask stimulus 2f2 was also extracted from the response spectrum for each condition. The 2f2 responses from the recordings shown in Figures 2 and 6 are shown in Figure8. As expected, there is no significant response at 2f2 in the test-alone condition (the mask stimulus was not presented). At the beginning of each masked trial, the 20% contrast mask was much higher in contrast than the sweeping test (0.4%). The functions shown in Figure 8demonstrate a strong response to the mask at the beginning of these trials. As the trial proceeded, the contrast of the test approached the contrast of the mask, and the sweeping test began to mask the mask response. This effect is consistent across age in the figure and generalized to the entire observer set. Figure9 shows normalized 2f2 functions averaged across observers (to compare the shapes of the functions, each individual function was normalized to the average of the amplitudes in the first three bins before the data were averaged across observers). Again, this averaging was done incoherently.
Fig. 8.
Individual contrast response functions for the mask frequency 2f2. Voltage response is plotted as a function of the test stimulus contrast. The recordings and conventions are the same as those used in Figures 2 and 5. The test-alone function (open symbols) represents the experimental noise level because no mask was present.
Fig. 9.
Average normalized VEP contrast response functions at the second harmonic of the mask stimulus frequency 2f2. The conventions and recordings are the same as in Figures 3 and 6. Each individual's 2f2 contrast response functions for the orthogonal- and parallel-masking conditions were normalized to the mean of the first three points on the function (lowest test stimulus contrast values). Eleven 2f2 functions, in which the signal-to-noise ratio remained <3:1 throughout the condition, were excluded from this analysis.
The mask stimulus was constant throughout the trial and at high contrast. Thus, a number of suprathreshold mechanisms could be contributing to the VEP recorded at the mask harmonics. In this case, the masking effect at the end of the trial could represent a number of different combinations of response reduction in these mechanisms. Only one quantitative analysis was performed on these data for this reason, and the data were interpreted chiefly qualitatively. The analysis was performed to determine whether the average masked responses in Figure 9were selective for mask orientation at the highest test contrast. The normalized amplitude at the highest test contrast in the presence of the orthogonal mask was divided by the same point on the parallel mask function. The prediction from the 2f1responses might be that these ratios are greater than one; the 2f2 response is masked more by the test stimulus when it is parallel than when it is orthogonal. The recorded VEP ratios are plotted as a function of age, for the two temporal frequency pairs, in Figure 10. The ratios that differ from one tend to values greater than one, implying that the test stimulus masks the parallel mask more than it masks the orthogonal one. Although one-way ANOVAs conducted for each temporal frequency pair revealed no effect of age on the masking ratio, one-tailed t tests confirmed all ratios to be significantly higher than one at the p < 0.01 level, apart from the 5.5 and 8.3 Hz ratio at 21–26 weeks (p < 0.04) and the two adult ratios (p < 0.24 andp < 0.1, for the 3.3 and 5.5 Hz tests, respectively), implying a trend toward loss of selectivity with age at the highest contrasts of the tests.
Fig. 10.
Relative masking of the mask frequency 2f2 at the maximum test stimulus contrast (17.1%). The normalized amplitude (as in Fig. 9) at the highest test stimulus contrast in the orthogonal condition was divided by the same point for the parallel condition to form the ratios plotted here.
Technical considerations
One might be concerned about the amount of refractive astigmatism in the infant subjects. Different refractive errors along vertical and horizontal axes are not uncommon at the ages tested (Howland et al., 1978; Mohindra et al., 1978), and the infant subjects were not corrected for astigmatism. There are a number of reasons why this optical effect is unlikely to have been responsible for the results. First, the 1 cpd spatial frequency used for the stimuli is low enough to be resistant to typical amounts of infant optical blur. Second, all of the stimuli were presented at the same orientation for the test-alone and parallel mask conditions, and so the increase in parallel masking with age cannot be caused by the mask becoming less blurred relative to the test with age. The relative clarity of the test and mask could change with age in the orthogonal condition, but here the data demonstrate a very consistent masking effect that did not change with age, so any optical effect would have to counteract almost perfectly a neural developmental effect. Optical effects can also not explain the difference in masking ratios within an age group for the different temporal frequencies.
Simulations
Normalization models of masking
Masking has been considered in the psychophysical literature to be the result of a nonlinear contrast transducer, a sigmoidal function that is expansive at low contrasts and compressive at high contrasts (Legge and Foley, 1980; Wilson, 1980). Recently, a class of nonlinear models has expanded on this initial proposal (Robson, 1988;Bonds, 1989; Albrecht and Geisler, 1991; Heeger, 1991; Foley, 1994). The recent models are known collectively as normalization models. Foley and colleagues in particular have adapted these models to fit psychophysical, orientation-selective, pattern-masking data [Foley (1994), his model 3] (Foley, 1994; Foley and Chen, 1997; Boynton and Foley, 1999). Because of the apparent success in fitting these models to single-unit and psychophysical data, we compared the predictions of normalization models for the stimuli used in this study with the recorded contrast response functions. Could an immaturity in one component of the models explain the developmental trend in the VEP data?
Normalization models consist, to a first approximation, of tuned linear filters the responses of which are half-wave rectified, raised to an exponent, and divided by a quantity proportional to the pooled response of a population of such filters (Carandini et al., 1997; Geisler and Albrecht, 1997). These operations account for a number of previously unexplained nonlinear properties of contrast response functions recorded from cells in the primary visual cortex (Tolhurst and Heeger, 1997). Half-wave rectification and raising the response to an exponent generate expansive behavior at low stimulus contrasts, and dividing the response by the pooled responses of a population results in nonspecific suppression and saturation at high stimulus contrasts. One typical example of this general class of models is as follows [Foley (1994), his model 3]. (This model incorporates full-wave rectification and squaring to capture the second-order behavior of complex cells and the second harmonic component from the population of simple cells at complimentary spatial phases.)
The tuned linear spatial filters contributing to the excitatory response perform a spatiotemporal summation across their receptive fields and generate an excitatory response (Et):
where SEtis the excitatory sensitivity to the normalized luminance profile of the stimulus and C is the contrast of the stimulus. The same equation can be generated for the divisive population component of the response (It):
where SItis the inhibitory sensitivity to the stimulus [this response is labeled inhibitory because it is divisively applied toEt and always acts to reduce the output (Foley, 1994)].
The output to a single stimulus is:
where p, q, and Z are constant parameters of the model. One cannot currently specify the number of linear spatial filters contributing to the excitatory and inhibitory parts of each mechanism from psychophysics or VEP work, because, in each case, the response is derived from the entire population of mechanisms. However, a number of groups [see Bonds (1989); Tolhurst and Heeger (1997)] have shown that the inhibitory normalization component responds to a significantly broader range of stimuli than does the excitatory component, implying a more heterogeneous and perhaps larger population of filters in the divisive normalizing pool. They have also shown that normalization models can capture the behavior of single cortical neurons, and therefore, each mechanism could be based on as few as one excitatory cell and the input of this cell to the numerator of the equation [see Foley (1994) for comparison with human psychophysics].
Orientation selectivity of masking in normalization models
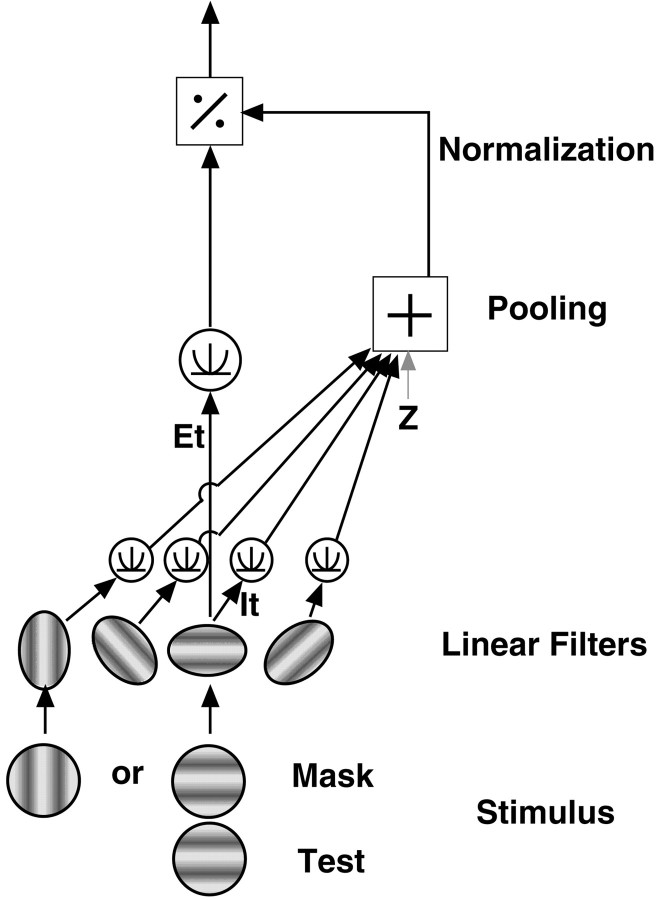
Foley and colleagues have expanded on the general normalization models by considering orientation selectivity [Foley (1994), his model 3] (Foley, 1994; Foley and Chen, 1997; Boynton and Foley, 1999). Beyond the general model structure described above, their divisive normalization has properties that are specific to the orientation of the mask. Their model of orientation-selective pattern masking, depicted in Figure 11, can be considered as follows.
Fig. 11.
Schematic of the pattern-masking model of Foley for a horizontal test stimulus [Foley (1994), his model 3]. The excitatory response of the matched filters is raised to an exponent and then divided by the pooled responses of a broad range of filters (the responses of which have also been raised to an exponent). A parallel mask generates responses in the same matched filters, and therefore, the test and mask are combined in both the excitatory and divisive responses. An orthogonal mask, however, generates responses in matched filters oriented orthogonally to the test, and therefore, there is minimal contribution from the mask to the excitatory response, and the contributions to the divisive response are not combined until the pooling stage (after they have been raised to the exponent).
When an identical parallel mask is added to the test stimulus, the test and mask pass through the same set of linear receptive fields, and the model becomes:
where Em andIm are the excitatory and inhibitory responses of the mechanism to the mask, respectively.
When an orthogonal mask is added to the test stimulus, however, the test and mask no longer pass through the same orientation-selective linear filters (Foley fitted the model to his empirical data and found the mechanisms had no excitatory response to an orthogonal mask [Foley (1994), his Fig. 6]). This implies thatEm will now be very small for mechanisms responding maximally to the test orientation. The inhibitory response also now comes from two different populations of filters (one tuned to the test orientation and one to the mask orientation). The responses of these two populations are each raised to the exponent qbefore being summed. The model in the presence of the orthogonal mask becomes:
Comparison with empirical data
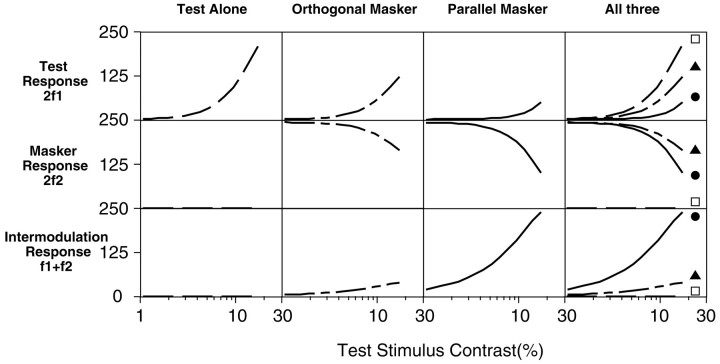
The output of the normalization models of Foley and colleagues for the VEP stimuli are shown in Figure 12. The simulations were generated by passing two temporal sinusoids through each of the models described above and conducting a discrete Fourier transform (DFT) on the output (model parameters used for these simulations were p = 2, q = 2, andZ = 20%). The output amplitude is plotted as a function of the increasing test component contrast in each graph, in the same way that the contrast response functions are shown for the VEP data in the previous figures. When present, the mask contrast was held constant at the equivalent of 20% Michelson contrast. Thefirst, second, and third columns show the output of models for the test-alone, orthogonal mask, and parallel mask conditions, respectively. The fourth column shows all three stimulus conditions together. The top row shows the output of the model at the test component second harmonic 2f1, the second row shows the output at the mask component second harmonic 2f2, and the third rowshows the output at the sum intermodulation frequencyf1 +f2.
Fig. 12.
Predictions of Foley's pattern-masking model for combined sinusoidal inputs of two different frequencies,f1 and f2. Response magnitude is plotted as a function of contrast of the test stimulus f1. The test input was swept from 0.4 to 17.1% contrast, and the mask, when present, was fixed at 20% contrast. A DFT was conducted on the output of the model, and individual frequency responses are plotted in rows in the figure. The second harmonic of the test component 2f1 is shown in the top row, the second harmonic of the mask component 2f2 is shown in the middle row, and the intermodulation responsef1 + f2 is plotted in the bottom row. Response magnitudes are in arbitrary units, and the contrast units were scaled to match those used in the empirical VEP experiment. The first three columnsfrom the left represent different stimulus conditions: test component alone, test plus orthogonal mask, and test plus parallel mask. The fourth column plots all three conditions combined. The response in the orthogonal mask condition is the sum of responses from two models (each oriented linear filter was assigned a relative response of 0.05 to an orthogonal stimulus). One model was tuned to the test orientation (Etdominates in the numerator), and the other was tuned to the mask orientation (Em dominates in the numerator), because the VEP technique used for the empirical data collection records the combined responses of mechanisms tuned to all orientations.
Considering the 2f1 responses to the variable contrast test (Fig. 12, top row), the model produces an expansive contrast response function over the range of contrasts simulated for the test presented alone (first column). An orthogonal mask reduced the response (second column), and a parallel mask reduced the response to an even greater degree (third column). The model, therefore, demonstrates orientation selectivity in the masking of the 2f1 component, as found in the adult and older infant empirical data.
The second row shows (trivially) no response at 2f2 for the test-alone condition. Addition of the orthogonal mask generates a strong response at the beginning of the trial. This response then diminishes as the mask is masked by the increasing contrast of the test stimulus. The parallel mask produces a similar-shaped function with stronger masking at the higher test stimulus contrasts. This masking effect was also qualitatively present in the VEP data, although there was little evidence of strong selectivity.
The third row shows (trivially) nof1 +f2 intermodulation response for the test-alone condition (only one stimulus is present). There is very weak intermodulation with an orthogonal mask and strong, increasing intermodulation in the presence of the parallel mask. In the parallel mask model of Foley and colleagues described above, intermodulation components are generated in both the numerator (oriented filter stage) and denominator (gain pool), where excitation and inhibition from the test and mask are summed and then raised to the exponents pand q (both ∼2 in their empirical data fits). In contrast, in the case of the orthogonal mask, the mask is all but excluded from the summation in the numerator, and the separate application of exponents in the denominator precludes intermodulation at that stage. Thus, in general, if the two stimulus components pass through the same oriented linear filter, they should produce intermodulation, and if they do not pass through the same filter, the response spectrum should contain minimal intermodulation.
The empirical IM data mimic the output of the models in two respects at all ages tested. First, there is no evidence of an IM signal in the presence of an orthogonal mask, whereas the parallel mask generates a robust IM signal as the test stimulus increases in contrast. Second, the IM response arises at the 2f1contrast threshold for the test stimulus presented alone. IM signals in both the model and the data are robust below the masked 2f1 contrast threshold; in both the model and the data, the IM response function falls at the same position on the contrast axis as the unmasked test-alone 2f1 response. This result is perhaps nonintuitive, but it is a property of the model that is exemplified in the data.
When considering all of these harmonics simultaneously, there is no trivial manipulation of the model that would produce the pattern of responses recorded in the infant data (see Comparison of VEP data and normalization models).
DISCUSSION
Comparison of infant and adult VEP data
The infant 2f1 threshold data reveal a number of striking immaturities under the spatiotemporal conditions examined. Unlike in adults, parallel masks produced an equal effect or even less masking than did orthogonal masks in younger infants. Orthogonal masking remained constant with age (a factor of 2–3 masking of threshold), whereas the parallel mask became more effective in both temporal combinations (from a factor of ∼1.5–5). The relative threshold elevations for parallel and orthogonal masks are consistent with those of adults by 21–26 weeks of age for both temporal frequency combinations, when absolute sensitivity is depressed from adult levels by approximately a factor of two.
It is unlikely that immature masking of the 2f1 response is caused by a complete lack of oriented receptive fields. V1 orientation selectivity sufficient to differentiate orthogonally oriented patterns is present at or near birth in both cat and macaque (Blakemore and Van Sluyters, 1975; Wiesel and Hubel, 1977). This prenatal development has been modeled as an activity-driven process based on correlations in neuronal firing (Erwin and Miller, 1998). The intermodulation responses recorded here show strong selectivity, consistent with the single-unit results. A selectivity estimate was calculated from the ratio of IM amplitudes in the parallel- and orthogonal-masking conditions. These estimates are ∼10:1 for the infants and adult shown in Figure 5.
Immaturities in the masking of the mask response were less dramatic. The adults showed no selectivity, whereas the infants tended toward more selectivity at high test stimulus contrasts. This may reflect the contribution of multiple mechanisms to the VEP at suprathreshold contrasts.
Comparison of VEP data and normalization models
Passing two nearly incommensurate sine waves through the normalization model of Foley and colleagues generates functions that capture salient features of the adult data. The 2f1 responses are more masked by parallel than by orthogonal masks, thef1 +f2 intermodulation is selective for mask orientation, intermodulation responses arise at lower contrast than the 2f1 responses in the parallel condition, and there is masking of 2f2responses at high test stimulus contrast.
The absence of intermodulation in the orthogonal mask condition is particularly informative with regard to the normalization models of Foley and colleagues. A number of normalization models would fit the adult 2f1 data, but the absence of intermodulation in the orthogonal mask condition is consistent with the proposal of Foley and colleagues that the test and mask responses are not summed before being raised to the exponent in the denominator of the orthogonal model. Also, the domination of the intermodulation spectrum by second-order terms suggests that model exponents of 2 are valid. Exponents other than 2 would lead to higher-order intermodulation terms. Foley (1994) derived exponents near 2 from his psychophysical data, and “half-squaring” is commonly used to model single-cell data (Heeger, 1992). Unfortunately it was not possible to fit the model to the data because most of the recorded functions were still linear at the end of the contrast range. The saturating portion of the function is required to constrain the semisaturation constantZ.
The most dramatic difference between the adult data and the model predictions is in the shape of the adult test-alone function at 5.5 Hz. Both the individual adult and averaged functions contained two limbs. These have been reported numerous times in the literature (Campbell and Maffei, 1970; Nakayama and Mackeben, 1981; Murray and Kulikowski, 1983;Bobak et al., 1984; Norcia and Tyler, 1985). The normalization model predicts simple rightward shifts of a sigmoidal response function. The presence of two limbs could be accommodated by extending the model to include multiple mechanisms, each with an underlying normalization structure. However, it is unlikely that this simple modification could capture the change in shape we have observed. Other mechanisms, such as cancellation or nonlinear interaction between multiple mechanisms, or changes in response dynamics may be needed to account for the data.
Although the models agree qualitatively with the older infant and adult VEP data, they cannot capture the paradoxical masking behavior of the youngest infants. There is no trivial manipulation of the model that would produce the recorded pattern of responses across the spectral components, although, considering just the 2f1 component, increasing the exponent in the normalization models decreases the effect of the parallel mask so that paradoxical masking can be simulated at some mask contrasts. Explaining the paradoxical effect will require a model that, via a developmentally plausible process, converts from paradoxical to nonselective to adult 2f1 masking behavior with minimal effect on the intermodulation components and 2f2 responses.
Comparison with previous developmental data
Morrone and colleagues have studied the development of pattern masking in cat (Morrone et al., 1982, 1991) and human (Morrone and Burr, 1986; Burr and Morrone, 1987). In their adult data, parallel masking was characterized by a lateral shift of the contrast response function (CRF) on semilog axes (increase in contrast threshold with no change in slope), whereas orthogonal masks caused a multiplicative attenuation (decreased slope with no change in threshold). During development, orthogonal masks had no effect on the CRF until 40 d after birth in kittens or 6 months in humans. In contrast, parallel masks had a gradually increasing effect on the CRF, from the earliest ages tested in human and cat (3 months and 20 d, respectively).
The current VEP data are in good agreement with those of Morrone and colleagues for the test-alone and parallel-masking functions. However, there were no consistent differences in the slopes of the orthogonal mask functions even in adults in the current data [Skoczenski et al. (1998) found similar results with one-dimensional noise masks]. Threshold elevation with no slope change was seen for both mask orientations at all ages in the current study (except perhaps the parallel mask in the paradoxical masking case in the youngest infants). The main difference between the current results and those of Morrone and colleagues therefore lies in the orthogonal mask data, both in the CRF slope and the onset of masking during development. Beyond subtle differences in experimental protocol, we cannot explain these differences. Regarding the onset of masking, however, the only human infant CRFs presented by Morrone and Burr (1986), from one infant (their Fig. 2), demonstrate equal masking in the orthogonal and parallel conditions (change in contrast thresholds with no change in slope) at 3.5 months of age. This is consistent with the data in the current study. Some of the difference in apparent onset of masking, therefore, may lie in the definition of orthogonal masking. There is no apparent effect of an orthogonal mask in the same infant at 4 months of age in the same figure, however. In other studies of cat cortex, Green et al. (1996) presented test and orthogonal mask stimuli at a single contrast value. They found almost mature cross-orientation masking at this single point on the CRF in single-unit recordings from 4-week-old kittens, 2 weeks earlier than Morrone et al. (1991) found evidence of onset of an effect. This was the only age Green et al. examined.
Possible mechanisms underlying development of orientation-selective pattern masking
We observe that pattern masking is relatively mature by 3 months of age for orthogonal (cross-oriented) targets, but that parallel (iso-orientation) interactions undergo longer development. This suggests that the two forms of masking are subserved by different mechanisms [Morrone et al. (1991) also reached this conclusion for inhibition in the cat for different reasons].
Foley's model has a different structure for parallel and orthogonal masks, and these structures may have different anatomical substrates. A recent two-process psychophysical model (Olzak and Thomas, 1999) is composed of a contrast normalization process followed by a second stage composed of two different sets of oriented filters. Iso-orientation masking in the Olzak and Thomas model involves a contribution from both sets, whereas cross-orientation masking involves only one set. If the two sets were supplied by separate rather than a common normalization stage, one could explain the current results as a difference in the developmental time course between the two sets.
Masking studies are required to examine nonlinear processes such as that underlying contrast normalization. Single inputs may not be sufficient to reveal the relevant nonlinearities. Mask inputs may form a sort of “silent surround” analogous to that surrounding the classical receptive field, and, by definition, the influence of the nonclassical surround only becomes apparent in the context of multiple inputs. Movshon et al. (2000) have recently reported using spatially separated test and mask stimuli. They found that orthogonal masks were more effective than parallel masks in infant macaques but that the opposite was true in adults. These data suggest that nonclassical surround organization may differ between infancy and adulthood, which may affect the inputs to the contrast normalization mechanism. Developmental studies of orientation masking in well characterized species such as cat or monkey will ultimately be needed to establish the basis for effects such as those we have observed in human infants.
Footnotes
This work was supported by National Institutes of Health Grant EY RO1-06579 to A.M.N. and a Rachel C. Atkinson Fellowship to A.M.S.
Correspondence should be addressed to Dr. T. Rowan Candy, Indiana University School of Optometry, 800 East Atwater Avenue, Bloomington, IN 47405-3680. E-mail: rcandy@indiana.edu.
REFERENCES
- 1.Albrecht DG, Geisler WS. Motion sensitivity and the contrast-response function of simple cells in the visual cortex. Vis Neurosci. 1991;7:531–546. doi: 10.1017/s0952523800010336. [DOI] [PubMed] [Google Scholar]
- 2.Albus K, Wolf W. Early post-natal development of neural function in the kitten's visual cortex: a laminar analysis. J Physiol (Lond) 1984;348:153–185. doi: 10.1113/jphysiol.1984.sp015104. [DOI] [PMC free article] [PubMed] [Google Scholar]
- 3.Atkinson J, Hood B, Wattam-Bell J, Anker S, Tricklebank J. Development of orientation discrimination in infancy. Perception. 1988;17:587–595. doi: 10.1068/p170587. [DOI] [PubMed] [Google Scholar]
- 4.Blakemore C, Van Sluyters RC. Innate and environmental factors in the development of the kitten's visual cortex. J Physiol (Lond) 1975;248:663–716. doi: 10.1113/jphysiol.1975.sp010995. [DOI] [PMC free article] [PubMed] [Google Scholar]
- 5.Blasdel G, Obermayer K, Kiorpes L. Organization of ocular dominance and orientation columns in the striate cortex of neonatal macaque monkeys. Vis Neurosci. 1995;12:589–603. doi: 10.1017/s0952523800008476. [DOI] [PubMed] [Google Scholar]
- 6.Bobak P, Bodis-Wollner I, Harnois C, Thornton J. VEPs in humans reveal high and low spatial contrast mechanisms. Invest Ophthalmol Vis Sci. 1984;25:980–983. [PubMed] [Google Scholar]
- 7.Bonds AB. Development of orientation tuning in the visual cortex of kittens. In: Freeman RD, editor. Developmental neurobiology of vision. Plenum; New York: 1979. pp. 31–41. [Google Scholar]
- 8.Bonds AB. Role of inhibition in the specification of orientation selectivity of cells in the cat striate cortex. Vis Neurosci. 1989;2:41–55. doi: 10.1017/s0952523800004314. [DOI] [PubMed] [Google Scholar]
- 9.Boynton GM, Foley JM. Temporal sensitivity of human luminance pattern mechanisms determined by masking with temporally modulated stimuli. Vision Res. 1999;39:1641–1656. doi: 10.1016/s0042-6989(98)00199-0. [DOI] [PubMed] [Google Scholar]
- 10.Braastad BO, Heggelund P. Development of spatial receptive-field organization and orientation selectivity in kitten striate cortex. J Neurophysiol. 1985;53:1158–1168. doi: 10.1152/jn.1985.53.5.1158. [DOI] [PubMed] [Google Scholar]
- 11.Braddick O. Orientation and motion selective mechanisms in infants. In: Simons K, editor. Early visual development, normal and abnormal. Oxford UP; New York: 1993. pp. 163–177. [Google Scholar]
- 12.Burr DC, Morrone MC. Inhibitory interactions in the human visual system revealed in pattern-evoked potentials. J Physiol (Lond) 1987;389:1–21. doi: 10.1113/jphysiol.1987.sp016643. [DOI] [PMC free article] [PubMed] [Google Scholar]
- 13.Burton GJ. Evidence for nonlinear response processes in the human visual system from measurement on the thresholds of spatial beat frequencies. Vision Res. 1973;13:1211–1225. doi: 10.1016/0042-6989(73)90198-3. [DOI] [PubMed] [Google Scholar]
- 14.Campbell FW, Kulikowski JJ. Orientational selectivity of the human visual system. J Physiol (Lond) 1966;187:437–445. doi: 10.1113/jphysiol.1966.sp008101. [DOI] [PMC free article] [PubMed] [Google Scholar]
- 15.Campbell FW, Maffei L. Electrophysiological evidence for the existence of orientation and size detectors in the human visual system. J Physiol (Lond) 1970;207:635–652. doi: 10.1113/jphysiol.1970.sp009085. [DOI] [PMC free article] [PubMed] [Google Scholar]
- 16.Candy TR, Skoczenski AM, Norcia AM. Paradoxical orientation masking in human infants. Invest Ophthalmol Vis Sci [Suppl] 1999;40:S349. [PubMed] [Google Scholar]
- 17.Carandini M, Heeger DJ, Movshon JA. Linearity and normalization in simple cells of the macaque primary visual cortex. J Neurosci. 1997;17:8621–8644. doi: 10.1523/JNEUROSCI.17-21-08621.1997. [DOI] [PMC free article] [PubMed] [Google Scholar]
- 18.Chino YM, Smith EL, III, Hatta S, Cheng H. Postnatal development of binocular disparity sensitivity in neurons of the primate visual cortex. J Neurosci. 1997;17:296–307. doi: 10.1523/JNEUROSCI.17-01-00296.1997. [DOI] [PMC free article] [PubMed] [Google Scholar]
- 19.DeValois RL, Yund EW, Hepler N. The orientation and direction selectivity of cells in the macaque visual cortex. Vision Res. 1982;22:531–544. doi: 10.1016/0042-6989(82)90112-2. [DOI] [PubMed] [Google Scholar]
- 20.Erwin E, Miller KD. Correlation-based development of ocularly matched orientation and ocular dominance maps: determination of required input activities. J Neurosci. 1998;18:9870–9895. doi: 10.1523/JNEUROSCI.18-23-09870.1998. [DOI] [PMC free article] [PubMed] [Google Scholar]
- 21.Foley JM. Human luminance pattern-vision mechanisms: masking experiments require a new model. J Opt Soc Am A. 1994;11:1710–1719. doi: 10.1364/josaa.11.001710. [DOI] [PubMed] [Google Scholar]
- 22.Foley JM, Chen CC. Analysis of the effect of pattern adaptation on pattern pedestal effects: a two-process model. Vision Res. 1997;37:2779–2788. doi: 10.1016/s0042-6989(97)00081-3. [DOI] [PubMed] [Google Scholar]
- 23.Geisler WS, Albrecht DG. Visual cortex neurons in monkeys and cats: detection, discrimination, and identification. Vis Neurosci. 1997;14:897–919. doi: 10.1017/s0952523800011627. [DOI] [PubMed] [Google Scholar]
- 24.Green ES, DeAngelis GC, Freeman RD. Development of inhibitory mechanisms in the kitten's visual cortex. Vis Neurosci. 1996;13:1109–1117. doi: 10.1017/s0952523800007756. [DOI] [PubMed] [Google Scholar]
- 25.Heeger DJ. Nonlinear model of neural responses in cat visual cortex. In: Landy M, Movshon JA, editors. Computational models of visual processing. MIT; Cambridge, MA: 1991. pp. 119–133. [Google Scholar]
- 26.Heeger DJ. Half-squaring in responses of cat striate cells. Vis Neurosci. 1992;9:427–443. doi: 10.1017/s095252380001124x. [DOI] [PubMed] [Google Scholar]
- 27.Held R, Yoshida H, Gwiazda J, Bauer J. Development of orientation selectivity measured by a masking procedure. Invest Ophthalmol Vis Sci [Suppl] 1989;30:312. [Google Scholar]
- 28.Howland HC, Atkinson J, Braddick O, French J. Infant astigmatism measured by photorefraction. Science. 1978;202:331–333. doi: 10.1126/science.694540. [DOI] [PubMed] [Google Scholar]
- 29.Jagadeesh B, Wheat HS, Kontsevich LL, Tyler CW, Ferster D. Direction selectivity of synaptic potentials in simple cells of the cat visual cortex. J Neurophysiol. 1997;78:2772–2789. doi: 10.1152/jn.1997.78.5.2772. [DOI] [PubMed] [Google Scholar]
- 30.Legge GE, Foley JM. Contrast masking in human vision. J Opt Soc Am. 1980;70:1458–1470. doi: 10.1364/josa.70.001458. [DOI] [PubMed] [Google Scholar]
- 31.LeVay S, Wiesel TN, Hubel DH. The development of ocular dominance columns in normal and visually deprived monkeys. J Comp Neurol. 1980;191:1–51. doi: 10.1002/cne.901910102. [DOI] [PubMed] [Google Scholar]
- 32.Manny RE. Orientation selectivity of 3-month-old infants. Vision Res. 1992;32:1817–1828. doi: 10.1016/0042-6989(92)90043-i. [DOI] [PubMed] [Google Scholar]
- 33.Maurer D, Martello M. The discrimination of orientation by young infants. Vision Res. 1980;20:201–204. doi: 10.1016/0042-6989(80)90103-0. [DOI] [PubMed] [Google Scholar]
- 34.Mohindra I, Held R, Gwiazda J, Brill S. Astigmatism in infants. Science. 1978;202:329–331. doi: 10.1126/science.694539. [DOI] [PubMed] [Google Scholar]
- 35.Morrone MC, Burr DC. Evidence for the existence and development of visual inhibition in humans. Nature. 1986;321:235–237. doi: 10.1038/321235a0. [DOI] [PubMed] [Google Scholar]
- 36.Morrone MC, Burr DC, Maffei L. Functional significance of cross-orientational inhibition. Pt I: Neurophysiology. Proc R Soc Lond [Biol] 1982;216:335–354. doi: 10.1098/rspb.1982.0078. [DOI] [PubMed] [Google Scholar]
- 37.Morrone MC, Speed HD, Burr DC. Development of visual inhibitory interactions in kittens. Vis Neurosci. 1991;7:321–334. doi: 10.1017/s0952523800004818. [DOI] [PubMed] [Google Scholar]
- 38.Movshon JA, Thompson ID, Tolhurst DJ. Spatial summation in the receptive fields of simple cells in the cat's striate cortex. J Physiol (Lond) 1978;283:53–77. doi: 10.1113/jphysiol.1978.sp012488. [DOI] [PMC free article] [PubMed] [Google Scholar]
- 39.Movshon JA, Kiorpes L, Cavanaugh JR, Hawken MJ. Developmental reorganization of receptive field surrounds in V1 neurons in macaque monkeys. Invest Ophthalmol Vis Sci [Suppl] 2000;41:S333. [Google Scholar]
- 40.Murray IJ, Kulikowski JJ. VEPs and contrast. Vision Res. 1983;23:1741–1743. doi: 10.1016/0042-6989(83)90193-1. [DOI] [PubMed] [Google Scholar]
- 41.Nakayama K, Mackeben M. Steady-state visual evoked potentials in the alert primate. Vision Res. 1981;22:1261–1271. doi: 10.1016/0042-6989(82)90138-9. [DOI] [PubMed] [Google Scholar]
- 42.Norcia AM, Tyler CW. Spatial frequency sweep VEP: visual acuity during the first year of life. Vision Res. 1985;25:1399–1408. doi: 10.1016/0042-6989(85)90217-2. [DOI] [PubMed] [Google Scholar]
- 43.Norcia AM, Tyler CW, Hamer RD. Development of contrast sensitivity in the human infant. Vision Res. 1990;29:627–637. doi: 10.1016/0042-6989(90)90028-j. [DOI] [PubMed] [Google Scholar]
- 44.Olzak LA, Thomas JP. Neuronal recoding in human pattern vision: model and mechanisms. Vision Res. 1999;39:231–256. doi: 10.1016/s0042-6989(98)00122-9. [DOI] [PubMed] [Google Scholar]
- 45.Pelli DG, Zhang L. Accurate control of contrast on microcomputer displays. Vision Res. 1991;31:1337–1350. doi: 10.1016/0042-6989(91)90055-a. [DOI] [PubMed] [Google Scholar]
- 46.Phillips GC, Wilson HR. Orientation bandwidths of spatial mechanisms measured by masking. J Opt Soc Am A. 1984;1:226–232. doi: 10.1364/josaa.1.000226. [DOI] [PubMed] [Google Scholar]
- 47.Regan D, Regan MP. Nonlinearity in human visual responses to two-dimensional patterns, and a limitation of Fourier methods. Vision Res. 1987;27:2181–2183. doi: 10.1016/0042-6989(87)90132-5. [DOI] [PubMed] [Google Scholar]
- 48.Regan D, Regan MP. Objective evidence for phase-independent spatial frequency analysis in the human visual pathway. Vision Res. 1988;28:187–191. [PubMed] [Google Scholar]
- 49.Reid RC, Soodak RE, Shapley RM. Linear mechanisms of directional selectivity in simple cells of cat striate cortex. Proc Natl Acad Sci USA. 1987;84:8740–8744. doi: 10.1073/pnas.84.23.8740. [DOI] [PMC free article] [PubMed] [Google Scholar]
- 50.Reid RC, Soodak RE, Shapley RM. Directional selectivity and spatiotemporal structure of receptive fields of simple cells in cat striate cortex. J Neurophysiol. 1991;66:505–529. doi: 10.1152/jn.1991.66.2.505. [DOI] [PubMed] [Google Scholar]
- 51.Robson JG. Linear and nonlinear operations in the visual system. Invest Ophthalmol Vis Sci [Suppl] 1988;29:117. [Google Scholar]
- 52.Schiller PH, Finlay BL, Volman SF. Quantitative studies of single-cell properties in monkey striate cortex. II. Orientation specificity and ocular dominance. J Neurophysiol. 1976;39:1320–1333. doi: 10.1152/jn.1976.39.6.1320. [DOI] [PubMed] [Google Scholar]
- 53.Seiple WH, Kupersmith MJ, Nelson JI, Carr RE. The assessment of evoked potential contrast thresholds using real-time retrieval. Invest Ophthalmol Vis Sci. 1984;25:627–631. [PubMed] [Google Scholar]
- 54.Sherk H, Stryker MP. Quantitative study of cortical orientation selectivity in visually inexperienced kittens. J Neurophysiol. 1976;39:63–70. doi: 10.1152/jn.1976.39.1.63. [DOI] [PubMed] [Google Scholar]
- 55.Skoczenski AM, Candy TR, Norcia AM. Orientation masking identifies a late immaturity in infant pattern vision. Invest Ophthalmol Vis Sci [Suppl] 1998;39:S1089. [Google Scholar]
- 56.Slater A, Morison V, Somers M. Orientation discrimination and cortical function in the human newborn. Perception. 1988;17:597–602. doi: 10.1068/p170597. [DOI] [PubMed] [Google Scholar]
- 57.Tang Y, Norcia AM. An adaptive filter for the steady-state VEP. Electroencephalogr Clin Neurophysiol. 1995;96:268–277. doi: 10.1016/0168-5597(94)00309-3. [DOI] [PubMed] [Google Scholar]
- 58.Tolhurst DJ, Heeger DJ. Comparison of contrast-normalization and threshold models of the responses of simple cells in cat striate cortex. Vis Neurosci. 1997;14:293–309. doi: 10.1017/s0952523800011433. [DOI] [PubMed] [Google Scholar]
- 59.Victor JD, Mast J. A new statistic for steady-state evoked potentials. Electroencephalogr Clin Neurophysiol. 1991;78:378–388. doi: 10.1016/0013-4694(91)90099-p. [DOI] [PubMed] [Google Scholar]
- 60.Wiesel TN, Hubel DH. Ordered arrangement of orientation columns in monkeys lacking visual experience. J Comp Neurol. 1977;158:307–318. doi: 10.1002/cne.901580306. [DOI] [PubMed] [Google Scholar]
- 61.Wilson HR. A transducer function for threshold and suprathreshold human vision. Biol Cybern. 1980;38:171–178. doi: 10.1007/BF00337406. [DOI] [PubMed] [Google Scholar]
- 62.Wilson HR. Development of spatiotemporal mechanisms in infant vision. Vision Res. 1988;28:611–628. doi: 10.1016/0042-6989(88)90111-3. [DOI] [PubMed] [Google Scholar]


