

Abstract
To investigate the dynamic aspects of gustatory activity, we recorded the responses of small ensembles of cortical neurons to tastants administered to awake rats. Multiple trials of each tastant were delivered during recordings made in oral somatosensory (SI) and gustatory cortex (GC). When integrated tastant responses (firing rates averaged across 2.5 sec) were compared with water responses, 14.4% (13/90) of the GC neurons responded in a taste-specific manner. When time was considered as a source of information, however, the incidence of taste-specific firing increased: as many as 41% (37/90) of the recorded GC neurons exhibited taste-specific patterns of response. For 17% of the neurons identified as responding with taste-specific patterns, the stimulus that caused the most significant response was a function of the time since stimulus delivery. That is, a single neuron might respond most strongly to one tastant in the first 500 msec of a response and then respond most strongly to another tastant later in the response. Further analysis of the time courses of GC and SI cortical neural responses revealed that modulations of GC firing rate arose from three separable processes: early somatosensory input (less than ∼0.2 sec post-stimulus), later chemosensory input (∼0.2–1 sec), and delayed somatosensory input related to orofacial responses (more than ∼1.0 sec). These data demonstrate that sensory information is available in the time course of GC responses and suggest the viability of views of gustatory processing that treat the temporal structure of cortical responses as an integral part of the neural code.
Keywords: insular, taste, palatability, hedonics, multiple electrode, coding
As a rat feeds, multimodal sources of information concerning the food on its tongue are synthesized into a gustatory percept. How this is accomplished is unclear. It is known that subsets of neurons in gustatory insular cortex (GC) respond to the presence of tastants on the tongue with sustained changes in firing probability (Yamamoto et al., 1985, 1989; Kosar et al., 1986; Cechetto and Saper, 1987; Ogawa et al., 1990; Hanamori et al., 1998). Taste specificity of these neurons is typically deduced on the basis of averaged firing over the seconds after tastant delivery. The responses of a neuron to tastants are thus described as a single number. Current theories of gustatory coding treat this single number as the appropriate measure of the response of a single gustatory neuron.
There are at least two reasons to develop more dynamic descriptions of gustation. First, neurons from many other sensory systems produce spatiotemporally structured responses (McClurkin et al., 1991; Laurent, 1999; Covey, 2000; Ghazanfar and Nicolelis, 2001) and receptive fields (Ringach et al., 1997; deCharms et al., 1998; Ghazanfar and Nicolelis, 1999). Temporal aspects of sensory responses have proven rich in information, permitting researchers to determine stimulus identity and detect multiplexing of information within a spike train (Sugase et al., 1999; Christensen et al., 2000).
Second, temporal analyses may allow researchers to identify the origins of different contributions to GC activity. Many GC neurons are multimodal, responding to both gustatory and somatosensory stimulation of the intraoral region (Yamamoto et al., 1989; Ogawa et al., 1990; Hanamori et al., 1998). This multimodality complicates the interpretation of GC responses, making it difficult to discriminate chemosensitivity from somatosensitivity. This is a particularly acute problem in awake animals, which produce tastant-specific orofacial behaviors [that in turn lead to tastant-specific patterns of somatosensory stimulation in the oral cavity (Grill and Norgren, 1978;Spector et al., 1988)]. Such patterns may “masquerade” as chemosensory activity in an averaged post-stimulus response, but may be distinguished from “true” chemosensitivity through analysis of temporal response properties.
In this study, we have quantified the temporal aspects of GC single-unit responses to several tastants. Bundles of microwires were implanted into rat oral somatosensory cortex and GC, and the responses of single neuron ensembles were measured and analyzed while the rats received multiple intraoral administrations of NaCl, sucrose, citric acid, quinine, and nicotine. Fourteen percent of the GC neurons responded in a taste-specific manner according to analysis of the overall firing rate, but when temporal aspects of the responses were taken into account, that number rose to 41%. Often, the stimulus causing the strongest response changed with post-stimulus time. Moreover, the combination of response timing, taste specificity, and the presence or absence of spectral power in the range of the licking rhythm (5–10 Hz) allowed chemosensory and somatosensory influences to be identified. The temporal aspects of GC responses offer new insights into how the rats may identify tastants on the tongue.
MATERIALS AND METHODS
Subjects. All procedures were in accordance with the National Institutes of Health guidelines for the treatment of animal subjects and were conducted in compliance with Duke University Medical Center animal use policies and were approved by the Duke University Institutional Animal Care and Use Committee. Male (n = 3) and female (n = 8) Long–Evans rats (weight 250–300 gm) were used as subjects for this study. Because the phenomena reported here were observed in both male and female rats, data will be discussed without further reference to gender. The colony was maintained on a 12 hr light/dark cycle, with sessions run at approximately the same time each day, during the light portion of the cycle. Rats were given ad libitum access to food at all times, but water access was restricted during training and recording sessions (see below).
Surgery. Animals were anesthetized using a 5% halothane/air mix, followed by either an intraperitoneal injection of pentobarbital (50 mg/kg; female rats) or intramuscular injections of ketamine and xylazine (100 and 10 mg/kg, respectively; male rats). Anesthesia was maintained with small additional injections. Anesthetized animals were secured in a stereotaxic frame using atraumatic ear bars. After the scalp was excised, holes were bored in the skull for four to six ground screws and for one or two microelectrode bundles.
Each electrode bundle included 16 microwires, either 50 μm Teflon-coated stainless steel wire (NBLabs, Denison, TX) or 25 μm Formvar-coated nichrome wire. These latter wires were glued to a small microdrive, such that they could be advanced through the brain in the weeks after surgery (Katz et al., 2001). After resection of the dura, bundles were lowered slowly into layer 5 of GC—or in the case of moveable bundles, into somatosensory cortex 2 mm dorsal to GC—guided by stereotaxic measurements and constant electrophysiological monitoring of the signals from the electrodes. Once in position, the assemblies were cemented to the skull with dental acrylic, as was a restraining head bolt. The scalp was then sutured or stapled around the implant, and antibiotic ointment was applied liberally to the wound.
Most rats were implanted with two intraoral cannulas (Phillips and Norgren, 1970), one on each side of the face. Thin polyethylene tubes extended from the space between the first maxillary molar and the lip, through the masseter muscle and inside the zygomatic arch, and out through the opening in the scalp. The intraoral cannulas permitted the delivery of controlled doses of tastant directly onto the dorsal surface of the rats' tongues.
Behavioral procedures. After surgery the rats were adapted to handling and were started on a regimen of mild water restriction (45 min access per day in the home cage). Adapted animals were trained to press a lever once every 30 sec to receive 40 μl of water, ejected either from an intraoral cannula or from a nozzle in front of the mouth, while they were immobilized in a specially made Plexiglas restraint box (Welsh et al., 1995; Bermejo et al., 1996; Nishijo et al., 1998). The backs of the rats' head caps were bolted to an eyelet in the front panel of the box, the height of which could then be adjusted to minimize the animals' discomfort. The rats' front paws were unrestrained.
Once the animal was trained to lever press on the fixed interval schedule, the tastant protocol was substituted for the water protocol. In the case of delivery from a nozzle (which necessitated that the rat's mouth be open), a lever press was rewarded alternatively with either a randomly selected tastant or a water rinse. With the use of the intraoral cannulas, stimuli were delivered under experimenter control. With either technique, the interval between trials varied randomly between 45 and 75 sec. Every second trial was an 80 μl water rinse (delivered, in the case of intraoral cannulation, through the second cannula).
Under such circumstances the rats remained calm and responsive for at least 2 hr and still drank between 10 and 15 ml of water in their home cages during the 30 min after the session. The differences between delivery techniques presumably affect many aspects of the animals' behavior and responses, but no differences with regard to the data presented here were noted. Previous research (Nishijo and Norgren, 1991) corroborates our observation that to at least a first approximation, different delivery methods produce similar responses.
Tastants included citric acid (0.02 m), NaCl (0.1m), sucrose (0.1 m), quinine HCl (0.001m), nicotine (0.01 m), and water (separate from its use as a rinse between tastants) delivered through a nitrogen-pressurized system of polyethylene tubes; flow was controlled by solenoid valves opened by a computer-produced transistor–transistor logic (TTL) pulse. These tastants were chosen to be representative of salty, sour, sweet, and bitter. The concentrations approximate or somewhat exceed half-maximal stimulus intensities (Frank et al., 1983,1988; our unpublished observations). At least 10 trials (and as many as 30) were delivered per tastant.
Electrophysiology. Neural recordings began only after the animal was adapted to restraint and pressing for water reward. Differentiated neural signals were fed into a parallel processor capable of digitizing up to 48 such signals simultaneously at 40 kHz per channel (Plexon, Dallas, TX). Action potentials of no less than 3:1 signal-to-noise ratio were isolated on-line from each signal. Our criterion for isolation combined an amplitude criterion with a waveform template algorithm (Nicolelis et al., 1999). Using these criteria, we routinely held neurons throughout each 2–3 hr session. Time-stamped records of stimulus onset and neuronal spikes were saved digitally, as were all sampled spike waveforms. Off-line reanalysis incorporating cluster cutting techniques (before substantive analysis of taste-related activity; see below) confirmed or corrected on-line discriminations. In the off-line analysis, a group of waveforms was classified as a single neuron only if it produced discrete clusters of exemplars in a space made up of principle components 1 and 2, and if its interspike interval plot showed a recognizable refractory period followed by a sloping increase to a maximum at >3 msec (see Fig. 2).
Fig. 2.

A simultaneously recorded set of gustatory cortical neurons. A, Responses to different tastants are arrayed horizontally, and different neurons are arrayed vertically (Neurons 1-3). Raster plots for individual trials are stacked above the summary PSTHs, in which the ordinates are spikes per second. Note that the number of trials delivered differed for different tastants, such that the height of individual rasters differs between panels. The vertical lines at the 0 sec time point on the abscissasrepresent the time at which the tastant hit the tongue.B, The waveforms and interspike interval plots (abscissa is time after spike in milliseconds;ordinate is number of spikes) for the neurons (Neurons 1-3) in A, demonstrating that each isolation was a single neuron.
Data reported here were collected from electrodes buried deep in GC (dysgranular insular cortex: anteroposterior 1.2–1.5, mediolateral 5.2, dorsoventral, approximately −4.5 from dura) (Kosar et al., 1986). Rats with moveable electrodes were sometimes run in two recording sessions: once when the electrode tips were in oral SI, at least 1 mm above GC, and once again when the electrode tips were in GC. Each neuron was recorded for one session only.
Single-neuron analysis. Comparison of 2.5 sec of post-stimulus activity (a length that allowed substantial response analysis) to various taste stimuli was done in a series of steps, all of which began with “correction” of the responses: the subtraction of prestimulus firing rates from post-stimulus rates on a trial-by-trial basis. First, the corrected average firing rates across the 2.5 sec of post-stimulus activity across trials (this amount of post-stimulus time was chosen to limit data set size, although not excluding interesting periods of the responses) were compared with water responses via t tests and one-way ANOVAs. Stringent criterion α-values (p < 0.002) were used to compensate for the large number of comparisons; these conservative confidence intervals limited the occurrence of false positives. Next, the corrected responses were divided into 500 msec bins of activity, and the distribution of firing frequency between time bins that were averaged across trials was compared with that of water using the χ2 independence of distribution test. In cases in which frequency counts in particular bins were <5, Fisher's Exact Difference test was used. Repeated-measures ANOVAs for tastant and time further quantified the difference in tastant-specific response patterns. Again, required significance values were adjusted to reflect the number of comparisons.
Third, and finally, an even more precise estimate of the time course of responses was gained using a moving-average analysis of the peristimulus time histograms (PSTHs). For this analysis, the firing rate across a short window of time was calculated, then the window was moved one spike forward, and another firing rate was calculated, and so on. The size of the window was scaled to the firing rate of the neuron being analyzed (the window actually spanned a certain percentage of the spikes in the spike train, rather than spanning a certain number of time bins), such that fast changes during periods of relatively high firing rates were not ignored. The result of this procedure amounted to a smoothed PSTH, a pseudo-continuous record of the firing rate of a neuron from 1.5 sec before to 2.5 sec after stimulus onset. This analysis allowed identification of the occurrence of a firing rate modulation as well as of the onset time of this modulation (see below). Significance testing involved computing the mean and SD for all points before the stimulus; post-stimulus firing was then compared with prestimulus firing. If post-stimulus firing was continuously above or below the 99% confidence interval for the t distribution on the basis of the mean and SD for the prestimulus period, it was identified as a candidate significant firing rate modulation [for examples of this type of analysis, see Ellaway (1978), Churchward et al. (1997), Tracy and Steinmetz (1998), and Blejec (2000)]. To ensure that random variations in firing rate were not falsely identified as modulations, periods of post-stimulus firing were accepted as significant only if they were more than three times the length of any peaks in the prestimulus record; that is, they were required to be much larger than the random fluctuations observed before stimulus onset.
Because this technique smoothes PSTHs, firing rate modulations began slightly earlier (and ended slightly later) in the pseudo-instantaneous record than in the raw data. This slight broadening was taken into account in the estimation of modulation onset times: first, the time at which the pseudo-instantaneous firing rate exceeded the confidence interval was noted, then one-half of the length of the window used to construct the moving average was added to this time, and this new time was designated to be the onset time of the modulation. This calculation of modulation onset time approximately corrected for the effect of smoothing.
In all cases, latencies were adjusted for the physical delays between the TTL triggering of the delivery solenoid and the time at which fluid hit the tongue. The stimulus delivery apparatus was placed an appropriate distance from an “artificial rat tongue” (two bare wire tips, separated by 1 mm of air, that were the ends of an open circuit including a battery and oscilloscope); the second input to the oscilloscope monitored the TTL pulse to the fluid-delivery solenoid. NaCl was delivered, connecting and completing the battery circuit, and the resultant delay between solenoid opening and stimulus hitting the tongue could be viewed on the oscilloscope. In the case of delivery via an intraoral cannula, this delay was reliably 45 msec (±4 msec); in the case of nozzle delivery (which had to be placed further from the tongue), the delay was 90 msec (±7 msec). Under these circumstances, the zero time point on the PSTH abscissas properly reflected the approximate time at which tastants hit the tongue.
Frequency analysis of spike trains was performed using a standard fast Fourier transform of the point process data. Session-long spike trains were entered into this analysis. Most of these data, therefore, represent “spontaneous” activity of the neurons or, more exactly, neural activity that was related to the rats' general behavioral traits, which included licking and grooming. For comparisons between spectra, power was normalized.
Histology. After the last recording session, rats were deeply anesthetized with sodium pentobarbital (150 mg/kg) and perfused through the heart with 0.9% saline (PBS) followed by 5% Formalin in PBS. In preparation for histology, 7 sec of DC current (7 μA) was passed through selected microwires, marking the area below the electrode tips. After fixation in a 10% sucrose and 10% Formalin solution, 80 μm sections were cut through the implanted areas. Cell bodies were labeled using cresyl violet. This technique, in conjunction with careful notation of electrode movement, allowed for localization of all recording sites.
RESULTS
Histology
Figure 1 shows a both a schematic diagram and a coronal section through the rat cortex containing two representative recording sites. The arrow points to the hole created by the lesion of the electrode tips, immediately ventral to a spot at which taste-related neural activity was recorded. Theasterisk labels the location at which somatosensory responses had been recorded 1–3 weeks previously.
Fig. 1.
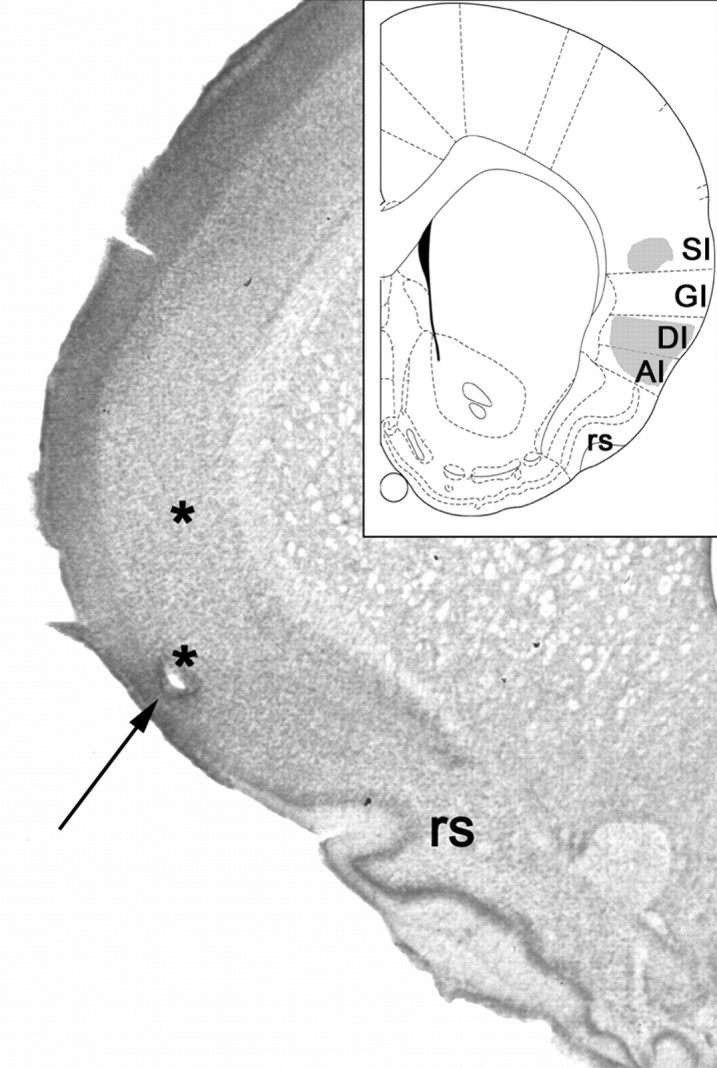
Localization of electrode bundles in rat SI and GC. The arrow points to the hole just above the rhinal sulcus, where the microwire tips rested at the time of perfusion. Theasterisks above this site mark the approximate position of the electrode tips when GC and oral SI recordings were made.Inset, The shaded areas in this schematic, adapted from Paxinos and Watson (1997), demarcate the limits of the regions from which recordings were made. GI, Granular insular cortex; DI, dysgranular insular cortex;AI, agranular insular cortex; SI, oral somatosensory cortex; rs, rhinal sulcus.
Summary of the neural dataset
Eleven rats (3 male, 8 female) provided 15 data sessions, of which 13 provided data from GC and 2 from oral SI. The total sample consisted of 107 neurons, of which 90 were in GC (mean/rat = 6.9; range 4–11) and 17 were in SI (mean = 8.5; range 7–10). Spontaneous firing rates were generally low, with the median below 1 spikes/sec; outliers (presumably interneurons) with firing rates as high as 40 spikes/sec raised the mean spontaneous firing rate to 4.8 spikes/sec.
Nine of the sessions, including both of the somatosensory cortical sessions, involved bilateral recordings. The average number of neurons isolated per bundle was 4.5, with a range of two to eight. Except as noted, all of the below results pertain to the gustatory cortical sample.
Basic characterization of gustatory activity: integrated responses
Figure 2A presents raster plots and associated PSTHs for three simultaneously recorded GC neurons. Several tastant-specific responses can be seen in the sample (and are validated by the moving window analysis of firing rate described in Materials and Methods). Neuron 1 responded to NaCl and acid (albeit with slightly different latencies), whereas neuron 2 responded to quinine at 1 sec and to acid at 1.25 sec. Neuron 3 produced different inhibitory responses to various tastants. That is, its firing was tonically inhibited by NaCl, acid, and water, but at different post-stimulus times for each. These inhibitory responses are made plain by the aggregation of several trials per stimulus. In general, however, the low spontaneous firing rates observed in GC makes it more difficult to detect statistically significant inhibition than excitation. This is evidenced by the fact that the slightly less consistent inhibition after sucrose administration (note the trial-to-trial raster differences) failed to reach statistical significance.
The most basic analysis confirmed that GC neurons responded to somatosensory or gustatory stimulation, or both. For this analysis, the average firing rates for the 2.5 sec periods after stimulus presentations were standardized by firing rates calculated from equivalent prestimulus periods on a trial-by-trial basis (see Materials and Methods). Neurons were determined to be taste-specific if the overall firing rate in the 2.5 sec after stimulus delivery was significantly different for at least one tastant than for water (byt test; see Materials and Methods). According to this metric, 14.4% of the sample (13/90) responded to gustatory stimulation in a taste-specific manner (p < 0.002; allt > 3.6). The spontaneous firing of these neurons (mean 8.3 spikes/sec; range 0.01–26 spikes/sec) was not significantly different from that for non-taste-specific neurons.
Of these 13 taste-specific neurons, 9 (10% of the entire GC sample) responded predominantly with an excitatory firing rate change, and 4 (4.4% of the total) responded predominantly with an inhibitory firing rate change. Because both excitatory and inhibitory changes were observed, absolute response was used to derive the “best stimulus” for each neuron. Five neurons were NaCl-best (three excitatory, two inhibitory), three were acid-best (two excitatory, one inhibitory), two were sucrose-best (one excitatory, one inhibitory), two were quinine-best (both excitatory), and one was nicotine-best (excitatory). The percentage of GC neurons that responded to a subset of tastants according to this metric is similar to percentages (i.e., ∼10%) reported for other cortical data sets (Yamamoto et al., 1985; Kosar et al., 1986; Cechetto and Saper, 1987; Yamamoto et al., 1989; Ogawa et al., 1990; Hanamori et al., 1998).
In Figure 3, which summarizes this analysis, the 13 taste-specific neurons are arranged 1 per column, with responses to a particular tastant in each row, and the strongest tastant response for each neuron is marked with a filled bar. “Sucrose-best” neurons are listed first, in descending order of absolute response. “Quinine-best” neurons are listed next, followed by “NaCl-best,” “citric acid-best,” and “nicotine-best” neurons. The significance of these inhibitory responses becomes evident only through the application of multiple trials per tastant.
Fig. 3.

Taste-related GC responses by 2.5 sec averages.Bars represent spikes per second, averaged from 2.5 sec of post-stimulus response, and corrected for prestimulus firing rates. The responses of each neuron to the five tastants are arrayed vertically. The filled bars denote the strongest absolute response of that neuron, that is, the best tastant. The first two neurons (Neurons 1-2) are sucrose-best, the next two (Neurons 3-4) are quinine-best, the next five (Neurons 5-9) are NaCl-best, the next three (Neurons 10-12) are acid-best, and the last (Neuron 13) is nicotine-best.
We considered the possibility that because water evokes a response in some GC neurons (Yamamoto et al., 1989), some neurons with taste-specific responses might have been missed by the ttest analysis. We repeated the basic analysis of the responses of each neuron using one-way ANOVAs for all possible tastants, including water. This analysis revealed, for each neuron, whether the response to any particular stimulus differed from that to other stimuli (whereas thet test analysis revealed whether any tastant response differed from that to water). The sample of taste neurons revealed by this analysis was similar to that revealed by t test: 17.7% of our sample (16 neurons) responded to some subset of the stimuli (including the 13 shown in Fig. 3). For the three other neurons revealed as tastant-specific by ANOVA, the responses to water were intermediate in size to the responses to different tastants, and only the strongest and weakest tastant responses differed significantly from each other.
Reevaluation of gustatory responses using 500 msec bins
Complexities of the GC response are not revealed in the overall average firing rates, because the spike rate averages deemphasize and even mask reliable but phasic modulations of firing rate (Fig.2A). Moreover, if only the overall rate is used to deduce gustatory responses, periods of relative excitation and inhibition in a response may cancel out one another (note that in Fig.5, neither unit 7a nor 17b qualified as tastant specific by analysis of the overall firing rate).
Fig. 5.

Temporal coding in an ensemble of three simultaneously recorded GC neurons. Time before and after stimulus delivery is displayed along the abscissas. Theordinate is number of spikes per second. The firing rates during periods marked with solid lines were significantly above baseline, as calculated using a moving window (see Materials and Methods). The dashed lines indicates below-baseline firing rates. The vertical dashed linesmark stimulus onsets.
The delivery of multiple trials made it possible to examine the neural responses more closely and to discern within them distinct epochs of firing rate modulation. We reexamined GC responses with post-stimulus time divided into 500 msec bins. Figure 4displays examples of this reanalysis, showing the gustatory responses of two GC neurons for each 0.5 sec bin. The responses of the neurons changed from bin to bin. These changes, in fact, were the rule rather than the exception. Indeed, 27.8% (25/90) of the GC sample showed reliable taste-specific responses when analyzed using χ2 and Fisher's Exact tests [p < 0.005, all χ2 (4) >21.95]. This group included 8 of the 13 neurons labeled as taste neurons on the basis of their overall firing rates, but 22% (17/77) of the neurons that were not classified as taste specific according to their overall firing rate exhibited response patterns that differed from their water responses. Five of the neurons that were identified as tastant specific by overall firing rate were not identified by χ2 and Fisher's tests as having a tastant-specific pattern of firing; the tastant-specific responses of these neurons were stable across bins. Overall, 33.3% (30/90) of the GC neurons were taste specific according to either their overall firing rate or the time course of their firing rate modulations (Table1).
Fig. 4.
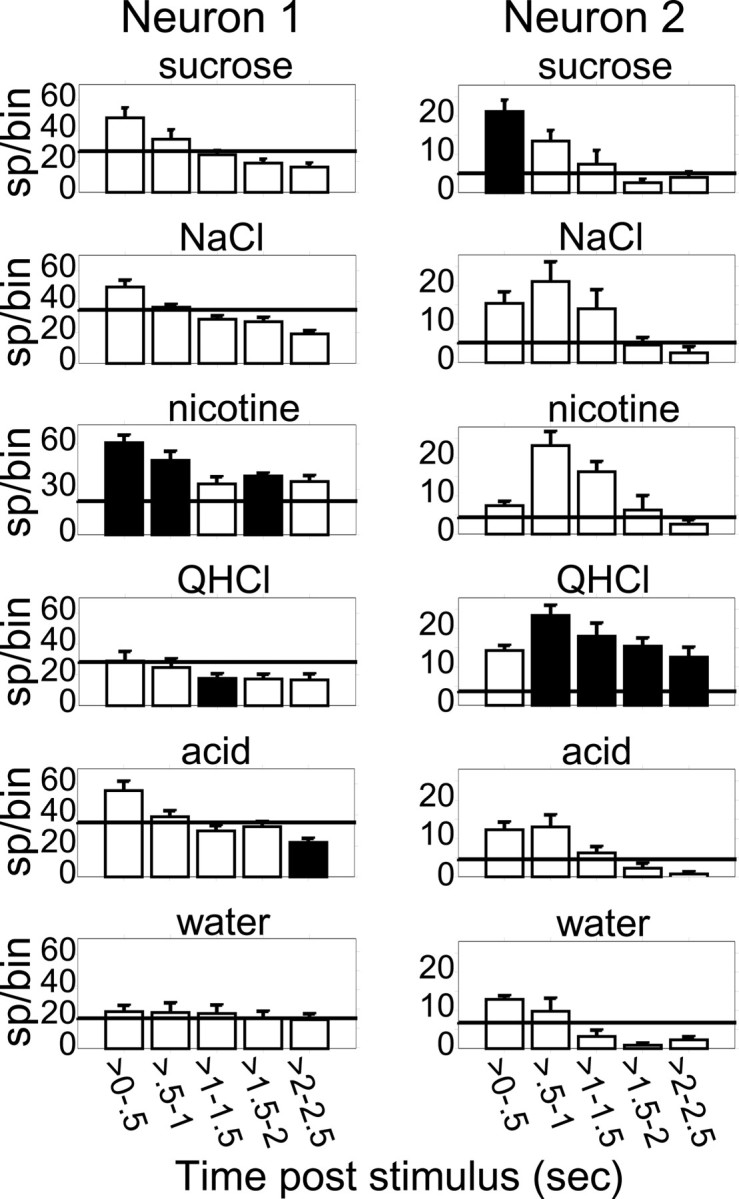
The time courses of gustatory responses in two GC neurons. The bin size is 500 msec, and error bars represent trial-wise SEMs. The horizontal line in each panel shows the average prestimulus firing rates. Filled bars represent the strongest response in that particular time bin. Neuron 1 responded to all tastants but not to water. The pattern of response (an initial excitation followed by a decline of activity over time) was similar for each tastant, but the amount of excitation varied between tastants (being greatest for nicotine and least for quinine), such that the tastant producing the most significant firing rate modulation differed at different time points. Neuron 2produced a small, time-varying response to water but produced large responses to all tastants (except acid). The responses to different tastants had different time courses, peaking earlier for sucrose than for other tastants, and peaking higher in the 0.5–1 sec bin for quinine and nicotine than for NaCl. Again, the strongest responses varied with time.
Table 1.
Proportion of GC neurons with taste-specific responses, by three different analysis methods
| Analysis method | % (number) of cells with taste-specific responses (n = 90) |
|---|---|
| Overall firing rate average (2.5 sec) | |
| Total | 14.4% (13) |
| Excitatory | 10% (9) |
| Inhibitory | 4.4% (4) |
| Binned responses (500 msec) | |
| Total | 33.3% (30) |
| Time course only | 18.9% (17) |
| Both time course and overall rate | 8.9% (8) |
| Total by time course | 27.8% (25) |
| Overall firing rate only | 5.5% (5) |
| Continuous estimate of firing rate | |
| Total | 41.1% (37) |
| Running average only | 26.7% (24) |
| Both running average and overall rate | 8.9% (8) |
| Total by running average | 35.6% (32) |
| Overall firing rate only | 5.5% (5) |
Tastant-specific GC responses could be thought of as spanning the range between the two extremes epitomized by the responses seen in Figure 4. At one extreme were responses to tastants that differed in shape from that to water, but differed from each other only in magnitude. For example, neuron 1 was unresponsive to water but responded to all tastants with an initial increase and subsequent decline of firing rate. At the other extreme were taste-specific neurons (e.g., neuron 2) that had multiple response shapes, such that responses differed not only between tastants and water, but also between the tastants themselves. For neuron 2 the response to sucrose starts high and declines, whereas the response to nicotine starts low, builds, and then declines. The citric acid response is stable across the first second and then declines (but not as quickly as does the water response).
To test whether GC neurons responded to different tastants with differently timed patterns of action potentials, we analyzed data from the 25 taste-specific neurons (normalized to prestimulus firing) in two-way ANOVAs (one per neuron) with time bins and tastants as the factors. The appearance of significant time × tastant interactions was taken as evidence for temporal differences between tastant responses. This analysis revealed that 40% (10/25) of the neurons with taste-specific firing patterns produced different across-bin response “shapes” (that is, different patterns of firing rate change from bin to bin) to different tastants (p < 0.05; all F > 5.19).
The temporal aspects of the GC responses are also reflected in the dynamic quality of their chemosensory profiles (that is, the order of effectiveness of the tastants). We calculated the “best tastant” (the stimulus that induced the strongest response) for each neuron at each bin of time. To take the trial-to-trial variability in firing into account, t values were used to measure strength of response instead of raw firing rates. For both of the neurons displayed in Figure 4, the best tastant appeared to change between bins. For instance, neuron 1 could be described as a nicotine-best neuron for the first two bins, but by bin 3 the response to quinine was inhibited to a degree that was larger in t value than the excitation caused by nicotine, and in bin 5 the response to acid was inhibited even further. Neuron 2, meanwhile, started as a sucrose-best cell and became a quinine-best cell soon thereafter. Each of the 10 neurons with multiple response shapes had time-varying best stimuli, as did 5 of the neurons that did not demonstrate significantly different response shapes between tastants. This finding suggests that, at best, the overall firing rate provides a characterization of GC neurons that throws away potentially useful information about tastant responses (see Discussion).
The continuous time course of GC responses
Although partitioning GC responses into 500 msec bins allowed us to observe temporal aspects of tastant responses and dynamic neural response profiles, it nonetheless represents a coarse look at the time course of gustatory activity and obscures precise onset times of firing rate changes. To examine more closely the temporal responses of our GC neurons (and to minimize the effect of arbitrary bin sizes), firing probabilities were again reanalyzed, this time using a moving-average analysis. This analysis provided a pseudo-continuous quantification of firing rate and permitted us to identify the occurrence of each significant firing rate change. Significant shifts in firing rate were considered stimulus specific only if the responses to other tastants were not strongly tending in the same direction at the same time.
This analysis slightly increased the proportion of the neural sample that could be identified as taste specific to 35.6% (32/90). This means that 35.6% of the neurons responded significantly to at least one tastant in at least one time period after stimulus onset during which the neuron did not respond to other tastants or to water. Again, these neurons could not be distinguished from the rest of the GC neurons on the basis of spontaneous firing rates. When neurons were included that were tastant specific by overall firing rate but not by pattern, an overall 41% (37/90) of the sample consisted of neurons with taste-specific response properties. Table 1 summarizes the findings across analysis method.
Figure 5 presents the responses of three simultaneously recorded GC neurons, each of which responded in a temporally complex and tastant-specific way. Solid linesappear above the PSTHs during periods of statistically significant excitation, and dashed lines indicate significant inhibition. Neuron 7a, which did not respond in a tastant-specific manner according to an analysis of overall firing rates, produced an initial inhibition in response to all tastants, but produced late excitation only in response to citric acid, sucrose, quinine, and nicotine. The early inhibition caused by NaCl lasted more than twice as long as that caused by water. Neuron 17b, meanwhile, responded to sucrose with an early, brief excitation, and to quinine and nicotine with similar early inhibition. NaCl caused brief inhibition as well, albeit slightly later. The initial response to water was deeply inhibitory and grew less so with post-stimulus time. Inhibition also emerged late in the NaCl, citric acid, and quinine responses. The taste specificity of neuron 17b cannot be observed when the post-stimulus period is considered as a single number reflecting the average firing rate across a 2.5 sec post-stimulus interval.
Another variant of tastant-specific time course of firing can be seen in neuron 24a. The general response pattern of this neuron is similar to all stimuli: a sharp excitatory response followed by moderate steady-state excitation. The magnitudes and time courses of the responses, however, differ between tastants. In particular, the response to water in the first 500 msec is smaller than that of citric acid and sucrose (by t test; p < 0.002), but at later times all responses are similar. This temporal effect is not reflected in 2.5 sec firing rate averages. In summary, we found that even neurons that responded with similar modulations to more than one stimulus often showed tastant-specific time courses of response. Such temporal specifics were identified in 36% of these GC neurons (Table 1).
Sources of gustatory activity reflected in response dynamics
One value of the moving-average representation of firing rate is that it permits investigation into the onset times of firing rate changes and therefore into whether GC firing rates tend to be modulated during particular time periods. Using this analysis, the chemosensory dynamics could be distinguished from somatosensory components of the responses. Within 540 responses analyzed (the PSTHs of 90 neurons to six tastants each), 412 modulations of firing rate were observed. Responses containing more than one modulation (Fig. 5) contributed more than one onset to the total (30.9% of the responses contributed two separate modulations, 7.3% contributed three, and 2.2% contributed four). Figure 6Apresents a frequency histogram of the modulation onsets: the number of firing rate modulations that occurred at different times after stimulus onset, totaling 412 onsets. The distribution of onset times appears bimodal, with one peak appearing between 0 and ∼400 msec and another between 1 and 2.5 sec after stimulus delivery. It follows that at least two separate processes underlie the production of firing rate modulations.
Fig. 6.

Distribution of modulation onset times across the entire neural sample. A, This frequency histogram displays all of the separate modulation of firing rate onset times. Latency is the abscissa, and the number of times that neurons in the sample produced firing rate modulations at that latency is the ordinate. One peak can be seen at 0–400 msec; a second peak begins at ∼1 sec and peaks before 1.5 sec.B, A replotting of the individual onsets that occurred <800 msec after stimulus delivery, with onset number on theabscissa and latency (post-stimulus presentation) on theordinate. The graph has an inflection point; tworegression lines, one calculated from only the first 50 points, and the other from only the last 50 points, indicate that the onsets from 0–800 msec post-stimulus delivery are actually composed of two separate populations of latencies, one early (<∼200 msec) and one later. The horizontal dashed line denotes the point of crossing of the two regression lines. C, A similar replotting of the response onsets that appeared between 400 and 1600 msec after stimulus delivery. The regression linehere is essentially the same one calculated on the middle onsets in Figure 6B; it aligns well with the onsets between 400 and ∼1000 msec after stimulus. The deviation from thisregression line marks the start of the late population of modulations and matches the late peak in Figure6A. The dashed line denotes the approximate time of this deviation.
Closer examination of the onset times, however, reveals that the distribution contains three “populations” of onsets. To more closely analyze the modulations, the first 1600 msec of the data in Figure 6A were extracted, sorted, and replotted, such that each modulation could be visualized as an individual circle. This reanalysis appears in Figures 6, B and C. Figure6B includes the ∼150 modulations that occurred between 0 and 800 msec after stimulus administration and plots each modulation as an individual circle (the earliest first, the second earliest next, etc.) against onset time in the ordinate. A piece-wise linear correlation calculated from the first and last 50 data points gives a good fit to the distribution. This result suggests that the early onsets may have arisen from two distinct (but overlapping) populations of responses: an “early” set that supplied latencies between 0 and ∼200 msec after stimulus onset and a “middle” set that supplied latencies >200 msec after stimulus onset.
Figure 6C shows a similar plot of all modulations that occurred after 400 msec and before 1600 msec after the stimulus (note that the ordinates of Fig. 6, B and C, overlap). The linear region denoting the middle responses fits well to the shown regression line, calculated on the basis of the first 30 data points; this regression line is the same one calculated on the last 50 points of Figure 6B. At ∼1 sec after the onset of the stimulus, however, the distribution deviates from this regression line, reflecting the appearance of the first members of a third population of modulations, the “late” modulations.
It therefore appears that three “sets” of modulations—one early (from 0 to ∼200 msec), one middle (from ∼200 msec to ∼1 sec), and one relatively late (starting at ∼1 sec after stimulus onset)—make up the significant neural responses to stimulus administration (see Fig. 8). Several supplementary tests validate and explain this division of the data. First, we were able to identify the early set of modulations as related to the somatosensory experience of the tastant hitting the tongue. Such a characterization was to be expected, given the nature of GC connectivity and the known facts about transduction and the transmission of information in the gustatory system (Di Lorenzo and Schwartzbaum, 1982; Herness and Gilbertson, 1999). It was hypothesized that if these modulations primarily represented “prechemosensory” somatosensory responses, they essentially would be lacking in taste specificity. This proved to be the case: only 1 of the 14 neurons that responded with an initial latency of <175 msec did so in a taste-specific manner. That is, if a neuron responded to one stimulus with a latency of <175 msec, it almost certainly responded to all stimuli, including water, with a similar latency. The later modulations drove the taste specificity of our neural sample, although 18.9% of the neurons that produced taste-specific responses (7/37 neurons) also produced extremely early, somatosensory responses.
Fig. 8.

Schematic depiction of the multimodal influences on GC responses. Time after stimulus onset is on theabscissa. Directly above this are marked the approximate boundaries between early, middle, andlate modulations, and above this, three main influences on population activity, two somatosensory (SS) and one chemosensory (CS), are shown in relation to their times of occurrence. The gradients reflect the gradual nature of the development of each population and the necessary uncertainty as to precise time of appearance. Along the top of this figure, the time course of responding is divided into the “phases” of taste-specific responses.
We further hypothesized that the late onsets might be related to tastant-specific orofacial movements, which typically appear as early as 1 sec after tastant administration (Travers and Norgren, 1986) and were present in the rats (our unpublished observations). Investigation of this hypothesis rested on the assumption that orofacial behaviors generally reflect the tastant's palatability (Breslin et al., 1992). If the late responses reflect such orofacial behaviors, then they should “code” similarly palatable tastants similarly. To test this hypothesis, we designated quinine and nicotine as hedonically “negative” tastants and sucrose and NaCl as hedonically “positive” tastants. We then compared the correlation coefficients between the responses of pairs that were consonant in hedonic quality with those of pairs dissonant in hedonic quality. During the period between 0.5 and 1.5 sec after stimulus delivery, the correlation between quinine and nicotine (and between sucrose and NaCl) was equal to that between sucrose and quinine (and between NaCl and nicotine). The ratio of variances accounted for at this point was 0.92, which means that grouping the tastant responses by hedonic quality of the tastant did not improve the variance accounted for (Fisher'sZ < 1). In the period from 1.5 to 2.5 sec, however, the correlation between similarly palatable tastants became significantly higher than the correlation between more and less palatable tastants (t of Fisher's Z = 1.89;p < 0.028). The ratio of theR2 for hedonically similar tastants to the R2 for hedonically dissimilar tastants in the late response is 1.76, indicating that palatability almost doubled the ability to predict the response. The pattern was similar for neurons with taste-specific responses and those cells distinguished by late responses. During the response period dominated by the middle set of modulations, GC activity seems primarily related to chemosensory processing, whereas late in post-stimulus time it appears that GC activity becomes strongly influenced by hedonic quality.
Although the correlational analysis makes it clear that GC responses come to reflect the palatability of the tastants over the course of 1–2 sec, this finding still leaves at least two possibilities as to the specific source(s) of the late modulations. They could represent actual processing of palatability, or they could be the result of palatability-specific somatosensory stimulation related to the emergence of palatability-specific orofacial behaviors (themselves the result of palatability processing). We found evidence that both the early and late modulations in fact represent somatosensory contributions to GC activity.
We hypothesized that if the source of the earliest and latest GC response modulations is to some degree somatosensory, then it should be possible to demonstrate more directly the presence of somatosensory input to these neurons. Specifically, it should be possible to observe, within the whole-session spike trains of these neurons, a frequency domain “signature” in the somatosensory responses ∼5–10 Hz, the rate at which rats lick. Rhythmic licking should cause rhythmic stimulation of somatosensory receptors in the oral cavity, which in turn should modulate the spike trains of oral somatosensory neurons according to the same rhythm. Thus it is possible to predict the presence of a frequency-specific excess of power in spectral analyses of those spike trains. Such a signature should be less prominent or lacking in neurons that only take chemosensory input.
To demonstrate the viability of this analysis, we present in Figure 7A the averaged spectra (calculated via fast Fourier transforms) of all entire session-long spike trains collected from oral somatosensory cortex (dashed line) and gustatory cortex (solid line). We found that somatosensory responses from the oral region tended to be modulated at 5–10 Hz. The averaged spectral responses of neurons in GC, meanwhile, lacked this hump in the power spectrum. This suggests that, as expected, the spike trains of neurons with oral somatosensory input show a signature of lick rate.
Fig. 7.

Spectral analysis of somatosensory and chemosensory responses, computed using the fast Fourier transform. For each plot, the abscissa is frequency, and theordinate is normalized power, rescaled to have a mean of 0 and SD of 1. A, The averaged spectra of all the neurons recorded during the somatosensory cortex sessions (dashed line) and of all the neurons recorded during the gustatory cortex sessions (solid line). Note the excess of power in the 5–10 Hz range, present in the somatosensory cortical recordings and absent in the gustatory cortical recordings.B, Similarly constructed average spectra taken exclusively from GC recordings. Shown are the spectrum of neurons with taste-specific responses (solid line), the spectrum derived solely from cells with early somatosensory responses (dashed line), and the spectrum derived solely from cells with late responses (dot-dash line).
Figure 7B presents similarly prepared, normalized average power spectra for the session-long spike trains of three (slightly overlapping) subsets of neurons in gustatory cortex. Note that the data entered into these analyses are session-long spike trains from neurons that produced particular tastant responses; although the orofacial responses to tastants (e.g., those involving gapes) may not involve a large amount of licking, the session-long spike train of a neurons receiving somatosensory input from the oral cavity should show 5–10 Hz power because of spontaneous, tastant-related, and grooming-related licking that occurs throughout the ∼2-hr-long sessions. Such proved to be the case. The solid linerepresents the power spectra of all 37 taste-specific responders, thedashed line represents the power spectra of the 14 neurons that produced early onset responses, and the dotted linerepresents the power spectra of the 32 neurons that produced late onset responses. The neurons with taste-specific responses lack the hump of 5–10 Hz power that characterizes both of the other subsets of neurons (the variability in the hump is to be expected, in that lick rate will vary slightly both between rat and between tastant). Thus it appears that like neurons in oral SI (Fig. 7A), neurons that produce either early or late modulations in response to tastant administration appear to receive somatosensory input. This analysis supports the hypotheses that the early (<200 msec) modulations are primarily somatosensory and that the late (>1 sec) modulations are related to palatability-related mouth movements that are the output of hedonic processing. Figure 8 summarizes these results by illustrating, in schematic form, the various suggested contributions to GC population responses.
Unadulterated chemosensory dynamics within the gustatory response
Taken together, the above analyses suggest that taste-specific GC responses, which are dynamic within the ∼0.2 to ∼1 sec post-stimulus time period, are truly chemosensory. The late modulations do not account for the taste-specific dynamics of these neurons. The firing patterns of 67.6% (25/37) of the neurons with taste-specific responses did not show taste-specific modulations in the 1.5–2.5 sec post-stimulus period. Of the taste-specific neurons that did show late responses, only two achieved taste specificity by virtue of activity in the late post-stimulus period; the others were tastant specific during the first 1.5 sec of post-stimulus response, which preceded activity related to orofacial behaviors (Travers and Norgren, 1986). In contrast, 37.7% of the non-taste-specific neurons (20/53) produced late modulations. Even with somatosensory components stripped away, stimulus-specific responding in GC varies as a function of post-stimulus time.
Furthermore, the taste-specific latencies of initial responses to different tastants contribute little to these chemosensory dynamics. Modulations in response to each tastant appeared throughout the 2.5 sec post-stimulus interval. This made the job of ascertaining the latencies of chemosensory responses difficult. Although an examination of the modulations for different tastant responses, with a lower cutoff set to eliminate most early somatosensory responses, suggested a trend toward NaCl responses being fastest and toward sucrose and nicotine responses being slowest, a one-way ANOVA for tastant shows these trends to be nonsignificant (F < 1).
DISCUSSION
Time course of gustatory responses
When a tastant hits the tongue of an awake rat, a complex set of processes is set in motion. At a broad level, these processes can be summarized in terms of the overall time-averaged response of each neuron to the tastant. Approximately 14% of our GC neurons produced taste-specific responses using such an analysis (10% excitatory, 4% inhibitory); this number is consonant with the extant GC literature on anesthetized (Yamamoto et al., 1985; Kosar et al., 1986; Cechetto and Saper, 1987; Yamamoto et al., 1989; Ogawa et al., 1990;Hanamori et al., 1998) and awake (Yasoshima and Yamamoto, 1998) rats, and with estimates taken from monkey cortex (Rolls, 1989;Smith-Swintosky et al., 1991).
We found, however, that this analysis gives an incomplete picture of GC gustatory responses. When the time course of responses was taken into account, 41% of GC neurons yielded taste-specific responses (Table 1). Many of these neurons produced distinct temporal patterns in response to different tastants, and many had chemosensory profiles that changed across time (Figs. 2, 4, 5). These findings suggest the possibility that gustatory coding in cortex may be distributed across a larger percentage of neurons, or be more dynamic than has previously been suggested, or both.
Our analysis of the time course of GC responses also made it possible, for the first time, to dissociate chemosensory and somatosensory components of GC responses. The earliest influence on firing (less than ∼200 msec after stimulus onset) seemed to be purely somatosensory, whereas firing rate modulations in the approximate interval between 0.2 and 1 sec after stimulus onset were largely chemosensory. The late changes in firing rate were also traced to somatosensory influences, presumably arising from the onset of palatability-specific orofacial behaviors (Figs. 6, 8). Specifically, chemosensory responses lacked a 5–10 Hz signature of lick rate that was observed in oral somatosensory responses (Fig. 7). The dissociation of chemosensory from somatosensory influences on the time course of GC responses provides support of the hypothesis that chemosensory responses themselves are part of a process that changes through time.
Comparison of our results with the extant literature
Several groups (Mistretta, 1971; Ogawa et al., 1973; Di Lorenzo and Schwartzbaum, 1982) have discussed differences in the time courses of brainstem and primary afferent neural responses to different tastants. These researchers were looking primarily for tastant responses that might characterize entire populations of neurons, but the existence of single neuron responses that varied between tastants was also noted. In rat GC neurons, we observed temporal responses that reliably differed between tastants but saw little between-neuron similarity in the response to a particular tastant, even between simultaneously recorded neurons in a single animal (Figs. 2, 5). It is likely that response dynamics in awake rats are more pronounced than in anesthetized rats, because most anesthetics depress activity in the gustatory neuroaxis.
Both peripheral and central factors probably contribute to the production of time-varying activity in GC neurons. Variations in the movement of fluid around the oral cavity will modulate the tastant concentration that interacts with the apical terminals of taste receptor cells and in turn will produce different kinetic responses in primary gustatory neurons. However, the trial-to-trial reliability of response dynamics, along with the cell-specific variety of responses within and between rats, is difficult to explain in terms of purely peripheral mechanisms (Fig. 2). That the sorts of time-varying activity observed here are also seen in various other systems and preparations (Nicolelis and Chapin, 1994; Wehr and Laurent, 1996; Ringach et al., 1997; deCharms et al., 1998; Ghazanfar and Nicolelis, 1999; Covey, 2000; Lam et al., 2000) leads us to believe that the temporal variability arises from recurrent CNS circuitry, which causes time-varying patterns of activity that are relatively independent of processes at the periphery (Laurent, 1999).
Studies showing neural response dynamics do not provide unequivocal evidence that the nervous system uses temporal response patterns in sensory processing or that overall rates of activity are unimportant. Similarly, our study demonstrates the existence of potentially useful temporal information in GC responses but does not prove that tastant responses cannot be usefully characterized solely in terms of overall firing rate. Still, this evidence is similar in quality to most data presented in support of more static theories. In summary, we have shown that temporal changes in GC responses are available for the CNS to characterize the various qualities associated with placing chemical stimuli on the tongue.
Sources of gustatory response dynamics
Neurons at all levels of the gustatory neuroaxis receive convergent input from chemosensory and somatosensory sources (Ogawa et al., 1982; Yamamoto, 1984; Nakamura and Norgren, 1993). A large subset of chemoresponsive GC neurons also responds to tactile stimulation of the intraoral region. This complicates the interpretation of gustatory responses (Spector, 2000), particularly in awake rats, which produce consumatory behaviors related to the palatability of the just-presented tastant (Grill and Norgren, 1978; Berridge, 2000). Such behaviors are likely to lead to somatosensory stimulation that “masquerades” as GC chemosensory responses. The analyses described here, however, enabled us to separate the gustatory responses into their somatosensory and chemosensory components, to broadly identify when somatosensory activity most strongly influences gustatory activity, and to recognize genuinely chemosensory time courses of response.
We argue that the earliest and latest firing rate modulations observed in GC neurons are primarily somatosensory. The late responses may also represent hedonic processing. That is they consistently occur with the emergence of tastant-specific orofacial behaviors (Travers and Norgren, 1986) and contain the 5–10 Hz signature of licking. Whatever their cause, the gustatory responses of a subset of GC neurons are related to stimulus quality for at least the first 1 sec and thereafter are related to hedonic quality. Similar shifts have been observed in other sensory systems. Sugase et al. (1999), for example, reported that neurons in the temporal visual area progress over the course of 50 msec from coding facial identity to coding facial expression.
These considerations allow us to confidently suggest that chemosensory responses themselves exhibit temporal properties. It is possible that between-neuron interactions are responsible for shaping GC responses through time. Such a mechanism is predicted by studies demonstrating that (1) the removal of inhibition from a gustatory neural structure changes the tastant response profiles of neurons (Ogawa et al., 1998; Smith and Li, 1998); (2) two directly connected brainstem neurons may have very different chemosensory sensitivities (Di Lorenzo and Monroe, 1997); and (3) GC neurons may exhibit significant levels of cross-correlation (Adachi et al., 1989; Nakamura and Ogawa, 1997; Yokota et al., 1997).
Implications for theories of gustatory processing
Gustatory neural data are usually explained in terms of either the “labeled-line” (LL) (Frank, 2000) or the “across-fiber pattern” (AFP) (Erickson et al., 1995) hypothesis. According to the LL, gustatory coding progresses via comparison of the activity levels of separate populations of neurons, each tuned to a “best stimulus.” The AFP, meanwhile, suggests that tastants are determined via the overall pattern of activity across all responsive units, without reference to what stimulus is the best for any particular neuron.
Our data present complications for a labeled line-type theory, in that for a substantial percentage of our neural sample, the best stimulus changed from one 500 msec of the response to the next. To account for this result, advocates of LL either must disregard the temporal structure observed in GC responses or suggest an alternative criterion for deriving the best stimulus of a neuron.
These data suggest that potentially valuable information regarding the tastant is available in the time course of the neural response. Researchers bringing “fuzzy set” analysis techniques to bear on brainstem responses have reached conclusions that bear striking similarity to those presented in Figure 8 (Erickson et al., 1995). These results present a challenge for both LL and AFP hypotheses, in that neither theory emphasizes response dynamics.
It might be argued that gustatory response dynamics are of little import, because rats are capable of identifying tastants within 200 msec (Halpern and Tapper, 1971), before all but the earliest bursts of tastant-specific response observed in this study. It is possible, in fact, that GC responses are irrelevant for the most basic processes of tastant identification and characterization (Spector, 2000). The fact that initial tastant identification can happen very rapidly, however, does not imply that gustatory processing ends at that time; elaboration of the gustatory percept may continue long after the initial discriminating response. Furthermore, the speed with which rats identify tastants increases with training (Halpern and Tapper, 1971), and this gradual improvement may reflect learning-related changes in the neural processing of the tastants themselves. GC neurons are known to undergo plasticity during simple gustatory learning (Yasoshima and Yamamoto, 1998). The time courses of responses may become plastic with learning, as well, such that different tastants may be identified earlier. Indeed, we have gathered preliminary evidence suggesting that even simple tastant self-administration can cause plasticity in GC neural responses across two to six trials (Katz et al., 2000).
Conclusion
We have shown that a much larger percentage of GC neurons may participate in chemosensory coding than has been supposed previously. These responses are visible in tastant-specific time courses of responding, by which the neurons may participate in responses to different tastants at different times. The temporal analysis of GC responses also permits the separation of the gustatory responses into their somatosensory and chemosensory components.
Footnotes
This research was supported by National Institutes of Health Grants DC-01065 (S.A.S.), DC-00403 (D.B.K.), and DE-11121 (M.A.L.N.), and by a grant from the Philip Morris Research Center. We are grateful to Professors Robert Erickson and Alan Spector for their advice and encouragement throughout the development of this project.
Correspondence should be addressed to Donald B. Katz, Room 333, Bryan Research Building, Duke University Medical Center, Durham, NC 27710. E-mail: dkatz@neuro.duke.edu.
REFERENCES
- 1.Adachi M, Ohshima T, Yamada S, Satoh T. Cross-correlation analysis of taste neuron pairs in rat solitary tract nucleus. J Neurophysiol. 1989;62:501–509. doi: 10.1152/jn.1989.62.2.501. [DOI] [PubMed] [Google Scholar]
- 2.Bermejo R, Harvey M, Gao P, Zeigler HP. Conditioned whisking in the rat. Somatosens Mot Res. 1996;13:225–233. doi: 10.3109/08990229609052578. [DOI] [PubMed] [Google Scholar]
- 3.Berridge KC. Measuring hedonic impact in animals and infants: microstructure of affective taste reactivity patterns. Neurosci Biobehav Rev. 2000;24:173–198. doi: 10.1016/s0149-7634(99)00072-x. [DOI] [PubMed] [Google Scholar]
- 4.Blejec Statistical evaluation of olfactory receptor neuron response to chemical stimulation. Chem Senses. 2000;25:666. [Google Scholar]
- 5.Breslin PAS, Spector AC, Grill HJ. A quantitative comparison of taste reactivity behaviors to sucrose before and after lithium chloride pairings: a unidimensional account of palatability. Behav Neurosci. 1992;106:820–836. doi: 10.1037//0735-7044.106.5.820. [DOI] [PubMed] [Google Scholar]
- 6.Cechetto DF, Saper CB. Evidence for a viscerotopic sensory representation in the cortex and thalamus in the rat. J Comp Neurol. 1987;262:27–45. doi: 10.1002/cne.902620104. [DOI] [PubMed] [Google Scholar]
- 7.Christensen TA, Pawlowski VM, Lei H, Hildebrand JG. Multi-unit recordings reveal context-dependent modulation of synchrony in odor-specific neural ensembles. Nat Neurosci. 2000;3:927–931. doi: 10.1038/78840. [DOI] [PubMed] [Google Scholar]
- 8.Churchward PR, Butler EG, Finkelstein DI, Aumann TD, Sudbury A, Horne MK. A comparison of methods used to detect changes in neuronal discharge patterns. J Neurosci Methods. 1997;76:203–210. doi: 10.1016/s0165-0270(97)00099-x. [DOI] [PubMed] [Google Scholar]
- 9.Covey E. Neural population coding and auditory temporal pattern analysis. Physiol Behav. 2000;69:211–220. doi: 10.1016/s0031-9384(00)00203-1. [DOI] [PubMed] [Google Scholar]
- 10.deCharms RC, Blake DT, Merzenich MM. Optimizing sound features for cortical neurons. Science. 1998;280:1439–1443. doi: 10.1126/science.280.5368.1439. [DOI] [PubMed] [Google Scholar]
- 11.Di Lorenzo PM, Monroe S. Transfer of information about taste from the nucleus of the solitary tract to the parabrachial nucleus of the pons. Brain Res. 1997;763:167–181. doi: 10.1016/s0006-8993(97)00217-5. [DOI] [PubMed] [Google Scholar]
- 12.Di Lorenzo PM, Schwartzbaum JS. Coding of gustatory information in the pontine parabrachial nuclei of the rabbit: temporal patterns of neural response. Brain Res. 1982;251:245–257. doi: 10.1016/0006-8993(82)90742-9. [DOI] [PubMed] [Google Scholar]
- 13.Ellaway PH. Cumulative sum technique and its application to the analysis of peristimulus time histograms. Electroencephalogr Clin Neurophysiol. 1978;45:302–304. doi: 10.1016/0013-4694(78)90017-2. [DOI] [PubMed] [Google Scholar]
- 14.Erickson RP, Schiffman SS, Doetsch GS, Di Lorenzo PM, Woodbury MA. A fuzzy set approach to the organization of the gustatory system. Prim Sens Neuron. 1995;1:65–80. [Google Scholar]
- 15.Frank ME. Neuron types, receptors, behavior, and taste quality. Physiol Behav. 2000;69:53–62. doi: 10.1016/s0031-9384(00)00188-8. [DOI] [PubMed] [Google Scholar]
- 16.Frank ME, Contreras RJ, Hettinger TP. Nerve fibers sensitive to ionic taste stimuli in the chorda tympani of the rat. J Neurophysiol. 1983;50:941–955. doi: 10.1152/jn.1983.50.4.941. [DOI] [PubMed] [Google Scholar]
- 17.Frank ME, Bieber SL, Smith DV. The organization of taste sensibilities in hamster chorda tympani nerve fibers. J Gen Physiol. 1988;91:861–896. doi: 10.1085/jgp.91.6.861. [DOI] [PMC free article] [PubMed] [Google Scholar]
- 18.Ghazanfar AA, Nicolelis MA. Spatiotemporal properties of layer V neurons of the rat primary somatosensory cortex. Cereb Cortex. 1999;9:348–361. doi: 10.1093/cercor/9.4.348. [DOI] [PubMed] [Google Scholar]
- 19.Ghazanfar AA, Nicolelis MAL. The structure and function of dynamic receptive fields in the thalamus and cortex. Cereb Cortex. 2001;11:183–193. doi: 10.1093/cercor/11.3.183. [DOI] [PubMed] [Google Scholar]
- 20.Grill HJ, Norgren R. The taste reactivity test. I. Mimetic responses to gustatory stimuli in neurologically normal rats. Brain Res. 1978;143:263–279. doi: 10.1016/0006-8993(78)90568-1. [DOI] [PubMed] [Google Scholar]
- 21.Halpern BP, Tapper DN. Taste stimuli: quality coding time. Science. 1971;171:1256–1258. doi: 10.1126/science.171.3977.1256. [DOI] [PubMed] [Google Scholar]
- 22.Hanamori T, Kunitake T, Kato K, Kannan H. Responses of neurons in the insular cortex to gustatory, visceral, and nociceptive stimuli in rats. J Neurophysiol. 1998;79:2535–2545. doi: 10.1152/jn.1998.79.5.2535. [DOI] [PubMed] [Google Scholar]
- 23.Herness MS, Gilbertson TA. Cellular mechanisms of taste transduction. Annu Rev Physiol. 1999;61:873–900. doi: 10.1146/annurev.physiol.61.1.873. [DOI] [PubMed] [Google Scholar]
- 24.Katz DB, Simon SA, Nicolelis MAL. Population coding in the rat primary gustatory cortex. Soc Neurosci Abstr. 2000;26:1974. [Google Scholar]
- 25. Katz DB, Simon SA, Nicolelis MAL. Electrophysiological studies of gustation in awake rats. Methods and frontiers in the chemical senses Simon SA, Nicolelis MAL. 2001. CRC; Boca Raton, FL, in press. [Google Scholar]
- 26.Kosar E, Grill HJ, Norgren R. Gustatory cortex in the rat. I. Physiological properties and cytoarchitecture. Brain Res. 1986;379:329–341. doi: 10.1016/0006-8993(86)90787-0. [DOI] [PubMed] [Google Scholar]
- 27.Lam YW, Cohen LB, Wachowiak M, Zochowski MR. Odors elicit three different oscillations in the turtle olfactory bulb. J Neurosci. 2000;20:749–762. doi: 10.1523/JNEUROSCI.20-02-00749.2000. [DOI] [PMC free article] [PubMed] [Google Scholar]
- 28.Laurent G. A systems perspective on early olfactory coding. Science. 1999;286:723–728. doi: 10.1126/science.286.5440.723. [DOI] [PubMed] [Google Scholar]
- 29.McClurkin JW, Optican LM, Richmond BJ, Gawne TJ. Concurrent processing and complexity of temporally encoded neuronal messages in visual perception. Science. 1991;253:675–677. doi: 10.1126/science.1908118. [DOI] [PubMed] [Google Scholar]
- 30.Mistretta CM. A quantitative analysis of rat chorda tympani fiber discharge patterns. In: Schneider D, editor. Olfaction and taste IV. Wissenschaftliche; Stuttgart: 1971. pp. 294–300. [Google Scholar]
- 31.Nakamura K, Norgren R. Taste responses of neurons in the nucleus of the solitary tract of awake rats: an extended stimulus array. J Neurophysiol. 1993;70:879–891. doi: 10.1152/jn.1993.70.3.879. [DOI] [PubMed] [Google Scholar]
- 32.Nakamura T, Ogawa H. Neural interaction between cortical taste neurons in rats: a cross-correlation analysis. Chem Senses. 1997;22:517–528. doi: 10.1093/chemse/22.5.517. [DOI] [PubMed] [Google Scholar]
- 33.Nicolelis MAL, Chapin JK. Spatiotemporal structure of somatosensory responses of many-neuron ensembles in the rat ventral posterior medial nucleus of the thalamus. J Neurosci. 1994;14:3511–3532. doi: 10.1523/JNEUROSCI.14-06-03511.1994. [DOI] [PMC free article] [PubMed] [Google Scholar]
- 34.Nicolelis MAL, Stambaugh CR, Brisben A, Laubach M. Methods for simultaneous multisite neural ensemble recordings in behaving primates. In: Nicolelis MAL, editor. Methods for neural ensemble recordings. CRC; Boca Raton, FL: 1999. pp. 121–156. [Google Scholar]
- 35.Nishijo H, Norgren R. Parabrachial gustatory neural activity during licking by rats. J Neurophysiol. 1991;66:974–985. doi: 10.1152/jn.1991.66.3.974. [DOI] [PubMed] [Google Scholar]
- 36.Nishijo H, Uwano T, Tamura R, Ono T. Gustatory and multimodal neuronal responses in the amygdala during licking and discrimination of sensory stimuli in awake rats. J Neurophysiol. 1998;79:21–36. doi: 10.1152/jn.1998.79.1.21. [DOI] [PubMed] [Google Scholar]
- 37.Ogawa H, Sato M, Yamashita S. Variability in impulse discharges in rat chorda tympani fibers in response to repeated gustatory stimulations. Physiol Behav. 1973;11:469–479. doi: 10.1016/0031-9384(73)90033-4. [DOI] [PubMed] [Google Scholar]
- 38.Ogawa H, Hayama T, Ito S. Convergence of input from tongue and palate to the parabrachial nucleus neurons of rats. Neurosci Lett. 1982;28:9–14. doi: 10.1016/0304-3940(82)90200-2. [DOI] [PubMed] [Google Scholar]
- 39.Ogawa H, Ito S, Murayama N, Hasegawa K. Taste area in granular and dysgranular insular cortices in the rat identified by stimulation of the entire oral cavity. Neurosci Res. 1990;9:196–201. doi: 10.1016/0168-0102(90)90004-x. [DOI] [PubMed] [Google Scholar]
- 40.Ogawa H, Hasegawa K, Otawa S, Ikeda I. GABAergic inhibition and modifications of taste responses in the cortical taste area in rats. Neurosci Res. 1998;32:85–95. doi: 10.1016/s0168-0102(98)00071-6. [DOI] [PubMed] [Google Scholar]
- 41.Paxinos G, Watson C. The rat brain in stereotaxic coordinates, Ed 3. Academic; San Diego: 1997. [DOI] [PubMed] [Google Scholar]
- 42.Phillips MI, Norgren R. A rapid method for permanent implantation of an intraoral fistula in rats. Behav Res Methods Instrum Comput. 1970;2:124. [Google Scholar]
- 43.Ringach DL, Hawken MJ, Shapley R. Dynamics of orientation tuning in macaque primary visual cortex. Nature. 1997;387:281–284. doi: 10.1038/387281a0. [DOI] [PubMed] [Google Scholar]
- 44.Rolls ET. Information processing in the taste system of primates. J Exp Biol. 1989;146:141–164. doi: 10.1242/jeb.146.1.141. [DOI] [PubMed] [Google Scholar]
- 45.Smith DV, Li CS. Tonic GABAergic inhibition of taste-responsive neurons in the nucleus of the solitary tract. Chem Senses. 1998;23:159–169. doi: 10.1093/chemse/23.2.159. [DOI] [PubMed] [Google Scholar]
- 46.Smith-Swintosky VL, Plata-Salaman CR, Scott TR. Gustatory neural coding in the monkey cortex: stimulus quality. J Neurophysiol. 1991;66:1156–1165. doi: 10.1152/jn.1991.66.4.1156. [DOI] [PubMed] [Google Scholar]
- 47.Spector AC. Linking gustatory neurobiology to behavior in vertebrates. Neurosci Biobehav Rev. 2000;24:391–416. doi: 10.1016/s0149-7634(00)00013-0. [DOI] [PubMed] [Google Scholar]
- 48.Spector AC, Breslin P, Grill HJ. Taste reactivity as a dependent measure of the rapid formation of conditioned taste aversion: a tool for the neural analysis of taste-visceral associations. Behav Neurosci. 1988;102:942–952. doi: 10.1037//0735-7044.102.6.942. [DOI] [PubMed] [Google Scholar]
- 49.Sugase Y, Yamane S, Ueno S, Kawano K. Global and fine information coded by single neurons in the temporal visual cortex. Nature. 1999;400:869–873. doi: 10.1038/23703. [DOI] [PubMed] [Google Scholar]
- 50.Tracy JA, Steinmetz JE. Purkinje cell responses to pontine stimulation CS during rabbit eyeblink conditioning. Physiol Behav. 1998;65:381–386. doi: 10.1016/s0031-9384(98)00217-0. [DOI] [PubMed] [Google Scholar]
- 51.Travers JB, Norgren R. Electromyographic analysis of the ingestion and rejection of sapid stimuli in the rat. Behav Neurosci. 1986;100:544–555. doi: 10.1037//0735-7044.100.4.544. [DOI] [PubMed] [Google Scholar]
- 52.Wehr M, Laurent G. Odour encoding by temporal sequences of firing in oscillating neural assemblies. Nature. 1996;384:162–166. doi: 10.1038/384162a0. [DOI] [PubMed] [Google Scholar]
- 53.Welsh JP, Lang EJ, Sugihara I, Llinás R. Dynamic organization of motor control within the olivocerebellar system. Nature. 1995;374:453–457. doi: 10.1038/374453a0. [DOI] [PubMed] [Google Scholar]
- 54.Yamamoto T. Taste responses of cortical neurons. Prog Neurobiol. 1984;23:273–315. doi: 10.1016/0301-0082(84)90007-8. [DOI] [PubMed] [Google Scholar]
- 55.Yamamoto T, Yuyama N, Kato T, Kawamura Y. Gustatory responses of cortical neurons in rats. III. Neural and behavioral measures compared. J Neurophysiol. 1985;53:1370–1386. doi: 10.1152/jn.1985.53.6.1370. [DOI] [PubMed] [Google Scholar]
- 56.Yamamoto T, Matsuo R, Kiyomitsu Y, Kitamura R. Taste responses of cortical neurons in freely ingesting rats. J Neurophysiol. 1989;61:1244–1258. doi: 10.1152/jn.1989.61.6.1244. [DOI] [PubMed] [Google Scholar]
- 57.Yasoshima Y, Yamamoto T. Short-term and long-term excitability changes of the insular cortical neurons after the acquisition of taste aversion learning in behaving rats. Neuroscience. 1998;84:1–5. doi: 10.1016/s0306-4522(97)00636-2. [DOI] [PubMed] [Google Scholar]
- 58.Yokota T, Eguchi K, Satoh T. Sensitivity of rat cortical neurons in distinguishing taste qualities by individual and correlative activities. Chem Senses. 1997;22:363–373. doi: 10.1093/chemse/22.4.363. [DOI] [PubMed] [Google Scholar]