

Abstract
The retinotectal projection is the predominant model for studying molecular mechanisms controlling development of topographic axonal connections. Our analyses of topographic mapping of retinal ganglion cell (RGC) axons in chick optic tectum indicate that a primary role for guidance molecules is to regulate topographic branching along RGC axons, a process that imposes unique requirements on the molecular control of map development. We show that topographically appropriate connections are established exclusively by branches that form along the axon shaft. Initially, RGC axons overshoot their appropriate termination zone (TZ) along the anterior–posterior (A-P) tectal axis; temporal axons overshoot the greatest distance and nasal axons the least, which correlates with the nonlinear increasing A-P gradient of ephrin-A repellents. In contrast, branches form along the shaft of RGC axons with substantial A-P topographic specificity. Topography is enhanced through the preferential arborization of appropriately positioned branches and elimination of ectopic branches. Using a membrane stripe assay and time-lapse microscopy, we show that branches form de novo along retinal axons. Temporal axons preferentially branch on their topographically appropriate anterior tectal membranes. After the addition of soluble EphA3-Fc, which blocks ephrin-A function, temporal axons branch equally on anterior and posterior tectal membranes, indicating that the level of ephrin-As in posterior tectum is sufficient to inhibit temporal axon branching and generate branching specificity in vitro. Our findings indicate that topographic branch formation and arborization along RGC axons are critical events in retinotectal mapping. Ephrin-As inhibit branching along RGC axons posterior to their correct TZ, but alone cannot account for topographic branching and must cooperate with other molecular activities to generate appropriate mapping along the A-P tectal axis.
Keywords: axon guidance, axon repellents, branch inhibition, chick, Eph receptors, EphA3-Fc, gradients, membrane stripe assay, time-lapse imaging, topographic maps
The projection of retinal ganglion cell (RGC) axons to the optic tectum, or its mammalian homolog, the superior colliculus (SC), has been a model for studying the development of topographic connections. EphA receptors and their ephrin-A ligands are the only molecules described that meet criteria for topographic guidance molecules (Flanagan and Vanderhaeghen, 1998; O'Leary et al., 1999) established by Sperry (1963) in the chemoaffinity hypothesis. In chick, ephrin-A2 and ephrin-A5 combine to form an increasing anterior (A) to posterior (P) gradient across tectum, and their receptor, EphA3, is expressed by RGCs in an increasing nasal to temporal gradient (Cheng and Flanagan, 1994; Cheng et al., 1995; Drescher et al., 1995; Monschau et al., 1997; Connor et al., 1998). These expression patterns correlate with the mapping of the temporal-nasal retinal axis along the A-P tectal axis and the demonstrations that ephrin-As preferentially repel temporal axons (Nakamoto et al., 1996; Monschau et al., 1997; Frisen et al., 1998). Genetic analyses in mice show that ephrin-A2 and ephrin-A5 are required for the proper mapping of RGC axons in the SC (Frisen et al., 1998; Feldheim et al., 2000) and that EphA receptors mediate their repellent action (Brown et al., 2000).
Defining how RGCs develop topographic connections is critical for defining the roles of guidance molecules, creating accurate models of this process, and determining whether additional activities are required. Surprisingly, however, the development of topographic projections in the chick tectum and mammalian SC remains poorly defined and controversial. Some studies have concluded that the topographic targeting of RGC growth cones is the primary mechanism for map development in chick tectum and cat SC (Thanos and Bonhoeffer, 1987;Chalupa et al., 1996; Chalupa and Snider, 1998). Other studies report that the initial projection to the chick tectum or rat SC is topographically diffuse and that many temporal axons make targeting errors and form branches and arbors at topographically incorrect sites (O'Leary et al., 1986; Nakamura and O'Leary, 1989; Simon and O'Leary, 1992a,b).
The goal of the present study was to define mechanisms that RGCs use to develop their topographic projection to the tectum in chicks by quantifying topographic specificity in growth cone targeting, axon branching, and arborization. We chose the chick retinotectal projection because it has been the preeminent system for the molecular analysis of RGC axon mapping. We show that essentially all RGCs initially overshoot the location of their future termination zone (TZ) along the A-P tectal axis and establish topographic connections by the arborization of branches that form along the axon shaft. Although RGC growth cones fail to target their appropriate TZ, axon branching exhibits a high degree of topographic specificity along the A-P tectal axis. In vitro, we show that temporal axons exhibit topographic branching and that the level of ephrin-A ligands in posterior tectum is sufficient to inhibit branching along temporal axons. Time-lapse microscopy was used to investigate mechanisms of branching specificityin vitro. Because topographic specificity in growth cone targeting and axon branching pose different requirements on their molecular control, our findings have substantial implications for the roles and limitations of ephrin-As in map development. In addition, they provide a framework for modeling the molecular control of RGC axon mapping.
MATERIALS AND METHODS
Animals
Embryos of a White Leghorn strain of chickens were raised from fertile eggs in a high-humidity forced-draft incubator at 38°C. Eggs were windowed on embryonic day (E) 3 of incubation, and the hole was sealed with transparent tape until tracer application. Embryos were staged according to the criteria of Hamburger and Hamilton (1951) at the time of tracer injection and fixation, as well as when tissue was collected for in vitro assays.
In vivo analysis
RGC axons were labeled by a discrete pressure injection of 1,1′-dioctadecyl-3,3,3′,3′-tetramethylindocarbocyanine perchlorate (DiI; Molecular Probes, Eugene, OR), or in a few cases with a crystal placement of 3,3′-dioctadecyloxycarbocyanine perchlorate (DiO; Molecular Probes), into the retina on E9–E12 using a Picospritzer (General Valve, Fairfield, NJ) and returned to the incubator. Embryos were perfused transcardially with 4% paraformaldehyde 12–72 hr later. The retina and contralateral tectum were whole mounted and scanned using a custom macro on a Bio-Rad 1024 confocal microscope attached to a Zeiss inverted microscope using a 20 or 25× lens for the tectum and a 6.3 or 10× lens for the retina. Confocal images were projected in three dimensions (3D) and montaged using custom macros written for NIH Image. In some cases, the whole mounts were analyzed and photographed on an upright fluorescence microscope using RITC (DiI) or FITC (DiO) filter cubes.
In our initial analyses of the patterns of branching and growth cone targeting, injections of DiI were made in peripheral temporal retina at locations 5–10% of the total distance along the temporal–nasal axis. Quantitative analyses were performed only on localized injections labeling 5–15 axons with branches that could be unambiguously identified. Confocal microscopy and subsequent projections in 3D allowed the axonal origin of branches to be resolved definitively. In a small number of older cases the entire extent of arborization in a dense TZ could not be resolved completely. Axons, branches, and arbors were digitally traced on the scanned confocal montages, and the traced image was analyzed using another custom NIH Image macro. This macro determined the lengths, locations, and connections of all axons, branches, and arbors within the tectum. Interstitial arbors were defined as interstitial branches originating from the axon shaft that had one or more secondary branches. Terminal arbors were defined by a similar criteria, but their origin was located within 250 μm of the distal end of the primary axon shaft. By E12 and E13, elimination of the overshooting segment of the primary axon positioned the distal end of some axons close enough to the TZ that some proportion of arbors that had initially developed as interstitial arbors were incorrectly scored as terminal arbors.
Additional quantitative analyses were performed using a custom macro written in Microsoft Excel Visual Basic with the data provided by the NIH Image macro. Distribution of axons, branches, and arbors was analyzed using composite projections from 7–10 tecta for each age. Analyses of these distributions were made with respect to the topographically correct TZ in the tectum, which was determined, independent of the distribution of labeled axons in the tectum, by mapping the injection site in the retina onto the tectum. We measured the distance of the DiI injection site from the temporal edge of the retina and expressed this value as a percentage of the total distance across the temporal–nasal axis. The predicted TZ was then placed at the same percentage distance from the anterior edge of the tectum relative to the total distance across the A-P axis of the tectum. In E13 embryos, the predicted TZ was always located at the A-P position of the emerging TZ, thus confirming the accuracy of this mapping procedure. The TZ was defined as a zone extending 250 μm both anterior and posterior to this predicted point in tectum and was chosen because this corresponded to the typical 500 μm width of mature retinal arborizations in tectum (Thanos and Bonhoeffer, 1987; Nakamura and O'Leary, 1989).
Average branch density outside the TZ was determined by dividing the total number of branches outside the TZ at each age by the average length of labeled axons multiplied by the total number of labeled axons at each age. We subtract 500 μm from the length of axons that project past the TZ when determining average axon length used in the calculation above so that segments of the axon located in the TZ were not included. Average branch density posterior to the TZ was determined for each age by dividing the total number of branches posterior to the TZ by the average overshoot for axons that project past the TZ multiplied by the number of axons projecting past the TZ.
Analysis of the differential, position-dependent overshoot of the TZ was performed by making DiI injections at a number of locations in temporal, central (dorsal), and nasal retina at E9, E10, E11, and E12; labeled RGC axons were analyzed in tectal whole mounts 1 d later. Average overshoot was quantified using E11 tectal whole mounts at similar developmental states, assessed by the degree of branching and arborization. Overshoot for peripheral temporal axons was measured at early E11, whereas overshoot for peripheral nasal axons was measured at late E11 because there is a developmental delay for RGC axons originating from more peripheral nasal locations compared with more central or temporal locations in the retina. To verify that the maximum overshoot was measured, the overshoot was also determined at E10, E12, and E13. Nasal axons had not yet reached their TZ at E10, although at E12 and E13 we found less overshoot for all retinal locations as compared with E11 (data not shown). Average overshoot shown in Figure 5was quantified only for RGC axons that had either reached or projected past the predicted TZ. Growth cones anterior to the predicted TZ were not included because this would bias the analysis, grossly underestimating the overshoot for more nasal axons, because many nasal axons are still extending across the tectum at this age. Statistical analysis of branch, axon, and arbor distributions was performed using Statview. Quantitative analysis was performed on the following data: number of tectal whole mounts: E10 (10), E11(7), E12 (9), E13 (7); number of axons: E10 (104), E11 (64), E12 (68), E13 (52); number of branches: E10 (302), E11(248), E12 (241), E13 (141).
Fig. 5.
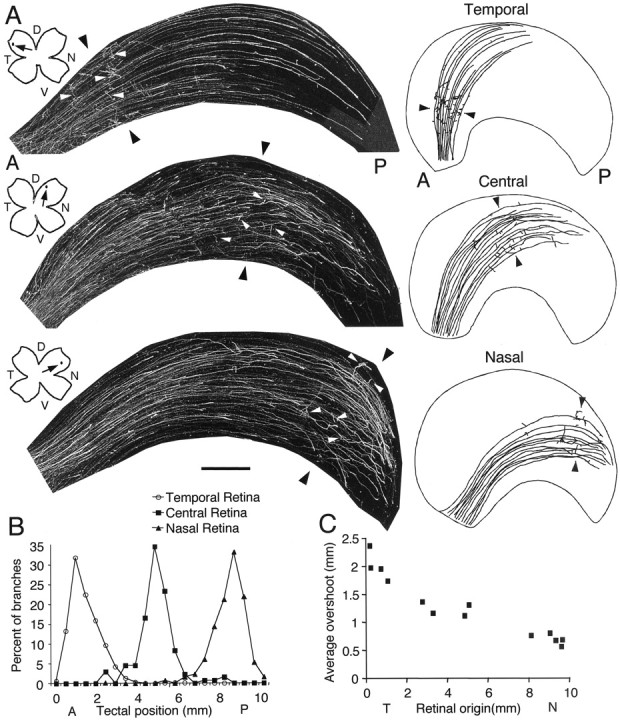
RGC axons overshoot their correct termination zone in a position-dependent, differential manner. A, Confocal digital montages of RGC axons in tectal whole mounts labeled by a small focal DiI injection into peripheral temporal retina (top), central retina (middle), or peripheral nasal retina (bottom) 1 d before fixation on E11. The injection sites are plotted on drawings of the retinal whole mounts and marked by arrows. The relative positioning of the labeled axons and branches within the tectum is shown to the right with drawings of the outline of each tectum on which the labeled axons and branches are traced. Axons overshoot their topographically correct TZ (the predicted locations of the TZs are marked with black arrowheads), but the distribution of interstitial branches along the axon shafts (white arrowheads) is strongly biased for the location of the future TZ along the anterior (A)–posterior (P) tectal axis. Peripheral temporal axons exhibit the greatest overshoot and peripheral nasal axons the least. The location of the topographically correct TZ along the A-P tectal axis was determined, independent of the distribution of labeled axons in the tectum, by mapping the injection site in the retina onto the tectum (see Materials and Methods for details). B, Distribution of interstitial branches along the axon shaft expressed in percentage. The A-P tectal axis was divided into 500 μm bins, and the number of branches in each bin is graphed as the percentage of total branches for each of the three groups of injections [number of cases quantified: temporal (n = 10); central (n = 4); nasal (n = 3); see Results for specificn values and statistical tests]. To provide a more direct comparison of relative developmental stages in axon branching, branch (Figure legend continued.) (Figure legend continues.) distributions were quantified at E10 for temporal injections and at E11 for central and nasal injections. Branch distribution is topographic regardless of retinal origin. C, Average overshoot measured for labeled axons per case relative to the location of the DiI injection along the temporal–nasal axis of the retina. The extent of RGC axon overshoot varies with retinal origin and shows a progressive temporal to nasal decline in magnitude. At the ages analyzed, the A-P axis of the tectum is ∼10 mm at the center of its medial–lateral extent. However, because of the shape and curvature of the tectum, some views may give the impression that it is shorter. Scale bar (shown inA): 500 μm for tectal montages of DiI-labeled axons and 1100 μm for the drawings. D, Dorsal;N, nasal; T, temporal; V, ventral.
In vitro membrane branching assays
Assay preparation. The membrane stripe assay (Walter et al., 1987a,b) was used in a modified form (Roskies and O'Leary, 1994). Tecta from E9–E10 chick embryos were used for the preparation of membrane carpets. The brain was dissected from the skull, the pia was removed, and the tecta were dissected into thirds. The middle tectal third was discarded, and anterior and posterior thirds were homogenized separately in buffer (HB: 10 mm Tris Cl, pH 7.4; 1.5 mm CaCl2) with protease inhibitors (200 U/ml aprotinin, 50 μm leupeptin, 2 μmpepstatin, 1 mm spermidine, and in some cases 50 μm 2,3-dehydro-2-deoxy-N-acetylneuraminic acid; Sigma, St. Louis, MO). Membranes were fractionated by centrifugation in a sucrose gradient and washed and resuspended in PBS with protease inhibitors (PBS+). The pellet was resuspended in PBS+ and adjusted until a 1:15 dilution of the suspension in 2% SDS yielded an optical density (OD) of 0.2 for anterior suspensions and 0.15–0.2 for posterior suspensions (results were similar with the two ODs) when measured with 220 nm ultraviolet (UV) light. Latex microspheres that fluoresce blue when exposed to UV illumination were added to the posterior membrane suspension to reveal lane integrity. Alternating, 90-μm-wide anterior and posterior membrane lanes were laid down on a Nuclepore filter (pore size 0.1 μm) by suction. E6 chick embryos were used for the preparation of retinal strips. Retinas were dissected from the sclera, and the pigment epithelium was removed. The retina was cut into thirds parallel to the optic fissure. The central third of the retina was discarded, and the temporal and nasal thirds were mounted RGC side up on nitrocellulose paper (Sartorius) that had been previously incubated in 0.01% Concanavalin A (Sigma) in L15 (Sigma) for 1 hr and thoroughly rinsed. To anterogradely label retinal axon outgrowth in the standard branching assay and the cultures used for time-lapse microscopy, retina was prelabeled with 4-(4-didecylaminostyryl)-N-methylpyridinium iodide (4-Di-10-ASP; Molecular Probes) before explanting. For this prelabeling, mounted retinal thirds were centrifuged for 10 min at 1200 rpm in 5 ml of a dye suspension (1:200 dilution in L15 of a 1% stock solution of 4-Di-10-ASP in ethanol). Filter papers with retinas were rinsed in L15 and incubated in medium (DMEM-F12 supplemented with 2 mml-glutamine, 0.6%d-glucose, 10 U/ml pen-strep, 20 mm HEPES, 5% rat serum or 2% chick serum, and 10% fetal calf serum) at 5% CO2 for 1 hr. The temporal and nasal thirds of retina were cut into 300 μm strips on a tissue chopper. The strips were placed RGC side down on the membrane carpets, parallel to the membrane lanes, which resulted in individual axons growing out from the explant crossing both types of lanes. Small weights were placed on top of the ends of the strips to anchor the explants and carpets. Two milliliters of medium, in some cases supplemented with 0.4% methylcellulose, were added to each dish. For the EphA3-Fc blocking experiments, 400 ng/ml of soluble rmEphA3-Fc (R & D Systems, Minneapolis, MN) or 400–800 ng/ml of human IgG, Fc portion (Jackson ImmunoResearch, West Grove, PA) was added to the media. In standard growth choice membrane stripe assays in which the retinal explant is oriented perpendicular to the membrane lanes, 400 ng/ml of EphA3-Fc was sufficient to eliminate the normal strong preference of temporal axons to grow on anterior membranes (data not shown). Human-Fc did not affect the growth preference of temporal axons at any concentration tested (10–1500 ng/ml). Cultures were incubated in 5% CO2 at 37°C.
Quantification of static cultures. After 48–72 hr of incubation, standard branching cultures were fixed in 4% buffered paraformaldehyde. In the EphA3-Fc and Fc experiments, axon labeling was done by incubation for 5 min in 33 μmcarboxyfluorescein diacetate, succinimidyl ester in PBS (a fluorescent vital dye; Molecular Probes), which labels all living cells and their processes. Lanes and neurites were examined on an upright fluorescence microscope (Nikon Microphot FX) and photographed with a 35 mm camera using Ilford XP2 or Fujichrome film or imaged with a silicon-intensified target (SIT) camera (Hamamatsu). Lanes were visualized with UV illumination, and neurites with were visualized with fluorescein illumination for anterograde DiAsp or vital dye labeling, or rhodamine illumination for retrograde DiI labeling (see below for labeling method).
We have used two methods for quantifying retinal axon branching: anterograde and retrograde. All cases that met the following criteria were analyzed: axons were well labeled, the membrane lanes were clearly defined, and at least three axons or fascicles had grown across three or more lanes. Branch counts were normalized for variations in lane width (the first lane applied tended to be wider than the second lane). Quantification was performed on photographs or video images of cultures viewed with fluorescence illumination.
For anterograde quantification, instances in which an axon extended from another axon at approximately a right angle and was not an obvious instance of two axons intersecting were counted as branches. Anterograde quantification has fewer complications than retrograde quantitation, and therefore yields a higher number of cultures that can be analyzed. However, it does not definitively distinguish between true branches and abrupt, sharply angled deviations of axons previously fasciculated. Retrograde quantification was used to label only true branches. All cases used for anterograde quantitation of branching preferences were also prepared for retrograde quantification. For this, small deposits of a 2–5% solution of DiI in dimethylformamide (Sigma) were placed distal to the explant in fixed cultures using a Picospritzer. After 24–48 hr the dye had diffused throughout the axons that contacted the injection site. Using this method, labeled neurites proximal to the dye deposit but not extending into it can be definitively identified as branches. Statistical significance of branching preferences was assessed using the paired two-tailed, Student's t test.
Time-lapse video microscopy. A proportion of the cultures used for anterograde and retrograde analysis of axon branching were imaged with time-lapse video microscopy before fixation. Cultures were imaged for 2–17 hr, beginning at 20–36 hr of incubation. For imaging, the cultures were kept in an incubation box mounted on an upright microscope (Nikon Microphot FX). The environment in the box was maintained at 37°C in humidified 5% CO2 (95% air). The microscope was equipped with a 100 W mercury epifluorescence light source, 10, 20, and 40× super-long working distance objectives (Nikon) and 20 and 40× water immersion objectives (Nikon), all with high numerical apertures. Lanes were visualized with UV illumination, and the DiAsp-labeled axons were visualized with fluorescein illumination. To avoid photo damage to fluorescently labeled axons, video imaging was performed under low light level conditions, and axons were exposed to light for very short periods spaced at relatively long intervals. Neutral density filters were placed in the light path to reduce the intensity of the fluorescent light. An electronic shutter (Uniblitz) in the light path was controlled by Image-1 software (Universal Imaging Corp.) to open for ∼200 msec once every 2–5 min, during which four to eight images were taken with an SIT camera and averaged. Focus was monitored to ensure that changes in morphology were not the result of changes in focal plane.
Images were later transferred to an analog optical magnetic disc recorder (Panasonic) to make “movies.” Time-lapse image sequences were repeatedly played at various speeds ranging from 1 to 30 images per second, analyzed for growth rate, branch extension, branch retraction, growth cone bifurcation, and axonal deviations, and scored according to the membrane substrate on which these events occurred. Cultures in which axons appeared unhealthy, for example, axons that developed a beaded appearance or exhibited widespread retraction, were not analyzed. In all cases, branch counts were normalized for variable lane width. Statistical significance of branching preferences was assessed using the paired two-tailed, Student's t test. Figures were prepared on a Macintosh computer using Adobe Photoshop, Microsoft Excel, and Canvas software.
One potential concern with studies using time-lapse video microscopy is the possibility that photo damage modifies axonal behavior such that the analysis presents an incorrect representation of the actual events. At variance with this possibility in our experiments is the finding of no qualitative or quantitative difference in the branching preferences exhibited by retinal axons in cultures that were not imaged compared with those that were time-lapse video imaged before fixation and further analysis. A frequently observed effect of over-illumination is the cessation of axonal growth, growth cone exploration, and branching activity, and in severe cases, axon beading and retraction. However, with the precautions that we used, the axons and growth cones in our cultures maintained their viability and motility. Even if a decrease in motility or viability had occurred in our cultures, it would have had little impact on the validity of our findings because the analysis of our time-lapse video images involved quantifying the relative frequency, rather than the absolute frequency, of events within each culture.
RESULTS
RGC axons overshoot their correct termination zone, but branching along the axon shaft exhibits A-P topographic specificity
To investigate how RGC axons develop their topographic map along the A-P axis of the tectum, small focal injections of DiI were made into defined retinal locations during map development. We first analyzed cases in which injections were made into peripheral temporal retina, which maps to the anterior pole of the tectum, from E10, when these axons initiate branching, to E13, when the topographic organization of the projection can be identified (Nakamura and O'Leary, 1989). Representative cases are illustrated in Figure1. In these examples, as well as in all cases analyzed, the location of the topographically correct TZ along the A-P tectal axis was determined by mapping the injection site in the retina onto the tectum (see Materials and Methods for details). The labeling patterns reveal that the initial projection of temporal axons to the tectum is topographically imprecise: at E10 most of the axons project past the location of their topographically correct TZ in anterior tectum. Some axons have branches, most of which extend at right angles to the axon shaft. Interestingly, branch distribution is biased for the topographically correct location along the A-P axis. By E11, branching is more pronounced, and some branches have begun to develop immature arbors. The distribution of interstitial branches and arbors becomes more restricted by E12 so that most are now located at or near the correct TZ. By E13, most RGC axons establish projections to the TZ through interstitial branches. Although many of the primary axons still extend posterior to the TZ, the posterior extent of axon overshoot is decreased.
Fig. 1.

Development of topographic projection from peripheral temporal retina to anterior tectum. Confocal digital montages of DiI-labeled RGC axons in tectal whole mounts from E10 to E13. Axons were labeled by a small focal injection into peripheral temporal retina ∼1 d before fixation. Axons initially overshoot their topographically correct TZ (center of future TZ, or TZ, is marked byarrowheads) along the anterior (A)–posterior (P) tectal axis. However, branching along the axon shaft is biased for the topographically correct location of the TZ at all ages. Between E10 and E13, the topographic specificity of branch distribution increases, and the extent of axon overshoot diminishes. Topographic connections to the TZ are established by the arborization of topographically appropriate branches. The anterior edge of the tectum is at thebottom of each panel; only part of anterior tectum is shown. The location of the topographically correct TZ along the A-P tectal axis was determined, independent of the distribution of labeled axons in the tectum, by mapping the injection site in the retina onto the tectum (see Materials and Methods for details). Scale bar, 250 μm.
To confirm our qualitative impressions of topographic map development, we performed a quantitative analysis of 7–10 cases at each age (Fig.2). We used cases in which 5–15 RGC axons were well labeled, which allowed branching patterns of individual axons to be resolved unambiguously. Each axon, along with its branches, was digitally traced to determine the distributions of axons, growth cones, branches, and arbors relative to their predicted TZ (see Materials and Methods for determination of predicted TZs, analysis methods, definitions, and n values). The TZ is defined as a zone extending 250 μm both anterior and posterior to a point along the A-P tectal axis predicted by the location of the retinal injection site and the mature topographic map. The 500 μm width of the TZ is ∼5% of the A-P axis and corresponds to the approximate size of typical mature retinal arborizations labeled by small focal DiI injections in embryonic chick tectum (Thanos and Bonhoeffer, 1987;Nakamura and O'Leary, 1989).
Fig. 2.

Development of topographic projection from peripheral temporal retina to anterior tectum: quantitation of RGC axon overshoot and branch distribution. Axons were labeled by a small focal injection of DiI into peripheral temporal retina, as in Figure 1. The anterior (A)–posterior (P) tectal axis was divided into 500 μm bins; the number of labeled axons and branches in each bin was counted, and the total number at each age was summed. The x-axis plots the location of each 500 μm bin relative to the location of the topographically correct termination zone (TZ) along the A-P tectal axis, which on average was 1 mm from the anterior edge of the tectum.A, Quantitation of RGC axon overshoot. Graphed are the percentages of labeled axons that extend posteriorly past a given point along the A-P tectal axis. B, Distribution of interstitial branches along the axon shaft expressed in percentage. The number of branches in each bin is graphed as the percentage of total branches at a given age. C, Distribution of interstitial branches along the axon shaft expressed as branch density. For each age, the total number of branches in each 500 μm bin was divided by total number of labeled axons within that bin to determine the number of labeled branches per labeled axon per bin. Number of tectal whole mounts: E10 (10), E11 (7), E12 (9), E13 (7). Number of axons: E10 (104), E11 (64), E12 (68), E13 (52). Number of branches: E10 (302), E11(248), E12 (241), E13 (141). See Results for statistical tests.
This quantitative analysis shows that essentially all RGC axons overshoot the topographically appropriate location of their TZ along the A-P axis. At E10, virtually all peripheral temporal axons extend past their presumptive TZ, and more than half continue at least 1.5 mm beyond it (Fig. 2A). These measurements probably underestimate the true degree of overshoot because some peripheral temporal axons are still growing posteriorly in the tectum at E10. Well over 80% of RGC axons still extend past the TZ at E13, when the location of the emerging TZ is clearly evident. However, the mean overshoot decreases from 1.5 mm at E10 to 650 μm at E13 (p < 0.001; unpaired t test; E10:n = 104, mean = 1496 ± 68 μm SEM; E13:n = 52, mean = 658 ± 76 μm SEM). This finding that RGC axonal growth cones initially grow well past their correct TZ shows that the topographic organization of the chick retinotectal projection is not developed by direct topographic growth cone targeting.
In contrast to the lack of topographic growth cone targeting, quantitative analysis shows that branch formation exhibits topographic specificity. At all ages from E10 to E13, branch distribution shows a topographic bias for the correct A-P location of the future TZ in terms of both overall branch distribution (Fig. 2B) and branch density (Fig. 2C). Although branch distribution and density decline anterior and posterior to the appropriate site of the TZ, the decrease is asymmetric, with the slope of the decrease being steeper anterior to the TZ than posterior to it. Both branch distribution and branch density increase in topographic specificity between E10 and E13, reflecting the maturation of the map. However, even at E10, the topographic bias in branch distribution is statistically significant (p < 0.007; χ2 test; n = 302 branches).
Most axons, if not all, establish connections to the TZ through arbors elaborated by branches rather than through a terminal arborization at their leading growth cone (Figs. 1,3A) (see Materials and Methods for definitions of interstitial branch arbors and terminal arbors). Figure 3A illustrates a typical case: interstitial branches extend from the shaft of RGC axons millimeters behind their leading growth cones and grow along the medial–lateral tectal axis to the topographically appropriate TZ, where each branch forms a distinct arbor within the TZ independent of the leading growth cone. At E10 and E11, all axons that connect to the nascent TZ do so through an arborization of their interstitial branches (n = 104 and 64 axons at E10 and E11, respectively) (Fig. 3B), and all arbors in the TZ are formed by branches (Fig. 3C). At E12 and E13, most axons arborize in the TZ, and only a few axons have the appearance of forming terminal arbors (Fig. 3B). Consistent with this finding, >90% of arbors in the TZ are formed by interstitial branches (p < 0.001 for all ages; χ2 test; n = 26, 26, 74, and 75 arbors found in the TZ at E10, E11, E12, and E13, respectively) (Fig. 3C). The true percentage of axons that form terminal arbors in the TZ at E12 and E13 must be substantially lower than that measured because changes in the positioning of interstitial branches relative to the distal end of the primary axon, attributable to the elimination of overshooting axon segments posterior to the TZ, bring the distal end of many of the axons within 250 μm of the TZ resulting in arbors that had initially developed as interstitial arbors being redefined as terminal arbors (see Materials and Methods for criteria).
Fig. 3.

Arbors in the termination zone are formed by interstitial branches extended along the shafts of RGC axons. Data presented in B and C were collected from the same cases used in Figure 2. A, Arbor formation by interstitial branches that extend from the shaft of primary RGC axons to their termination zone (TZ). Shown is fluorescence photomicrograph of RGC axons in an E12 tectal whole mount, labeled by a small focal injection into peripheral temporal retina ∼3 d before fixation. Arrows mark the branch points of four interstitial branches extending from the shafts of two primary RGC axons. Each branch extends medially along the medial–lateral tectal axis and forms an immature arbor in the emerging TZ (arrowhead). Anterior is to the bottom. Scale bar, 100 μm. B, Percentage of RGC axons at E10 through E13 that arborize in their correct TZ by either the arborization of an interstitial branch or by a terminal arborization defined as an arbor formed at the distal end of the primary axon or by a branch extended from the axon shaft within 250 μm of its distal end. C, The percentage of arbors found within the TZ that are formed by an interstitial branch or meet the criteria of a terminal arbor. No terminal arbors are found at E10 and E11. The percentage of terminal arbors at E12 and E13 is an over-representation of the percentage that truly form as terminal arbors, because by these ages the overshooting segments of axons distal to the TZ have begun to be eliminated; thus, most if not all of the terminal arbors are likely formed by interstitial branches that have come to be located within 250 μm of the distal end of the retracting primary axon and thus scored as terminal arbors. See Results for nvalues and statistical tests.
In conclusion, our quantitative data on the A-P distributions of growth cones and interstitial branches, and the mode of arbor formation within the TZ, strongly suggest that chick retinotectal topography is established by the arborization of interstitial branches formed in a topographic-specific manner along the axon shaft. A direct topographic targeting and terminal arborization of the primary growth cone within the TZ appears to play little, if any, direct role in topographic mapping.
Initial branch distribution is topographically specific regardless of retinal origin of RGC axons
An analysis similar to that described above for peripheral temporal axons was done at E10 and E11 to determine whether RGCs arising throughout the retina exhibit overshoot and topographic-specific branching. At E10, we compared the distribution of axons and branches labeled by small DiI injections made into peripheral temporal and central retina (Fig. 4). Nasal axons were not included because they have not yet extended far enough to reach their topographically appropriate TZ in posterior tectum. Both sets of labeled axons overshoot their topographically appropriate TZ and both show biased distributions of branches along their lengths. As described above, axons labeled from peripheral temporal retina have a bias in branch distribution centered on the topographically correct site of their future TZ in anterior tectum, whereas the distribution of branches formed by axons labeled from central retina is centered on the topographically correct site of their future TZ in mid-tectum. Both axonal populations have a relative paucity of branches anterior and posterior to their correct TZ (Fig.4). At E11, axons arising from peripheral temporal, central, and peripheral nasal retina all overshoot the topographically correct site of their future TZ but exhibit a topographic bias in branch distribution centered on their future TZ (Fig.5A). Quantitation of branch distribution confirms that branch number peaks at the location of the topographically correct TZ and exhibits a sharp decline both anterior and posterior to it (Fig. 5B). In conclusion, these findings indicate that axons arising from all retinal regions overshoot their topographically correct TZ but exhibit a topographic bias in branching along the A-P tectal axis appropriate for the location of their future TZ.
Fig. 4.

Initial branch distribution along the anterior–posterior tectal axis is topographically specific regardless of retinal origin of RGC axons. Shown are confocal digital montages of RGC axons in tectal whole mounts labeled by a small focal DiI injection into peripheral temporal retina or central retina 1 d before fixation late on E10. Axons overshoot their topographically correct termination zone (TZ; marked bybrackets), but the distribution of interstitial branches along the axon shafts is strongly biased for the location of the future TZ along the anterior (A)–posterior (P) tectal axis at all ages. The location of the topographically correct TZ along the A-P tectal axis was determined, independent of the distribution of labeled axons in the tectum, by mapping the injection site in the retina onto the tectum (see Materials and Methods for details). The injection sites are plotted on drawings of the retinal whole mounts and marked by arrows. Scale bar, 500 μm. D, Dorsal; N, nasal;T, temporal; V, ventral.
RGC axons overshoot their correct termination zone in a position-dependent manner
Over the course of analyzing the branching patterns of RGC axons labeled from temporal, central, or nasal retina at E11, we noted that the magnitude of axon overshoot of their TZ qualitatively appeared to vary with retinal origin, with temporal axons exhibiting the greatest overshoot of their topographically appropriate TZ and nasal axons exhibiting the least (Fig. 5A). Analyses done at E10, E12, and E13 give similar results (data not shown). To assess quantitatively the relationship between the magnitude of overshoot and retinal position, we measured at E11 the mean overshoot for RGC axons relative to the retinal location of a focal DiI injection (Fig. 5C). Peripheral temporal axons have a mean overshoot of 2 mm, which is threefold greater than the 0.65 mm mean overshoot exhibited by peripheral nasal axons. The mean overshoot progressively decreases as the injection site moves from peripheral temporal to peripheral nasal retina (r = −0.948; p < 0.0001; correlation z test; n = 13) (Fig.5C). These findings show that initial growth cone targeting does exhibit a form of topography because, as a population, RGC axons arising from different positions in the retina stop at different locations in the tectum; however, these locations are substantially posterior to the topographically appropriate TZs.
Refinement of the topographic map
Map refinement occurs through an increase in the topographic specificity of interstitial branch and arbor distributions. Arbors become more restricted such that the percentage of interstitial arbors located in the TZ increases from 55% at E10 to 93% at E13 (p < 0.001; χ2test; n = 55 and 77 arbors at E10 and E13, respectively). The A-P extent of the branch distribution also becomes more restricted to the topographically correct TZ: at E10, 32% of branches are found in the TZ, compared with 58% at E13 (p < 0.001; χ2test; n = 302 and 141 branches at E10 and E13, respectively) (Fig. 2B).
Examination of the mechanisms that underlie increased branch specificity show that both branch addition and branch elimination are differentially regulated over the length of the axon during map refinement. From E10 to E13, branch density outside of the TZ decreases by 38% from 0.51 to 0.35 branches per 500 μm segment of axon, whereas branch density in the TZ increases by 58% from 0.92 to 1.58 branches (Fig. 2C). Elimination of the “overshooting” segments of the axon posterior to the TZ, and a relatively small percentage of branches formed along these segments, also contributes to map refinement. However, because overall branch density posterior to the TZ decreases substantially over this same period, the contribution of branch retraction independent of axon elimination to the increase in topographic specificity in branch distribution is significant.
Mechanisms underlying map refinement can be further discerned by comparing changes in the number and distribution of branches during the remodeling process. From E10 to E11, mean number of branches per axon increases by 35%, from 2.9 to 3.9 (p < 0.025; Mann–Whitney U test; n = 104 and 64 axons at E10 and E11, respectively), then from E11 to E13 decreases to 2.7 branches per axon (p < 0.03; Mann–WhitneyU test; n = 64 and 52 axons at E11 and E13) (Fig. 6A). Branch density increases substantially in the TZ from E10 to E11, and the relative increases in branch density at locations close to the TZ are much greater than along the remainder of the axon. This suggests that branches are preferentially added to more topographically correct locations during this period, which increases overall specificity. In contrast, most of the branches lost from E11 to E13 are eliminated from locations outside the TZ, indicated by similar branch densities at E11, E12, and E13 in the TZ and decreased branch density both anterior and posterior to the TZ during this time. Preferential branch addition in the TZ and branch elimination outside the TZ explain how the percentage of branches found in the TZ can increase by nearly twofold from E10 to E13 (Fig. 2B), although the average number of branches at E10 and E13 is virtually the same (p > 0.9; Mann–Whitney U test;n = 104 and 52 axons at E10 and E13) (Fig.6A).
Fig. 6.

Refinement of the retinotectal map occurs through topographic branch extension and ectopic branch elimination. Axons were labeled by a small focal injection of DiI into peripheral temporal retina ∼1 d before fixation on E10–E13, as in Figure 1.A, Average number of branches per axon. Branch addition from E10 to E11 occurs primarily in the termination zone (TZ), whereas branch elimination from E11 to E13 occurs primarily outside of the TZ (refer to changes in branch density in Fig.2C). B, Distribution of interstitial branches according to length expressed in percentage. The anterior (A)–posterior (P) tectal axis was divided into 500 μm bins relative to the location of the topographically correct TZ, and the number of branches in each bin is graphed as the percentage of total branches of a given range of length. Analyses were done at E12 and E13, and data were pooled. Longer interstitial branches exhibit greater topographic specificity, indicating that topographically appropriate branches are preferentially extended. See Results for n values and statistical tests.
Further analysis indicates that branches positioned near the TZ preferentially extend and arborize. At E12 and E13, branch distributions peak at the TZ regardless of branch length (Fig.6B). However, longer branches show greater topographic specificity than shorter branches. More than 60% of branches 100–250 μm in length are found in the TZ, whereas branches 5–20 μm in length have a much broader distribution, with 33% found in the TZ (p < 0.005; χ2 test; n = 57 branches, 5–20 μm; n = 158 branches, 100–250 μm). Consistent with this finding, 55% of arbors compared with only 31% of branches are found in the TZ at E10 (p < 0.015; χ2 test; n = 302 branches and n = 53 arbors). By E13, >93% of all arbors are located in the TZ compared with 58% of branches (p < 0.001; χ2test; n = 141 branches and n = 77 arbors). This suggests that initial branch formation is less topographically specific than the subsequent arborization of these branches and that branches located within the TZ exhibit a very pronounced bias to extend and arborize at later ages. Thus, the preferential extension and stabilization of appropriately positioned branches appears to contribute to the increased specificity in the map observed from E10 to E13.
Retinal axons exhibit topographic specificity in branchingin vitro
To investigate potential mechanisms that control the specificity in RGC axon branching observed in vivo, we analyzed the branching of chick RGC axons in vitro using a modified version of the membrane stripe assay (Fig.7). In this assay, explants of temporal or nasal retina from E6 chicks are placed on a substrate of alternating lanes of membranes prepared from anterior or posterior tectum from E9–E10 chicks (Fig. 7A–C). The axons extend across the lanes and are labeled anterogradely with DiAsp (Fig.7A,C) or retrogradely with DiI (Fig. 7B). A larger data set can be collected with anterograde labeling because of a higher success rate of labeling and because the entire axonal population is labeled; however, in contrast to anterograde labeling, retrograde labeling unambiguously identifies true branches (Fig. 7D).
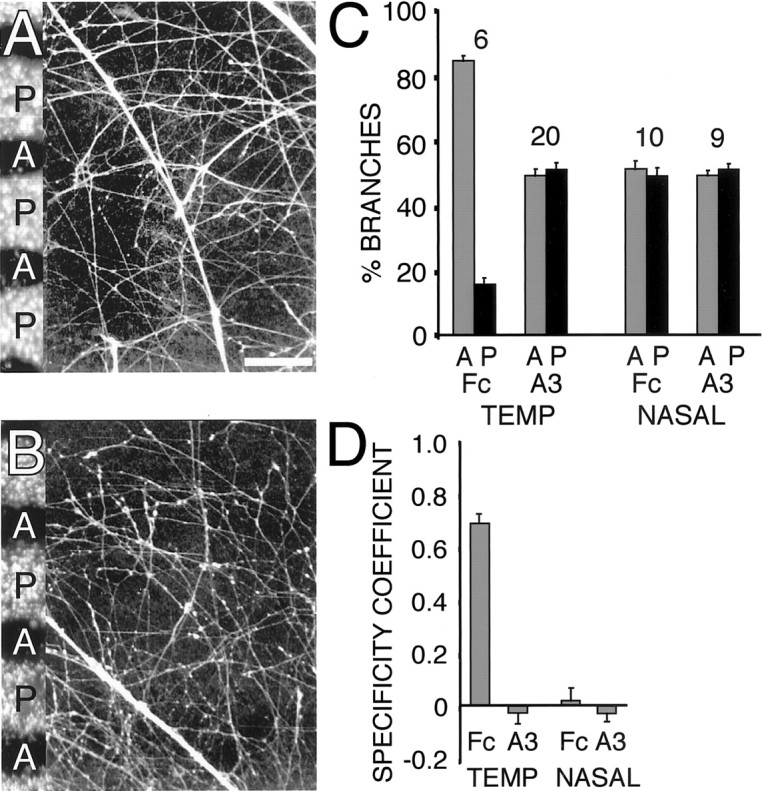
Fig. 7.

Chick temporal retinal axons exhibit topographic specificity in branching in vitro. Anterograde and retrograde axon labeling was used to assess the branching preferences of temporal and nasal retinal axons extending across alternating lanes of anterior and posterior tectal membranes. A, Anterograde DiAsp labeling of temporal axons. Temporal axons form a dense network of processes on the anterior membrane lanes (A), oriented perpendicular to the primary axons and indicative of branching, but not on posterior membrane lanes (P). B, Retrograde DiI labeling of temporal axons. A deposit of DiI (top) retrogradely labels axons that contact it and all of their branches. Branch formation by temporal axons is strongly biased for anterior membranes; few branch points are found on posterior membranes. C, Anterograde DiAsp labeling of nasal axons. Nasal axons branch profusely but show no branching preference for either anterior or posterior membranes. Scale bars, 100 μm. D, Quantification scheme. Long axis of retinal explants (elongated ovals) were parallel to tectal membrane lanes such that retinal axons would extend perpendicular to the lanes. Circles mark intersections between labeled processes that may be scored as branches. Anterograde labeling: DiAsp was used to anterogradely label retinal axons. Axons extending at approximately right angles from other axons were scored as branches. Instances in which axons intersect and both processes clearly extend beyond the intersection were not counted to minimize the misidentification of defasciculating or crossing axons as branches. Retrograde labeling: retrograde DiI labeling in fixed cultures was used to identify branches unambiguously. Labeled processes proximal to a DiI deposit (black“cloud”) but not in contact with it, and which extend from DiI-labeled axons that do contact the deposit, were scored as branches. Not all axons labeled by anterograde method are labeled by the retrograde method. E, Quantification of branching of temporal and nasal axons. Shown is the percentage of branches present on anterior and posterior membranes; the number of branches on each membrane type was normalized for lane width. Temporal axon branches are preferentially found on anterior membranes. Branch distributions obtained with anterograde (ant) and retrograde (retro) labeling are similar. The distribution of nasal axon branches does not have a bias for either set of membrane lanes. The number of cultures of each type quantified is indicated.F, The same data in E expressed as a specificity coefficient [(number of branches on anterior membranes − number of branches on posterior membranes)/total number of branches]. Positive coefficients of branching indicate specificity for anterior membrane lanes; negative coefficients indicate specificity for posterior membrane lanes. For example, a coefficient of 1 indicates that all branches are on anterior membrane lanes; 0 indicates an equal number of branches on each set of lanes. See Results for n values and statistical tests.
Temporal axons show a strong bias in branch distribution, with most branches found on anterior tectal membranes and few branches on posterior tectal membranes, whether the axons are labeled anterogradely (Fig. 7A) or retrogradely (Fig. 7B). In contrast, nasal axons do not exhibit a branching bias for either the anterior or posterior membrane lanes (Fig. 7C). Quantification of the anterogradely labeled cultures shows that 83 ± 1.5% of branches along temporal axons are found on anterior membrane lanes (n = 95 cultures, >2500 branches; p < 0.0001, Student's t test), whereas nasal axon branches are equally distributed (Fig.7E,F), with 53 ± 2.8% formed on anterior membrane lanes (n = 14 cultures, >400 branches; p < 0.0001). These data yield a branching specificity coefficient of 0.67 ± 0.03 for temporal axons and 0.06 ± 0.06 for nasal axons (Fig.7F). Quantitation of the retrogradely labeled cultures yielded branch distributions similar to those obtained with anterograde labeling (Fig.7E,F): 85 ± 2.6% of temporal axon branches are found on anterior membrane lanes (n = 15 cultures, >300 branches; p < 0.0001), and 57 ± 5.6% of nasal axon branches are found on anterior membrane lanes (n = 10 cultures, >200 branches; p < 0.0001). These data yield a branching specificity coefficient of 0.70 ± 0.05 for temporal axons and 0.14 ± 0.11 for nasal axons (Fig. 7F). The order in which the anterior and posterior membrane lanes were applied to the filter was reversed in approximately half of the experiments and found to have no significant reproducible effect on branch distribution (data not shown). These findings demonstrate that branches formed by temporal axons are preferentially distributed on anterior tectal membranes, their topographically appropriate substrate, whereas nasal axons show no significant preference.
Topographic branching in vitro is generated by ephrin-A-mediated inhibition of branching
Our in vitro findings indicate that molecules preferentially associated with either anterior or posterior tectal membranes control the topographic branching of temporal axons. Because ephrin-As, which are anchored to the cell membrane via a GPI-linkage, are present at higher levels in posterior tectum than in anterior tectum and preferentially repel or collapse temporal RGC axon growth cones, we suspected that the level of ephrin-As in posterior tectum can inhibit branching along temporal axons. To test this idea, we performed the membrane branching assay in the presence of soluble EphA3 receptor bodies, which bind ephrin-As on tectal membranes and prevent EphA receptors on retinal axons from encountering and being activated by them (Marcus et al., 2000). Previous reports have shown the viability of this approach in the membrane stripe assay (Ciossek et al., 1998). For these assays, we added to the media either 400 ng/ml of a recombinant mouse EphA3-Fc protein (EphA3 with the cytoplasmic domain replaced by the Fc portion of human IgG) or 400–800 ng/ml of the Fc portion of human IgG. In the standard membrane stripe assay used to assess axonal growth preferences, the level of EphA3-Fc used eliminated the normal strong preference of temporal axons to grow on anterior tectal membranes caused by ephrin-A repellents on posterior tectal membranes and had no effect on nasal axons (data not shown). The human-Fc had no effect on the growth preferences of retinal axons at any concentration examined, which ranged from 10 to 1500 ng/ml (data not shown).
In the presence of soluble EphA3-Fc, temporal axons do not exhibit their normal strong preference to branch on anterior membranes and instead branch equally on anterior and posterior membranes (Fig.8A,C), similar to nasal axons with or without the addition of soluble EphA3-Fc (Fig. 8B,C). The branching preferences of temporal and nasal axons in the presence of human-Fc is the same as that observed on untreated tectal membranes (Fig.8C). In the presence of Fc, 84 ± 1.9% of branches on temporal axons are on anterior membranes (n = 6 cultures, >200 branches; p < 0.0001), with a branching specificity coefficient of 0.69 ± 0.04 (Fig.8C,D). However, in the presence of EphA3-Fc, this preference was abolished, with 49 ± 2.0% of branches on anterior membranes (n = 20 cultures, >1000 branches; p = 0.68; branching specificity coefficient of −0.02 ± 0.04) (Fig. 8C,D). Nasal axons did not show a preference for either set of membrane lanes in the presence of Fc (51 ± 2.5% branches on anterior membranes;n = 10 cultures, >750 branches; p = 0.82; branching specificity coefficient of 0.01 ± 0.05) or EphA3-Fc (49 ± 1.6% branches on anterior membranes;n = 9 cultures, >700 branches; p = 0.51; branching specificity coefficient of −0.02 ± 0.03) (Fig.8C,D).
Fig. 8.
Branching specificity of temporal axons on anterior tectal membranes is attributable to ephrin-A inhibition of branching on posterior tectal membranes. A,B, Branching assays performed with EphA3-Fc added to the media to assess the effect of blocking ephrin-A function on the branching of temporal (A) or nasal (B) retinal axons. As a control, human-Fc was added to the media of similar cultures. In the presence of EphA3-Fc, both temporal and nasal axons branch equally well on anterior (A) and posterior (P) tectal membranes. C, Quantitation of branching. Percentage of branches formed on anterior and posterior membrane lanes, normalized for lane width (number of cultures for each condition noted above each set of bars). Temporal axons show a branching preference for anterior membranes in control Fc cultures but not in cultures containing EphA3-Fc. Nasal axons show no branching bias in the presence of either control Fc or EphA3-Fc.D, Specificity coefficients show that EphA3-Fc abolishes temporal axon preference for branching on anterior membranes. See Figure 7 legend for definitions and scoring criteria. See Results for n values and statistical tests. Scale bar, 100 μm. A3, EphA3-Fc in media; Fc, human-Fc in media; TEMP, temporal.
These findings indicate that the strong preference of temporal axons to branch on anterior tectal membranes is caused by an ephrin-A-mediated inhibition of branching on posterior tectal membranes. These findings also suggest that the levels of ephrin-As present in posterior tectum are sufficient to inhibit branching along temporal axons.
Dynamics of branching specificity revealed with time-lapse video microscopy: modes of axon branching
To determine the mechanisms that lead to the strong bias in the distribution of temporal axon branches in the branching assay, we used low light level video microscopy to image over time living retinal axons in approximately one-fourth of the cultures anterogradely labeled with DiAsp. We were especially interested in determining the mode by which branches form and whether the branching specificity observed in fixed cultures is caused by preferential branch extension on anterior membranes or by branch retraction on posterior membranes. True axon branching can occur by the de novo formation of a branch along the axon shaft or by the bifurcation of the growth cone. In addition, the sharp deviation of an axon from a fascicle can occasionally give the appearance of branching. Anterograde labeling of fixed cultures does not distinguish between the true branching of axons attributable to interstitial branching or growth cone bifurcation from the appearance of branching attributable to a sharply angled deviation of an axon from a fascicle, whereas retrograde labeling does not distinguish between interstitial branching and growth cone bifurcation.
Time-lapse video microscopy shows that all three events occur in vitro, with interstitial branching accounting for 22% of the total number of “branches” scored, growth cone bifurcation accounting for 7%, and apparent deviations accounting for 71%. Examples of the branching of temporal axons on anterior membranes are illustrated in Figures 9 and10. Figure 9 shows an example of a branch forming just behind the growth cone, an appearance that resembles “backbranching” described by Harris et al. (1987) in frog tectum (although in backbranching, the growth cone ceases its extension and together with the backbranch forms a terminal arbor). Figure 10shows an interstitial branch forming along the axon shaft well behind the growth cone; this more closely resembles the branching phenomena that we describe in vivo in chick tectum. Interstitial branch formation occurs both while the growth cone of the primary axon is actively extending over the membrane carpet and when it remains in place. We did not observe a consistent correlation between a growth cone contacting a lane border and the extension of an interstitial branch behind it, nor with branching and the rate of growth cone advance. Interstitial branches often form at the border between anterior and posterior lanes, but they are also commonly observed to form within an anterior lane well away from its borders. Figure11A shows an example of the branching of a temporal axon by growth cone bifurcation on an anterior membrane lane: the growth cone of the elongating axon divides, and each of the new tips extends as an independent axon collateral. Analysis of time-lapse movies reveals that growth cones often advance along previously established axons, and when they deviate at a sharp angle from the axon fascicle, the resultant static image (similar to that obtained in the analysis of fixed cultures) in some instances can have the appearance of a branch (Fig. 11B).
Fig. 9.

Branch forming on an anterior membrane lane a short distance behind the growth cone of a chick temporal retinal axon observed with time-lapse video microscopy. A,B, Low-power view of axons (A) and membrane lanes with posterior membrane lanes labeled with fluorescent microspheres (B). The point of branching is marked with an arrow in A, as well as inC–G. C–G, Formation of the branch over time. The branch is not apparent inC but is visible 10 min later in D. Both the branch (arrowhead in A andE–G) and the main axon (small arrow in A andE–G) deviate and grow along the anterior membrane lane (F, G). In this case, both the branch and the main axon stop on the anterior membrane lane when they reach its border with the posterior membrane lane; their growth cones collapse, and they subsequently retract (data not shown). The hours and minutes elapsed are noted on bottom right of each panel. Scale bar (shown in A forA and B): 50 μm; (shown inG for C–G): 50 μm.A, Anterior membrane lane; P, posterior membrane lane.
Fig. 10.

Interstitial branching along the shaft of a chick temporal retinal axon observed with time-lapse video microscopy. Example of a branch extending from an axon shaft on an anterior membrane lane. A, B, Low-power views of axons (A) and lanes with posterior membrane lanes labeled by fluorescent microspheres (B). Thearrow in A marks an interstitial branch.C–F, High-power time-lapse views of thede novo formation of the interstitial branch marked inA; this branch forms well behind the leading growth cone. The branch evident in D–F is not present in C (arrow). The tension exerted by the branch pulls the primary axon laterally. The hours and minutes elapsed are noted on bottom left of panels. Scale bar (shown in F): A, B, 100 μm; C–F, 50 μm.A, Anterior membrane lane; P, posterior membrane lane.
Fig. 11.

Growth cone bifurcation and axon deviations observed with time-lapse microscopy. A, Retinal axon branching attributable to growth cone bifurcation. The growth cone of the axon (white arrow) bifurcates, forming two distinct axon branches that diverge and extend. B, Deviation of an axon from a fascicle. Fasciculated axons are present at time 0. Another axon has grown diagonally down from the top left corner of the field (left-most arrow), contacting an axon fascicle (right-most arrow). After growing briefly down the fascicle, the axon deviates from fascicle (middle arrow) and resumes growth on the membrane substrate. The hours and minutes elapsed are noted on bottom left of each panel. Scale bars, 25 μm.
Time-lapse analysis of the generation of branching specificityin vitro
Because anterograde quantification does not distinguish between true branches and the appearance of branching by axon deviation from a fascicle, the time-lapse equivalent to anterograde quantification is the sum of all three types of events analyzed: interstitial branching, growth cone bifurcations, and abrupt axon deviations. Analysis of time-lapse videos of temporal axons reveals that all three events occur predominantly on anterior membrane lanes, with a range of 86–94% (number of branching events analyzed and statistical significance for branching events on anterior versus posterior membranes: bifurcations, > 40, p < 0.0001; interstitial branching, > 125,p < 0.0005; deviations, > 400, p < 0.0001) (Fig. 12A). When the data for the three events are summed for temporal axons, the percentage of events on anterior membrane lanes and the specificity coefficient (91%; p < 0.0001; specificity coefficient 0.82) (Fig. 12A,C) are similar to those obtained with anterograde quantification of fixed cultures (Fig.7E,F).
Fig. 12.

Branch extension and branch retraction contribute to temporal retinal axon branching specificity. A, Characterization of extension events seen with time-lapse imaging. Percentage of events observed on anterior membranes and posterior membranes. Interstitial branching (interst), growth cone bifurcations (bifur), and deviations (deviat) each occur more frequently on anterior membranes. The combined total of these events (total) is the time-lapse equivalent of the branching data obtained with anterograde quantification of fixed cultures. B, Percentage of branch extension (ext; i.e., the combined total of interstitial branching and growth cone bifurcation) and branch retraction (ret) observed on anterior membranes and posterior membranes. The combined total of interstitial branching and growth cone bifurcation is the time-lapse equivalent of retrograde quantification of fixed cultures.C, Specificity coefficients (number of events on anterior lanes − number of events on posterior lanes)/total number of events) for the combined events “total” data inA and the branch extension and retraction events data inB. A coefficient of 1 indicates that the events occur only on anterior lanes, and a coefficient of 0 indicates that they occur equally often on anterior and posterior lanes. Because retractions are regressive events, a negative coefficient of retraction indicates a contribution to a positive branching coefficient. See Results for n values and statistical tests.A, Anterior; P, posterior.
The time-lapse equivalent of retrograde quantification of fixed cultures is the sum of the true branching events, interstitial branching and growth cone bifurcation. Summing of these two events for temporal axons yields a percentage on anterior membrane lanes and a specificity coefficient (89%; p < 0.0001; specificity coefficient 0.78) (Fig. 12B,C) similar to the branching data obtained with retrograde quantification of fixed cultures (Fig.7E,F). These data indicate that the bias in the distribution of temporal axon branches is caused by the preferential extension of branches on topographically correct anterior membranes. In conclusion, our time-lapse findings indicate that temporal axons show a strong preference to branch on their topographically appropriate tectal membranes.
Time-lapse video analysis reveals that branch retraction (n > 100 retractions analyzed) contributes to generating the biased distribution of temporal axon branches on anterior membrane lanes observed in fixed cultures. Branches extended by temporal axons are approximately twice as likely to retract on posterior membrane lanes than on anterior membrane lanes (65% retract from posterior membranes; p < 0.02) (Fig.12B,C). However, for equivalent time and fields of time-lapse analysis, branch extension is five times more frequent than branch retraction. These findings indicate that the principal factor in establishing topographic specificity in branch distribution exhibited by temporal axons in vitro is their preferential extension of branches on anterior membrane lanes, although a bias to retract branches from posterior membranes sharpens their topographic specificity in branch distribution.
DISCUSSION
Figure 13 summarizes our in vivo findings on the development of topography, which include the following: (1) RGC axons overshoot the topographic location of their TZ along the A-P tectal axis by a distance that varies with their origin along the temporal–nasal retinal axis; (2) arbors are established by branches that form along the axon shaft, and branches at the appropriate A-P location preferentially arborize; and (3) axon branching is topographically specific along the A-P axis, even at the earliest stages that branches are detected. We show in vitrothat temporal axons extending across alternating lanes of anterior or posterior tectal membranes preferentially branch on anterior membranes. Use of EphA3-Fc to block ephrin-A function abolishes this branching specificity and indicates that the level of ephrin-As in posterior tectum is sufficient to inhibit temporal axon branching.
Fig. 13.

Stages in the development of topographic organization in the chick retinotectal projection. RGC axons initially exhibit a position-dependent, differential overshoot of the topographic location of their TZ along the anterior (A)–posterior (P) tectal axis: temporal axons overshoot the greatest distance and nasal axons the least. In contrast, branches form along the shaft of RGC axons with a substantial degree of topographic specificity for the A-P location of their future TZ. Topography is enhanced through the preferential arborization of appropriately positioned branches and elimination of ectopic branches. N, Nasal; T, temporal.
Our findings show that topographic branching along the shaft of RGC axons is the critical event in developing the retinotectal map. To date, the role of axon guidance molecules in RGC axon mapping has focused on topographic growth cone targeting. However, the topographic branching of RGC axons imposes different and more substantial requirements on the molecular control of mapping than does growth cone targeting and requires a reconsideration of mechanisms and the action of ephrin-As in this process (Fig.14).
Fig. 14.

Actions and limitations of ephrin-As in retinotectal map development and the hypothetical contributions of other graded activities to generate topographic branching of RGC axons.A, The top panel schematizes the approximate gradient profiles for EphA receptors and ephrin-A ligands in retina and tectum, respectively. The middle andbottom panels illustrate the actions and limitation of the graded ephrin-A repellents in topographic mapping, as indicated by our findings. Temporal axons have higher levels of EphA receptors than nasal axons; therefore, temporal axon growth cones will reach a level of ephrin-A repellent signal sufficient to stop their advance anterior to that for nasal axon growth cones. The nonlinear increasing ephrin-A repellent gradient across the anterior (A)–posterior (P) tectal axis can account for the differential, position-dependent overshoot of the termination zone (TZ) exhibited by RGC axons, which is greatest for temporal axons and progressively declines for axons originating from more nasal locations. Because the slope is shallow in anterior tectum, temporal axons must extend farther past their future TZ than nasal axons to achieve the same change in relative and absolute levels of ephrin-As. In contrast, the ephrin-A repellent gradient alone is insufficient to generate topographic branching along RGC axons. The ephrin-As can inhibit branching along the segment of the overshooting axons posterior to their correct TZ, but anterior to the correct TZ, the level of ephrin-A repellent signal experienced by the axon shaft would be below the threshold required to inhibit branching. Thus, if only the tectal ephrin-As regulated branching, all RGC axons would exhibit increased branching at more anterior positions in the tectum, which have the lower levels of ephrin-A repellent signal.B, C, Two potential models that can account for topographic branching along RGC axons. Both models incorporate the graded ephrin-A repellent and a distinct graded activity that cooperates with it to generate topographic branching. In each case, the ephrin-A repellent prevents branching along the axon shaft posterior to the TZ, and the distinct graded activity regulates branching along axons anterior to their TZ. The model inB includes a distinct repellent in a gradient that opposes the ephrin-A gradient and acts by inhibiting branching along the axon shaft anterior to the TZ. Thus, branching along the axon shaft occurs at an A-P tectal position below threshold for branch inhibition for both of the repellent signals. The model in Cincludes a branch-promoting activity in a gradient that parallels the ephrin-A gradient. In this model, branching along the axon shaft occurs at an A-P tectal position above threshold for the branch-promoting signal but below threshold for branch inhibition by the ephrin-A repellent signal. In each model, the position along the A-P tectal axis at which an axon shaft exhibits preferential branching depends on axon origin along the nasal–temporal retinal axis, which determines the level of receptor expression for the two distinct activities.N, Nasal; T, temporal.
Regulation of topographic branching through combinatorial graded activities
The development of topographic retinotectal connections in frogs (Holt, 1983, 1984; Sakaguchi and Murphey, 1985; Fujisawa, 1987) and fish (Stuermer, 1988) occurs through the topographic targeting and terminal arborization of RGC axon growth cones. In these species, RGC growth cones do not overshoot their correct TZ but target it appropriately and form terminal arbors in part through a process termed backbranching. Backbranching was observed using time-lapse video microscopy of developing retinotectal axons in Xenopus byHarris et al. (1987), and subsequently by others in frog (O'Rourke et al., 1994) and zebrafish (Kaethner and Stuermer, 1992), and is characterized by the formation of short terminal branches at or near the base of the leading growth cone as a mechanism used by RGC axons to elaborate terminal arborizations in the tectum. Concurrent with backbranching, the growth cone ceases its extension, often acquires a branch-like morphology, and appears to collaborate with the backbranches to form a terminal arbor. This phenomenon, as originally defined, is clearly distinct from the interstitial branching that we describe in the chick. In chick tectum, interstitial branches are found along the shaft of RGC axons millimeters behind their growth cones, and they often extend hundreds of micrometers along the medial–lateral (dorsal–ventral) tectal axis before arborizing (present study) (Nakamura and O'Leary, 1989; P. Yates and D. D. M. O'Leary, unpublished observations); each branch forms its own distinct terminal arbor and the leading growth cone does not participate in arborization.
Our observations strongly suggest that interstitial branches form along the axon shaft hundreds of micrometers, even a millimeter or more, behind the leading growth cone. For example, at E10 and E11, branches are concentrated along axon shafts at the future TZ, 1–2 mm behind the overshooting growth cones, and have the morphology of newly formed branches, i.e., they are short and simple. In addition, the number of branches per axon at the future TZ increases between E10 and E11, whereas the axon overshoot also increases. These observations are reminiscent of those made on the development of cortical layer 5 projections to the basilar pons in rodents. Static in vivoobservations of labeled layer 5 axons reveal short, simple branches concentrated along the axon shaft above the basilar pons, ∼4 mm behind the leading growth cones (O'Leary and Terashima, 1988). Time-lapse imaging of living hemibrain preparations definitively shows that the corticopontine branches form de novo along the axon shaft millimeters behind the advancing growth cone (Bastmeyer and O'Leary, 1996).
Most models of retinotectal mapping have been based on the topographic targeting and terminal arborization of RGC growth cones. This behavior can be explained as a response to the increasing A-P gradient of ephrin-A repellents: growth cones stop when they reach a threshold level of repellent signal (Nakamoto et al., 1996). Because of their higher level of EphA3, temporal axons are more sensitive to the repellent than nasal axons and stop anterior to them. However, our findings indicate that a principal role of ephrin-As in chick retinotectal map development is to regulate topographic branching by inhibiting branch formation along the overshooting segment of RGC axons posterior to their TZ (Fig. 14A). However, the ephrin-A repellent alone is insufficient to regulate branching, and additional activities are required to prevent branching along the axon anterior to the TZ.
Although many potential mechanisms could account for topographic branching, Figure 14 illustrates two straightforward ones, each of which include a graded activity that cooperates with the ephrin-A repellent. This activity could be a branch-repellent gradient counter to ephrin-As (Fig. 14B) or a branch-promoting gradient parallel to ephrin-As (Fig. 14C), with appropriate receptor gradients in retina. The hypothetical counter-repellent could be mediated by ephrin-As and EphAs but expressed by RGCs and tectal cells, respectively. EphA3 is expressed in tectum in a decreasing A-P gradient (Connor et al., 1998), and ephrin-A2 and ephrin-A5, which appear to mediate bi-directional signaling after binding EphA3 (Huai and Drescher, 2001), are expressed on RGC axons in an increasing temporal–nasal gradient (Hornberger et al., 1999). In addition, temporal axons expressing abnormally high levels of ephrin-A2 or ephrin-A5 exhibit decreased branching and topographically aberrant and diffuse projections within anterior tectum (Hornberger et al., 1999), a phenotype consistent with axonal ephrin-As acting as receptors for an EphA3 tectal repellent. Evidence consistent with a parallel branch-promoting activity includes in vitro findings of activities that promote nasal axon growth in the posterior part of developing chick tectum (von Boxberg et al., 1993) or deafferented adult rat SC (Bahr and Wizenmann, 1996).
Position-dependent overshoot exhibited by RGC axons
We show that RGC axons initially overshoot their TZ, indicating that the level of repellent that growth cones encounter at the A-P location of their future TZ is insufficient to stop their advance. In contrast, our findings indicate that repellent levels insufficient to stop growth cone advance are sufficient to prevent branching along the axon. Thus, growth cone advance and interstitial axon branching appear to exhibit different sensitivities to ephrin-A repellents. The magnitude of overshoot is greatest for temporal axons and progressively declines for axons from more nasal locations; this decline relates to the slope of the combined A-P tectal gradients of ephrin-A2 and ephrin-A5, which is shallow in anterior tectum and increases sharply posteriorly (Monschau et al., 1997). Thus, temporal axons must extend farther past their future TZ than nasal axons to achieve the same change in relative and absolute levels of ephrin-As (Fig.14A).
Chick temporal axons have been previously reported to overshoot their TZ, but this was interpreted as a targeting error and not representative of the population (Thanos and Bonhoeffer, 1987; Nakamura and O'Leary, 1989). However, our findings indicate that the overshoot is not an error but a normal response of RGC axons to guidance molecules. The distance of overshoot along the A-P axis may be a critical parameter influencing topographic branching along the axon. For example, if receptors for molecules that influence branching are graded along the shaft of an RGC axon, then the A-P location of preferred branching along the axon would be affected by the distance of overshoot.
Topographic refinement of the retinotectal projection
We show that topographic specificity in branch distribution along the A-P tectal axis increases with age, because of an increase in branching near the TZ and a loss of branches outside it. In addition to ephrin-As expressed by tectal cells, ephrin-As expressed on RGC axons (Hornberger et al., 1999) may contribute to map development, especially refinement (McLaughlin and O'Leary, 1999). As RGC axons arborize and increase their surface area, the level of ephrin-As should also increase. Because ephrin-A2 and ephrin-A5 are expressed in a high nasal to low temporal gradient, the topographic arborization of nasal axons should result in a substantial increase in ephrin-As in posterior tectum. This increase in ephrin-As should decrease branch extension and promote the elimination of branches and overshooting axons posterior to their TZ. Thus, retinotectal map development may require the contributions of ephrin-A repellents from both tectal cells and RGC axons, which can explain why temporal axons establish permanent arborizations in posterior SC in the absence of nasal axons, although ephrin-A expression by collicular cells should be unaffected (Simon et al., 1994). Patterned neural activity is also involved in map refinement, because when activity is blocked a small proportion of overshooting RGC axons persist and establish ectopic branches and arbors well outside of their topographically correct TZ (Kobayashi et al., 1990; Simon et al., 1992).
Species differences in development of topographic maps
Studies in frogs (O'Rourke and Fraser, 1994), fish (Kaethner and Stuermer, 1992), chick (Thanos and Bonhoeffer, 1987; Nakamura and O'Leary, 1989; present study), rat (Simon and O'Leary, 1992a,b), ferret (Chalupa et al., 1996; Chalupa and Snider, 1998), and wallaby (Ding and Marotte, 1997) indicate that topographic precision of initial RGC axon targeting in the tectum/SC differs across species. These differences can likely be accounted for by differences in the expression of guidance molecules and the sensitivity of RGC axons to them, including species differences in expression levels and patterns, and family members expressed (Monschau et al., 1997; Connor et al., 1998; Frisen et al., 1998; Vidovic et al., 1999; Brown et al., 2000;Stubbs et al., 2000). For example, if the same concentration range of ephrin-As is distributed along the A-P tectal axis in zebrafish as in chick, the gradient slope would be much steeper in the smaller zebrafish tectum. If the threshold of growth cone response to ephrin-A repellents is conserved, a steeper gradient should result in enhanced topographic precision in growth cone targeting, as observed in zebrafish compared with chick. This proposal is supported by the correlation between axon overshoot and the ephrin-A gradient in chick: the greater overshoot by temporal axons than nasal axons correlates with the shallow slope of the ephrin-A gradient in anterior tectum and its steep slope in posterior tectum.
Growth cone targeting and axon branching are likely to be controlled in part by the same topographic guidance molecules. If growth cone targeting is more precise, the initial topographic specificity in branching should be more precise. Studies and models of retinotopic mapping should take both growth cone guidance and interstitial branching into account and attempt to provide a parsimonious explanation for their molecular control.
Footnotes
This work was supported by National Institutes of Health Grant EY07025. We thank Glenn Friedman for contributing to the in vivoanalyses, and Octavio Choi and Geoff Goodhill for helpful comments on this manuscript.
P.A.Y. and A.L.R. contributed equally to this work.
Correspondence should be addressed to Dennis D. M. O'Leary, Molecular Neurobiology Laboratory, The Salk Institute, 10010 North Torrey Pines Road, La Jolla, CA 92037. E-mail:doleary@salk.edu.
REFERENCES
- 1.Bahr M, Wizenmann A. Retinal ganglion cell axons recognize specific guidance cues present in the deafferented adult rat superior colliculus. J Neurosci. 1996;16:5106–5116. doi: 10.1523/JNEUROSCI.16-16-05106.1996. [DOI] [PMC free article] [PubMed] [Google Scholar]
- 2.Bastmeyer M, O'Leary DDM. Dynamics of target recognition by interstitial axon branching along developing cortical axons. J Neurosci. 1996;16:1450–1459. doi: 10.1523/JNEUROSCI.16-04-01450.1996. [DOI] [PMC free article] [PubMed] [Google Scholar]
- 3.Brown A, Yates PA, Burrola P, Ortuño D, Vaidya A, Jessell TM, Pfaff SL, O'Leary DDM, Lemke G. Topographic mapping from the retina to the midbrain is controlled by relative but not absolute levels of EphA receptor signaling. Cell. 2000;102:77–88. doi: 10.1016/s0092-8674(00)00012-x. [DOI] [PubMed] [Google Scholar]
- 4.Chalupa LM, Snider CJ. Topographic specificity in the retinocollicular projection of the developing ferret: an anterograde tracing study. J Comp Neurol. 1998;392:35–47. doi: 10.1002/(sici)1096-9861(19980302)392:1<35::aid-cne3>3.0.co;2-q. [DOI] [PubMed] [Google Scholar]
- 5.Chalupa LM, Snider CJ, Kirby MA. Topographic organization in the retinocollicular pathway of the fetal cat demonstrated by retrograde labeling of ganglion cells. J Comp Neurol. 1996;368:295–303. doi: 10.1002/(SICI)1096-9861(19960429)368:2<295::AID-CNE9>3.0.CO;2-Z. [DOI] [PubMed] [Google Scholar]
- 6.Cheng HJ, Flanagan JG. Identification and cloning of ELF-1, a developmentally expressed ligand for the Mek4 and Sek receptor tyrosine kinases. Cell. 1994;79:157–168. doi: 10.1016/0092-8674(94)90408-1. [DOI] [PubMed] [Google Scholar]
- 7.Cheng HJ, Nakamoto M, Bergemann AD, Flanagan JG. Complementary gradients in expression and binding of ELF-1 and Mek4 in development of the topographic retinotectal projection map. Cell. 1995;82:371–381. doi: 10.1016/0092-8674(95)90426-3. [DOI] [PubMed] [Google Scholar]
- 8.Ciossek T, Monschau B, Kremoser C, Loschinger J, Lang S, Muller BK, Bonhoeffer F, Drescher U. Eph receptor-ligand interactions are necessary for guidance of retinal ganglion cell axons in vitro. Eur J Neurosci. 1998;10:1574–1580. doi: 10.1046/j.1460-9568.1998.00180.x. [DOI] [PubMed] [Google Scholar]
- 9.Connor RJ, Menzel P, Pasquale EB. Expression and tyrosine phosphorylation of Eph receptors suggest multiple mechanisms in patterning of the visual system. Dev Biol. 1998;193:21–35. doi: 10.1006/dbio.1997.8786. [DOI] [PubMed] [Google Scholar]
- 10.Ding Y, Marotte LR. The initial stages of development of the retinocollicular projection in the wallaby (Macropus eugenii): distribution of ganglion cells in the retina and their axons in the superior colliculus. Anat Embryol (Berl) 1997;194:301–317. doi: 10.1007/BF00187141. [DOI] [PubMed] [Google Scholar]
- 11.Drescher U, Kremoser C, Handwerker C, Loschinger J, Noda M, Bonhoeffer F. In vitro guidance of retinal ganglion cell axons by RAGS, a 25 kDa tectal protein related to ligands for Eph receptor tyrosine kinases. Cell. 1995;82:359–370. doi: 10.1016/0092-8674(95)90425-5. [DOI] [PubMed] [Google Scholar]
- 12.Feldheim DA, Kim YI, Bergemann AD, Frisen J, Barbacid M, Flanagan JG. Genetic analysis of ephrin-A2 and ephrin-A5 shows their requirement in multiple aspects of retinocollicular mapping. Neuron. 2000;25:563–574. doi: 10.1016/s0896-6273(00)81060-0. [DOI] [PubMed] [Google Scholar]
- 13.Flanagan JG, Vanderhaeghen P. The ephrins and Eph receptors in neural development. Annu Rev Neurosci. 1998;21:309–345. doi: 10.1146/annurev.neuro.21.1.309. [DOI] [PubMed] [Google Scholar]
- 14.Frisen J, Yates PA, McLaughlin T, Friedman GC, O'Leary DDM, Barbacid M. Ephrin-A5 (AL-1/RAGS) is essential for proper retinal axon guidance and topographic mapping in the mammalian visual system. Neuron. 1998;20:235–243. doi: 10.1016/s0896-6273(00)80452-3. [DOI] [PubMed] [Google Scholar]
- 15.Fujisawa H. Mode of growth of retinal axons within the tectum of Xenopus tadpoles, and implications in the ordered neuronal connection between the retina and the tectum. J Comp Neurol. 1987;260:127–139. doi: 10.1002/cne.902600110. [DOI] [PubMed] [Google Scholar]
- 16.Hamburger V, Hamilton HL. A series of normal stages in the development of the chick embryo. J Morphol. 1951;88:49–92. [PubMed] [Google Scholar]
- 17.Harris WA, Holt CE, Bonhoeffer F. Retinal axons with and without their somata, growing to and arborizing in the tectum of Xenopus embryos: a time-lapse video study of single fibres in vivo. Development. 1987;101:123–133. doi: 10.1242/dev.101.1.123. [DOI] [PubMed] [Google Scholar]
- 18.Holt CE. The topography of the initial retinotectal projection. Prog Brain Res. 1983;58:339–345. doi: 10.1016/S0079-6123(08)60035-7. [DOI] [PubMed] [Google Scholar]
- 19.Holt CE. Does timing of axon outgrowth influence initial retinotectal topography in Xenopus? J Neurosci. 1984;4:1130–1152. doi: 10.1523/JNEUROSCI.04-04-01130.1984. [DOI] [PMC free article] [PubMed] [Google Scholar]
- 20.Hornberger MR, Dutting D, Ciossek T, Yamada T, Handwerker C, Lang S, Weth F, Huf J, Wessel R, Logan C, Tanaka H, Drescher U. Modulation of EphA receptor function by coexpressed ephrinA ligands on retinal ganglion cell axons. Neuron. 1999;22:731–742. doi: 10.1016/s0896-6273(00)80732-1. [DOI] [PubMed] [Google Scholar]
- 21.Huai J, Drescher U. An ephrin-A-dependent signaling pathway controls integrin function and is linked to the tyrosine phosphorylation of a 120-kDa protein. J Biol Chem. 2001;276:6689–6694. doi: 10.1074/jbc.M008127200. [DOI] [PubMed] [Google Scholar]
- 22.Kaethner RJ, Stuermer CA. Dynamics of terminal arbor formation and target approach of retinotectal axons in living zebrafish embryos: a time-lapse study of single axons. J Neurosci. 1992;12:3257–3271. doi: 10.1523/JNEUROSCI.12-08-03257.1992. [DOI] [PMC free article] [PubMed] [Google Scholar]
- 23.Kobayashi T, Nakamura H, Yasuda M. Disturbance of refinement of retinotectal projection in chick embryos by tetrodotoxin and grayanotoxin. Brain Res Dev Brain Res. 1990;57:29–35. doi: 10.1016/0165-3806(90)90181-w. [DOI] [PubMed] [Google Scholar]
- 24.Marcus RC, Matthews GA, Gale NW, Yancopoulos GD, Mason CA. Axon guidance in the mouse optic chiasm: retinal neurite inhibition by ephrin “A”-expressing hypothalamic cells in vitro. Dev Biol. 2000;221:132–147. doi: 10.1006/dbio.2000.9660. [DOI] [PubMed] [Google Scholar]
- 25.McLaughlin T, O'Leary DDM. Functional consequences of coincident expression of EphA receptors and ephrin-A ligands. Neuron. 1999;22:636–639. doi: 10.1016/s0896-6273(00)80718-7. [DOI] [PubMed] [Google Scholar]
- 26.Monschau B, Kremoser C, Ohta K, Tanaka H, Kaneko T, Yamada T, Handwerker C, Hornberger MR, Loschinger J, Pasquale EB, Siever DA, Verderame MF, Muller BK, Bonhoeffer F, Drescher U. Shared and distinct functions of RAGS and ELF-1 in guiding retinal axons. EMBO J. 1997;16:1258–1267. doi: 10.1093/emboj/16.6.1258. [DOI] [PMC free article] [PubMed] [Google Scholar]
- 27.Nakamoto M, Cheng HJ, Friedman GC, McLaughlin T, Hansen MJ, Yoon CH, O'Leary DDM, Flanagan JG. Topographically specific effects of ELF-1 on retinal axon guidance in vitro and retinal axon mapping in vivo. Cell. 1996;86:755–766. doi: 10.1016/s0092-8674(00)80150-6. [DOI] [PubMed] [Google Scholar]
- 28.Nakamura H, O'Leary DDM. Inaccuracies in initial growth and arborization of chick retinotectal axons followed by course corrections and axon remodeling to develop topographic order. J Neurosci. 1989;9:3776–3795. doi: 10.1523/JNEUROSCI.09-11-03776.1989. [DOI] [PMC free article] [PubMed] [Google Scholar]
- 29.O'Leary DDM, Terashima T. Cortical axons branch to multiple subcortical targets by interstitial axon budding: implications for target recognition and “waiting periods.”. Neuron. 1988;1:901–910. doi: 10.1016/0896-6273(88)90147-x. [DOI] [PubMed] [Google Scholar]
- 30.O'Leary DDM, Fawcett JW, Cowan WM. Topographic targeting errors in the retinocollicular projection and their elimination by selective ganglion cell death. J Neurosci. 1986;6:3692–3705. doi: 10.1523/JNEUROSCI.06-12-03692.1986. [DOI] [PMC free article] [PubMed] [Google Scholar]
- 31.O'Leary DDM, Yates PA, McLaughlin T. Mapping sights and smells in the brain: distinct mechanisms to achieve a common goal. Cell. 1999;96:255–269. doi: 10.1016/s0092-8674(00)80565-6. [DOI] [PubMed] [Google Scholar]
- 32.O'Rourke NA, Cline HT, Fraser SE. Rapid remodeling of retinal arbors in the tectum with and without blockade of synaptic transmission. Neuron. 1994;12:921–934. doi: 10.1016/0896-6273(94)90343-3. [DOI] [PubMed] [Google Scholar]
- 33.Roskies AL, O'Leary DDM. Control of topographic retinal axon branching by inhibitory membrane- bound molecules. Science. 1994;265:799–803. doi: 10.1126/science.8047886. [DOI] [PubMed] [Google Scholar]
- 34.Sakaguchi DS, Murphey RK. Map formation in the developing Xenopus retinotectal system: an examination of ganglion cell terminal arborizations. J Neurosci. 1985;5:3228–3245. doi: 10.1523/JNEUROSCI.05-12-03228.1985. [DOI] [PMC free article] [PubMed] [Google Scholar]
- 35.Simon DK, O'Leary DDM. Development of topographic order in the mammalian retinocollicular projection. J Neurosci. 1992a;12:1212–1232. doi: 10.1523/JNEUROSCI.12-04-01212.1992. [DOI] [PMC free article] [PubMed] [Google Scholar]
- 36.Simon DK, O'Leary DDM. Responses of retinal axons in vivo and in vitro to position-encoding molecules in the embryonic superior colliculus. Neuron. 1992b;9:977–989. doi: 10.1016/0896-6273(92)90249-d. [DOI] [PubMed] [Google Scholar]
- 37.Simon DK, Prusky GT, O'Leary DDM, Constantine-Paton M. N-methyl-d-aspartate receptor antagonists disrupt the formation of a mammalian neural map. Proc Natl Acad Sci USA. 1992;89:10593–10597. doi: 10.1073/pnas.89.22.10593. [DOI] [PMC free article] [PubMed] [Google Scholar]
- 38.Simon DK, Roskies AL, O'Leary DDM. Plasticity in the development of topographic order in the mammalian retinocollicular projection. Dev Biol. 1994;162:384–393. doi: 10.1006/dbio.1994.1095. [DOI] [PubMed] [Google Scholar]
- 39.Sperry R. Chemoaffinity in the orderly growth of nerve fiber patterns and connections. Proc Natl Acad Sci USA. 1963;50:703–710. doi: 10.1073/pnas.50.4.703. [DOI] [PMC free article] [PubMed] [Google Scholar]
- 40.Stubbs J, Palmer A, Vidovic M, Marotte LR. Graded expression of EphA3 in the retina and ephrin-A2 in the superior colliculus during initial development of coarse topography in the wallaby retinocollicular projection. Eur J Neurosci. 2000;12:3626–3636. doi: 10.1046/j.1460-9568.2000.00251.x. [DOI] [PubMed] [Google Scholar]
- 41.Stuermer CA. Retinotopic organization of the developing retinotectal projection in the zebrafish embryo. J Neurosci. 1988;8:4513–4530. doi: 10.1523/JNEUROSCI.08-12-04513.1988. [DOI] [PMC free article] [PubMed] [Google Scholar]
- 42.Thanos S, Bonhoeffer F. Axonal arborization in the developing chick retinotectal system. J Comp Neurol. 1987;261:155–164. doi: 10.1002/cne.902610114. [DOI] [PubMed] [Google Scholar]
- 43.Vidovic M, Marotte LR, Mark RF. Marsupial retinocollicular system shows differential expression of messenger RNA encoding EphA receptors and their ligands during development. J Neurosci Res. 1999;57:244–254. doi: 10.1002/(SICI)1097-4547(19990715)57:2<244::AID-JNR10>3.0.CO;2-D. [DOI] [PubMed] [Google Scholar]
- 44.von Boxberg Y, Deiss S, Schwarz U. Guidance and topographic stabilization of nasal chick retinal axons on target-derived components in vitro. Neuron. 1993;10:345–357. doi: 10.1016/0896-6273(93)90325-l. [DOI] [PubMed] [Google Scholar]
- 45.Walter J, Kern-Veits B, Huf J, Stolze B, Bonhoeffer F. Recognition of position-specific properties of tectal cell membranes by retinal axons in vitro. Development. 1987a;101:685–696. doi: 10.1242/dev.101.4.685. [DOI] [PubMed] [Google Scholar]
- 46.Walter J, Henke-Fahle S, Bonhoeffer F. Avoidance of posterior tectal membranes by temporal retinal axons. Development. 1987b;101:909–913. doi: 10.1242/dev.101.4.909. [DOI] [PubMed] [Google Scholar]