

Abstract
Neuronal immediate-early gene (IEG) expression is regulated by synaptic activity and plays an important role in the neuroplastic mechanisms critical to memory consolidation. IEGs can be divided into two functional classes: (1) regulatory transcription factors (RTFs), which can broadly influence cell function depending on the “downstream” genes they regulate, and (2) “effector” proteins, which may directly modulate specific cellular functions. The objective of the current study was to determine whether the expression of an effector IEG (Arc) was similar to, or different from, that of two well characterized RTF IEGs (c-fos andzif268) after learning. IEG RNA levels from rats trained in spatial and nonspatial water tasks were determined using RNase protection assays and in situ hybridization. Overall, the regulation of the three IEGs was similar in the hippocampus and the entorhinal and primary visual cortices. Consequently, IEG RNA levels were positively correlated within a structure. By contrast,Arc and zif268 RNA levels were not correlated or only weakly correlated across structures, although c-fos RNA levels were moderately correlated across structures. Arc RNA expression differed from that ofzif268 and c-fos in two regards: (1) hippocampal Arc RNA levels were correlated with learning of the hippocampal-dependent spatial, but not hippocampal-independent cued response, water task, and (2) Arc RNA levels in the hippocampus and entorhinal cortex increased after spatial reversal learning relative to an asymptotic performance group. Thus, although the expression of Arc, zif268, and c-fos exhibited many similarities, Arcwas most responsive to differences in behavioral task demands.
Keywords: immediate-early, gene, spatial learning, memory, water maze, Arc, c-fos, zif268, hippocampus, entorhinal cortex, RNase protection assay, in situ hybridization
The expression of specific immediate-early genes (IEGs) is induced by neural activity that produces stable changes in synaptic strength (Abraham et al., 1993;Worley et al., 1993) and by behavioral training (Hess et al., 1995;Nagahara and Handa, 1995; Seeds et al., 1995; Vann et al., 2000). This has led to the hypothesis that IEG expression plays a role in the neuroplastic mechanisms required for memory consolidation processes (Robertson, 1992; Kaczmarek, 1993; Dragunow, 1996; Tischmeyer and Grimm, 1999). Consistent with this, antisense oligonucleotide-mediated suppression of the IEG proteins c-Fos (Lamprecht and Dudai, 1996; Grimm et al., 1997; Morrow et al., 1999) or Arc (Guzowski et al., 2000) impairs long-term memory consolidation without affecting task acquisition or short-term memory. Furthermore, studies using transgenic and knock-out mice indicate a role for the IEGs zif268(Jones et al., 2001) and tissue plasminogen activator (Madani et al., 1999; Calabresi et al., 2000) in memory consolidation.
IEGs can be divided into two functional classes. One class encodes regulatory transcription factors (RTFs), which may indirectly influence cellular physiology by increasing expression of specific “downstream” genes (Herdegen and Leah, 1998; O'Donovan et al., 1999; Tischmeyer and Grimm, 1999). The second class encodes a diverse range of biological “effector” proteins, which have more defined and direct effects on cellular function than RTFs (Lanahan and Worley, 1998). Using subtractive hybridization techniques, Lanahan and Worley (1998) estimate that ∼30–40 genes constitute the total neuronal IEG response and that ∼10–15 genes encode RTF IEGs and the rest encode effector IEGs.
Experiments using artificial synaptic stimulation demonstrate that different IEGs have different stimulus thresholds for transcriptional induction (Abraham et al., 1993; Worley et al., 1993). However, the degree to which neuronal IEGs are coordinately regulated in response to physiological stimuli is not well characterized. Furthermore, the exact nature of the IEG response to synaptic input could have distinct consequences on defined neuroplastic processes. Therefore, it will be important to determine whether IEGs are expressed coordinately as discrete subsets of the total neuronal IEGs under defined physiological conditions or whether there is a generic “IEG response.”
The activity-regulated cytoskeletal-associated (Arc) gene, also termed Arg3.1 (Link et al., 1995), is an effector IEG, the RNA and protein products of which are localized to neuronal soma and dendrites (Lyford et al., 1995). As detailed in Discussion,Arc possesses many properties indicating that Arcmay play a role stabilizing activity-dependent changes in synaptic efficacy. The aim of the current study was to determine whether the physiological regulation of Arc was similar to, or different from, that of two RTF IEGs, c-fos and zif268, which have been the focus of many studies of neuroplasticity (for review, see Herrera and Robertson, 1996; Tischmeyer and Grimm, 1999). The presented findings show that the behavioral regulation ofArc RNA expression shares both similarities and differences with c-fos and zif268, but that Arcgene expression was most sensitive to changes in behavioral task demands.
MATERIALS AND METHODS
Animals
Male Sprague Dawley rats (250 gm at arrival; Charles River Breeding Laboratories) were used. The rats were individually housed in a temperature- (22°C) and light-controlled vivarium (12 hr light/ dark cycle with the lights on at 7:00 A.M.), with food and water available ad libitum, and acclimatized to laboratory conditions for ∼1 week before any handling or behavioral training.
Behavioral training procedures
Spatial water-task training. The apparatus used for all water tasks was a black tank (diameter 1.83 m, height 0.58 m) filled to a depth of ∼20 cm with water (24 ± 2°C). For the spatial task, a submerged Plexiglas platform (20 × 25 cm; 2 cm below the surface of the water) was located at a fixed position throughout the training sessions. A training session consisted of a series of six trials with a 20 sec inter-trial interval (ITI). On each trial, the rat started from one of five positions along the side of the tank. The rat was given 60 sec to find the submerged platform. If a rat did not mount the platform within the 60 sec, it was guided to the platform by hand. The time to mount the platform was recorded as training latency for each trial. The rat was allowed to remain on the platform for 20 sec before being removed to a holding cage for the ITI.
Cued water-task training. The cued task training consisted of a series of six trials with a 40 sec ITI. Each trial consisted of the rat starting from one of five random positions along the side of the water tank. The rat was given 60 sec to find the visible platform, which was marked with a black and white striped ball protruding above the surface of the water. If the rat did not mount the platform within the 60 sec, it was guided to the platform by hand. The time to mount the platform was recorded as training latency for that trial. After mounting the platform, the rat was immediately removed to a holding cage for the ITI. The visible platform was moved to different locations between each trial, so that the rat's starting position and the platform location were unique between trials.
Spatial reversal water-task training. Rats were trained in the spatial water maze (see above) over 3 d with the submerged platform located in one fixed position. On each day, the rats received two training sessions of six trials per session, separated by 30 min. On the final experimental day, one group (seventh session;n = 6) received training exactly as on the six previous sessions. For a second group (seventh session reversal;n = 6), the submerged platform was moved to a new location in the pool; these rats were familiar with the task demands but had to learn the new spatial location of the platform. A third group was also included in this experiment (first session;n = 6); these rats were trained in the spatial water task for the first time. To minimize the stress on the seventh session reversal and other two groups, all rats were placed on the platform for 10 sec before the start of each training session for this experiment.
RNA detection methods
Brain areas analyzed. The dorsal hippocampus [approximately −3.6 mm from bregma (Paxinos and Watson, 1986)] was the focus of the current study because this region has been shown to be required for acquisition and consolidation of training for the spatial water task (E. Moser et al., 1993; M. B. Moser et al., 1995;Guzowski and McGaugh, 1997; Guzowski et al., 2000). IEG RNA levels in the primary visual cortex and lateral entorhinal cortex [both at approximately −6.0 mm from bregma (Paxinos and Watson, 1986)] were also examined in one experiment. The entorhinal cortex was examined because it provides a major input to the hippocampus (for review, seeJohnson and Amaral, 1998) and is important for spatial learning (Nagahara et al., 1995; Cho and Kesner, 1996). The primary visual cortex was examined to compare IEG regulation in a primary sensory cortical area (engaged during task performance) to areas of higher order and polymodal processing (i.e., the hippocampus and entorhinal cortex).
Tissue dissection and RNA extraction for RNase protection assays. Water task-trained and caged control rats were anesthetized with sodium pentobarbital, transcardially perfused with 0.1 m phosphate buffer, and decapitated. The brains were removed rapidly, and 1-mm-thick coronal sections were prepared using a tissue matrix (Ted Pella Instruments). The sections were frozen on dry ice, and hippocampal and cortical tissue was removed using a punch technique (Palkovits and Brownstein, 1988) with a glass pipette (inner diameter 1.0 mm). Single or multiple punches were taken to remove the region of interest. Hippocampal punches removed the entire hippocampus and dentate gyrus. Punches of the primary visual or entorhinal cortices removed all neuronal layers within that region of cortex. Punches from both hemispheres were pooled for a given structure for each rat. Total RNA was prepared using TRIzol according to the manufacturer's instructions (Life Technologies-BRL). RNA concentrations were determined spectrophotometrically, and RNA aliquots were stored at −70°C until RNase protection assay (RPA) analysis.
Preparation of brain sections for fluorescent in situhybridization. Thirty minutes after training, the rats were anesthetized with sodium pentobarbital and decapitated. The brains were removed rapidly, flash frozen in isopentane equilibrated in a dry ice/ethanol slurry, and stored at −70°C for further processing. Coronal brain sections (2 mm thick) were prepared with a tissue matrix and used to create tissue blocks. Sections containing the dorsal hippocampus from one caged control rat and one water task-trained rat were placed in a plastic mold, covered with OCT media (VWR), and frozen on dry ice. This was repeated for the other caged control and water task-trained rats. Sections of tissue blocks (8 μm thick) were prepared using a cryostat and collected on Superfrost Plus slides (VWR). Slides were stored at −70°C until processing for fluorescentin situ hybridization (FISH).
Riboprobe preparation. For the RNase protection assays,32P-labeled actin, c-fos, andzif268 antisense riboprobes were prepared from commercially available plasmid templates (Ambion, Austin, TX). The Arcriboprobe was generated from a modified Arc cDNA plasmid. A nearly full-length cDNA pBluescript clone (Lyford et al., 1995) was restricted with XhoI and NdeI, treated with Klenow enzyme to blunt the DNA ends, and closed with T4 DNA ligase. These steps removed all but 195 bases of Arc 5′ sequence from bases 33–228 of the published sequence (GenBank accession numberU19866). The resulting plasmid was treated with XbaI to generate a linearized template for the synthesis of the Arcantisense riboprobe. Radioactively labeled riboprobes were generated byin vitro transcription with T7 or T3 RNA polymerases (Maxiscript kits; Ambion) and α-[32P] UTP (Amersham Pharmacia; 800 Ci/mm) at 15°C. Unlabeled UTP was added during the synthesis of the actin riboprobe but was not added during the synthesis of the IEG riboprobes. The unlabeled UTP lowered the specific activity of actin riboprobes 25-fold relative to the IEG riboprobes. Riboprobes were purified on G-50 spin columns (Amersham Pharmacia, Arlington Heights, IL).
Antisense and sense Arc riboprobes for FISH were prepared from a nearly full-length cDNA pBluescript clone (Lyford et al., 1995), as described previously (Guzowski et al., 1999). The plasmid was treated with XbaI to generate the linearized template for the antisense riboprobe and with XhoI to generate the linearized template for the sense riboprobe. Digoxigenin-labeled riboprobes were generated by in vitro transcription with T7 (antisense) or T3 (sense) RNA polymerases (Maxiscript kit; Ambion) and digoxigenin RNA labeling mix (Roche Molecular Biochemicals). Riboprobes were purified on G-50 spin columns (Amersham Pharmacia).
RNase protection assays. RNase protection assays were performed using a commercial kit (RPAII; Ambion) with minor modifications. Total RNA (10 μg) and32P-labeled riboprobes (30,000 cpm of each IEG probe plus 15,000 cpm of low specific activity actin probe) were mixed and evaporated to near dryness with a vacuum concentrator. Ten microliters of hybridization buffer were added to each tube, and samples were resuspended by repeated heating (85°C for 3 min) and vortexing. Once resuspended, samples were denatured at 85°C for 5 min and then incubated at 42°C overnight. The following day, reaction tubes were incubated with a 1:100 dilution of RNase A/T1 mix (provided with the RPAII kit) for 1 hr at room temperature. The RNase digestion reaction was terminated, and the protected RNA species were precipitated with addition of the RNase inactivation/precipitation solution (provided with the RPAII kit). The protected RNA species were separated on 5% polyacrylamide gels containing 8m urea with the full-length probes and32P-labeled DNA markers (HinfI digested φX714 DNA; Promega, Madison, WI).
Quantifying RNA levels by RNase protection assay. RPA gels were dried on Whatman 3mm paper. Dried gels were exposed to a phosphor screen for 16–36 hr and scanned using a PhosphorImager 445SI (Molecular Dynamics). Volume analysis was performed using ImageQuant software (version 1.1; Molecular Dynamics). Data values were obtained for each IEG RNA band and for the actin band, which served as an internal control. IEG values were normalized to actin values for each sample.
Fluorescent in situ hybridization.Fluorescent in situ hybridization (FISH) was performed on slide-mounted brain sections using a digoxigenin-labeledArc antisense riboprobe as described in detail elsewhere (Guzowski et al., 1999). Arc riboprobe was detected with an antidigoxigenin–horseradish peroxidase conjugate (Roche Molecular Biochemicals) and the TSA-Direct Cyanine-3 kit (NEN Life Sciences). Nuclei were counterstained with YOYO-1 (Molecular Probes), and slides were mounted with an anti-fade medium (Vectashield; Vector Laboratories, Burlingame, CA). Four slides containing the dorsal hippocampus (approximately −3.6 mm from bregma) were analyzed for each rat.
Images (1024 × 1024 pixels) were acquired using a Leica TCS-4D laser scanning confocal microscope with a krypton/argon laser. A 10× objective was used for analysis of CA1 and CA3 regions. The field of view using this objective was 1000 × 1000 μm. Confocal microscope settings (pinhole settings, and voltage settings and offset) were carefully adjusted to ensure that the full grayscale range was used and to minimize the occurrence of saturated pixels. RGB TIFF images were analyzed in Adobe Photoshop 5.5. First, the pyramidal cell layer was selected by visualizing only the color channel containing the YOYO-1 information and using the “Lasso” tool. Then, the mean pixel density value for the region of interest was determined for the color channel containing the CY3 information (ArcRNA staining). Finally, the values for the trained rats were normalized using the values from the caged controls. This normalization procedure minimizes artifact caused by slide-to-slide variation in signal intensity and background.
For analysis of Arc-positive cells in the dentate gyrus granule cell layer, a modified approach was taken because of the different pattern of Arc staining observed in the dentate. Overall, a much lower percentage of dentate gyrus granule cells expressArc as compared with CA1 and CA3 neurons (Guzowski et al., 1999). Because of this low density of Arc-positive cells in the dentate, it is more informative to count Arc-positive cells. Images were acquired with the same confocal microscope, but with a 5× objective, which yielded a field of view of 2000 × 2000 μm. Arc-positive cells were counted for each field. The total number of Arc-positive cells was determined for all four slides for each trained rat and each control rat. As done for analysis of CA1 and CA3 regions, the value obtained for each trained rat was normalized to the value for the control rat in that tissue block (see Preparation of brain sections for fluorescent in situ hybridization, above).
Statistics
For behavioral data, ANOVA or repeated measures ANOVA was used to analyze individual trials or trial sessions, respectively. Fischer's post hoc tests were used for pairwise comparisons. In some experiments, the IEG RNA data violated a principal assumption of parametric statistic tests. Specifically, the variances between groups were often different as determined using an equality of variances F test. For this reason, nonparametric tests were used in the analysis of the RNA data. For comparisons among three or more groups, the Kruskal–Wallis test was used; if α < 0.05, then pairwise comparisons were made using the Mann–WhitneyU test. For correlational analyses, the Spearman correlation coefficient, Rs, was determined. In all instances, a probability level of <0.05 was accepted as statistically significant.
RESULTS
Arc, zif268, andc-fos RNA levels are rapidly and transiently increased in the dorsal hippocampus by spatial water task training
To quantify changes in IEG RNA levels from brain RNA samples, a multiple probe RNase protection assay for the simultaneous detection ofArc, c-fos, and zif268 mRNAs was developed and used for most of the experiments described here. In addition to the IEG riboprobes, a low specific activity riboprobe for β-actin RNA was included in the RPA to normalize IEG signals between samples. The rapid induction of Arc, c-fos, andzif268 RNAs by neural activity was demonstrated in rats treated with the convulsant pentylenetetrazole (50 mg/kg, i.p.), which induced behavioral seizures. The rats were killed 45 min after the onset of seizures, hippocampi were removed, and total RNA was prepared. As expected (Morgan et al., 1987; Saffen et al., 1988; Lyford et al., 1995), hippocampal IEG RNA levels were increased by seizure activity relative to controls (Fig.1a). RPA autoradiographs of RNA from the hippocampi and the visual cortices of rats trained in different spatial water tasks demonstrate the utility of the RPA for behavioral studies (Fig. 1B); these data are part of a larger experiment shown in Figures 4 and 5 and Tables 2 and 3.
Fig. 1.
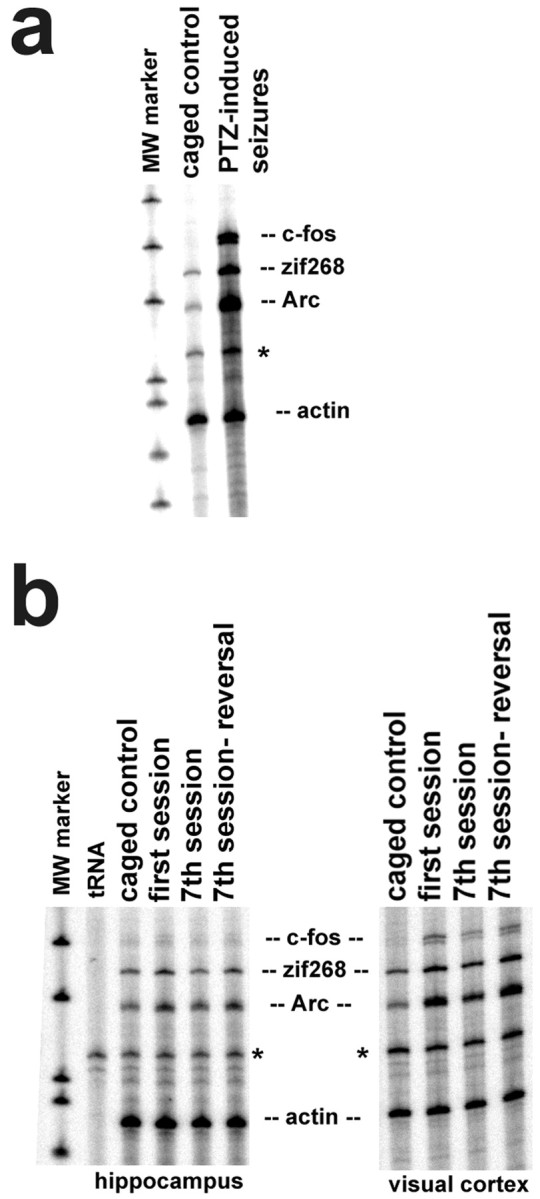
Multiple probe RNase protection assay for the simultaneous detection of Arc, c-fos, and zif268 RNAs. a, Hippocampal RNA levels for all three IEGs increased 45 min after systemic injection of pentylenetetrazole (PTZ) (50 mg/kg, i.p.) relative to caged controls. b, Detection of IEG RNAs in the hippocampus and primary visual cortex of rats trained in different versions of the spatial water task. The data shown here are from the experiment detailed in Results (Figs. 4, 5). See Materials and Methods and Results for full details of the assay and the behavioral groups. The asterisks in a and bindicate a small amount of full-length actin probe that was consistently seen in all samples.
Fig. 4.

Rapid acquisition of the spatial reversal water task. A, Performance of the seventh session and seventh session-reversal groups during pretraining. Rats were given two training sessions per day, separated by 30 min, for 3 d.B, Final session performance for all experimental groups. Performance between all groups was different on trial 1 (p < 0.01; ANOVA with Fischer'spost hoc analysis). See Materials and Methods and Results for additional details. n = 6 rats per group.
Fig. 5.
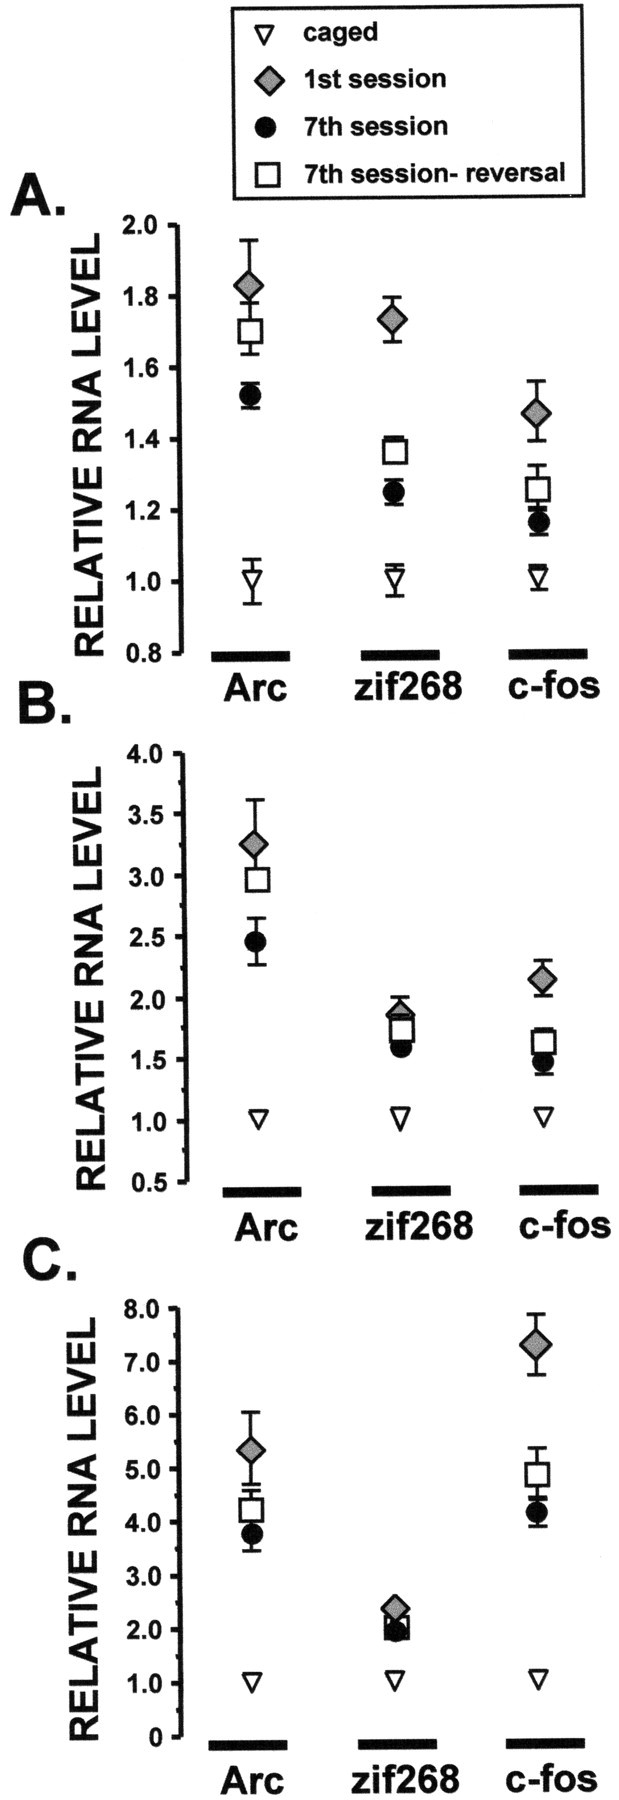
Spatial reversal training increasesArc expression in hippocampus and entorhinal cortex. Rats were trained in one of three spatial water tasks (for behavioral data, see Fig. 4) and were killed 30 min later. The experimental groups included caged, first session, seventh session, and seventh session-reversal (n = 6 rats per group). IEG RNA levels for the dorsal hippocampus (A), lateral entorhinal cortex (B), and primary visual cortex (C) were determined by RPA. IEG RNA levels for all water task-trained groups were significantly above caged control levels for each brain region (p < 0.02; Mann–Whitney U test). See Results section for additional details and statistical comparisons. n = 6 rats per group.
Table 2.
Correlations between IEG RNA levels within a structure
| Structure | IEG 1 | IEG 2 | Rs value |
|---|---|---|---|
| Hippocampus | Arc | zif268 | 0.67 |
| Arc | c-fos | 0.46 | |
| zif268 | c-fos | 0.55 | |
| Entorhinal cortex | Arc | zif268 | 0.77 |
| Arc | c-fos | 0.74 | |
| zif268 | c-fos | 0.64 | |
| Visual cortex | Arc | zif268 | 0.97 |
| Arc | c-fos | 0.77 | |
| zif268 | c-fos | 0.75 |
Table 3.
Correlations between IEG RNA levels across brain structures
| Structure 1 | Structure 2 | IEG RNA | Rsvalue |
|---|---|---|---|
| Hippocampus | Entorhinal cortex | Arc | 0.53 |
| zif268 | 0.28 | ||
| c-fos | 0.54 | ||
| Hippocampus | Visual cortex | Arc | 0.40 |
| zif268 | 0.26 | ||
| c-fos | 0.68 | ||
| Entorhinal cortex | Visual cortex | Arc | 0.45 |
| zif268 | 0.58 | ||
| c-fos | 0.81 |
To investigate the regulation of Arc, c-fos, andzif268 by limited behavioral training, rats were trained in a single session of the spatial water task. The dorsal hippocampus was the focus of all of the current experiments because lesion studies have revealed this region to be critical for spatial water-task acquisition (E. Moser et al., 1993; M. B. Moser et al., 1995). Moreover, transient disruption of CREB (Guzowski and McGaugh, 1997) orArc (Guzowski et al., 2000) protein expression in the dorsal hippocampus impairs long-term memory for spatial water-task training without affecting task acquisition or short-term memory. The rats were given six trials to learn the location of the submerged platform. Training lasted for ∼8–10 min for each rat. Task performance improved significantly during the training session (data not shown;p < 0.0001, repeated measures ANOVA). At 0.5, 2, or 6 hr after training, the rats were killed, and tissue was dissected from the dorsal hippocampus. Session training performance was not different between rats in any of the time point groups (data not shown;p = 0.85, repeated measures ANOVA). Hippocampal IEG RNA levels from the trained rats and caged control rats were analyzed by RPA. Levels of all three IEG RNAs were significantly higher than caged controls at 0.5 hr, but not 2 or 6 hr, after training (Fig.2) (p < 0.05, for each Mann–Whitney U test).
Fig. 2.

Rapid and transient increase in hippocampal IEG RNA levels after spatial water-task training. IEG RNA levels from rats killed at 0.5, 2, and 6 hr after spatial water-task training were compared with caged control levels using the multiple probe RPA. RNA levels for all three IEGs were significantly above control levels at 0.5 hr after training, and c-fos RNA levels were lower than caged control levels 6 hr after training. *p< 0.05 relative to caged (0 hr) group, Mann–Whitney Utest. n = 3–5 rats per group.
Hippocampal IEG RNA expression of rats trained in either the spatial or cued water task
Separate groups of rats were trained in either the spatial or cued water tasks. Task acquisition, as measured by latency to mount either the visible or the submerged platforms, was similar between the two groups (Fig. 3A) (p = 0.24, repeated measures ANOVA). The rats were killed 30 min after training, and hippocampal IEG RNA levels were quantified by RPA.
Fig. 3.
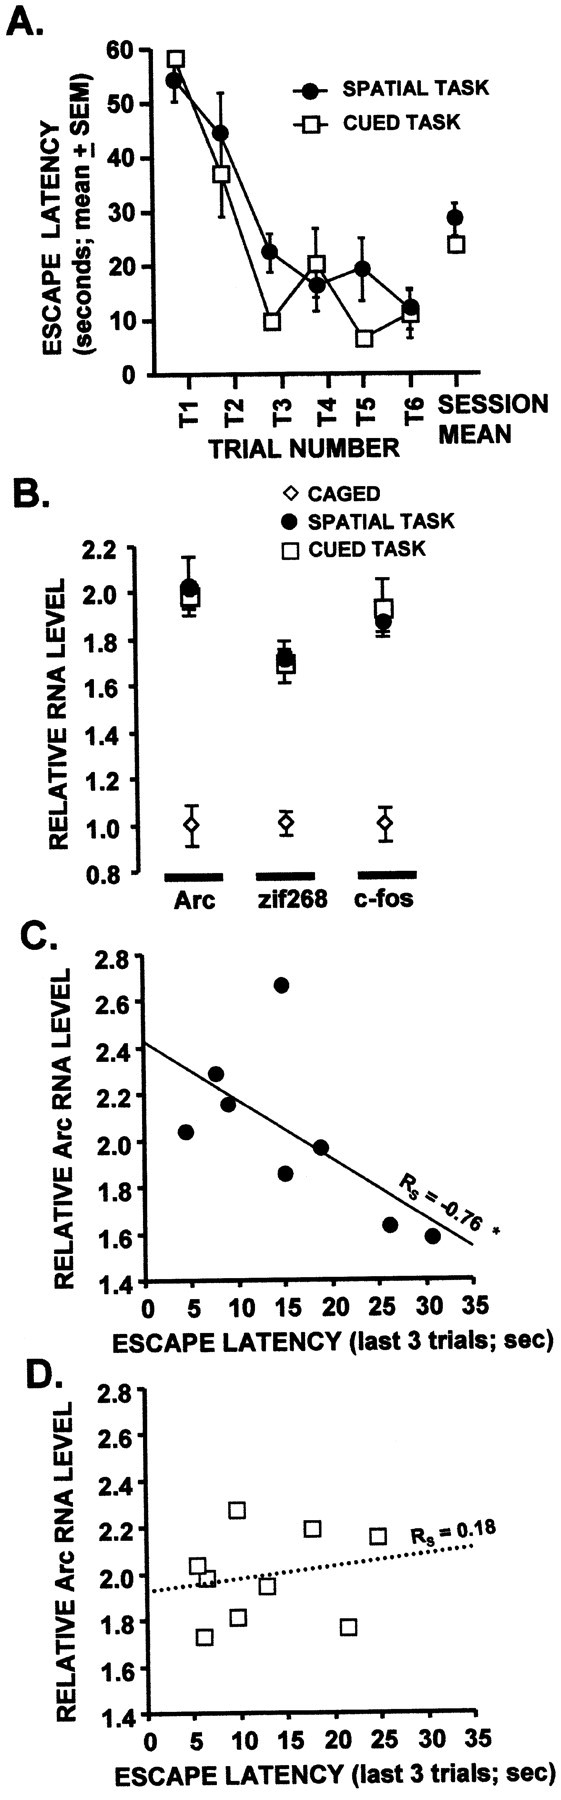
Hippocampal IEG RNA expression after spatial and cued water-task training. Rats were trained in either the spatial or cued water tasks and killed 30 min later. IEG RNA levels from dorsal hippocampus were analyzed by RPA. A, Acquisition data for rats trained in each task. Performance, as measured by latency to mount the hidden (spatial) or visible (cued) platform, was not different between the two groups (p = 0.24, repeated measures ANOVA). B, Hippocampal IEG RNA levels for rats trained in both tasks were significantly above caged control levels (p < 0.001, Mann–WhitneyU test) but were not different from each other.C, D, Negative correlation between hippocampal Arc RNA levels and performance in the spatial (C), but not cued (D), water task. See Results for additional information. The Spearman correlation coefficient (RS) is indicated for both cued and spatial trained groups (*p < 0.05).n = 8–9 rats per group.
Arc, zif268, and c-fos RNA levels from the dorsal hippocampi of rats trained in both water tasks were significantly higher than those from caged control rats (Fig.3B) (p < 0.001 for each Mann–Whitney U test). However, no group differences in hippocampal IEG RNA levels were observed between rats trained in the two different water tasks (Fig. 3B) (p > 0.45 for each Mann–Whitney Utest).
The relationship between hippocampal IEG RNA levels and rate of learning in rats trained in the two tasks was also examined (Fig.3C, Table 1). The rats' performance in the spatial task quickly improved in the first three trials and stabilized on the last three trials (Fig. 3A). Therefore, performance on the last three trials provides an appropriate measure of spatial learning ability for individual rats. In rats trained in the spatial task, a significant negative correlation was observed between Arc RNA levels and mean escape latency on the last three trials of the training session (Fig. 3C, Table 1) (Rs = −0.76;p < 0.05): the best spatial learners tended to have the highest levels of hippocampal Arc gene expression. Although zif268 and c-fos were also negatively correlated with learning in the spatial task, these correlations did not reach statistical significance. By contrast, there was no correlation between IEG RNA levels and escape latency on the final three trials of cued-task trained rats, nor was there a correlation between IEG RNA levels and mean escape latency for all six trials of either the spatial or cued tasks (Table 1).
Table 1.
Correlations between behavioral measures and hippocampal IEG RNA levels
| Measure | IEG RNA | Rsvalue | ||
|---|---|---|---|---|
| Spatial task | Cued task | Both tasks | ||
| Last three trials | Arc | −0.76 | 0.18 | −0.32 |
| zif268 | −0.58 | 0.13 | −0.14 | |
| c-fos | −0.49 | 0.12 | −0.09 | |
| All six trials | Arc | −0.55 | −0.21 | −0.26 |
| zif268 | −0.36 | 0.22 | −0.03 | |
| c-fos | −0.26 | 0.39 | 0.10 | |
The Spearman correlation coefficients are given; the comparison significant at p < 0.05 is indicated in bold font.
Arc RNA expression in the hippocampus and entorhinal cortex is increased by spatial reversal training
Separate groups of rats were trained in one of three variations of the spatial water task (Fig. 4, 1st session, 7th session, or 7th session-reversal) (see Materials and Methods for training details of the individual groups). Each group consisted of six rats. Trained rats were killed 30 min after the final training trial, and an equal number of rats were killed directly from their home cages to determine baseline levels of IEG expression. RNA was prepared from dissected tissue (dorsal hippocampus, entorhinal cortex, and primary visual cortex) of the trained rats and caged control rats and was analyzed by RPA.
The seventh session group performed the familiar task at an asymptotic level of performance (Fig. 4B). The seventh session-reversal group learned the new platform location in one trial and performed at levels similar to the seventh session group for the remaining five training trials. The first session group learned the task rapidly and performed at the level of the other two groups by the fifth and sixth trials.
IEG RNA levels for each of the trained groups were significantly higher than those of the caged controls in the examined brain regions (Fig.5). In the dorsal hippocampus, RNA levels for all IEGs were significantly lower in the seventh session group as compared with the first session group (Fig. 5A).Arc RNA levels of the seventh session-reversal group were significantly higher than those of the seventh session group, but comparable to those of the first session group (Fig. 5A). The behavioral expression profile for c-fos RNA was similar in the dorsal hippocampus, entorhinal cortex, and visual cortex (Fig.5). In each structure, c-fos RNA levels were highest in the first session group, but did not differ significantly between the seventh session and the seventh session-reversal groups. In short, the pattern was as follows: caged < seventh session = seventh session reversal < first session. This pattern was also observed for zif268 RNA expression in the hippocampus (Fig.5A).
Arc and zif268 RNA expression in the entorhinal (Fig. 5B) and visual (Fig. 5C) cortices exhibited both similarities and differences compared with that observed in the hippocampus. In the entorhinal cortex, as in the hippocampus,Arc RNA levels of the seventh session-reversal group were significantly higher than those of the seventh session group, but not different from those of the first session group (Fig. 5B). By contrast, Arc RNA levels did not differ significantly in the visual cortex for any of the water task-trained groups (Fig.5C). Unlike the hippocampus, zif268 RNA levels in the entorhinal and visual cortices did not differ significantly among any of the trained groups (Fig.5B,C).
We also compared the levels of different IEGs within a structure (Table2) or across structures (Table3). In both analyses, we did not include the caged control animals. The low IEG RNA levels of the controls tended to create two clusters of points, one for the caged animals and one for the trained animals, which created high, but inconsequential, correlation coefficients. Furthermore, we did not analyze the different behavioral groups separately; the limited group size (six rats per group) precluded a rigorous analysis. For the most part, IEG RNA levels in the dorsal hippocampus were modestly correlated for the trained rats (Table 2). By contrast, the IEG RNA levels were more strongly correlated in the entorhinal and visual cortices. Across different brain structures, Arc or zif268 RNA levels were only weakly correlated, if at all, and c-fos RNA levels were modestly correlated (Table 3).
Spatial water-task training increases Arc RNA expression in the hippocampal pyramidal cell layers and in the dentate gyrus granule cell layer
To determine whether changes in Arc gene expression were limited to specific subregions of the hippocampus, we performed fluorescent in situ hybridization using Arcantisense riboprobe and brain sections from caged control rats and rats killed 30 min after spatial water-task training. Four sections containing the dorsal hippocampus were analyzed for each rat. For each specific region, no differences in Arc RNA expression were observed between left and right hemispheres for either the caged or trained groups. Consequently, data from both hemispheres were combined for each animal in subsequent analyses. Spatial water-task training increased Arc RNA staining in both CA1 and CA3 pyramidal cell layers of the hippocampus (Figs. 6,7, Table4). Additionally, water task-trained rats had a higher number of Arc RNA-positive cells in the granule cell layer of the dentate gyrus (Fig. 7, Table 4). No staining was detected with the Arc sense riboprobe (data not shown).
Fig. 6.
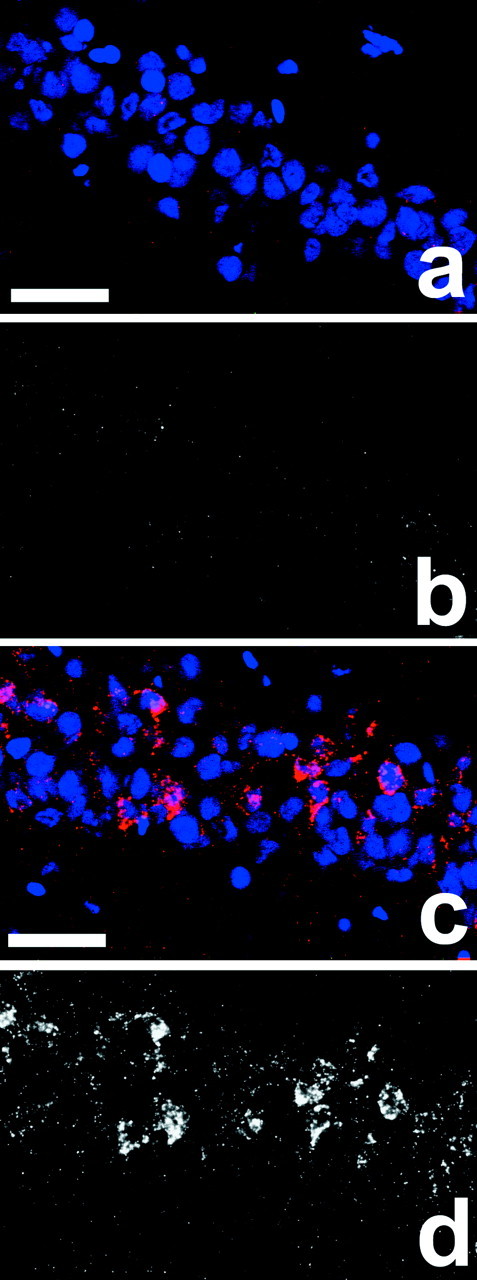
Increase in Arc RNA expression in the CA1 pyramidal cell layer 30 min after spatial water-task training.a and c show nuclei (blue) and Arc RNA staining (red) for a caged control and a spatial water-task trained rat, respectively.b and d show grayscale images ofArc RNA staining from a andc, respectively. Final magnification is 40×. Scale bars (shown in a and c): 50 μm. See Materials and Methods for experimental details and Table 4 for the summary of the quantitative analyses.
Fig. 7.
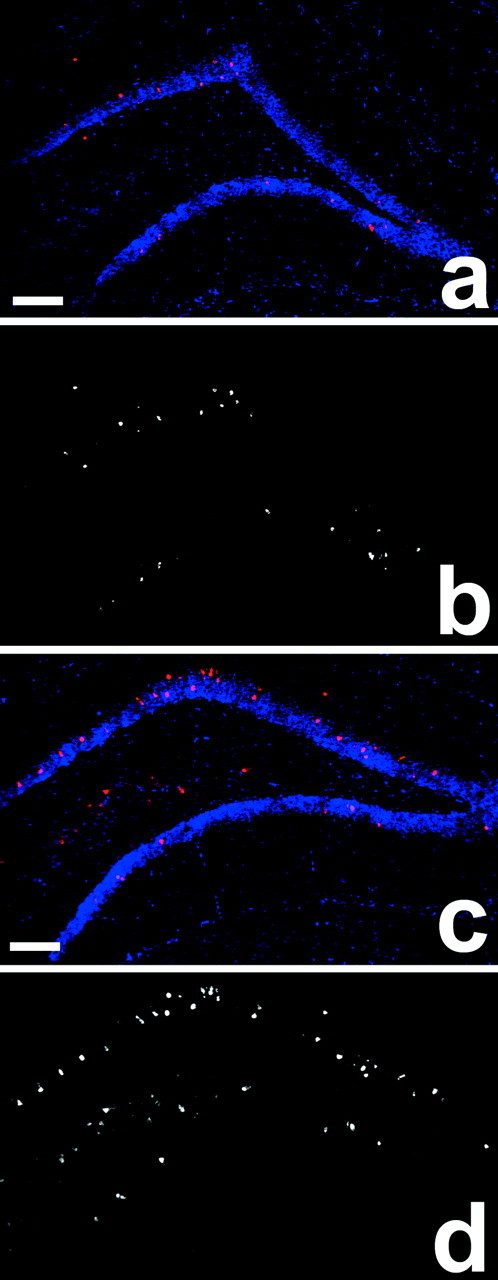
Increase in Arc RNA expression in the dentate gyrus and CA3 regions 30 min after spatial water task training. a and c show nuclei (blue) and Arc RNA staining (red) for a caged control and a spatial water task-trained rat, respectively. b and dshow grayscale images of Arc RNA staining froma and c, respectively. Final magnification is 5×. Scale bars (shown in a andc): 200 μm. See Materials and Methods for experimental details and Table 4 for the summary of the quantitative analyses.
Table 4.
Increase in Arc RNA expression in CA1, CA3, and dentate gyrus of rats trained in the spatial water task
| Region | Relative Arc expression (%) |
|---|---|
| Dentate gyrus | 150 ± 9 |
| CA1 | 261 ± 33 |
| CA3 | 200 ± 36 |
The reported percentages are given relative to caged control rats. Four sections containing the dorsal hippocampus and processed forArc RNA signal using FISH were analyzed for each rat. For CA1 and CA3 regions, Arc fluorescent intensity was determined over the appropriate region of the pyramidal cell layer. For the dentate gyrus, Arc RNA-positive cells in the granule cell layer were counted. The total mean number ofArc-positive dentate cells per rat was 92 for the caged control group and 138 for the water task-trained group. See Materials and Methods for details on the FISH and normalization procedures.n = 3 rats per group.
DISCUSSION
The current study provides a detailed comparison of the regulation of an effector IEG, Arc, to two RTF IEGs, c-fosand zif268, after hippocampal-dependent and hippocampal-independent learning. The principal findings are that (1)Arc, c-fos, and zif268 RNA levels were transiently increased after spatial learning (Fig. 2) and were positively correlated within a given brain structure (Table 2), (2) IEG expression in hippocampus and entorhinal cortex decreased with extended training, but remained elevated above control levels (Fig. 5), (3)Arc RNA levels in hippocampus and entorhinal cortex increased in rats that learned a new platform location relative to those performing a familiar task (Fig. 5), and (4) Arc RNA levels in hippocampus were highest in rats that were most proficient in the spatial task, whereas there was no correlation between hippocampalArc RNA expression and performance in the cued task (Fig. 3, Table 1). Taken together, and as discussed below, these results support the hypothesis that IEG expression, in general, and Arcexpression, in particular, induced by learning is important to memory consolidation processes.
Regulation of multiple IEGs by behavioral training
The present findings support the conclusion that the regulation ofArc, zif268, and c-fos is not controlled by any single generalized factor such as stress, motor activity, or novelty. First, hippocampal IEG RNA levels were not correlated with total training time (Table 1), an indirect measure of motor activity. Second, the strength of the correlations between IEG levels varied in different brain regions (Table 2), indicating that the factors that govern expression of the three IEGs vary across structures. For example, IEG RNA levels were more strongly correlated in either visual or entorhinal cortices than in hippocampus (Table 2). Furthermore, the correlation between Arc orzif268 levels across brain structures was weak or not statistically significant in rats trained in different spatial tasks (Table 3). Together, these observations argue against the regulation of IEG expression by a single, generalized factor. It should be noted, however, that c-fos levels were moderately correlated across brain regions, indicating that c-fos may be regulated in part by brain-wide influences, such as activation of the hypothalmic–pituitary–adrenal axis. Although the methodologies used in the current studies do not allow us to rule out some involvement of stress for the observed results, an earlier study showed thatArc RNA expression in defined CA1 neurons was specifically related to the information content of the behavioral experience (Guzowski et al., 1999), thus providing additional support for the assertion that IEG expression is not simply a generalized response to stress, motor activity, or novelty.
For the most part, the expression patterns for the three IEGs were similar. For example, IEG RNA levels were highest after an initial training session in the spatial task and decreased slightly with additional training (Fig. 5). Also, correlations between different IEG RNAs were moderate to strong within a given structure. These within-structure correlations suggest that there is likely some degree of coordinate regulation of these IEGs at the cellular level. We are currently examining this question using double-labeling FISH techniques (Guzowski et al., 1999). Furthermore, Arc,zif268, and c-fos exhibited similar expression kinetics (Fig. 2), which were consistent with other studies (Tischmeyer et al., 1990; Grimm and Tischmeyer, 1997). It is not clear why hippocampal c-fos RNA levels were below control levels 6 hr after training.
Arc gene expression was compared directly with that of c-fos in one other behavioral study. Montag-Sallaz and colleagues (1999) reported several differences in the time course and regional pattern of Arc and c-fos induction by gustatory novelty. Although the differences between this study and our findings are not easily reconciled, it is possible that under very different behavioral conditions (gustatory novelty in the absence of specific task demands and spatial learning), distinct regional patterns of IEG expression may emerge.
IEG expression and hippocampal function
The similar levels of IEG expression of rats trained in either spatial or cued water tasks indicates that both tasks led to similar activation of signaling/transcriptional pathways in hippocampal neurons. This finding is consistent with electrophysiological recording studies indicating that hippocampal neurons encode both spatial and nonspatial information (Young et al., 1994; Markus et al., 1995;Gothard et al., 1996; Wood et al., 1999). Additionally, behavioral studies demonstrate that the hippocampus encodes spatial information even when animals are trained in tasks that do not explicitly require its use (Packard and McGaugh, 1996), including the cued water task (Rapp et al., 1987).
Despite the lack of an overall group effect, the correlation between hippocampal Arc RNA levels and task performance in the spatial, but not cued, water task (Fig. 3, Table 1) suggests thatArc gene expression is related to task-relevant encoding processes. In this view, cued task-trained rats processed much of the same spatial and nonspatial information as spatial task-trained rats, but this information was not required for solving the cued task. By contrast, information processed by the hippocampus was necessary for solving the spatial task, and consequently, rats that had a greater activation of hippocampal neurons (as indicated by Arcexpression) tended to perform better in the spatial task. This interpretation is consistent with findings from lesion studies: hippocampal lesions impair performance in the spatial, but not cued, water task (Morris et al., 1982).
In the current studies, hippocampal IEG expression decreased modestly with extended training but remained well above caged control levels (Fig. 5A). Similarly, it was demonstrated recently that retrieval of contextual fear conditioning resulted in increasedzif268 RNA expression in CA1 neurons (Hall et al., 2001). The lack of habituation of the IEG response, although the measured behavioral response (escape latency) was asymptotic, suggests that retrieval engages some of the same cellular processes activated during initial acquisition. In this view, signal transduction pathways governing IEG transcription in hippocampal neurons do not discriminate between the processing and use of new information as compared with that of familiar information. Certainly, firing activity patterns of hippocampal neurons are not obviously different in familiar and novel environments (O'Keefe, 1976; Muller and Kubie, 1987), and “place fields” of hippocampal neurons appear during an initial exposure to an environment and remain on subsequent visits to the same environment (Hill, 1978; Thompson and Best, 1990; Wilson and McNaughton, 1993). That the IEG response decreased relative to the first session group could be because the seventh session rats swam more direct paths and were less attentive to the surrounding environment while on the platform and performing the task. Conversely, Arc expression increased in hippocampus and entorhinal cortex after spatial reversal learning, when the rats learned a new platform location.
The role of experience-dependent Arc gene expression in synaptic plasticity
The current findings add to a growing body of evidence indicating that Arc plays a critical role in synaptic plasticity.Arc is the only known IEG in which both RNA and protein products are localized to dendrites (Link et al., 1995; Lyford et al., 1995; Wallace et al., 1998). Arc RNA expression is regulated by patterned stimulation that induces long-term potentiation (Lyford et al., 1995) and by physiological neural activity (Guzowski et al., 1999;Montag-Sallaz et al., 1999; Guthrie et al., 2000). Furthermore, the dendritic localization of Arc RNA and protein can be regulated by synaptic activity (Steward et al., 1998). These properties suggest that Arc may be subject to multiple levels of regulation (intracellular trafficking, local regulation of translation at defined synapses, etc.) and may make Arc a unique, rather than prototypical, effector IEG. Although the cellular function ofArc is not known at this time, Arc protein interacts with structural proteins (Lyford et al., 1995) and calcium and calmodulin-dependent kinase II (CaMKII) (P. F. Worley, personal communication). CaMKII is a dendritic protein critical to synaptic plasticity and long-term memory formation (Mayford et al., 1995, 1996). Therefore, Arc may affect synaptic plasticity by modulating the activity, intracellular trafficking, or substrate specificity of CAMKII.
The above findings are consistent with the hypothesis thatArc may mediate neuroplastic changes at discrete synapses necessary for memory consolidation processes. In support of this view, temporary inhibition of hippocampal Arc protein expression impairs the maintenance of long-term potentiation, without affecting its induction, and impairs consolidation of long-term memory for spatial water-task training, without affecting task acquisition or short-term memory (Guzowski et al., 2000). Furthermore, Arc expression in CA1 neurons is specifically induced by neural encoding processes, as determined using a novel FISH approach that provides both temporal and cellular resolution (Guzowski et al., 1999). These interesting properties indicate that continued studies into the regulation and function of Arc will likely provide new insights into the molecular and cellular bases of cognition.
Footnotes
This research was supported by U.S. Public Health Service Research Grants MH60123 (J.F.G.) and MH12526 (J.L.M.). We thank Dr. Paul Worley for providing the Arc cDNA plasmid and Dr. Carol Barnes for valuable input during the writing of this manuscript.
Correspondence should be addressed to J. F. Guzowski, Arizona Research Laboratories, Division of Neural Systems, Memory and Aging, University of Arizona, Tucson, AZ 85424-5115. E-mail:john@nsma.arizona.edu.
REFERENCES
- 1.Abraham WC, Mason SE, Demmer J, Williams JM, Richardson CL, Tate WP, Lawlor PA, Dragunow M. Correlations between immediate early gene induction and the persistence of long-term potentiation. Neuroscience. 1993;56:717–727. doi: 10.1016/0306-4522(93)90369-q. [DOI] [PubMed] [Google Scholar]
- 2.Calabresi P, Napolitano M, Centonze D, Marfia GA, Gubellini P, Teule MA, Berretta N, Bernardi G, Frati L, Tolu M, Gulino A. Tissue plasminogen activator controls multiple forms of synaptic plasticity and memory. Eur J Neurosci. 2000;12:1002–1012. doi: 10.1046/j.1460-9568.2000.00991.x. [DOI] [PubMed] [Google Scholar]
- 3.Cho YH, Kesner RP. Involvement of entorhinal cortex or parietal cortex in long-term spatial discrimination memory in rats: retrograde amnesia. Behav Neurosci. 1996;110:436–442. doi: 10.1037//0735-7044.110.3.436. [DOI] [PubMed] [Google Scholar]
- 4.Dragunow M. A role for immediate-early transcription factors in learning and memory. Behav Genet. 1996;26:293–299. doi: 10.1007/BF02359385. [DOI] [PubMed] [Google Scholar]
- 5.Gothard KM, Skaggs WE, Moore KM, McNaughton BL. Binding of hippocampal CA1 neural activity to multiple reference frames in a landmark-based navigation task. J Neurosci. 1996;16:823–835. doi: 10.1523/JNEUROSCI.16-02-00823.1996. [DOI] [PMC free article] [PubMed] [Google Scholar]
- 6.Grimm R, Tischmeyer W. Complex patterns of immediate early gene induction in rat brain following brightness discrimination training and pseudotraining. Behav Brain Res. 1997;84:109–116. doi: 10.1016/s0166-4328(97)83330-x. [DOI] [PubMed] [Google Scholar]
- 7.Grimm R, Schicknick H, Riede I, Gundelfinger ED, Herdegen T, Zuschratter W, Tischmeyer W. Suppression of c-fos induction in rat brain impairs retention of a brightness discrimination reaction. Learn Mem. 1997;3:402–413. doi: 10.1101/lm.3.5.402. [DOI] [PubMed] [Google Scholar]
- 8.Guthrie K, Rayhanabad J, Kuhl D, Gall C. Odors regulate Arc expression in neuronal ensembles engaged in odor processing. NeuroReport. 2000;11:1809–1813. doi: 10.1097/00001756-200006260-00003. [DOI] [PubMed] [Google Scholar]
- 9.Guzowski JF, McGaugh JL. Antisense oligodeoxynucleotide-mediated disruption of hippocampal cAMP response element binding protein levels impairs consolidation of memory for water maze training. Proc Natl Acad Sci USA. 1997;94:2693–2698. doi: 10.1073/pnas.94.6.2693. [DOI] [PMC free article] [PubMed] [Google Scholar]
- 10.Guzowski JF, McNaughton BL, Barnes CA, Worley PF. Environment-specific expression of the immediate-early gene Arc in hippocampal neuronal ensembles. Nat Neurosci. 1999;2:1120–1124. doi: 10.1038/16046. [DOI] [PubMed] [Google Scholar]
- 11.Guzowski JF, Lyford GL, Stevenson GD, Houston FP, McGaugh JL, Worley PF, Barnes CA. Inhibition of activity-dependent Arc protein expression in the rat hippocampus impairs the maintenance of long-term potentiation and consolidation of long-term memory. J Neurosci. 2000;20:3993–4001. doi: 10.1523/JNEUROSCI.20-11-03993.2000. [DOI] [PMC free article] [PubMed] [Google Scholar]
- 12.Hall J, Thomas KL, Everitt BJ. Cellular imaging of zif268 expression in the hippocampus and amygdala during contextual and cued fear memory retrieval: selective activation of hippocampal CA1 neurons during the recall of contextual memories. J Neurosci. 2001;21:2186–2193. doi: 10.1523/JNEUROSCI.21-06-02186.2001. [DOI] [PMC free article] [PubMed] [Google Scholar]
- 13.Herdegen T, Leah JD. Inducible and constitutive transcription factors in the mammalian nervous system: control of gene expression by Jun, Fos and Krox, and CREB/ATF proteins. Brain Res Brain Res Rev. 1998;28:370–490. doi: 10.1016/s0165-0173(98)00018-6. [DOI] [PubMed] [Google Scholar]
- 14.Herrera DG, Robertson HA. Activation of c-fos in the brain. Prog Neurobiol. 1996;50:83–107. doi: 10.1016/s0301-0082(96)00021-4. [DOI] [PubMed] [Google Scholar]
- 15.Hess US, Lynch G, Gall CM. Regional patterns of c-fos mRNA expression in rat hippocampus following exploration of a novel environment versus performance of a well-learned discrimination. J Neurosci. 1995;15:7796–7809. doi: 10.1523/JNEUROSCI.15-12-07796.1995. [DOI] [PMC free article] [PubMed] [Google Scholar]
- 16.Hill AJ. First occurrence of hippocampal spatial firing in a new environment. Exp Neurol. 1978;62:282–297. doi: 10.1016/0014-4886(78)90058-4. [DOI] [PubMed] [Google Scholar]
- 17.Johnson D, Amaral DG. Hippocampus. In: Shepherd GM, editor. The synaptic organization of the brain, Ed 4. Oxford UP; New York: 1998. pp. 417–458. [Google Scholar]
- 18.Jones MW, Errington ML, French PJ, Fine A, Bliss TV, Garel S, Charnay P, Bozon B, Laroche S, Davis S. A requirement for the immediate early gene Zif268 in the expression of late LTP and long-term memories. Nat Neurosci. 2001;4:289–296. doi: 10.1038/85138. [DOI] [PubMed] [Google Scholar]
- 19.Kaczmarek L. Molecular biology of vertebrate learning: is c-fos a new beginning? J Neurosci Res. 1993;34:377–381. doi: 10.1002/jnr.490340402. [DOI] [PubMed] [Google Scholar]
- 20.Lamprecht R, Dudai Y. Transient expression of c-Fos in rat amygdala during training is required for encoding conditioned taste aversion memory. Learn Mem. 1996;3:31–41. doi: 10.1101/lm.3.1.31. [DOI] [PubMed] [Google Scholar]
- 21.Lanahan A, Worley P. Immediate-early genes and synaptic function. Neurobiol Learn Mem. 1998;70:37–43. doi: 10.1006/nlme.1998.3836. [DOI] [PubMed] [Google Scholar]
- 22.Link W, Konietsko U, Kauselmann G, Krug M, Schwanke B, Frey U, Kuhl D. Somatodendritic expression of an immediate-early gene is regulated by synaptic activity. Proc Natl Acad Sci USA. 1995;92:5734–5738. doi: 10.1073/pnas.92.12.5734. [DOI] [PMC free article] [PubMed] [Google Scholar]
- 23.Lyford GL, Yamagata K, Kaufmann WE, Barnes CA, Sanders LK, Copeland NG, Worley PF. Arc, a growth factor and activity-regulated gene, encodes a novel cytoskeleton-associated protein that is enriched in neuronal dendrites. Neuron. 1995;14:433–445. doi: 10.1016/0896-6273(95)90299-6. [DOI] [PubMed] [Google Scholar]
- 24.Madani R, Hulo S, Toni N, Madani H, Steimer T, Muller D, Vassalli JD. Enhanced hippocampal long-term potentiation and learning by increased neuronal expression of tissue-type plasminogen activator in transgenic mice. EMBO J. 1999;18:3007–3012. doi: 10.1093/emboj/18.11.3007. [DOI] [PMC free article] [PubMed] [Google Scholar]
- 25.Markus EJ, Qin YL, Leonard B, Skaggs WE, McNaughton BL, Barnes CA. Interactions between location and task affect the spatial and directional firing of hippocampal neurons. J Neurosci. 1995;15:7079–7094. doi: 10.1523/JNEUROSCI.15-11-07079.1995. [DOI] [PMC free article] [PubMed] [Google Scholar]
- 26.Mayford M, Wang J, Kandel ER, O'Dell TJ. CaMKII regulates the frequency-response function of hippocampal synapses for the production of both LTD and LTP. Cell. 1995;81:891–904. doi: 10.1016/0092-8674(95)90009-8. [DOI] [PubMed] [Google Scholar]
- 27.Mayford M, Bach ME, Huang YY, Wang L, Hawkins RD, Kandel ER. Control of memory formation through regulated expression of a CaMKII transgene. Science. 1996;274:1678–1683. doi: 10.1126/science.274.5293.1678. [DOI] [PubMed] [Google Scholar]
- 28.Montag-Sallaz M, Welzl H, Kuhl D, Montag D, Schachner M. Novelty-induced increased expression of immediate-early genes c-fos and arg 3.1 in the mouse brain. J Neurobiol. 1999;38:234–246. [PubMed] [Google Scholar]
- 29.Morgan JI, Cohen DR, Hempstead JL, Curran T. Mapping patterns of c-fos expression in the central nervous system after seizure. Science. 1987;237:192–197. doi: 10.1126/science.3037702. [DOI] [PubMed] [Google Scholar]
- 30.Morris RG, Garrud P, Rawlins JN, O'Keefe J. Place navigation impaired in rats with hippocampal lesions. Nature. 1982;297:681–683. doi: 10.1038/297681a0. [DOI] [PubMed] [Google Scholar]
- 31.Morrow BA, Elsworth JD, Inglis FM, Roth RH. An antisense oligonucleotide reverses the footshock-induced expression of fos in the rat medial prefrontal cortex and the subsequent expression of conditioned fear-induced immobility. J Neurosci. 1999;19:5666–5673. doi: 10.1523/JNEUROSCI.19-13-05666.1999. [DOI] [PMC free article] [PubMed] [Google Scholar]
- 32.Moser E, Moser MB, Andersen P. Spatial learning impairment parallels the magnitude of dorsal hippocampal lesions, but is hardly present following ventral lesions. J Neurosci. 1993;13:3916–3925. doi: 10.1523/JNEUROSCI.13-09-03916.1993. [DOI] [PMC free article] [PubMed] [Google Scholar]
- 33.Moser MB, Moser EI, Forrest E, Andersen P, Morris RG. Spatial learning with a minislab in the dorsal hippocampus. Proc Natl Acad Sci USA. 1995;92:9697–9701. doi: 10.1073/pnas.92.21.9697. [DOI] [PMC free article] [PubMed] [Google Scholar]
- 34.Muller RU, Kubie JL. The effects of changes in the environment on the spatial firing of hippocampal complex-spike cells. J Neurosci. 1987;7:1951–1968. doi: 10.1523/JNEUROSCI.07-07-01951.1987. [DOI] [PMC free article] [PubMed] [Google Scholar]
- 35.Nagahara AH, Handa RJ. Fetal alcohol exposure alters the induction of immediate early gene mRNA in the rat prefrontal cortex after an alternation task. Alcohol Clin Exp Res. 1995;19:1389–1397. doi: 10.1111/j.1530-0277.1995.tb00997.x. [DOI] [PubMed] [Google Scholar]
- 36.Nagahara AH, Otto T, Gallagher M. Entorhinal-perirhinal lesions impair performance of rats on two versions of place learning in the Morris water maze. Behav Neurosci. 1995;109:3–9. doi: 10.1037//0735-7044.109.1.3. [DOI] [PubMed] [Google Scholar]
- 37.O'Donovan KJ, Tourtellotte WG, Millbrandt J, Baraban JM. The EGR family of transcription-regulatory factors: progress at the interface of molecular and systems neuroscience. Trends Neurosci. 1999;22:167–173. doi: 10.1016/s0166-2236(98)01343-5. [DOI] [PubMed] [Google Scholar]
- 38.O'Keefe J. Place units in the hippocampus of the freely moving rat. Exp Neurol. 1976;51:78–109. doi: 10.1016/0014-4886(76)90055-8. [DOI] [PubMed] [Google Scholar]
- 39.Packard MG, McGaugh JL. Inactivation of hippocampus or caudate nucleus with lidocaine differentially affects expression of place and response learning. Neurobiol Learn Mem. 1996;65:65–72. doi: 10.1006/nlme.1996.0007. [DOI] [PubMed] [Google Scholar]
- 40.Palkovits M, Brownstein MJ. Maps and guide to microdissection of the rat brain. Elsevier; New York: 1988. [Google Scholar]
- 41.Paxinos G, Watson C. The rat brain in stereotaxic coordinates, Ed 2. Academic; San Diego: 1986. [DOI] [PubMed] [Google Scholar]
- 42.Rapp PR, Rosenberg RA, Gallagher M. An evaluation of spatial information processing in aged rats. Behav Neurosci. 1987;101:3–12. doi: 10.1037//0735-7044.101.1.3. [DOI] [PubMed] [Google Scholar]
- 43.Robertson HA. Immediate-early genes, neuronal plasticity, and memory. Biochem Cell Biol. 1992;70:729–737. doi: 10.1139/o92-112. [DOI] [PubMed] [Google Scholar]
- 44.Saffen DW, Cole AJ, Worley PF, Christy BA, Ryder K, Baraban JM. Convulsant-induced increase in transcription factor messenger RNAs in rat brain. Proc Natl Acad Sci USA. 1988;85:7795–7799. doi: 10.1073/pnas.85.20.7795. [DOI] [PMC free article] [PubMed] [Google Scholar]
- 45.Seeds NW, Williams BL, Bickford PC. Tissue plasminogen activator induction in Purkinje neurons after cerebellar motor learning. Science. 1995;270:1992–1994. doi: 10.1126/science.270.5244.1992. [DOI] [PubMed] [Google Scholar]
- 46.Steward O, Wallace CS, Lyford GL, Worley PF. Synaptic activation causes the mRNA for the IEG Arc to localize selectively near activated postsynaptic sites on dendrites. Neuron. 1998;21:741–751. doi: 10.1016/s0896-6273(00)80591-7. [DOI] [PubMed] [Google Scholar]
- 47.Thompson LT, Best PJ. Long-term stability of the place-field activity of single units recorded from the dorsal hippocampus of freely behaving rats. Brain Res. 1990;509:299–308. doi: 10.1016/0006-8993(90)90555-p. [DOI] [PubMed] [Google Scholar]
- 48.Tischmeyer W, Grimm R. Activation of immediate early genes and memory formation. Cell Mol Life Sci. 1999;55:564–574. doi: 10.1007/s000180050315. [DOI] [PMC free article] [PubMed] [Google Scholar]
- 49.Tischmeyer W, Kaczmarek L, Strauss M, Jork R, Matthies H. Accumulation of c-fos mRNA in rat hippocampus during acquisition of a brightness discrimination. Behav Neural Biol. 1990;54:165–171. doi: 10.1016/0163-1047(90)91366-j. [DOI] [PubMed] [Google Scholar]
- 50.Vann SD, Brown MW, Erichsen JT, Aggleton JP. Fos imaging reveals differential patterns of hippocampal and parahippocampal subfield activation in rats in response to different spatial memory tests. J Neurosci. 2000;20:2711–2718. doi: 10.1523/JNEUROSCI.20-07-02711.2000. [DOI] [PMC free article] [PubMed] [Google Scholar]
- 51.Wallace CS, Lyford GL, Worley PF, Steward O. Differential intracellular sorting of immediate early gene mRNAs depends on signals in the mRNA sequence. J Neurosci. 1998;18:26–35. doi: 10.1523/JNEUROSCI.18-01-00026.1998. [DOI] [PMC free article] [PubMed] [Google Scholar]
- 52.Wilson MA, McNaughton BL. Dynamics of the hippocampal ensemble code for space. Science. 1993;261:1055–1058. doi: 10.1126/science.8351520. [DOI] [PubMed] [Google Scholar]
- 53.Wood ER, Dudchenko PA, Eichenbaum H. The global record of memory in hippocampal neuronal activity. Nature. 1999;397:613–616. doi: 10.1038/17605. [DOI] [PubMed] [Google Scholar]
- 54.Worley PF, Bhat RV, Baraban JM, Erickson CA, McNaughton BL, Barnes CA. Thresholds for synaptic activation of transcription factors in hippocampus: correlation with long-term enhancement. J Neurosci. 1993;13:4776–4786. doi: 10.1523/JNEUROSCI.13-11-04776.1993. [DOI] [PMC free article] [PubMed] [Google Scholar]
- 55.Young BJ, Fox GD, Eichenbaum H. Correlates of hippocampal complex-spike cell activity in rats performing a nonspatial radial maze task. J Neurosci. 1994;14:6553–6563. doi: 10.1523/JNEUROSCI.14-11-06553.1994. [DOI] [PMC free article] [PubMed] [Google Scholar]