Abstract
Even in the absence of explicit stimulation, rats emit patterns of rhythmic whisking movements. Because of their stereotyped nature and their persistence after sensory denervation and cortical ablation, whisking movements have been assumed to reflect the output of a central pattern generator (CPG). However, identification of a movement pattern as the product of a CPG requires evidence that its generation, patterning, and coordination are independent of sensory input. To provide such evidence, we used optoelectronic instrumentation to obtain high-resolution records of the movement trajectories of individual whiskers in rats whose heads were fixed to isolate their exploratory whisking from exafferent inputs. Unconditioned whisking patterns were quantitatively characterized by a biometric analysis of the kinematics, rhythmicity, and coordination of bilaterally homologous vibrissa movements. Unilateral and bilateral sectioning of the infraorbital nerve, which innervates the whiskers, was then performed to block reafferent inputs generated by the animal's own whisking movements. Unilateral sectioning of the nerve has no effect on whisking kinematics but is followed by a significant but relatively transient bilateral increase in whisking frequency. However, bilateral deafferentation, when performed in a single-stage procedure, does not disrupt the generation, patterning, or bilateral coordination of whisking patterns in the rat. These findings provide strong behavioral evidence for a whisking CPG and are discussed in relation to its possible location and properties.
Keywords: whisking, vibrissa, kinematics, deafferentation, pattern generation, trigeminal
Rhythmic scanning movements, such as active touch and sniffing, play a role in several sensory modalities (Willis and Arbas, 1997). In rodents, a rhythmic pattern of alternating whisker (vibrissa) protraction and retraction, “whisking,” contributes both to “exploratory” movements, which are designed to acquire sensory inputs, and to palpation movements, which are used in the discrimination of objects and in the control of spatial navigation. The effector system generating whisking comprises a set of “extrinsic” muscles controlling movements of the mystacial pad and a group of “intrinsic” (follicular) muscles, producing vibrissa protraction. Vibrissa retraction is thought to be a passive process produced by rebound of stretched follicular muscle. Sensory innervation of the whiskers is provided by to the infraorbital branch of the trigeminal maxillary nerve (ION); motor innervation is attributable to the facial (VII) nerve (Dorfl, 1982, 1985; Wineski, 1985; Carvell and Simons, 1990).
Coordinated movements of pad and vibrissa produce whisking patterns, which may differ with respect to modal frequency, amplitude, degree of bilateral synchrony, and involvement of other effector systems (e.g., head) in a manner related to behavioral context or interaction with object surfaces (Vincent, 1912; Welker, 1964; Carvell and Simons, 1990,1995). The more complex patterns may involve modulation of the rat's basic exploratory whisking pattern, which is relatively stereotyped in frequency and is emitted in the absence of exteroceptive inputs. This pattern is the focus of the present study.
The whisking pattern may be generated by the autonomous activity of a central oscillator or central pattern generator (CPG) independent of patterned sensory inputs and requiring only a “tonic” drive, or may be driven by patterned reafferent feedback from the movements acting within a closed-loop circuit (for review, see Kleinfeld et al., 1999). Because whisking persists after sensory denervation (Welker, 1964), cortical ablation (Semba and Komisaruk, 1984), or decerebration (Lovick, 1972), it has been assumed that rhythmic whisking movements reflect the output of a CPG. However, identification of a movement pattern as the product of a CPG requires both its experimental isolation from sensory input and the demonstration that such isolation does not impact its biometrics (i.e., the generation, patterning, and coordination of the movement). Unfortunately, much of our data on whisking patterns in normal and denervated animals are derived either from EMG recordings, which provide no biometric information (Semba and Komisaruk, 1984), or from cinegraphic–videographic recordings (at a relatively low temporal resolution) of whisking in freely moving animals under conditions in which the whisking patterns may be perturbed by contact with object surfaces (Welker, 1964; Carvell and Simons, 1990).
The present study provides a test of the CPG hypothesis, using head-fixed animals to isolate unconditioned exploratory whisking movements from exafferent inputs and using unilateral or bilateral sensory denervation of the whiskers to abolish reafferent inputs from the animal's own movements. Optoelectronic instrumentation provides high-resolution monitoring of individual vibrissa movement trajectories for analysis of whisking kinematics, rhythmicity, and bilateral coordination. Our denervation results are consistent with the existence of a whisking CPG, and the biometric data provide a detailed characterization of its properties under conditions of varying sensory input.
MATERIALS AND METHODS
Subjects and experimental design. Twelve female Long–Evans rats, aged 6–12 months, completed the experimental design (eight experimental and four surgical control animals). Subjects were housed individually under a 12 hr reversed light/dark cycle and tested under a 23 hr water deprivation schedule adjusted to maintain body weight at 85–90% of free-feeding weight. Subjects were handled daily for at least 2 weeks before and after placement of a dental cement headmount. Preoperatively, whisking was optoelectronically monitored during 30 min test sessions over 3 successive days. Experimental subjects then sustained either sequential, two-stage whisker denervation (unilateral and then contralateral sectioning of the infraorbital nerve; n = 5) or a one-stage bilateral deafferentation (n = 3). Controls (n = 4) received a sham surgical procedure. To minimize the effects of potentially confounding variables, subjects were tested at approximately the same time each day, both before and after surgery, and session lengths were uniform for all animals.
Surgical procedures. Rats were anesthetized with a mixture of ketamine (100 mg/kg body weight, i.p.) and xylazine (5.5 mg/kg body weight, i.m.). Animals were fitted with a dental cement headmount in which a mounting screw (Q-TSB-632-12; Small Parts Inc., Logansport, IN) was stereotaxically embedded (Bermejo et al., 1996). For deafferentation, an ∼3 mm incision was made through the skin ∼2 mm caudal to the γ straddler to minimize damage to adjacent muscles. The infraorbital nerve was exposed as it emerged from the infraorbital fissure, lifted, and transected with microscissors proximal to the infraorbital fissure. Care was taken not to damage the more superficially running facial nerve branches and mystacial pad structures. Because postoperative testing was normally completed within 2 weeks of nerve sectioning, no attempt was made to interfere with nerve regeneration. Animals were allowed to recover for 72 hr between surgery and retesting. Several additional animals were denervated [sectioning of the infraorbital nerve (IOx)] and killed after 2–3 weeks to assess the completeness of the ION sectioning and the extent of nerve regeneration.
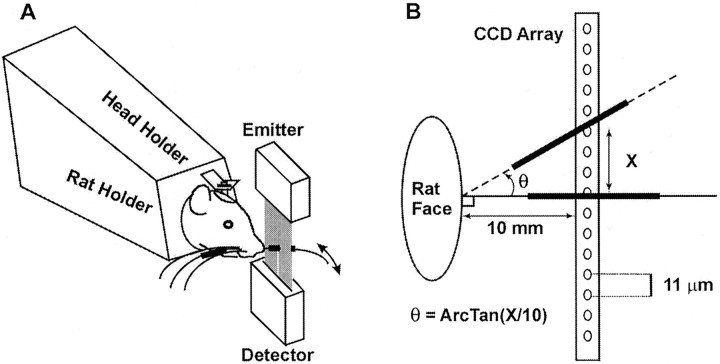
Apparatus and behavioral procedures. A sound-shielded test chamber (interior dimensions, 80 × 60 × 60 cm) (Industrial Acoustics, Bronx, NY) was equipped with a house light, a water-delivery system, a tone generator (273-074A, 2.5 kHz; Radio Shack, Fort Worth, TX), and a pair of optoelectronic monitoring devices (PAS 11H, laser micrometer; Hama Laboratories, Palo Alto, CA). The rat's body was restrained in a V-shaped acrylic enclosure bolted to the chamber floor, with its head fixed to a metal bracket attached to the box by a bolt embedded in a dental cement crown (Fig.1A). Water (20–40 μl aliquots) was delivered to the rat's mouth by a gravity-driven–solenoid-controlled water-delivery system. A 486 personal computer was used to control stimulus presentation, water delivery, and data collection and storage, using customized software written in QuickBasic.
Fig. 1.
A, Schematic diagram of the optoelectronic monitoring system, indicating the position of the laser emitter and detector with respect to the head-fixed animal. In these experiments, all whiskers were intact on both sides of the face, and the right and left C-1 whiskers were marked for monitoring. For clarity, only a single set of emitters and detectors and only a single whisker are shown on one side of the face. B, Schematic diagram illustrating both the basic principle of the monitoring system and the process by which whisker displacements are transformed from CCD units to angular whisker positions. Thick black linesindicate the successive positions of the marked vibrissa during a whisking movement.
Data on individual whisker movement trajectories were obtained by monitoring the movements of a pair of bilaterally homologous whiskers (right and left C-1). To reduce stress, water was delivered at random intervals during the session, but water delivery was independent of the occurrence of whisking. Each session involved 30 trials, and the termination of each trial was defined by the occurrence of 2 sec periods during which the house light was turned off and data were saved to disk.
Optoelectronic monitoring of individual vibrissa movements.The optoelectronic devices (laser emitter and detector, resolution 1.4 msec, 11 μm) were used to monitor whisker movements along a plane that includes the rostrocaudal axis and is perpendicular to the whisker pad. The 2496 sensors in the detector are arranged in a 28 mm linear array. Interruption of the emitted beam by the shadow of a whisker produces a voltage shift in a subset of shaded sensors (CCDs). Whisker movement trajectories produce successive displacements in the position of that voltage shift, which are linearly related to whisker position. A comparator circuit identifies the successive positions of voltages above a preset threshold and outputs the data to a microprocessor for computation and display of the trajectory. To monitor an individual whisker trajectory with all other whiskers present, a light (3–6 mg) rectangular (1 × 1 × 18 mm) foam marker is attached to the selected whisker with one end close to but not touching the base of the whisker. This increases the “visibility” of the marker with respect to surrounding vibrissas without significantly affecting whisking kinematics (Bermejo et al., 1998). Although we monitored only the movements of the left and right C-1 whiskers, all whiskers were present during testing. Figure 1A schematically illustrates the experimental arrangements. For clarity, only a single detector–emitter system (and a single whisker movement) is shown.
Calibration. To transform data on sensor locations into a record of angular whisker positions, a calibration procedure was performed for each animal at the start of each recording session. The whisker was manually positioned at 90° from the horizontal (i.e., perpendicular to the animal's snout). The detector was placed so that the whisker shaft intercepted the CCD array at its midpoint and at a fixed distance (10 mm) from the whisker base. The position of that CCD (e.g., 1–2496), which is intersected by the shadow of the whisker at its initial (i.e., 90°) position, was recorded. The angular displacement of the vibrissa was then calculated using the following formula: θ = ArcTan (Opposite/Adjacent), where the opposite is the distance moved along the CCD array and the adjacent is the distance from the base of the vibrissa to the CCD array (10 mm). The procedure is illustrated schematically in Figure 1B. [Note that, because the whisker moves in an arc, the point on the vibrissa shaft that interrupts the beam at the beginning of the trajectory will not be identical with the point interrupting the beam at its end. This could result in an overestimation of the distance traveled by the whisker. To compensate for this, we oriented the CCD array in parallel with the animal's face. Because the kinematic properties of the trajectories measured using this procedure were comparable with those reported previously using videographic methods (see Results), we believe that minor errors introduced by the procedure did not significantly bias the results.]
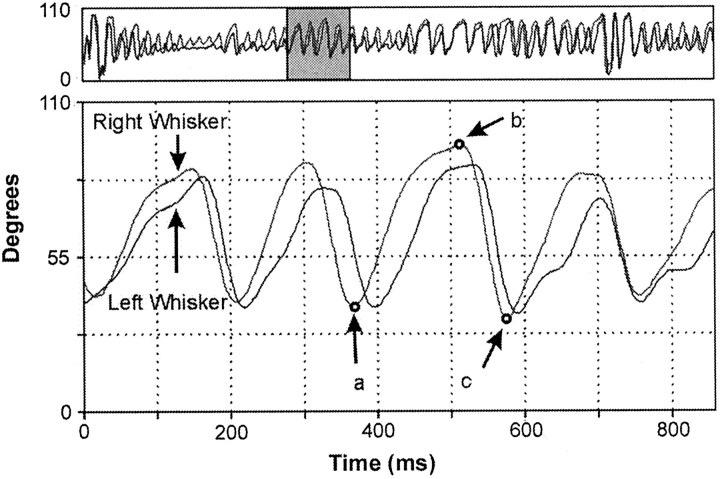
Data analysis. Data on whisker movements were saved as a series of CCD units indicating the successive positions of the shadow of the marked whisker as it moved across the detector array. Using the values obtained at calibration, the CCD data were transformed into angular units by a specially written computer program. The transformed data for each session were then plotted in angular coordinates and displayed on a computer monitor as a plot of whisker position against time. Figure 2 presents a sample of whisking movements recorded from the right and left C-1 vibrissa during a single trial in the first preoperative session. The top panel of Figure 2 represents 8.5 sec of data; its shaded portion highlights an 850 msec sample that is displayed in thebottom panel at a higher temporal resolution. A specially written, cursor-driven graphics program was used to scan this plot at various temporal resolutions and select episodes of whisking for kinematic analysis.
Fig. 2.
Whisking movement trajectories (angular position and time) for the right and left C-1 whiskers in a head-fixed animal recorded during the first test session. An 8.5 sec sample plotted at a lower resolution (every 10th data point) is shown at thetop. The shaded portion of the record highlights an 850 msec (cursor-selected) sample that is displayed at higher temporal resolution at the bottom. Upward and downward movements represent whisker protractions and retractions, respectively. The arrows labeled a,b, and c at the bottomidentify critical points (start, peak, and end, respectively) of the whisker movement that are extracted for kinematic analysis.
Whisking movements selected for analysis had protraction amplitudes of between 1 and 110° (the limit of the detector array), with smooth, clearly defined protraction (rising) and retraction (falling) phases and obvious starting and ending points. (Note that very small, ∼10° protractions rarely met these criteria, so our sample at this size is small. In addition, these criteria served to exclude a very small number of waveforms that were obscured by noise or highly irregular in form.) All whisks meeting the criteria were extracted for kinematic analysis using a custom-written QuickBasic program. A mouse click on an individual waveform initiated a general algorithm for identifying critical points, including the starting point (Fig. 2, arrow a), peak (Fig. 2, arrow b), and end point (Fig. 2,arrow c) of the whisking movement. Based on these values, the program automatically computes peak amplitudes and velocities for protractions and retractions and extracts the duration of each whisking cycle (protraction plus retraction) and the interwhisk interval. Both peak velocity and rise time to peak amplitude were measured during the protraction phase of whisking. Velocity reaches its peak approximately half way to peak amplitude.
A separate program was used to identify the start and end of discrete bouts of whisking and to calculate bout durations. Calculations related to bilateral coordination of whisking were based on selected pairs (right and left) of homologous whisks. At the end of each scoring session, the number of whisks analyzed was calculated; all data were downloaded to a spreadsheet for additional analysis.
A first approximation to whisking frequency was provided by the whisking cycle duration; more precise analysis was based on a finite Fourier transform (FFT) of the whisking waveforms. Temporal synchrony of whisking movements on the two sides was obtained by calculating the time difference between the occurrence of the peaks of two homologous whisks. Phase relationships among homologous whisker movements were calculated using a cross-correlation procedure. Relationships among kinematic variables (amplitude/velocity) were assessed by multiple regression analysis, using SAS analytic and statistical software (SAS Institute, Cary, NC).
RESULTS
Topography and kinematics of whisking movements in normal rats
Our kinematic analysis is based on measurements of >50,000 whisking movements, recorded from nine rats over the three preoperative sessions. The data sample from a single animal presented in Figure 2illustrates many of the characteristics of the rat's unconditioned (exploratory) whisking pattern. Although the rat is whisking in air (i.e., in the absence of contact), there are substantial variations in whisking amplitude, and movements of the two whiskers are sometimes clearly out of phase. [Note that these variations are unlikely to reflect artifacts produced by the presence of the markers (Bermejo et al., 1998).] Despite such variations, the impression of bilaterally synchronized movements over a wide range of amplitudes but at characteristic modal frequencies was confirmed by our kinematic analyses. The general kinematic trends are systematic across animals and do not differ significantly between either animals or the right and left whiskers within animals. For this reason, group data (n = 4) are plotted for some of the kinematic variables and, in many figures, only data for the right whisker are presented.
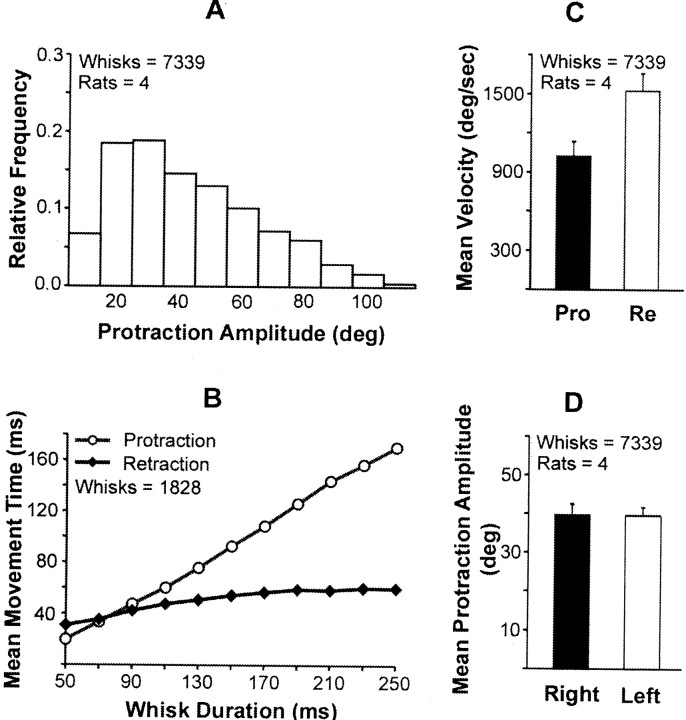
Figure 3 provides basic data on the biometrics of whisking. Animals whisking in air emit protractions covering an amplitude range from 10–100°, with the smaller whisks predominating (Fig. 3A); the amplitudes of right and left whisker movements are not significantly different (Fig.3B), and the velocity of retraction is significantly greater than that of protraction (Fig. 3C). In Figure3B, protraction and retraction times for a representative subject are plotted as a function of the duration of an individual whisk. For durations of >100 msec, protraction time increases almost linearly with increments in whisk duration, although retraction time remains essentially constant. [Note that, for durations of ≤70 msec (i.e., whisking frequencies of ≥14 Hz), the protraction phase of whisking can be shorter than the retraction phase.] A regression analysis (n = 9 rats) indicates that whisk duration is determined primarily by protraction time.
Fig. 3.
Kinematics of whisking behavior. A, Frequency distribution of whisking (i.e., protraction) amplitudes.B, Relative contributions of protraction and retraction to the total duration (movement time) of individual whisking movements. Data are for a single animal. C, Comparison of protraction (Pro) and retraction (Re) velocities during whisking. D, Comparison of protraction amplitudes in the right and left whiskers.
Amplitude scaling, rhythmicity, and bilateral coordination
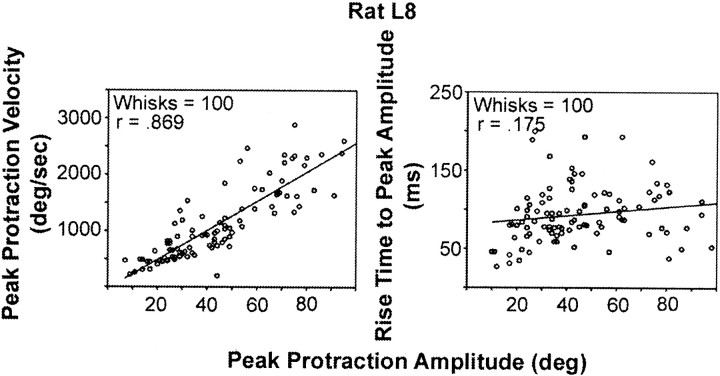
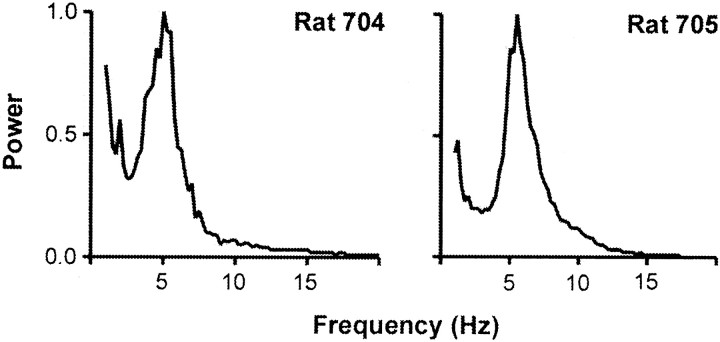
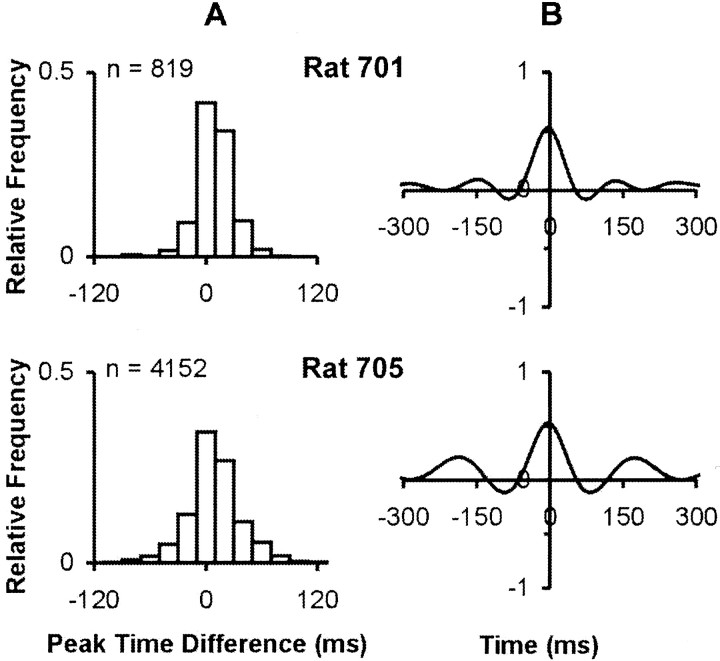
We examined the relationship between protraction amplitude and two critical kinematic variables (velocity and rise time to peak amplitude) using random samples of 100 whisks taken from four normal rats (Fig.4). Regression analysis of the entire data sample indicates that each of the variables accounts for a significant proportion of the variance in peak protraction amplitude. However, the proportion of variance accounted for by peak protraction velocity (r2v= 0.67–0.75) is substantially greater than that for rise time (r2rt = 0.03–0.21). Two measures of whisking frequency were used. Analysis of individual whisk durations indicated frequencies between 3 and 20 Hz, with a mode between 5 and 7 Hz. These values were confirmed using an FFT power spectra for two subjects (Fig.5). We assessed the coordination of whisking movements on the two sides of the face using two different measures: (1) the time difference between the occurrence of peak protraction amplitude in the right and left C-1 whisker, and (2) phase relationships among whisking movements on the two sides of the face. Figure 6A plots frequency distributions of time differences for two representative rats. The distributions are centered fairly symmetrically around zero (simultaneity) with relatively small (∼40 msec) and similar variability. The cross-correlograms presented (Fig.6B) for the same subjects have main peaks centered around zero, with highly significant correlation values (r = 0.5–0.65l; p < 0.001). There are symmetrical repetitive peaks at ∼150 msec, which corresponds to the dominant whisking frequency.
Fig. 4.
Amplitude scaling of protraction movements: relative contributions of protraction velocity and rise time variables. Plots are based on 100 randomly selected whisks from a single representative animal. Left, Relationship between protraction amplitude and peak velocity. Right, Relationship between protraction amplitude and rise time to peak protraction amplitude.
Fig. 5.
Whisking rhythmicity: plots of Fourier power spectra of whisking movements obtained from two representative animals.
Fig. 6.
Bilateral coordination of whisking movements on the two sides of the face: data for two representative animals.A, Frequency distribution of time differences between amplitude peaks in the right and left C-1 whiskers. B, Cross-correlograms of phase relationships among whisking movements on the right and left sides of the face.
Effects of repeated testing
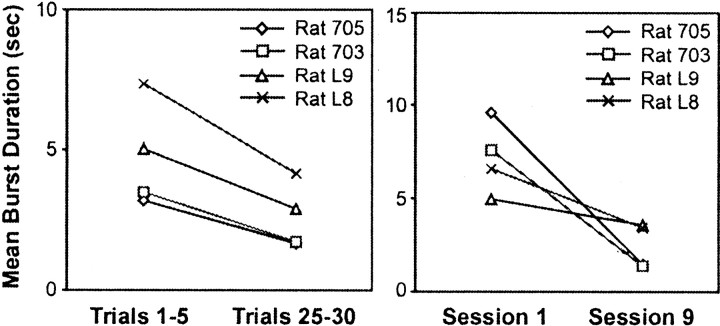
The effect of repeated exposure (nine sessions) to the testing situation was examined in the four sham-operated controls (Fig.7). Within-session effects were assessed by comparing the amount of whisking during the first and last five trials of each session, across all sessions. Between-session effects were assessed by comparing these same measures for the first and ninth sessions only. There were both within- and between-session reductions in the duration of whisking bursts, reflecting increases in periods of inactivity. Effects on the number of whisks and burst duration (but not protraction amplitude) were significant (p < 0.05).
Fig. 7.
Effects of repeated exposure to the test situation. Within-session (left) and between-session (right) changes in the amount and persistence of whisking activity as measured by the duration of individual whisking bouts.
Effects of vibrissa deafferentation
Data collection on the deafferented animals was completed within 10–12 d of surgery. Inspection of the postoperative field at 2 and 3 week intervals after sectioning in several test animals, and after completion of testing in the experimental animals, revealed an obvious gap between the cut edges of the nerve. This observation is consistent with the report that regenerating infraorbital axons are first seen entering the vibrissa 1 month after the transection (Renehan et al., 1986). Deafferented animals showed increased grooming of the vibrissal pad but no other obvious behavioral abnormalities.
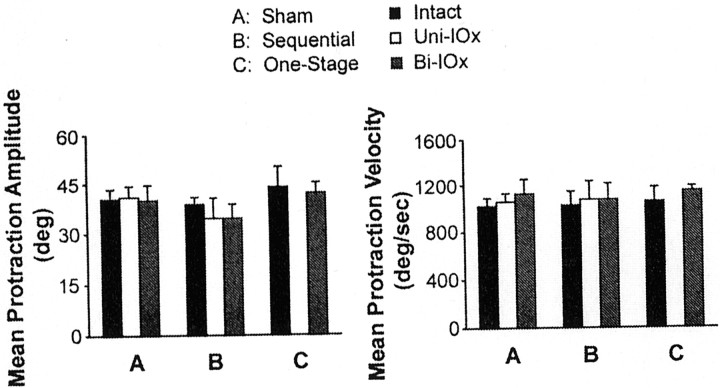
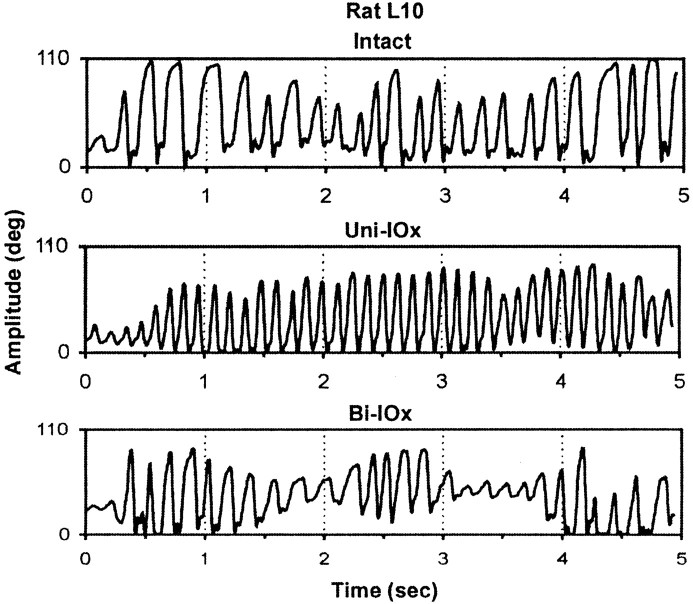
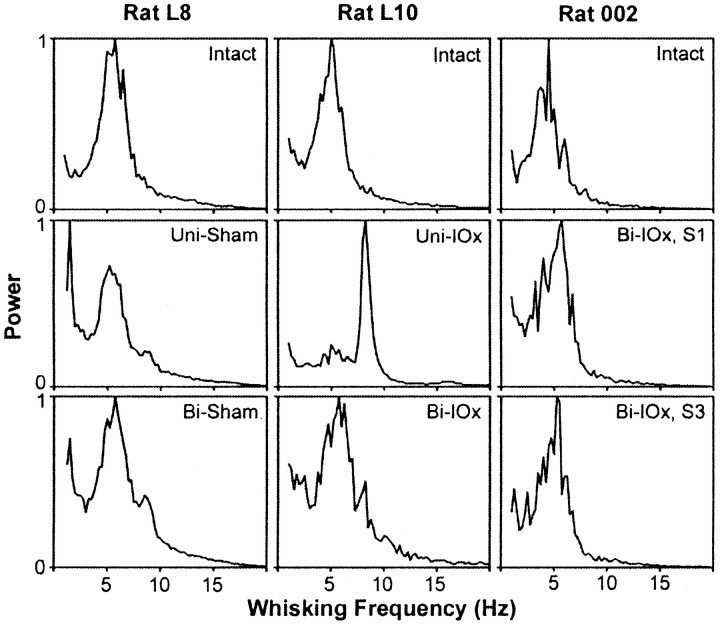
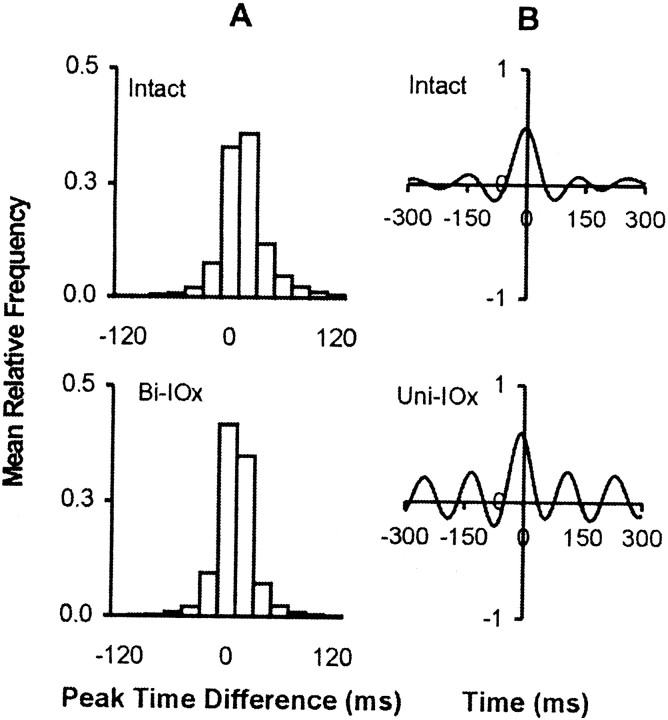
Neither sequential (unilateral and bilateral) nor one-stage (bilateral) deafferentation affected whisking amplitude or velocity (Fig.8), and both groups continued to scale amplitude by varying protraction velocity. However, in four of the five animals, unilateral deafferentation was followed by significant increases in whisking frequency on both sides of the face. Figure9 presents a sample of whisking movements recorded from a single animal preoperatively (intact), in the first session after unilateral deafferentation (Uni-IOx), and subsequently after sectioning of the remaining nerve (Bi-IOx). (For clarity, only data from one of the marked whiskers are shown.) Figure10 compares spectral plots of whisking frequency from representative sham-operated subjects (Fig. 10,left), from two-stage, sequentially sectioned subjects (Fig.10, middle), and from one-stage, bilaterally sectioned subjects (Fig. 10, right). Peak power spectrum frequencies were extracted for each subject in each condition and used in a repeated-measures ANOVA. No significant differences were seen in the sham-operated animals; modal frequencies for these animals remained in the 5–7 Hz range. A significant (p< 0.01) shift toward higher modal whisking frequencies (8–10 Hz) after unilateral deafferentation was seen in four of the five experimental subjects (Fig. 9, Rat L10). This increase was still evident in only one subject during retesting, 72 hr after sectioning of the remaining nerve. No significant frequency shifts were seen in the one-stage bilateral animals. Figure11, left, compares the phase relationships between movements of the right and left C-1 whiskers in a representative animal before and after unilateral deafferentation. The frequency distributions in Figure 11, right, illustrate the effects of a single-stage bilateral deafferentation on the bilateral coordination of whisking movements and are based on the data of all three Bi-IOx animals. Neither measure of bilateral coordination indicates significant impairment after deafferentation. Indeed, the data of the bilaterally denervated animals suggest an increase in the synchrony of whisking movements on the two sides of the face.
Fig. 8.
Deafferentation of the whiskers does not significantly impact either protraction amplitude (left) or protraction velocity (right). Data are averages of each of the groups. Intact, Preoperative (n = 4); Uni-IOx, after unilateral sectioning of the infraorbital nerve (n = 5);Bi-IOx, after bilateral sectioning of the infraorbital nerve (n = 3).
Fig. 9.
Effects of trigeminal deafferentation on whisking patterns. Low-resolution plots of whisking movements recorded preoperatively (top), after unilateral infraorbital nerve sectioning (middle), and after sectioning of the remaining infraorbital nerve (bottom) are shown. For clarity, only the record of a whisker on one side of the face is shown, but increases in whisking frequency after unilateral deafferentation were seen in both right and left C-1 whiskers.
Fig. 10.
Trigeminal deafferentation and whisking rhythmicity. Plots of Fourier power spectra before and after sham (left), sequentially (middle), and during the first and third sessions (S1 and S3, respectively) after a one-stage bilateral deafferentation of the whiskers (right). For clarity, only data for a single whisker are presented, although effects were similar in both whiskers.
Fig. 11.
Whisker deafferentation and the bilateral coordination of whisking. A, Effects of bilateral deafferentation. Frequency distributions of time differences between amplitude peaks in the right and left C-1 whiskers before (top) and after (bottom) bilateral infraorbital sectioning performed in a single stage. The data shown in the graph represent group means for the three animals.B, Cross-correlograms of whisking movements on the right and left sides of the animal before (top) and after (bottom) unilateral infraorbital nerve sectioning. Peak shifts in the second and third components reflect the increased whisking frequency. Data are for a single representative animal.
DISCUSSION
Our knowledge of sensory processing mechanisms is derived primarily from studies of neural or behavioral responses to stimuli passively received by sensory surfaces. In nature, however, animals actively seek out biologically relevant stimuli using exploratory movements (“acting to sense”) (Willis and Arbas, 1997). Once stimuli are located, they may be subjected to detailed examination by discriminative responses, which mediate encoding of critical stimulus properties. The rodent whisker system provides a useful preparation for the study of the neural mechanisms mediating both exploration and discrimination. Whisking movements generate somatosensory input patterns that are used both to guide the animal's subsequent adaptive behaviors and, recursively, to control the vibrissa movements themselves. The present study provides a quantitative characterization of the rat's exploratory whisking movements and examines the contribution of trigeminal sensory inputs to the generation, patterning, and coordination of those movements.
In previous studies, rats were either freely exploring in the home cage (Welker, 1964) or performing a tactile discrimination task (Carvell and Simons, 1990), so that neither head movements nor vibrissa contacts were controlled. We used a high-resolution optoelectronic monitoring system to obtain large samples of continuous (unconditioned) whisking behavior from bilaterally homologous whiskers in an immobilized preparation, which isolates the vibrissa from all inputs except those generated by the whisker movements themselves. These data were used to characterize the biometrics of whisking in intact animals and in animals in which all remaining whisker afference had been removed by denervation.
Biometrics of exploratory whisking
Despite differences in method and behavioral context, our biometric data are in good agreement with the results of previous studies (Carvell and Simons, 1990). During testing, all animals emitted bursts of whisking movements at amplitudes that are continuously distributed over a range from ∼10 to 100ο, at an average protraction velocity of ∼1000ο/sec, and at a predominant frequency of 5–7 Hz. The movement trajectories of a pair of homologous whiskers on the two sides of the face have similar protraction amplitudes and velocities and display a high degree of synchrony. Head-fixed subjects emitted whisking movements for which average amplitudes and velocities were somewhat higher and for which dominant whisking frequencies were somewhat lower than those reported previously for unconstrained animals (Carvell and Simons, 1990). These differences may reflect differences in motion analysis methods and/or the fact that the rats in the previous study were engaged in discriminative (contact-modulated) whisking, which characteristically involves a reduction in protraction amplitudes and an increase in whisking frequency (Carvell and Simons, 1995; Harvey et al., 2001). There was no indication of a subpopulation of “twitches” (very low-amplitude, higher-frequency movements), which has been associated with the presence of α rhythms in the electrocorticogram of resting animals (Semba and Komisaruk, 1984). However, our deprived, head-fixed rats are likely to have been in a highly aroused state. Finally, our data are consistent with the hypothesis that protraction is the active component of whisking (Fig. 4D) and indicate that amplitude scaling of whisking movements primarily involves control of protraction velocity. These data are consistent with a “pulse-height” motor control strategy (Gordon and Ghez, 1987), involving the generation of a “pulse” of motoneuron activity in the relevant muscle, before the start of the movement. Such scaling should be independent of feedback control during movement.
With repeated testing, subjects showed a reduction in the number of whisks emitted and in the mean burst durations, which were most obvious toward the end of each session. The pattern of whisking activity shifted gradually from relatively long bursts of continuous whisking, to intermittent short bursts, and even single whisks. This reduction presumably reflects the absence of either novel inputs or reinforcements associated with specific whisking patterns. Although rats were deprived of water, they were not reinforced for whisking (i.e., there was no contingency between water delivery and any whisking movement parameter). Establishment of such contingencies can maintain substantial levels of whisking over periods of weeks and months (Bermejo et al., 1996; Gao et al., 1998). Whisking thus has many of the properties of an “operant” response, a conclusion that has obvious methodological implications (Sachdev et al., 2001).
Deafferentation effects on whisking: evidence for central pattern generation
The concept of CPGs is based on the observation that many invertebrate and vertebrate motor patterns may be produced in the absence of any sensory feedback (Delcomyn,1980; Grillner et al., 1998). Much of this evidence comes from recordings of the electrical correlates of “fictive” movement patterns in progressively reduced preparations (Pearson and Ramirez, 1997). The data of the present study, obtained from intact, behaving animals, demonstrate that bilateral deafferentation of the whiskers, when performed in a single-stage procedure, does not affect the generation, patterning, or bilateral coordination of exploratory whisking and may even increase the bilateral synchrony of whisking movements. In the absence of proprioceptors in the mystacial pad or follicular muscles (Bowden and Mahran, 1956; Kleinfeld et al., 1999), the reafference conveyed by the trigeminal sensory nerve would be the sole source of movement-related inputs. That such reafference is normally available to central mechanisms is evident from the observation that whisker movements elicited by motor nerve stimulation evoke single-unit activity in the trigeminal ganglion (Zucker and Welker, 1969) and somatosensory thalamus (Brown and Waite, 1974). The persistence of this pattern, even after removal of whisking reafference, provides clear behavioral evidence for a contribution by central mechanisms to the generation and maintenance of the rat's whisking behavior. In contrast to other pattern-generating systems (e.g., locust flight) (Pearson and Ramirez, 1997), removal of sensory feedback does not substantially alter the normal whisking movement pattern.
Some additional behavioral observations are informative as to the possible organization of those mechanisms. First, in the natural environment [i.e., when modulated by sensory (exafferent) input], rats may emit quite different whisking patterns on the two sides of the face, including whisking on one side but not the other. Even in the head-fixed animal, the activity of bilaterally homologous whiskers is not always in phase or identical in amplitude. This observation implies the existence of distinct (right and left) CPGs with separate outputs to homolateral vibrissal motoneurons. Second, the high degree of similarity in whisker movements on the two sides of the head-fixed animal and the fact that unilateral sensory denervation is followed by a bilateral effect on whisking suggest that the two CPGs are normally tightly coupled. Third, the increased whisking frequency seen bilaterally after unilateral denervation is consistent with a model of the rodent CPG in which (1) the normal effect of reafferent input on frequency is inhibitory and (2) the level of activity in each CPG is monitored, discrepancies are noted, and the frequency is adjusted to bring the two sides into balance. The biometric data obtained from the denervated animals presumably reflect the output of that circuitry in normal adults.
The fact that whisking rhythms share modal frequencies (6–9 Hz) with other rhythmic orofacial behaviors (e.g., chewing, sucking, and licking), and their persistence after decortication or decerebration, suggests that the generation, timing, and coordination of whisking are controlled by neural circuits at brainstem levels (Nakamura and Katakura, 1995). The parvocellular reticular formation (Rpc) has long been a candidate for the location of orofacial CPGs because it receives inputs from brainstem orosensory nuclei and projects on oromotor nuclei (Ter Horst et al., 1991). A. Keller (personal communication) has reported that “whisking (VIIm) motoneurons in an in vitro slice preparation exhibit spontaneous rhythmic firing at 5–10 Hz.” Retrograde labeling of VIIm neurons has confirmed that they receive an input from Rpc neurons, and electrical stimulation of Rpc premotoneurons elicits monosynaptic responses in whisking motoneurons. Keller hypothesizes that rhythmic activity in whisking motoneurons is generated by interactions between synaptic inputs from pacemaker-like excitatory and inhibitory premotoneurons in the parvocellular reticular formation (Hattox et al., 2000).
As with other centrally generated rhythmic movements, whisking patterns are strongly influenced by phasic signals from peripheral receptors (Rossignol et al., 1988; Pearson and Ramirez, 1997). During tactile discriminations involving active touch, the rat modulates whisking movement parameters (amplitude, rate, and bandwidth) in a manner that correlates significantly with the stimulus properties of the discriminanda (Carvell and Simons, 1995; Harvey et al., 2001). Moreover, whisking behavior has a number of properties that make it an excellent “model system” for future studies of the manner in which sensory inputs and central mechanisms are integrated in the generation of complex motor acts. For example, the whisker load is constant in the absence of object contact, the system is not complicated by a proprioceptive loop originating in muscle receptors, whisker movements have essentially a single degree of freedom, and the whiskers tend to move in unison, so that the properties of central sensorimotor circuits may be assessed by monitoring the movement trajectories of a single whisker. Functional analysis of whisking circuitry will require a combination of physiological recording procedures and precise measurements of behavioral and kinematic variables under highly controlled conditions. The methodologies introduced in this study should facilitate such analyses.
Footnotes
This work was supported by Research Scientist Award MH-00320, by National Institutes of Health Grants MH-08366 and NS37263, and by Professional Staff Congress–City University of New York Research Awards.
Correspondence should be addressed to Dr. H. Philip Zeigler, Department of Psychology, Hunter College, 695 Park Avenue, New York, NY 10021. E-mail: hzeigler@shiva.hunter.cuny.edu.
REFERENCES
- 1.Bermejo R, Gao P, Harvey M, Zeigler HP. Conditioned “whisking” in the rat. Somatosens Mot Res. 1996;13:225–234. doi: 10.3109/08990229609052578. [DOI] [PubMed] [Google Scholar]
- 2.Bermejo R, Houben D, Zeigler HP. Optoelectronic monitoring of individual whisker movements in rats. J Neurosci Methods. 1998;83:89–96. doi: 10.1016/s0165-0270(98)00050-8. [DOI] [PubMed] [Google Scholar]
- 3.Bowden REM, Mahran ZY. The functional significance of the pattern of innervation of the muscle quadratus labii superioris of the rabbit, cat, and rat. J Anat. 1956;90:217–227. [PMC free article] [PubMed] [Google Scholar]
- 4.Brown AS, Waite PME. Responses in the rat thalamus to whisker movements produced by motor nerve stimulation. J Physiol (Lond) 1974;238:387–401. doi: 10.1113/jphysiol.1974.sp010531. [DOI] [PMC free article] [PubMed] [Google Scholar]
- 5.Carvell GE, Simons DJ. Biometric analyses of vibrissal tactile discrimination in the rat. J Neurosci. 1990;10:2638–2648. doi: 10.1523/JNEUROSCI.10-08-02638.1990. [DOI] [PMC free article] [PubMed] [Google Scholar]
- 6.Carvell GE, Simons DJ. Task and subject related differences in sensorimotor behavior during active touch. Somatosens Mot Res. 1995;12:1–9. doi: 10.3109/08990229509063138. [DOI] [PubMed] [Google Scholar]
- 7.Delcomyn F. Neural basis of rhythmic behavior in animals. Science. 1980;210:492–498. doi: 10.1126/science.7423199. [DOI] [PubMed] [Google Scholar]
- 8.Dorfl J. The musculature of the mystacial vibrissae of the white mouse. J Anat. 1982;135:147–154. [PMC free article] [PubMed] [Google Scholar]
- 9.Dorfl J. The innervation of the mystacial region of the white mouse: a topographical study. J Anat. 1985;142:173–184. [PMC free article] [PubMed] [Google Scholar]
- 10.Gao P, Ploog BO, Zeigler H. Conditioning of rodent whisking: stimulus control of rate and amplitude. Soc Neurosci Abstr. 1998;24:830.14. [Google Scholar]
- 11.Gordon J, Ghez C. Trajectory control in targeted force impulses II. Pulse height control. Exp Brain Res. 1987;67:241–252. doi: 10.1007/BF00248546. [DOI] [PubMed] [Google Scholar]
- 12.Grillner S, Ekeberg O, El Manira A, Lansner A, Parker D, Tegner J, Wallen P. Intrinsic function of a neuronal network: a vertebrate central pattern generator. Brain Res Brain Res Rev. 1998;26:184–197. doi: 10.1016/s0165-0173(98)00002-2. [DOI] [PubMed] [Google Scholar]
- 13.Harvey M, Bermejo R, Zeigler HP (2001) Discriminative whisking in the head-fixed rat: optoelectronic monitoring during tactile detection and discrimination tasks. Somatosens Mot Res, in press. [DOI] [PubMed]
- 14.Hattox AM, Priest C, Keller A. Identification of functional neuroanatomical circuitry involved in regulation of whisking activity. Soc Neurosci Abstr. 2000;26:166.10. [Google Scholar]
- 15.Kleinfeld D, Berg RW, O'Connor SM. Anatomical loops and their electrical dynamics in relation to whisking by rat. Somatosens Mot Res. 1999;16:69–88. doi: 10.1080/08990229970528. [DOI] [PubMed] [Google Scholar]
- 16.Lovick TA. The behavioral repertoire of precollicular decerebrate rats. J Physiol (Lond) 1972;226:4–6. [PubMed] [Google Scholar]
- 17.Nakamura Y, Katakura N. Generation of masticatory rhythm in the brainstem. Neurosci Res. 1995;23:1–19. [PubMed] [Google Scholar]
- 18.Pearson KG, Ramirez JM. Sensory modulation of pattern-generating circuits. In: Stein PSG, Grillner S, Selverston AI, Stuart DG, editors. Neurons, networks, and motor behavior. MIT; Cambridge, MA: 1997. pp. 225–235. [Google Scholar]
- 19.Renehan WE, Mance A, Munger B. Degeneration and regeneration of peripheral nerve in the rat trigeminal system II. Response to nerve lesions. J Comp Neurol. 1986;249:429–459. doi: 10.1002/cne.902490402. [DOI] [PubMed] [Google Scholar]
- 20.Rossignol S, Lund JP, Drew T. The role of sensory inputs in regulating patterns of rhythmical movements in higher vertebrates. In: Cohen A, Rossignol S, Grillner S, editors. Neural control of rhythmic movements in vertebrates. Wiley; New York: 1988. pp. 201–238. [Google Scholar]
- 21.Sachdev R, Jenkinson E, Zeigler H, Ebner F. Sensorimotor plasticity in the rodent vibrissa system. In: Kaas JH, editor. The mutable brain: dynamic and plastic features of the developing and mature brain. Harwood; Amsterdam: 2001. pp. 123–164. [Google Scholar]
- 22.Semba K, Komisaruk BR. Neural substrates of two different rhythmical vibrissal movements in the rat. Neuroscience. 1984;3:761–774. doi: 10.1016/0306-4522(84)90168-4. [DOI] [PubMed] [Google Scholar]
- 23.Ter Horst GJ, Copray JCVM, Liem RSB, Van Willigen JD. Projections from the rostral parvocellular reticular formation to pontine and medullary nuclei in the rat: involvement in autonomic regulation and orofacial motor control. Neuroscience. 1991;40:735–758. doi: 10.1016/0306-4522(91)90009-d. [DOI] [PubMed] [Google Scholar]
- 24.Vincent SB. The function of the vibrissae in the behavior of the white rat. Behav Monog. 1912;1:1–181. [Google Scholar]
- 25.Welker WI. Analysis of sniffing of the albino rat. Behaviour. 1964;22:223–244. [Google Scholar]
- 26.Willis MA, Arbas EA. Centrally patterned behavior generates sensory input for adaptive control. In: Stein PSG, Grillner S, Selverston AI, Stuart DG, editors. Neurons, networks, and motor behavior. MIT; Cambridge, MA: 1997. pp. 269–275. [Google Scholar]
- 27.Wineski LE. Facial morphology and vibrissal movement in the golden hamster. J Morphol. 1985;183:199–217. doi: 10.1002/jmor.1051830208. [DOI] [PubMed] [Google Scholar]
- 28.Zucker E, Welker WI. Coding of somatic sensory input by vibrissae neurons in the rat's trigeminal ganglion. Brain Res. 1969;12:138–156. doi: 10.1016/0006-8993(69)90061-4. [DOI] [PubMed] [Google Scholar]


