

Abstract
Fragile X syndrome is caused by a mutation in theFMR1 gene leading to absence of the fragile X mental retardation protein (FMRP). Reports that patients and adultFMR1 knock-out mice have abnormally long dendritic spines of increased density suggested that the disorder might involve abnormal spine development. Because spine length, density, and motility change dramatically in the first postnatal weeks, we analyzed these properties in mutant mice and littermate controls at 1, 2, and 4 weeks of age. To label neurons, a viral vector carrying the enhanced green fluorescent protein gene was injected into the barrel cortex. Layer V neurons were imaged on a two-photon laser scanning microscope in fixed tissue sections. Analysis of >16,000 spines showed clear developmental patterns. Between 1 and 4 weeks of age, spine density increased 2.5-fold, and mean spine length decreased by 17% in normal animals. Early during cortical synaptogenesis, pyramidal cells in mutant mice had longer spines than controls. At 1 week, spine length was 28% greater in mutants than in controls. At 2 weeks, this difference was 10%, and at 4 weeks only 3%. Similarly, spine density was 33% greater in mutants than in controls at 1 week of age. At 2 or 4 weeks of age, differences were not detectable. The spine abnormality was not detected in neocortical organotypic cultures. The transient nature of the spine abnormality in the intact animal suggests that FMRP might play a role in the normal process of dendritic spine growth in coordination with the experience-dependent development of cortical circuits.
Keywords: fragile X, FMRP, dendritic spine, critical period, somatosensory cortex, development, mental retardation, two-photon
Mental retardation is a component of many syndromes. Some are caused by large-scale chromosomal abnormalities; others are caused by physical, infectious, or biochemical insults sustained early in brain development. The fragile X syndrome is remarkable because it is a mental retardation syndrome caused by a mutation in a single gene, FMR1. It is characterized by a constellation of signs in addition to the cognitive deficit, including macro-orchidism, certain facial features, and abnormalities in attention and short-term memory (Schapiro et al., 1995; de Vries et al., 1998). The mutation giving rise to the syndrome, a CGG repeat expansion in the 5′ untranslated region of theFMR1 gene, interferes with transcription, and patients do not have measurable amounts of the gene product, fragile X mental retardation protein (FMRP) (Pieretti et al., 1991). This protein appears to act as an RNA binding protein (Feng et al., 1997; Brown et al., 1998) and is localized to neurons, and to dendrites in particular (Devys et al., 1993; Verheij et al., 1993; Feng et al., 1997). Interestingly, FMRP mRNA is found in dendrites, and the expression of FMRP is increased by activation of metabotropic glutamate receptors (Weiler et al., 1997), linking FMRP to synaptic function. Remarkably little is known about the neuropathologic features of this disorder. One finding reported both in patients (Rudelli et al., 1985; Hinton et al., 1991; Irwin et al., 2001) and in adult FMR1 knock-out mice (Comery et al., 1997) is an abnormality in dendritic spines, which were described as being unusually long, similar to the spines observed in cortical circuits during development (Dailey and Smith, 1996; Fiala et al., 1998; Lendvai et al., 2000), and of increased density. These observations have led some to speculate that the absence of FMRP causes a defect in spine maturation and pruning (Comery et al., 1997). This hypothesis has not, however, been tested directly in the intact brain. Another characteristic of spines, necessarily neglected in postmortem morphologic studies, is their motility, which is believed, in part, to represent postsynaptic participation in synapse formation (Dailey and Smith, 1996). Spine motility has been shown to be sensitive to sensory deprivation (Lendvai et al., 2000) and is greatest early in postnatal life (Dunaevsky et al., 1999; Lendvai et al., 2000). Because an abnormality in spine motility early in postnatal life could affect synaptogenesis, it is of interest to determine whether the absence of FMRP affects normal spine motility. Here we show that dendritic spines in the intact brains of FMR1 knock-out mice are abnormal early in postnatal life. These abnormalities in the somatosensory cortex are most pronounced during the period of greatest synaptogenesis in that region (White et al., 1997) and subside largely by the end of the first postnatal month. Spines in comparable neurons maintainedin vitro showed no such abnormalities and were normally motile. These observations support the notion that FMRP plays a role in synaptogenesis in the intact brain.
MATERIALS AND METHODS
Male FMR1 knock-out mice of the FVB strain and wild-type (wt) littermate controls were used for the present study. Genotypes were determined by PCR analysis of DNA extracted from tail samples taken before perfusion or culture preparation. The primers used were the same as those outlined in the original article describing these animals (Dutch–Belgian Fragile X Consortium, 1994). All experimental protocols were conducted according to National Institutes of Health guidelines for animal research and were approved by the Institutional Animal Care and Use Committee at Cold Spring Harbor Laboratory.
Mice (6, 13, and 27 d of age; n = 5 for each group) were administered intracortical injections of enhanced green fluorescent protein (EGFP) in a replication-deficient Sindbis expression vector (Invitrogen, San Diego, CA). Briefly, mice were anesthetized with a mixture of ketamine and xylazine (22 and 15 mg/kg, i.m., respectively). A small burr hole was drilled in the skull overlying the posteromedial barrel field using stereotactic coordinates determined previously for each age on the basis of cytochrome oxidase staining, and 50–100 nl of virion-rich supernatant was delivered using a Picospritzer (General Valve Co, Fairfield, NJ) at a depth of 300–500 μm. Injection volume was titrated to yield sufficient numbers of well separated neurons within the injected barrel and its neighbors (Chen et al., 2000). The number of neurons labeled with comparable injections decreased with postnatal age as described previously (Chen et al., 2000). The skin was closed and the animal was returned to its cage. After 24 hr, the animal was anesthetized again and perfused transcardially with cold 4% paraformaldehyde. The brain was removed and post-fixed for an additional 6–12 hr. The brain was blocked and cut into 200-μm-thick sections in the coronal plane with a Vibratome(Technical Products International Inc., St Louis, MO). Labeled neurons were identified and imaged using a custom-built two-photon laser scanning microscope (2PLSM) based on an Olympus Fluoview laser scanning microscope (Olympus America, Inc., Melville, NY). The light source was a Ti–Sapphire laser (Tsunami; SpectraPhysics, Mountain View, CA) running at a wavelength of ∼910 nm (repetition frequency, 80 MHz; pulse length, 150 fsec). The average power delivered to the backfocal plane of the objective (40×; numerical aperature, 0.8) varied depending on the imaging depth (range, 30–150 mW). Laser power was adjusted so that additional power failed to reveal previously undetected protrusions. Fluorescence was detected in whole-field detection mode with a photomultiplier tube (Hamamatsu Corp., Bridgewater, NJ). Dendritic segments of different orders were sampled in a systematic random manner throughout the dendritic tree.
For in vitro studies, neocortical slice cultures were prepared from 2-d-old mice (n = 5 animals for each group) according to the method of Stoppini et al. (1991). Slices containing the posteromedial barrel field were selected. The EGFP gene was introduced using biolistic gene transfer (Lo et al., 1994) (Bio-Rad, Hercules, CA) after 3 d in vitro (DIV), and layer V neurons were imaged 2 d later (7 d from the date of birth). Slice cultures were placed into a chamber and were continually perfused with oxygenated artificial CSF consisting of (in mm): 119 NaCl, 2.5 KCl, 26.2 NaHCO3, 1.0 NaHPO4, 11 glucose, 2.5 CaCl2, and 1.3 MgCl2; cultures were maintained at 32°C. Time-lapse imaging of systematically sampled dendritic segments consisted of collecting image stacks every 2 min for a total of 22 min, yielding 10 time intervals per segment.
Protrusions were analyzed using custom software written in Interactive Data Language (Research Support Instruments, Inc., Boulder, CO). Image stacks consisting of 10–50 sections spaced 1 μm apart were generated, and protrusion lengths were obtained by measuring the projection of the protrusion from its tip to the point at which it meets the dendritic shaft. When the identity of a protrusion was unclear (for instance, whether it was a single spine, or two, or an axonal profile), the individual z images were reviewed. No effort was made to analyze spines emerging below or above the dendrite. The reason for this is that the resolution of the imaging system, as with all optical systems, was lower in the z direction than in the x and y directions. Because only the longest spines would reliably be detected along the optical axis, the analysis was restricted to spines that could be detected in thex- and y-axes. For spine density measurements, the sampling unit was the individual dendritic segment imaged. As a measure of motility, absolute length differences between subsequent time points were calculated; we refer to the mean difference over 10 intervals as “mean motility” (Chen et al., 2000; Lendvai et al., 2000). The “range of motility” refers to the total excursion of the spine over the imaging time period and is the difference between the maximum and minimum lengths of the spine. “Proportion persistent” was defined as the proportion of the total number of protrusions that were present throughout the 22 min imaging session (i.e., with a length that never measured 0 μm). To test for interactions among postnatal ages and genotype and to control for variability at different sampling levels, spine lengths and densities in mutant and control groups were analyzed using a nested ANOVA procedure (SAS Institute, Cary, NC). This procedure was performed on second-order apical dendrites, which represented the largest single dataset. Length distributions were compared using the Kolmogorov–Smirnov two-sample test. For purposes of illustration, however, values for each genotype were pooled. Throughout the study, injections, perfusions, sectioning, imaging, and spine measurements were performed blind to genotype.
RESULTS
One day after intracortical injection of the viral vector containing the EGFP gene, neurons were well labeled. The tissue sections were reminiscent of Golgi stains, in that a small subset of neurons was fully labeled (Fig.1A,B). The dendrites of mutant animals showed no gross abnormalities when compared with controls. Analysis was restricted to layer V pyramidal neurons in the posterior medial barrel field without evidence of truncated apical or basal dendritic trees. Typically four to seven neurons were analyzed in each animal.
Fig. 1.
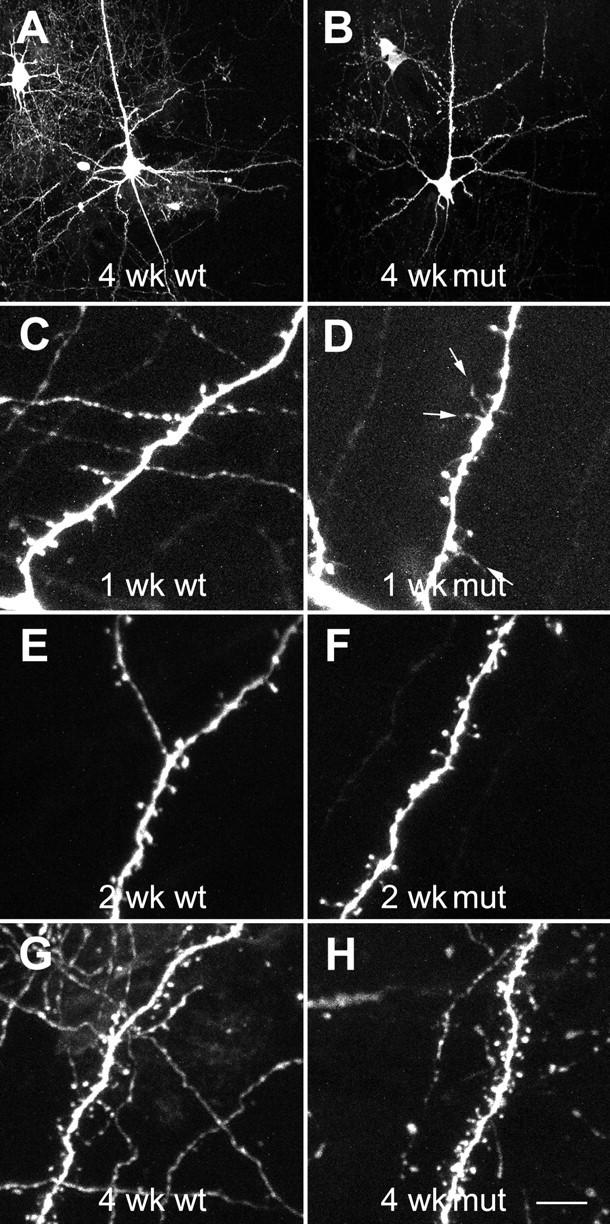
Two-photon laser scanning micrographs showing morphology of and spine development in EGFP-expressing layer V pyramidal neurons in the somatosensory cortex of wild-type (left) and mutant (right) mice transfected in vivo before fixation. Note the presence of long protrusions at 1 week, particularly in the mutant mice (arrows). Scale bars: A, B, 50 μm;C–H, 8 μm.
Analysis of the morphologic properties of dendritic spines in mutant and control animals during the first postnatal month revealed clear developmental trends. Spine length changed during this period. At 1 week, the overall mean spine length was 20% greater than at 4 weeks. Consistent with other accounts, spine density also changed, increasing 2.5-fold between 1 and 4 weeks in normal animals. These developmental changes were evident to a different degree in the mutant animals as well. The differences between the genotypes depended on the postnatal age. At 1 week, the overall mean spine length was 28% greater in the mutant animals than in the wild-type animals (p< 0.0001; n = 1806 and 2034 spines for wild-type and mutant animals, respectively). This difference dropped to 10% at 2 weeks (n = 3452 and 3224 spines for wild-type and mutant animals, respectively) and only 3% at 4 weeks (n = 2202 and 3490 spines for wild-type and mutant animals, respectively) (Fig.2A–C). At 1 week, the distribution of spine lengths differed significantly between the two genotypes (Kolmogorov–Smirnov two-sample test; p < 0.001), with mutants having fewer short spines (0.5–1.5 μm) and more medium-to-long spines (2.5–5 μm) (Figs. 1C,D,2D). When categorized by dendritic order, the spines at most dendritic orders were significantly longer in the mutant animals compared with the wild-type animals, with the exception of spines on tertiary basal dendrites, for which there was no significant difference between the groups (Fig. 2G). At 2 weeks, the difference between the length distributions in the two groups was smaller but still highly significant (p < 0.001) (Fig. 2E). These differences were accounted for almost completely by differences localized to secondary apical and to primary and tertiary basal dendrites (Fig. 2H). At 1 month, there were no significant differences overall either in the length distribution or at any dendritic orders except for tertiary basal dendrites, for which spines in the mutant animals were significantly shorter than in the wild-type animals (Fig.2F,I). A nested ANOVA procedure performed on second-order apical dendrites, the largest dataset, confirmed these findings, showing a significant interaction between age and genotype (p < 0.01) despite considerable cell-to-cell variability within animals.
Fig. 2.

Developmental spine length changes inFMR1 knock-out mice and littermate controls. A, D, G, 1 week; B, E, H, 2 weeks; C, F, I, 4 weeks. A–C, Mean spine length in mutant and control mice. D–F, Cumulative frequency distribution of spine lengths. G–I, Mean spine length at different branching levels in the dendritic tree. InD–F, black areas indicate wild type andwhite areas indicate mutant. InG–I, black bars indicate wild type andgray bars indicate mutant. ap1–3, Primary through tertiary apical dendrites; bas1–3, primary through tertiary basal dendrites. Error bars indicate SEM. *p < 0.05; **p < 0.001; ***p < 0.0001.
Spine density also varied developmentally with genotype. At 1 week, mean spine density in the mutant animals was 33% higher than in the wild-type animals (n = 168 and 177 dendritic segments for wt and mutant animals, respectively), and this difference was evident at all sampled dendritic levels (Fig.3A,D). At 2 and 4 weeks there was no significant difference in spine density (2 weeks,n = 176 and 170 dendritic segments for wt and mutant animals, respectively; 4 weeks, n = 92 and 133 dendritic segments for wt and mutant animals, respectively) (Fig.3B,C). Interestingly, in secondary apical dendrites, spine density was elevated at 1 week, normal at 2 weeks, and then significantly elevated again at 4 weeks (Fig. 3D–F). Again, a nested ANOVA procedure performed on second-order apical dendrites confirmed a highly significant interaction between age and genotype (p < 0.001). The changes in spine length and density over time in normal and mutant animals are summarized in Figure 4.
Fig. 3.

Developmental spine density changes inFMR1 knock-out mice and littermate controls. A, D, 1 week; B, E, 2 weeks; C, F, 4 weeks. A–C, Mean spine density in mutant and control mice. D–F, Mean spine density at different branching levels in the dendritic tree. Means are shown only for primary and secondary dendrites, because the number of tertiary dendrites sampled was too inconsistent to provide reliable estimates. Black bars, Wild type; gray bars, mutant.ap1–2, Primary through tertiary apical dendrites; bas1–2, primary through tertiary basal dendrites. Error bars indicate SEM. *p < 0.05; **p < 0.001; ***p < 0.0001.
Fig. 4.

A, C, Summary of changes in spine length (A) and density (C) in wild-type mice during the first postnatal month. n = 5 animals in each group. Error bars indicate SEM. B, D, Summary of changes in spine length (B) and density (D) in mutant mice during the first postnatal month. The value for each parameter is normalized to the wild-type value. Error bars are computed as the sum of the SEM for wild-type and mutant animals.n = 5 animals in each group.
To study the morphologic properties of neurons in the absence of sensory input, neocortical slice cultures were prepared from 2-d-old mouse pups and analyzed at 1 week after the date of birth, corresponding to the time point showing the greatest differences in the intact brain. Neurons labeled using biolistic gene transfer with EGFP were analyzed for spine length, density, and motility. Layer V neurons with typical pyramidal morphology were chosen for analysis (Fig.5A–D). The morphologies of these neurons were somewhat different from those transfected in the intact brain, in that apical dendrites reached layer I less frequently. Unlike the results described for neurons labeled in vivo(Figs. 1-3), spine lengths and densities in this preparation did not differ significantly between the two genotypes (Fig.6A,C). In separate experiments, hippocampal organotypic cultures (prepared at postnatal day 7) were transfected either biolistically or by injection of the same Sindbis viral vector used in the experiments in the intact brain and imaged after 7 DIV. No significant difference in spine density was detected between neurons transfected with the two methods (virus, 0.72 ± 0.07; biolistic, 0.73 ± 0.035; p > 0.05), indicating that the transfection method was not responsible for the lack of a morphologic phenotype in vitro.
Fig. 5.

Two-photon laser scanning micrographs of biolistically transfected layer V neurons in neocortical organotypic cultures at 1 week from the date of birth. A, C, Wild type. B, D, Mutant. A, B, Low-magnification projections showing pyramidal morphology. C, D, High-magnification projections of dendritic segments. Note the increased presence of long protrusions in this preparation. Scale bar: A, B, 50 μm; C, D, 4 μm.E, Spine motility in neocortical cultures imaged using 2PLSM at 1 week from the date of birth. Micrographs taken at 2 min intervals show typical changes in spine morphology. One protrusion (arrow) changes shape several times during this interval, branching, extending, and retracting. Another (arrowhead) undergoes changes in the morphology of its head. Others change relatively little during this interval. This example was taken from a wild-type animal. Numbers indicate time in minutes. Scale bar, 2 μm.
Fig. 6.

Spine length and density in neocortical cultures analyzed 1 week from the date of birth. A, Mean spine length; n = 1754 and 1667 spines for wt and mutant animals, respectively. B, Spine length at different levels in the dendritic tree. C, Mean spine density; n = 247 and 255 dendritic segments for wt and mutant, respectively. D, Spine density at different levels in the dendritic tree. E–G, Spine motility in neocortical cultures analyzed 1 week from the date of birth.E, Mean motility per 2 min time interval.F, Mean length range over which spines vary over a 22 min time interval. G, Proportion-persistent spines for wild-type and mutant animals. Black, Wild type;gray, mutant. ap1–3, Primary through tertiary apical dendrites; bas1–3, primary through tertiary basal dendrites. Error bars indicate SEM. *p < 0.05; **p < 0.001; ***p < 0.0001.
Analysis of spine motility in neocortical cultures also showed no significant differences between mutants and controls. Although protrusions were quite motile (Figs. 5E,6E–G), the mean motility per 2 min time interval, the rate of turnover, and the lengths over which spines ranged were not significantly different in the mutant animals compared with the wild-type animals (Fig. 6E–G).
DISCUSSION
Histologic studies of brains of patients with fragile X syndrome are scarce and can be summarized by noting that the brains are grossly normal, with apparently normal neuronal densities. The only reported abnormalities have been a decrease in synapse length (Rudelli et al., 1985) and abnormally long and thin dendritic spines (Rudelli et al., 1985; Hinton et al., 1991; Irwin et al., 2001). There is good reason to look at spines for neuropathology, because several mental retardation disorders are characterized by abnormalities in dendritic spines (Marin-Padilla, 1972; Purpura, 1975). It is therefore of great interest that a Golgi study of the occipital cortex of FMR1 knock-out mice at 16 weeks found the spines there to be ∼20% longer and up to 50% more densely distributed than in wild-type controls (Comery et al., 1997).
Our present findings confirm increases in spine length and density in the knock-out mouse. However, we measured increased spine density only transiently at 1 week, with no detectable differences at 2 and 4 weeks. Similarly, increases in spine length were greatest at 1 week and were barely detectable by 1 month of postnatal life, much less pronounced than in the 16-week-old animals described previously (Comery et al., 1997). Several explanations for this discrepancy are possible. First, the previous study was in the occipital cortex rather than in primary somatosensory cortex, and dendritic maturation may differ sufficiently in these two cortical areas to account for this difference. However, two studies of dendritic spine maturation in the rat showed a comparable time course of dendritic spine development in these two areas (Wise et al., 1979; Miller, 1981). Thus, it is unlikely that regional differences would account for the discrepancies in spine density between the two FMR1 studies.
Second, because transfection efficiency decreases with postnatal age (Chen et al., 2000), the possibility exists that the decrease in the magnitude of the phenotype is attributable to a selective decrease of labeling of only certain cell populations (for instance, neurons with abnormal spines). Although we have no reason to expect such an effect, we cannot conclusively rule it out in the absence of methods, such as electron microscopy, that do not depend on the labeling of neuronal subpopulations. However, if the labeling of abnormal cells decreased with age, we would expect the cell-to-cell variability in mutant animals to be greater at 1 week than at 4 weeks. In this study, there is a very slight increase in variability between 1 and 4 weeks (results of ANOVA; data not shown).
Third, there is evidence that spine density normally decreases after 1 month postnatally (Wise et al., 1979; Miller, 1981). Thus the results of the previous study might reflect an abnormality during a later phase of synapse pruning. Our methods effectively preclude our resolving this issue, because viral infection efficiency is low after 6 weeks (Chen et al., 2000). This explanation would support a continuing role for FMRP in the production and maintenance of appropriate synaptic connections beyond development. In fact, although spine density was normal on average at 4 weeks, it was elevated selectively in second-order apical dendrites, after having been normal at this dendritic level at 2 weeks. This change could therefore represent the beginning of a trend continuing into adulthood and might have evolved into the difference detected in the 16-week-old animals. Finally, methodological differences must be considered, because it is difficult to compare the neuronal populations labeled with the Golgi stain with those labeled virally as in the present study, or to compare neurons analyzed with an eyepiece reticule with those imaged using laser scanning microscopy.
The use of optical rather than electron microscopic methods presents certain advantages, including the ability to sample very large numbers of spines in each animal in an efficient manner. But an important limitation of optical studies is that the fluorescence intensity, and by extension, the detectability, of small structures such as spines is proportional to their volume. Thus the smallest spines may go undetected using our method. Therefore, the greater spine density observed in mutant animals at 1 week cannot be clearly dissociated from differences in spine shape and length observed at the same time. At 2 and 4 weeks, density is apparently normal, whereas spine length remains abnormal. However, the large variance in the density measurements might still obscure an abnormality in spine density in more mature tissue. It is important to stress that our study makes no effort to describe the absolute lengths and densities of dendritic spines; such measurements require other methods. The purpose was to detect differences between genotypes and among postnatal ages. Nonetheless we note the close agreement between the spine density measurements reported here at 4 weeks and those reported previously in a study using the Golgi method in the adult animal (Comery et al., 1997). In both of these studies, it is understood that the density values obtained are underestimates of the actual spine density.
During the first postnatal week, dendritic spines are sparsely distributed and somewhat longer than in the adult (Dailey et al., 1996;Fiala et al., 1998; Lendvai et al., 2000; the present study). Within the next 3 weeks, they increase in density and become somewhat shorter, with fewer very long protrusions. The developmental change in spine density has been described previously (Juraska and Fifkova, 1979;Juraska, 1982; Petit et al., 1988), but although it is commonly accepted that spine length decreases with postnatal age, the present study is to our knowledge the first systematic description of this phenomenon. The normal general pattern of development is followed in the FMR1 knock-out mice, but the increase in density is stunted and the decrease in length is exaggerated by the abnormal values early in postnatal life. Nevertheless, general synaptogenesis and remodeling of spines does take place in these animals, and although the abnormality is not grossly disruptive, its subtlety might point to a role for FMRP in fine adjustments of synaptic connections.
The present study also demonstrates that pyramidal neurons in vitro that are prepared from FMR1 knock-out mice do not have spines with abnormal length, density, or motility, despite the abnormalities in spine length and density in the intact brain. The absence of a comparable difference in 1-week-old neocortical cultures invites several interpretations. First, the method of transfection in the intact brain differed from that used in vitro. However, no difference in spine density was found between neurons transfectedin vitro with the Sindbis viral construct and those transfected biolistically. In addition, even if the labeling method differed, this could not explain the differences observed between genotypes. Second, neurons in organotypic cultures 1 week after the date of birth might not be comparable with neurons in the intact brain 1 week after the date of birth. Similarly, it is possible that our inability to detect a difference between mutant and wild-type animals can be attributed to the presence or absence of some factor in the culture medium. Although neurons in organotypic cultures mature roughly comparably to those in the intact brain (Caesar et al., 1989; Caeser and Schuz, 1992; Muller et al., 1993), a more subtle effect remains a possibility. Notably, a recent study in cultured hippocampal neurons failed to detect differences in spine length between mutant and wild-type animals, and instead found morphologic and electrophysiological evidence for presynaptic defects (Braun and Segal, 2000). This finding suggests the unmasking of a defect in the initial stages of synaptogenesis, which must take place in dissociated cultured neurons after plating but might not be detected in organotypic cultures, in which the vast majority of connections are already present when the culture is prepared.
The absence of an abnormal phenotype in organotypic cultures prepared from mutant mice, together with the strong developmental dependence of the abnormality in the intact brain, suggests that FMRP might not function simply to maintain dendritic spines within certain limits of density and length; its function may be coordinated with normal patterned activity. In this context, it is significant that FMRP expression is increased by afferent stimulation (Todd and Mack, 2000) and that there is evidence for local translation of FMRP in response to metabotropic glutamate receptor stimulation (Weiler and Greenough, 1993; Weiler et al., 1997). The coordination of expression with synaptic activity is consistent with a phenotype that is most severe during synaptogenesis, as shown in the present study. This raises the possibility that the function served by FMRP early in life is related to the proper establishment of synaptic connections in response to synaptic activity. If this process is disturbed by the absence of this protein, this disruption could be reflected at that time by an abnormal spine density and morphology, and later by cognitive defects resulting from improperly established connections.
To our knowledge, this is the first suggestion of a link between a developmentally restricted structural or functional abnormality and a mental retardation syndrome. This observation may have implications for genetic therapeutic approaches, because it would indicate that intervention must be administered as early as possible in brain development to avoid long-lasting abnormalities in brain function.
Footnotes
This work was supported by the FRAXA, Mather, and Pew Foundations and by National Institutes of Health Grants AA05518 and NS38259. We thank Barry J. Burbach and Karen Greenwood for expert technical assistance, Jodi Koblentz for PCR analysis, Drs. Edward Stern and Gerald Latter for statistical assistance, and Drs. Patrick R. Hof, Kristen M. Harris, Karen Zito, and Joshua Trachtenberg for helpful discussion.
Correspondence should be addressed to Esther A. Nimchinsky, Howard Hughes Medical Institute, Cold Spring Harbor Laboratory, One Bungtown Road, Cold Spring Harbor, NY 11724. E-mail: nimchins@cshl.org.
REFERENCES
- 1.Braun K, Segal M. FMRP involvement in formation of synapses among cultured hippocampal neurons. Cereb Cortex. 2000;10:1045–1052. doi: 10.1093/cercor/10.10.1045. [DOI] [PubMed] [Google Scholar]
- 2.Brown V, Small K, Lakkis L, Feng Y, Gunter C, Wilkinson KD, Warren ST (1998) Purified recombinant Fmrp exhibits selective RNA binding as an intrinsic property of the fragile X mental retardation protein. J Biol Chem 15521–15527. [DOI] [PubMed]
- 3.Caeser M, Schuz A. Maturation of neurons in neocortical slice cultures: a light and electron microscopic study on in situ and in vitro material. J Hirnforsch. 1992;33:429–443. [PubMed] [Google Scholar]
- 4.Caesar M, Bonhoeffer T, Bolz J. Cellular organization and development of slice cultures from rat visual cortex. Exp Brain Res. 1989;77:234–244. doi: 10.1007/BF00274981. [DOI] [PubMed] [Google Scholar]
- 5.Chen B, Lendvai B, Nimchinsky EA, Burbach B, Fox K, Svoboda K. Imaging high-resolution structure of GFP-expressing neurons in neocortex in vivo. Learn Mem. 2000;7:433–441. doi: 10.1101/lm.32700. [DOI] [PubMed] [Google Scholar]
- 6.Comery TA, Harris JB, Willems PJ, Oostra BA, Irwin SA, Weiler IJ, Greenough WT. Abnormal dendritic spines in fragile X knockout mice: maturation and pruning deficits. Proc Natl Acad Sci USA. 1997;94:5401–5404. doi: 10.1073/pnas.94.10.5401. [DOI] [PMC free article] [PubMed] [Google Scholar]
- 7.Dailey ME, Smith SJ. The dynamics of dendritic structure in developing hippocampal slices. J Neurosci. 1996;16:2983–2994. doi: 10.1523/JNEUROSCI.16-09-02983.1996. [DOI] [PMC free article] [PubMed] [Google Scholar]
- 8.de Vries BBA, Halley DJJ, Oostra BA, Niermejjer MF. The fragile X syndrome. J Med Genet. 1998;35:579–589. doi: 10.1136/jmg.35.7.579. [DOI] [PMC free article] [PubMed] [Google Scholar]
- 9.Devys D, Lutz Y, Rouyer N, Bellocq JP, Mandel JL. The FMR-1 protein is cytoplasmic, most abundant in neurons, and appears normal in carriers of a fragile X premutation. Nat Genet. 1993;4:335–340. doi: 10.1038/ng0893-335. [DOI] [PubMed] [Google Scholar]
- 10.Dunaevsky A, Tashiro A, Majewska A, Mason C, Yuste R. Developmental regulation of spine motility in the mammalian central nervous system. Proc Natl Acad Sci USA. 1999;96:13438–13443. doi: 10.1073/pnas.96.23.13438. [DOI] [PMC free article] [PubMed] [Google Scholar]
- 11.Dutch–Belgian Fragile X Consortium. Fmr1 knockout mice: a model to study fragile X mental retardation. Cell. 1994;78:23–33. [PubMed] [Google Scholar]
- 12.Feng Y, Gutekunst CA, Eberhart DE, Yi H, Warren ST, Hersch SM. Fragile X mental retardation protein: nucleocytoplasmic shuttling and association with somatodendritic ribosomes. J Neurosci. 1997;17:1539–1547. doi: 10.1523/JNEUROSCI.17-05-01539.1997. [DOI] [PMC free article] [PubMed] [Google Scholar]
- 13.Fiala JC, Feinberg M, Popov V, Harris KM. Synaptogenesis via dendritic filopodia in developing hippocampal area CA1. J Neurosci. 1998;18:8900–8911. doi: 10.1523/JNEUROSCI.18-21-08900.1998. [DOI] [PMC free article] [PubMed] [Google Scholar]
- 14.Hinton VJ, Brown WT, Wisniewski K, Rudelli RD. Analysis of neocortex in three males with the fragile X syndrome. Am J Med Genet. 1991;41:289–294. doi: 10.1002/ajmg.1320410306. [DOI] [PubMed] [Google Scholar]
- 15.Irwin SA, Patel B, Idupulapati M, Harris JB, Crisostomo RA, Larsen BP, Kooy F, Willems PJ, Cras P, Kozlowski PB, Swain RA, Weiler IJ, Greenough WT. Abnormal dendritic spine characteristics in the temporal and visual cortices of patients with fragile-X syndrome: a quantitative examination. Am J Med Genet. 2001;98:161–167. doi: 10.1002/1096-8628(20010115)98:2<161::aid-ajmg1025>3.0.co;2-b. [DOI] [PubMed] [Google Scholar]
- 16.Juraska JM. The development of pyramidal neurons after eye opening in the visual cortex of hooded rats: a quantitative study. J Comp Neurol. 1982;212:208–213. doi: 10.1002/cne.902120210. [DOI] [PubMed] [Google Scholar]
- 17.Juraska JM, Fifkova E. A Golgi study of the early postnatal development of the visual cortex of the hooded rat. J Comp Neurol. 1979;183:247–256. doi: 10.1002/cne.901830203. [DOI] [PubMed] [Google Scholar]
- 18.Lendvai B, Stern EA, Chen B, Svoboda K. Experience-dependent plasticity of dendritic spines in the developing rat barrel cortex in vivo. Nature. 2000;404:876–881. doi: 10.1038/35009107. [DOI] [PubMed] [Google Scholar]
- 19.Lo DC, McAllister AK, Katz LC. Neuronal transfection in brain slices using particle-mediated gene transfer. Neuron. 1994;13:1263–1268. doi: 10.1016/0896-6273(94)90412-x. [DOI] [PubMed] [Google Scholar]
- 20.Marin-Padilla M. Structural abnormalities of the cerebral cortex in human chromosomal aberrations: a Golgi study. Brain Res. 1972;44:625–629. doi: 10.1016/0006-8993(72)90324-1. [DOI] [PubMed] [Google Scholar]
- 21.Miller M. Maturation of rat visual cortex. I. A quantitative study of Golgi-impregnated pyramidal neurons. J Neurocytol. 1981;10:859–878. doi: 10.1007/BF01262658. [DOI] [PubMed] [Google Scholar]
- 22.Muller D, Buchs PA, Stoppini L. Time course of synaptic development in hippocampal organotypic cultures. Brain Res Dev Brain Res. 1993;71:93–100. doi: 10.1016/0165-3806(93)90109-n. [DOI] [PubMed] [Google Scholar]
- 23.Petit TL, LeBoutillier FC, Gregorio A, Libstug H. The pattern of dendritic development in the cerebral cortex of the rat. Brain Res Dev Brain Res. 1988;41:209–219. doi: 10.1016/0165-3806(88)90183-6. [DOI] [PubMed] [Google Scholar]
- 24.Pieretti M, Zhang F, Fu YH, Warren ST, Oostra BA, Caskey CT, Nelson DL. Absence of expression of the FMR-1 gene in fragile X syndrome. Cell. 1991;66:817–822. doi: 10.1016/0092-8674(91)90125-i. [DOI] [PubMed] [Google Scholar]
- 25.Purpura DP. Dendritic differentiation in human cerebral cortex: normal and aberrant developmental patterns. Adv Neurol. 1975;12:91–116. [PubMed] [Google Scholar]
- 26.Rudelli RD, Brown WT, Wisniewski K, Jenkins EC, Larue-Kamionowska M, Connell F, Wisniewski HM. Adult fragile X syndrome: clinico-neuropathologic findings. Acta Neuropathol. 1985;67:289–295. doi: 10.1007/BF00687814. [DOI] [PubMed] [Google Scholar]
- 27.Schapiro MB, Murphy DGM, Hagerman RJ, Azari NP, Alexander GE, Miezejeski CM, Hinton VJ, Horwitz B, Haxby JV, Kumar A, White B, Grady CL. Adult fragile X syndrome: neuropsychology, brain anatomy, and metabolism. Am J Med Genet. 1995;60:480–493. doi: 10.1002/ajmg.1320600603. [DOI] [PubMed] [Google Scholar]
- 28.Stoppini L, Buchs PA, Muller D. A simple method for organotypic cultures of nervous tissue. J Neurosci Methods. 1991;37:173–182. doi: 10.1016/0165-0270(91)90128-m. [DOI] [PubMed] [Google Scholar]
- 29.Todd PK, Mack KJ. Sensory stimulation increases cortical expression of the fragile X mental retardation protein in vivo. Mol Brain Res. 2000;80:17–25. doi: 10.1016/s0169-328x(00)00098-x. [DOI] [PubMed] [Google Scholar]
- 30.Verheij C, Bakker CE, de Graaf E, Keulemans J, Willemsen R, Verkerk AJMH, Galjaard H, Reuser AJJ, Hoogeveen AT, Oostra BA. Characterization and localization of the FMR-1 gene product associated with fragile X syndrome. Nature. 1993;363:722–724. doi: 10.1038/363722a0. [DOI] [PubMed] [Google Scholar]
- 31.Weiler IJ, Greenough WT. Metabotropic glutamate receptors trigger postsynaptic protein synthesis. Proc Natl Acad Sci USA. 1993;90:7168–7171. doi: 10.1073/pnas.90.15.7168. [DOI] [PMC free article] [PubMed] [Google Scholar]
- 32.Weiler IJ, Irwin SA, Klintsova AY, Spencer CM, Brazelton AD, Miyashiro K, Comery TA, Patel B, Eberwine J, Greenough WT. Fragile X mental retardation protein is translated near synapses in response to neurotransmitter activation. Proc Natl Acad Sci USA. 1997;94:5395–5400. doi: 10.1073/pnas.94.10.5395. [DOI] [PMC free article] [PubMed] [Google Scholar]
- 33.White EL, Weinfeld D, Lev DL. A survey of morphogenesis during the early postnatal period in PMBSF barrels of mouse Sm1 cortex with emphasis on barrel D4. Somatosens Mot Res. 1997;14:34–55. doi: 10.1080/08990229771204. [DOI] [PubMed] [Google Scholar]
- 34.Wise SP, Fleshman JW, Jones EG. Maturation of pyramidal cell form in relation to developing afferent and efferent connections of rat somatic sensory cortex. Neuroscience. 1979;4:1275–1297. doi: 10.1016/0306-4522(79)90157-x. [DOI] [PubMed] [Google Scholar]