

Abstract
The electrical characteristics of many neurons are remarkably robust in the face of changing internal and external conditions. At the same time, neurons can be highly sensitive to neuromodulators. We find correlates of this dual robustness and sensitivity in a global analysis of the structure of a conductance-based model neuron. We vary the maximal conductance parameters of the model neuron and, for each set of parameters tested, characterize the activity pattern generated by the cell as silent, tonically firing, or bursting. Within the parameter space of the five maximal conductances of the model, we find directions, representing concerted changes in multiple conductances, along which the basic pattern of neural activity does not change. In other directions, relatively small concurrent changes in a few conductances can induce transitions between these activity patterns. The global structure of the conductance-space maps implies that neuromodulators that alter a sensitive set of conductances will have powerful, and possibly state-dependent, effects. Other modulators that may have no direct impact on the activity of the neuron may nevertheless change the effects of such direct modulators via this state dependence. Some of the results and predictions arising from the model studies are replicated and verified in recordings of stomatogastric ganglion neurons using the dynamic clamp.
Keywords: stomatogastric ganglion, bursting neuron, dynamic clamp, conductance-based model, parameter space, neuromodulator
Neurons can maintain relatively constant response characteristics despite variable levels of channel expression. Recent work has shown that measured K+ conductance densities vary twofold to fourfold across identified neurons of the same class in the crab stomatogastric ganglion (STG), despite their apparent similarities in function (Liu et al., 1998; Golowasch et al., 1999a). In other systems, genetic deletions of specific channels have resulted in surprisingly unchanged phenotypes (Namkung et al., 1998; Wickman et al., 1998;Akopian et al., 1999; Brickley et al., 2001), suggesting that the effects of altered channel expression may be compensated for by other channels (Liu et al., 1998; Namkung et al., 1998; MacLean and Harris-Warrick, 2000; Brickley et al., 2001). At the same time, many neurons are highly sensitive to conductance changes caused by neuromodulators (Harris-Warrick and Marder, 1991; Levitan, 1994). We now study how robustness of neuronal properties can coexist with susceptibility to modulation and analyze how these two features interact.
We use two complementary approaches to address these issues. First, we examine the behavior of a model neuron with five voltage- and time-dependent conductances. This model neuron can be silent, fire tonically, or fire in bursts. We map the global structure of the model and discover that the maximal conductances that generate specific types of activity lie in adjacent slab-shaped regions. The activity of the model is sensitive to changes that move the maximal conductances perpendicular to region boundaries but is relatively insensitive to changes that run parallel to the boundaries. Second, we use the dynamic clamp (Sharp et al., 1993a,b) to compare these observations with results recorded from neurons in the crab stomatogastric ganglion.
Our study is based on a global analysis of the activity state of a neuron as a function of its underlying maximal conductances (Foster et al., 1993). This approach represents the effects of modulators and other regulatory processes as flows or deformations of entire regions of parameter space rather than as changes of a single set of conductances. Bifurcation analysis provides an alternative approach (Canavier et al., 1991, 1994; Guckenheimer et al., 1993, 1997), but it is unlikely that all of the transitions between the activity patterns we study would be found by a traditional mathematical bifurcation analysis. Furthermore, our approach allows us to use a functional biological criterion for distinguishing different types of activity.
The structure of the maps of conductance space that we construct for both biological and model neurons illustrates how neurons with highly variable densities of ionic conductances can produce stable firing activity and maintain robust responses to important modulatory and regulatory influences. At the same time, the structures of the maps provide a heuristic explanation of state-dependent modulation, that is, the finding that the same modulator may have widely different effects on neuronal activity when applied to the same preparation, even if the starting pattern of neuronal activity appears to be quite similar. They also reveal that a modulator that has no direct effect on the activity of a neuron can nevertheless modify the actions of other modulators, acting as a modulator of modulators. More generally, the maps suggest a functional division of modulators into three broad classes: modulators that change the firing state of the neuron by affecting intrinsic conductances previously active before neuromodulation, modulators that activate voltage-dependent conductances de novo, and modulators that have little direct impact on activity patterns but that alter the effects of other modulators.
MATERIALS AND METHODS
Electrophysiology. Experimental methodology follows that described previously (Golowasch et al., 1999a). Ventricular dilator (VD) and inferior cardiac (IC) neurons of the crab Cancer borealis STG were synaptically isolated from most of their presynaptic inputs by adding 10−5m picrotoxin to crab physiological saline. Intracellular recordings were made with sharp microelectrodes in two-electrode current clamp. The dynamic clamp (Sharp et al., 1993a,b) was used to add and subtract one or two modeled conductances from a neuron. We used software developed by Yair Manor, Farzan Nadim, and Bill Miller using LabWindows/CVI and an AT-MIO-16E-2 data acquisition board (National Instruments). The dynamic clamp calculates the amount of current produced by a modeled conductance at the membrane potential V of the neuron, measured in real time. The calculated current is injected back into the cell via a current-passing electrode in current clamp. Thus, the dynamic clamp can be used to simulate changes in conductance resulting from the application of modulators or drugs and can be used to assess the effect of altering the amount of a given conductance in a biological neuron.
Despite the fact that the electrical activity of STG neurons is determined primarily by active conductances located in the region of the primary neurite, dynamic-clamp modification of activity can be accomplished quite effectively with electrodes located in the soma.Sharp et al. (1993a,b) have shown that the effects of neuromodulators and neurotransmitters known to act at nonsomatic sites are well mimicked by dynamic-clamp somatic injections of conductances. The electrolytes that enter or leave the cells in a dynamic-clamp experiment are those in the microelectrode, not necessarily those of the mimicked conductance. For example, a dynamic-clamp-duplicatedICa is only a Ca2+ current to the extent that it hasICa-like voltage dependence and kinetics. Likewise, a mimicked IKCa is not truly Ca2+ dependent but is modeled as a voltage-dependent current with kinetics and voltage dependence resembling those of the biologicalIKCa. These currents are all described by equations of the form:
with the relevant parameters given in Table1. Erevis −80 mV for the K+ currents, +70 mV forICa, and −10 mV forIProc. The parameters describing the kinetics of IKCa andIA are based on fits made to the corresponding currents in cells of the same class but in separate crab STG preparations. The fitting routine used decomposes the currents into both transient and persistent (noninactivating) components, in contrast to the fits used in the model that describe IAwith a single transient component andIKCa with a single persistent component (see Model neuron).
Table 1.
Voltage-dependent activation (m∞), inactivation (h∞), time constant of activation (τm), and time constant of inactivation (τh) of the ionic currents used in the dynamic-clamp experiments1-a
| p | q | m∞ | h∞ | τm | τh | |
|---|---|---|---|---|---|---|
| ICa | 3 | 1 | 1/[1 + exp((V + 35)/−12)] | 1/[1 + exp((V + 40)/30)] | 7.0 + 0.4/[1 + exp(−(V + 70)/−13)] | 90 |
| IA−t | 1 | 1 | 1/[1 + exp((V + 23)/−13)] | 1/[1 + exp((V + 62)/7)] | 11.0 + 8.0/[1 + exp(−(V − 70)/15)] | 6.0 + 40.0/[1 + exp(−(V + 55)/18)] |
| IA−p | 1 | 0 | 1/[1 + exp((V − 12)/−11)] | 6.0 | ||
| IKCa−t | 1 | 1 | 1/[1 + exp((V + 10)/−1)] | 1/[1 + exp((V + 36)/8)] | 43.0 + 12.0/[1 + exp(−(V − 10)/−4)] | 95.0 + 33.0/[1 + exp(−(V − 36)/22)] |
| IKCa−p | 1 | 0 | 1/[1 + exp((V − 2)/−9)] | 13.0 + 8.0/[1 + exp(−(V − 1)/1)] | ||
| IProc | 1 | 0 | 1/[1 + exp((V + 57)/−5)] | 6.0 |
IA and IKCa have a transient (IA−t andIKCa−t) and a persistent (IA−p andIKCa−p) component. Voltages are given in mV, and times are given in milliseconds.
See Figures 4-6.
Model neuron. Membrane currents are described in Liu et al. (1998). The kinetics and voltage dependence of the conductances contributing to these currents are based on measurements of crustacean STG neurons (Turrigiano et al., 1995). In our model, we have fixed the ratio of the maximal conductances of the fast and slow Ca2+ currents [CaT and CaS in Liu et al. (1998)] at 5:4. Values reported here are for the fast component only. Maximal conductances were varied over a wide range, either by choosing conductance values on a grid of points (see Figs. 2c,3b, 6, 7) or by randomly choosing values over a similar but continuous range (see Figs. 2d, 3a). The range of values used was the following: gmaxNa, 0–800 mS/cm2;gmaxCa, 0–5 mS/cm2; gmaxA, 0–75 mS/cm2;gmaxKCa, 0–300 mS/cm2; andgmaxKd, 0–200 mS/cm2. For runs on the grid, seven points equally spaced from each other and from the endpoints were chosen for each conductance. For runs over a continuous range, values were chosen from a uniform distribution over the above ranges for each conductance. Buffering of Ca2+ (used in computingIKCa) follows the linear kinetics model of Liu et al. (1998) but with a longer buffering time constant of 200 msec. This choice, as well as the omission ofIh, typically resulted in a slower rhythm than that in the model of Liu et al. (1998).
Fig. 2.

Differences of maximum conductances as indicators of the state of activity of a neuron. a, Activity of model neurons with similar frequency and action potentials per burst is generated with gmaxCa,gmaxA, andgmaxKCa currents that differ by 1.4-, 7.0-, and 7.0-fold, respectively (inset histograms). b, VaryinggmaxCa, gmaxA, and gmaxKCa only slightly in two other model neurons (1.25-, 1.2-, and 1.0-fold, respectively;inset histograms) induces dramatic changes in the pattern of activity (bursting, top; tonic activity,bottom). gmaxNa = 600 mS/cm2, and gmaxKd = 50 mS/cm2 in all model neurons shown ina and b. c, States of activity observed when all five conductances are varied. Thewidths of the blue, red, and olive annuli are proportional to the percentage of silent, tonic, and bursting cells observed, respectively, as the three conductances shown (gmaxA,gmaxCa, andgmaxNa) are held at the specified values indicated in the graph while the other two (gmaxKCa andgmaxKd) are varied over the ranges 37.5–262.5 and 25–175 mS/cm2, respectively. Theblack arrow represents the direction of least sensitivity, and the green arrow indicates the direction of highest sensitivity to maximum conductance changes.d, The number of spikes per burst produced by the model neurons as a function of three maximal ionic conductance densities. The number of spikes per burst is indicated as follows:black, 0; blue, 1; green, 2; olive, 3; orange, 4; and dark red, 5. Specification of gmaxA,gmaxCa, andgmaxKCa leads to a strong separation of the neurons with two or more spikes per burst into particular regions of the parameter space but reveals little about the organization of the zero- and one-spike bursters. The difference insymbolsizes is for ease of visualization only. In a and b in this figure, and in the following figures, Ca*50 andA*5 indicate that the values forgmaxCa and gmaxA have been multiplied by 50 and 5, respectively.
Fig. 3.

Dependence of activity on individual or subsets of conductances. a, States of activity observed when all five conductances are varied randomly over a continuous range. The resulting values of each conductance are reported individually (circles, mean values; error bars, SDs). For almost any given value of any single conductance, all three activity states (silent, tonic, and bursting) are observed. b, States of activity observed when the three K+ conductances (gmaxA,gmaxKCa, andgmaxKd) are held fixed at the values given by the centers of each point in the plot while the two inward conductances are varied over the ranges 100–700 mS/cm2 (gmaxNa) and 0.625–4.375 mS/cm2(gmaxCa). In b, thewidths of the blue, red, and olive annuli are proportional to the percentage of silent, tonic, and bursting cells observed, respectively, with the three conductances shown held at the specified values while the other two are varied over the indicated ranges.
Fig. 6.

Effect of dynamic-clamp-injected conductances on the parameter space structure of a neuron.a, Activity states of a (biological) VD neuron as a function of gmaxCa andgmaxA (blue, silent;red, tonic; olive, bursting). Data were comparable in three other experiments and correspond to neurons different from that in Figure 4. Top, Control.Bottom, Same as top but in the presence of dynamic-clamp-added proctolin-activated current (gmaxProc = 10 nS).Labels 1 and 2 highlightpoints that in control conditions (top) lie at the border of the tonic-bursting regions but that in proctolin are both within the tonic region of activity. b, Activity states of the model neuron as a function ofgmaxCa and gmaxA,gmaxNa = 200 mS/cm2;gmaxKCa = 150 mS/cm2; gmaxKd = 150 mS/cm2. Top, Control.Bottom, Same as top but with the proctolin-activated current included at a fixed maximum conductance (gmaxProc = 0.0025 mS/cm2). c, Activity states of the model neuron when gmaxA,gmaxCa, andgmaxNa are held fixed whilegmaxKCa andgmaxKd are varied over the ranges 37.5–262.5 and 25–175 mS/cm2, respectively, andgmaxProc is fixed at 0.0025 mS/cm2. The widths of theblue, red, and oliveannuli are proportional to the percentage of silent, tonic, and bursting cells observed, respectively, with the three conductances shown held at the specified values while the other two are varied over the indicated ranges. Note the broader tonic (red) region when compared with that in Figure 2c in which the proctolin current is absent.
Fig. 7.

Regulation of activity in biological neurons in culture. a, Superimposed data from Figure2c and from Turrigiano et al. (1995). Peak current densities (nA/nF) ICa,INa, andIA of STG cultured neurons (Turrigiano et al., 1995) change as the neurons change their states of activity in a progression of silent to tonic to bursting during the 3–4 d in culture subsequent to enzymatic and mechanical dissociation (yellow points). We assume that the values ofgmaxCa, gmaxNa, and gmaxA are proportional to the values ofICa,INa, andIA of these cultured neurons and normalize the mean values of the maximal conductances so that the normalized value of the tonic cells lies near the center of mass of the tonic region (red) in the model. The other twopoints occur automatically in the corresponding silent and bursting regions. b, State dependence of modulatory action. Background, Same as Figure5a. Foreground, A group of similarly functioning cells represented by an orange rectangle aligned with the insensitive direction. A modulator that moves cells (orange rectangles) along the insensitive direction (black arrow) has no effect on activity by itself. However, a comodulator (green arrows) acting along the sensitive direction has a very different effect (bursting to tonic vs bursting to silent) when in the presence of the first modulator.
Classification of the states of activity. Neurons were classified as silent, tonic, or bursting depending on their efficacy in causing transmission at a simulated STG synapse with graded (i.e., voltage-dependent) neurotransmitter release (Manor et al., 1997). Synaptic output was calculated from a simple model synapse in which the amount of transmitter released T is assumed to be proportional to the presynaptic voltage difference above a transmission threshold voltage, Vth = −40 mV, with saturation of the transmission for all voltages above Vsat = −15 mV. With this definition, the transmitter output can be calculated from a voltage trace by first truncating the trace at Vsat and then computing the area that lies above Vth, according to the following:
Here, the maximum function performs a thresholding operation, setting the value of the integrand to zero when its second argument is negative. The reported synaptic output is this total transmission divided by the number of transmission events, andtmax is 20 sec. We define a transmission event as an isolated action potential, cluster of action potentials, or, in the case of nonspiking cells, voltage oscillation that exceeds the transmission threshold. We calculate the number of spikes per cluster from the interspike interval (ISI) distribution according to the formula:
Separation of activity regions. To analyze the structure of the different regions of activity in the full five-dimensional parameter space, we found the four-dimensional hyperplanes, a × g*max = b, that best separated any two states from one another. Here,g*max is a five-dimensional vector containing the five voltage-dependent maximal conductances, rescaled (normalized and made dimensionless) so that the center of the range of maximal conductance values studied (ranges; see Model neuron) is set equal to the vector {1, 1, 1, 1, 1}. a is a vector of coefficients that define the unit vector perpendicular to the four-dimensional hyperplane, and b is a constant that defines the offset of the plane from the origin along the direction of this unit vector. Because a points perpendicular to the plane, it identifies the direction that most sensitively (i.e., shortest distance in this conductance parameter space) moves a cell from one state to another. We used a numerical optimization technique [downhill simplex method (Press et al., 1997)] to find the values ofa and b that maximized the planar separability between any two activity states. We define the planar separabilityS between state A and state B as the average percentage of A and B points that lie on their own sides of the plane:
where sides 1 and 2 are chosen so that S is ≥0.5.S = 0.5 for completely randomly arranged or otherwise completely linearly inseparable data. S = 1 when the points are perfectly separable by a plane.
RESULTS
Patterns of activity and maximal conductance map for the model neuron
We used a single-compartment model based on measurements from cultured lobster STG neurons (Turrigiano et al., 1995) and described inLiu et al. (1998). This model includes a voltage-independent leak current (Ileak) and five voltage-dependent ionic currents (fast Na+,INa; delayed rectifier K+, IKd; combined fast and slow transient Ca2+,ICa; Ca2+-dependent K+, IKCa; and fast transient K+,IA). We systematically varied the maximum conductances of the five voltage-dependent currents while leaving constant all other parameters of the model and characterized each “neuron” (the term we use to denote each set of specific values of the maximal conductance parameters of the model) by its state of activity as silent, tonically firing, or bursting.
Figure 1 shows examples of the different activity states produced by the model. Neurons were labeled as silent if their voltage remained constant over time [Fig. 1a,top (first) trace]. To distinguish between tonic firing and single-spike bursting (Fig.1a, compare second, fourth traces), we calculated the output from a synapse with graded neurotransmitter release (Manor et al., 1997) driven by the model neuron (Materials and Methods). This allows a separation of the two activity patterns because single-spike bursters release more neurotransmitter than do neurons firing tonically because of their slow-wave depolarization (Fig.1b).
Fig. 1.
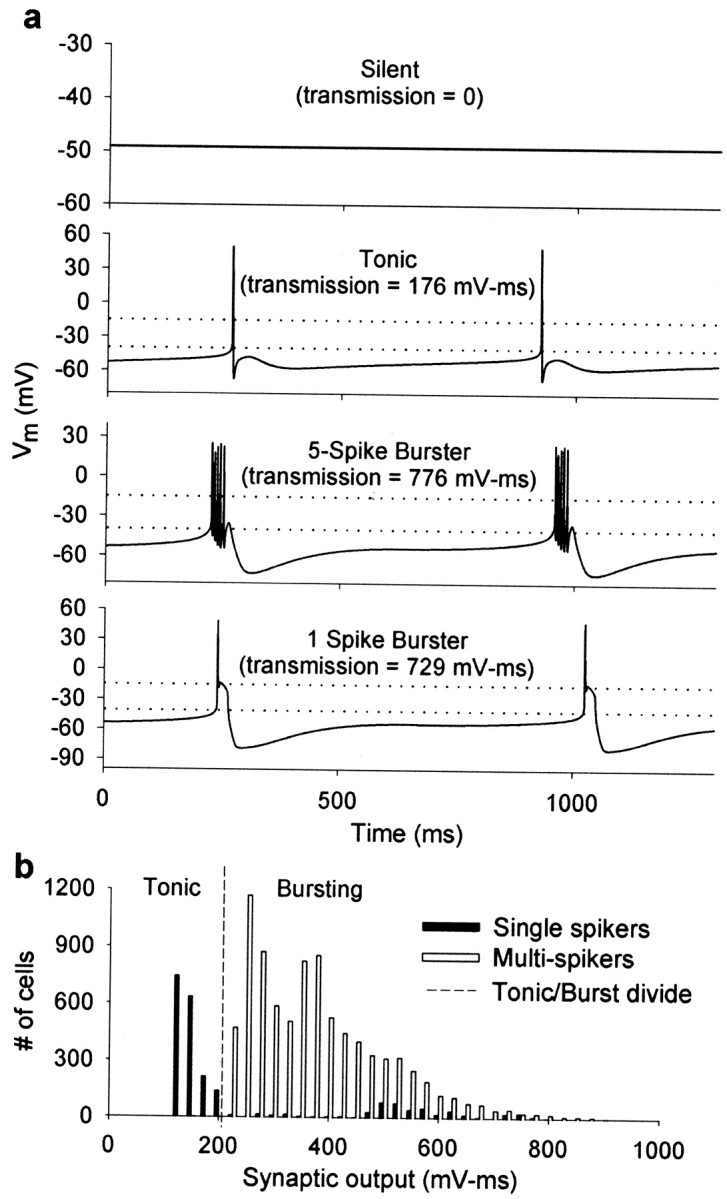
Model-neuron patterns of activity.a, Patterns of activity characteristic of the multiconductance model used in this study. Notice that a neuron firing a single action potential per burst (fourth panelfrom top) could be confused with a tonically firing neuron (second panel) if no other criterion is used. To separate these cases we use the measure of graded synaptic output illustrated in b. Dotted horizontal lines indicate the values Vth = −40 mV and Vsat = −15 mV used in calculating the measure of graded synaptic output (Materials and Methods). b, Distribution of neurons as a function of the graded synaptic output measure. Notice that neurons firing single action potentials (dark bars) occur in two clusters: low measure (corresponding to tonically firing cells) and high measure (corresponding to cells firing single-action-potential bursts). Neurons with multiple action potentials (bursters) all have high synaptic transmission measure. The tonic/bursting divide is 210 mV–msec.
Figure 2a shows voltage traces from two model neurons. Both are bursters with three spikes per burst and an ∼1 Hz burst rate. Despite this similarity in activity, the neuron in the top trace has a 1.4× largergmaxCa, a 7.0× largergmaxA, and a 7.0× smallergmaxKCa than does the neuron in thebottom trace (Fig. 2a, insets) and the same values of gmaxNa andgmaxKd. In contrast, much smaller differences in those same conductances can be found in neurons that display quite different patterns of activity (Fig. 2b). The neuron in the top trace has a 1.25× largergmaxCa, a 1.2× smallergmaxA, and the same values ofgmaxNa,gmaxKd, andgmaxKCa as does the neuron in thebottom trace (Fig. 2b, insets). Despite this relatively small difference in maximal conductances, thetop neuron is a 1.05 Hz burster with two spikes per burst, whereas the bottom neuron is a 0.64 Hz tonically firing neuron.
The activity pattern of the model neuron is not uniquely determined by the value of any single one of the three maximal conductances shown in Figure 2, a and b. Fairly large changes in any one of them can be made with no appreciable change in activity, whereas more modest correlated changes in all three can significantly modify activity. Because the other two maximal conductancesgmaxNa and gmaxKd remain constant, they are not shown on these plots. Figure2c shows that the activity patterns are well separated whengmaxNa,gmaxCa, andgmaxA are all specified together. Specification of these three conductances gives a global picture of the structure of the multidimensional parameter space underlying the activity patterns of the neuron. The three different activity patterns are distributed in approximately parallel or slightly wedge-shaped regions in this three-dimensional maximum conductance space. This clearly reveals an insensitive direction, along which large changes in conductance produce relatively little change in activity (Fig. 2c, black arrow) as is the case in Figure2a, and a sensitive direction, along which small changes in conductance can evoke significant changes in activity (Fig.2c, green arrow) as illustrated in Figure2b.
To characterize the contribution of each voltage-dependent conductance to the activity of the cell, we found the four-dimensional hyperplanes that best separated the different regions of activity from one another (Materials and Methods). Changes along the directions normal to these planes most sensitively modify the activity state of the neuron, whereas changes along directions parallel to the planes tend to leave the neuron in the same state. The plane that best divides silent from tonic activity has a unit normal vector a ≡ {aNa, aCa,aA, aKCa,aKd} = {0.22, 0.73, −0.64, −0.01, −0.10} and is offset from the origin by −0.02 along the normal direction. Dividing activity on the basis of this plane predicts the activity of each type of cell (silent or tonic) with 95.3% accuracy (i.e., S = 95.3; see Materials and Methods). Likewise, 96.0% of tonic and bursting cells are on their respective majority sides of the plane with a unit normal vector {0.08, 0.84, −0.50, −0.05, −0.17} and offset 0.17 along the normal direction. In summary, activity regions are divided by planar boundaries, with a specific combination of oppositely directed changes ofgmaxCa and gmaxA affecting the pattern of activity of the neuron most strongly.gmaxNa is the next most important conductance in separating silent from tonic regions, andgmaxKd is the next most important conductance in separating tonic from bursting regions. AlthoughgmaxCa andgmaxA are the most critical conductances for determining the overall activity patterns,gmaxNa,gmaxKd, andgmaxKCa are very important in determining other firing properties. For instance,gmaxNa andgmaxKd together enable bursting cells to fire clusters of action potentials, andgmaxKCa plays a significant role in determining the number of action potentials per burst in those clusters (Fig.2d) and in setting the bursting rate (Goldman et al., 2000).
Whereas the plot of gmaxNa,gmaxCa, andgmaxA reveals a clear global map of the activity states of the neuron, individually these conductances cannot predict the state of activity of the neuron. Figure3a shows the distribution of maximum conductance values for each current in all of the model neurons in each activity class. This plot shows that all three types of activity can be obtained with both low and high values of each conductance. Although different states of activity exhibit different mean values for each maximum conductance (shown on Fig. 3a), the variances around these means overlap so extensively that the pattern of activity cannot be predicted by knowing the values of any single conductance.
From the above hyperplane analysis, it is clear that the state of activity of the neuron cannot be identified by observing any single conductance or an arbitrary set of three conductances. Figure3b shows the activity states of the neurons as a function of the three K+ conductances. There is a large region in the center of this figure in which the same values of these three conductances (with different values ofgmaxNa and gmaxCa) produce cells with tonic, silent, or bursting behavior. Thus, although the three conductances plotted in Figure 2c reveal the global structure of the activity patterns relatively well, this structure is missed when a different set of three conductances is considered.
Patterns of activity and maximal conductance map for STG neurons
The maximal conductances of identified STG neurons can vary severalfold with little apparent change in activity (Liu et al., 1998;Golowasch et al., 1999a). We tested the sensitivity of crab STG neurons to modifications of the values of different membrane conductances by using the dynamic clamp to add and subtract conductances. We altered the conductances of ICa andIA using currents with kinetics based on voltage-clamp measurements in the same neuron type in other preparations (J. Golowasch, unpublished observations; but parameters for one such case are listed in Table 1). All of the neurons had a qualitatively similar map structure, as illustrated in the examples below.
When isolated pharmacologically from the rest of the network, the VD neuron shown in Figure 4 was intrinsically silent. Figure 4a shows voltagetraces from this VD neuron whengmaxCa andgmaxA were changed as indicated to theright of the traces. Note that traces 2 and 3 correspond to quite different values of these two conductances but show similar activity patterns. The same observation applies to traces 1 and 5. On the other hand, relatively modest changes in these conductances betweentraces 3, 4, and 5 modified activity from tonic firing (trace 3) to bursting (trace 4) and silence (trace 5). Figure 4bshows that changes in gmaxKCa did not move this same cell in or out of the bursting mode but modified the number of spikes per burst.
Fig. 4.

Effect of dynamic-clamp-injected conductances on the activity of a pharmacologically isolated VD neuron.a, Different levels of gmaxCa and gmaxA (shown in columnsat right) injected in dynamic-clamp mode. TheA current is made up of two components, one transient and one persistent. gmaxA of the transient component is shown in the right-hand column; the sustained component had a gmax that was one-fourth the transient component. Traces 1, 5, Silent activity; traces 2, 3, tonic activity;trace 4, bursting activity. The horizontal bar under trace 4 is 1 sec and applies only totrace 4. b, Different levels ofgmaxKCa (column atright) injected into a VD neuron (cell different from that in a). A constant level ofgmaxCa (+200 nS) was applied to induce bursting throughout. Although the number of action potentials per burst changes severalfold (compare top, bottom traces), bursting activity is maintained, and the bursting frequency changes only 19% between the highest (top trace, 1.88 Hz) and the lowest (bottom trace, 1.52 Hz) frequency.Arrows indicate −50 mV. Parameters used for dynamic-clamped conductances are given in Table 1.
Figure 5 illustrates more fully the sensitivity to modifications in gmaxA andgmaxCa by showing a map of the regions of parameter space where an IC neuron was silent (blue points), tonically active (red points), or bursting (olive points). The structure of the map, which is similar to that of the model neuron, reveals that the intrinsic activity of the neuron is more sensitive to changes in conductance in some directions and relatively insensitive to changes in other directions, as drawn on the map. The form of the map for this IC neuron is similar to that obtained for VD neurons and cultured STG neurons (see below), so it appears that this general structure may be common for many STG neurons.
Fig. 5.
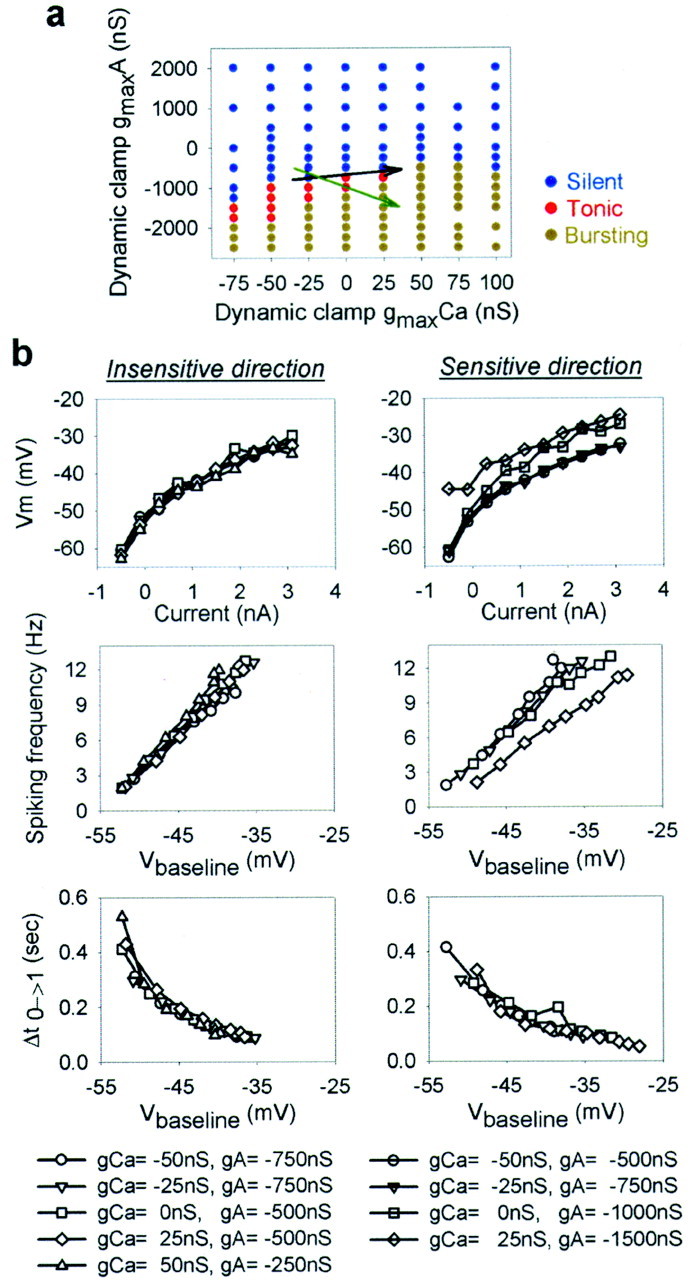
Effect of dynamic-clamp-injected conductances on the parameter space structure of a neuron. a, Activity states of a (biological) IC neuron as a function ofgmaxCa andgmaxA injected with dynamic clamp (blue, silent; red, tonic;olive, bursting). The end andtip of the black arrow indicate the start and end of movement, respectively, induced with the dynamic clamp along the insensitive direction; the end andtip of the green arrow indicate the start and end of movement, respectively, induced along a more sensitive direction. Negative conductance values denote removal of the corresponding conductance from the cell with the dynamic clamp.b, Effect of moving along the insensitive direction (left column) or sensitive direction (right column) in the map in a on the current-versus-voltage relationship (top row), spiking frequency versus membrane potential (middle row), and delay to first spike (after a 2 sec hyperpolarizing current pulse to −90 mV) versus membrane potential (bottom row). Vm is the voltage measured at the approximate steady state between two well separated action potentials at the end of the current-clamp pulse. Vbaseline was manipulated in current clamp and is defined as the average of the minimum voltages between the first three action potentials.
Figure 5a (colored map) shows the regions of parameter space in which the neuron was silent, tonically active, or bursting. Some other measures of intrinsic electrical properties show the same sensitive and insensitive directions in parameter space. Figure 5b shows three different measures of the intrinsic properties of the neuron: the baseline membrane potential Vm, the spiking frequency, and the time to the first action potential after a hyperpolarizing pulse to −90 mV. Note that all three of these measures of intrinsic membrane potentials are virtually unchanged by significant changes of conductance in an insensitive direction (Fig. 5a, black arrow), whereas Vm and the spike frequency, but not the recovery time, were affected by changes in conductance along the sensitive direction (Fig. 5a, green arrow).
Effects of neuromodulation
Many neuromodulatory substances present in the STG activate bursting or cause silent neurons to fire tonically (Harris-Warrick and Flamm, 1987; Hooper and Marder, 1987; Elson and Selverston, 1992;Weimann et al., 1993, 1997; Bal et al., 1994; Swensen and Marder, 2000). The existence of sensitive combinations of conductances in both model and biological neurons suggests that, to be most effective, neuromodulators should modify existing conductances along sensitive directions or activate new conductances that move activity boundaries in directions normal to their surfaces. The neuropeptide proctolin is of the second type. It activates a voltage-dependent inward current that has been measured previously (Golowasch and Marder, 1992) and modeled (Buchholtz et al., 1992; Golowasch et al., 1992). Recent work (Swensen and Marder, 2000) has shown that several other neuromodulators activate this same current. Therefore, we studied the effects of the proctolin current both in real neurons and in the model to see the changes it produces in the shape of the maps.
Figure 6a, top, shows the activity map obtained when we used the dynamic clamp to inject various levels of ICa andIA into a VD neuron. Note that the general structure of this map is similar to that of the IC neuron shown previously. We then constructed the same map in the presence of a small proctolin conductance injected with the dynamic clamp (Fig.6a, bottom; Materials and Methods) (Golowasch and Marder, 1992). The proctolin conductance increased the size of the tonically active region within the map. Note that a neuron sitting atpoint 2 in this map would be silent in the absence of proctolin and would fire tonically in the presence of proctolin.
To allow a direct comparison of the data on the effects of proctolin in the biological neurons with those of the model, we show a two-dimensional slice of Figure 2c withgmaxNa fixed at 200 mS/cm2 and bothgmaxKd andgmaxKCa fixed at 150 mS/cm2 (Fig. 6b,top). When the proctolin current is added to the model (Fig.6b, bottom), the tonic firing wedge widens (as it did in the VD neuron shown in Fig. 6a). Moreover, both the VD and the model neuron show a sensitive direction (top leftto bottom right) along which small perturbations can produce marked changes in activity, whereas even large changes along the less sensitive direction (bottom left to top right) show much less effect.
In both the model and the biological neuron, proctolin primarily preserves the planar shape of the boundaries and the sensitivity to the direction corresponding to opposing changes ofgmaxCa andgmaxA. The main difference from the effect of proctolin on the biological VD neuron is that the expansion in the model neuron is much larger in the direction of silent activity. This expansion reflects an increased sensitivity togmaxNa, indicated by thegmaxNa component of the unit normal vector increasing from 0.22 to 0.49, with only minor effects on the other currents. This can be seen in Figure 6c, which shows the global shift of the regions shown in Figure 2c when proctolin is applied at the same level as in Figure 6b(compare with Fig. 2c).
Our model is based on measurements of ionic currents in dissociated STG neurons in culture (Turrigiano et al., 1995). In those experiments, the states of activity and ionic currents of dissociated STG neuronal somata were measured as they developed as isolated neurons in culture. After 1 d in culture, most (76%) neurons responded to constant-current injection with a few rapidly inactivating spikes leading to a silent state. After 2 d, 62% responded with tonic firing. After 3–4 d, 67% of cells responded with bursting activity. Figure 7a shows the three states of activity as a function of their maximal conductances. In constructing this graph, we have centered the mean maximum conductances of ICa,IA, and INa of the tonically firing STG cultured cells near the center of mass of the tonic activity region of our model. Assuming that the maximal conductances change by the same percentage as the measured currents, this automatically places the other two points in the corresponding regions of silent or bursting activity. More specifically, in this case, where real neurons appear to modify their maximum conductances as a result of intrinsically programmed regulatory cascades, they appear to move approximately along the sensitive directions dividing silent from tonic and tonic from bursting regions (Fig. 7a,yellow arrows). This is the most effective path to take in the sense that it allows the changes in the activity of the neuron to occur with the smallest modifications of its conductances.
DISCUSSION
This paper is an attempt to reconcile two apparently contradictory observations. First, individual neurons of the same class that show very similar patterns of activity may nonetheless show a severalfold variability in their current densities (Liu et al., 1998; Golowasch et al., 1999a). Second, neuromodulators that increase or decrease a given conductance only 20–30% may produce significant changes in intrinsic excitability (see, for example, Guckenheimer et al., 1993). Moreover, some modulators produce dramatic changes in excitability with very small currents (Golowasch and Marder, 1992; Swensen and Marder, 2000).
Sensitive and insensitive directions
The global structure revealed by the activity maps we have constructed indicates that the pattern of firing of a neuron can be insensitive to variability in the levels of expression of individual conductances along certain directions in the maximal conductance parameter space while being highly sensitive to changes along other directions. Insensitive directions might account for the high degree of variability found in measurements of identified neurons (Liu et al., 1998; Golowasch et al., 1999a; Goldman et al., 2000; cf. Beer et al., 1999; Chiel et al., 1999). Sensitive directions would be effective targets of both neuromodulation and activity-dependent homeostatic processes (LeMasson et al., 1993; Siegel et al., 1994; Liu et al., 1998; Desai et al., 1999; Golowasch et al., 1999b).
Different electrical characteristics may be controlled by different combinations of conductances, so that insensitive directions for some firing properties may correspond to sensitive directions for other properties. In both the model cell and the STG neurons we studied, ICa and IA are critical in determining the overall pattern of activity of a neuron, whereas IKCa, for example, has little influence on the separation of silent, tonic, and bursting regions of firing but considerable influence on activity patterns within the bursting region (Figs. 2d, 4b) (Goldman et al., 2000). Indeed, previous work has shown that an activity-dependent feedback mechanism that regulates the pattern of activity, rather than directly regulating channel densities, could control different electrical characteristics of the neuron by regulating sets of conductances that our analysis now shows correspond to the sensitive directions for these characteristics [Liu et al. (1998), their Table 1].
Conductances targeted during development and by neuromodulators
It has been proposed previously that, to facilitate their response to neuromodulatory substances, neurons that are subject to modulation reside near the borders that separate regions of different activity (Guckenheimer et al., 1993). An extension of this suggestion is that neuromodulators target the sensitive directions we have found in the maximal conductance parameter space and that neurons lie close enough to the borders to remain sensitive to neuromodulation yet far enough from the borders to be insulated from “noisy” fluctuations that could push them across regional borders in the absence of neuromodulation. In some cases, multiple conductances are modulated by a single substance (Baxter and Byrne, 1991; Kiehn and Harris-Warrick, 1992; Harris-Warrick et al., 1995a,b; Kloppenburg et al., 1999), and other modulators are coreleased and therefore may together target multiple conductances. Similarly, during periods when the intrinsic properties of neurons are developmentally regulated (Ribera and Spitzer, 1992, 1998; Spitzer, 1994; Gurantz et al., 1996, 2000; Spitzer and Ribera, 1998), neurons may follow the paths that correspond to the directions of maximum sensitivity. For example, the changes in the maximum conductances of STG neurons over time in dissociated cell culture (Turrigiano and Marder, 1993; Turrigiano et al., 1994, 1995) appear to proceed approximately along the direction of maximum sensitivity revealed by our model (Fig. 7a).
State-dependent modulation
Our studies suggest that neuromodulators might be divided into three broad classes. One class consists of neuromodulators that affect the intrinsic conductances previously active in the neuron before neuromodulation. In the STG, amine neuromodulators appear to play this role, changing existing voltage-dependent ionic currents, such asIA, IKCa, andIh (Kiehn and Harris-Warrick, 1992;Harris-Warrick et al., 1995a,b; Kloppenburg et al., 1999). The change in these currents may be represented on our activity maps as moving a neuron from one set of maximal conductance parameters to another (we restrict our discussion to maximal conductances, but more generally the maps could include other conductance parameters that are changed by neuromodulators). If the movement induced by the neuromodulator causes the maximal conductance parameters to cross a boundary, the neuron will change its pattern of firing activity. The structure of the global maps we described makes it clear why such modulators can display hidden “state dependence,” that is, can have different effects when applied to neurons with apparently similar initial patterns of activity. For example, a modulator that acts in a sensitive direction might move many of the neurons from a bursting to a silent region, while taking another group of neurons from a bursting to a tonic region (groups of neurons, Fig. 7b,orange rectangles; movement of neurons, Fig. 7b, green arrows).
A second class of modulators, represented by peptide modulators in the STG (Golowasch and Marder, 1992; Swensen and Marder, 2000), activates voltage-dependent conductances de novo. The effect of these modulators is to add a new dimension to the activity maps. When viewed in terms of the maps of the five conductances that are active in the absence of modulation, this class of modulators changes the structure of the activity regions within the maximal conductance space rather than moving specific points that represent individual neurons. For example, in the experiment shown in Figure 6, proctolin expanded the region of tonic activity by shifting the edge between silent and tonic states. Neural activity is modified in this case if an activity boundary sweeps across the point representing a given neuron.
Finally, a third class, like the first class of modulators, might change existing conductances, but in an insensitive rather than in a sensitive direction. These would have little direct impact on activity patterns but would alter the effects of the first and second classes of modulators via state-dependent effects (Fig. 7b, black arrow). A neuromodulator belonging to this third class would thus act as a modulator of other modulators.
Neuronal models are global maps, not points in parameter space
The experimental observation of wide variability in the conductances of real neurons (Liu et al., 1998; Golowasch et al., 1999a), in tandem with our results, has implications for the construction and application of conductance-based models. If individual neurons are in a region of parameter space in which their intrinsic activity is relatively insensitive to changes in some sets of conductances, it is more appropriate to think of the “model” as the entire region, rather than as any one “representative” point within this region (Foster et al., 1993). In fact, even the point representing the average values of all the maximal conductances within a region, a natural choice for a representative neuron, may fail to reproduce the behavior of the neurons from which it is derived if its parameters are outside the region for which it is the average (Foster et al., 1993;Beer et al., 1999) (J. Golowasch, M. S. Goldman, L. F. Abbott, and E. Marder, unpublished observations).
Implications for genetic knock-outs
The consideration of the global dependence of the firing behavior of a neuron on its conductances is important for understanding the complexities that can arise when channel expression is genetically altered (Namkung et al., 1998; Wickman et al., 1998; Akopian et al., 1999; MacLean and Harris-Warrick, 2000; Brickley et al., 2001). Depending on the global maps for the neurons being studied, it is possible that a given deletion may produce relatively little change in the activity of the neuron if the deletion is accompanied by compensatory changes in channel expression that, together with the deletion, cause a movement along an insensitive direction of the parameter space. However, effects of the deletion could become apparent if the deletion causes the neuron to move into a different region of neuromodulatory response such as was discussed in the context of state-dependent effects above (Fig. 7b, black arrow).
Implications for regulation of activity
Neuronal activity is remarkably robust despite ongoing channel turnover. The structure of the global maps suggests how stable firing properties and variable conductances may naturally coexist in a system with activity-dependent regulation. A process that regulates its activity patterns rather than individual conductances would not be triggered by channel fluctuations occurring along insensitive directions but would strongly respond to fluctuations along sensitive directions. As a result, neurons would be expected to exist within regions of the conductance parameter space that are narrow along the sensitive direction but elongated along the insensitive direction (Fig.7b, orange rectangles). If sensitive directions in the maximal conductance space are both the targets of neuromodulation and subject to activity-dependent regulation, a neuron can be both plastic and stable. As long as fluctuations in conductance along insensitive directions remain shorter than the length of the boundaries between two elongated regions, a neuron will not only have similar firing properties throughout the regions but will also respond in a similar manner to neuromodulators acting along sensitive directions (Fig. 7b, green arrows). In this manner, a neuron may be tolerant of wide fluctuations in some conductance combinations while remaining robustly sensitive to much smaller changes in other, targeted combinations.
Footnotes
This work was supported by National Institutes of Health Grant MH46742, National Science Foundation Grant IBN-9817194, the Sloan Center for Theoretical Neurobiology at Brandeis University, and the W. M. Keck Foundation.
Correspondence should be addressed to Dr. Mark Goldman, Department of Brain and Cognitive Sciences, Massachusetts Institute of Technology, E25-210, 45 Carleton Street, Cambridge, MA 02139. E-mail:mark_g@mit.edu.
J. Golowasch's present address: Department of Biological Sciences, Rutgers University, Newark, NJ 07102.
REFERENCES
- 1.Akopian AN, Souslova V, England S, Okuse K, Ogata N, Ure J, Smith A, Kerr BJ, McMahon SB, Boyce S, Hill R, Stanfa LC, Dickenson AH, Wood JN. The tetrodotoxin-resistant sodium channel SNS has a specialized function in pain pathways. Nat Neurosci. 1999;2:541–548. doi: 10.1038/9195. [DOI] [PubMed] [Google Scholar]
- 2.Bal T, Nagy F, Moulins M. Muscarinic modulation of a pattern-generating network: control of neuronal properties. J Neurosci. 1994;14:3019–3035. doi: 10.1523/JNEUROSCI.14-05-03019.1994. [DOI] [PMC free article] [PubMed] [Google Scholar]
- 3.Baxter DA, Byrne JH. Ionic conductance mechanisms contributing to the electrophysiological properties of neurons. Curr Opin Neurobiol. 1991;1:105–112. doi: 10.1016/0959-4388(91)90017-2. [DOI] [PubMed] [Google Scholar]
- 4.Beer RD, Chiel HJ, Gallagher JC. Evolution and analysis of model CPGs for walking. II. General principles and individual variability. J Comput Neurosci. 1999;7:119–147. doi: 10.1023/a:1008920021246. [DOI] [PubMed] [Google Scholar]
- 5.Brickley SG, Revilla V, Cull-Candy SG, Wisden W, Farrant M. Adaptive regulation of neuronal excitability by a voltage-independent potassium conductance. Nature. 2001;409:88–92. doi: 10.1038/35051086. [DOI] [PubMed] [Google Scholar]
- 6.Buchholtz F, Golowasch J, Epstein IR, Marder E. Mathematical model of an identified stomatogastric ganglion neuron. J Neurophysiol. 1992;67:332–340. doi: 10.1152/jn.1992.67.2.332. [DOI] [PubMed] [Google Scholar]
- 7.Canavier CC, Clark JW, Byrne JH. Simulation of the bursting activity of neuron R15 in Aplysia: role of ionic currents, calcium balance, and modulatory transmitters. J Neurophysiol. 1991;66:2107–2124. doi: 10.1152/jn.1991.66.6.2107. [DOI] [PubMed] [Google Scholar]
- 8.Canavier CC, Baxter DA, Clark JW, Byrne JH. Multiple modes of activity in a model neuron suggest a novel mechanism for the effects of neuromodulators. J Neurophysiol. 1994;72:872–882. doi: 10.1152/jn.1994.72.2.872. [DOI] [PubMed] [Google Scholar]
- 9.Chiel HJ, Beer RD, Gallagher JC. Evolution and analysis of model CPGs for walking. I. Dynamical modules. J Comput Neurosci. 1999;7:99–118. doi: 10.1023/a:1008923704408. [DOI] [PubMed] [Google Scholar]
- 10.Desai NS, Rutherford LC, Turrigiano GG. Plasticity in the intrinsic excitability of cortical pyramidal neurons. Nat Neurosci. 1999;2:515–520. doi: 10.1038/9165. [DOI] [PubMed] [Google Scholar]
- 11.Elson RC, Selverston AI. Mechanisms of gastric rhythm generation in isolated stomatogastric ganglion of spiny lobsters: bursting pacemaker potentials, synaptic interactions and muscarinic modulation. J Neurophysiol. 1992;68:890–907. doi: 10.1152/jn.1992.68.3.890. [DOI] [PubMed] [Google Scholar]
- 12.Foster WR, Ungar LH, Schwaber JS. Significance of conductances in Hodgkin-Huxley models. J Neurophysiol. 1993;70:2502–2518. doi: 10.1152/jn.1993.70.6.2502. [DOI] [PubMed] [Google Scholar]
- 13.Goldman MS, Golowasch J, Marder E, Abbott LF. Dependence of firing pattern on intrinsic ionic conductances: sensitive and insensitive combinations. Neurocomputing. 2000;32–33:141–146. [Google Scholar]
- 14.Golowasch J, Marder E. Proctolin activates an inward current whose voltage dependence is modified by extracellular Ca2+. J Neurosci. 1992;12:810–817. doi: 10.1523/JNEUROSCI.12-03-00810.1992. [DOI] [PMC free article] [PubMed] [Google Scholar]
- 15.Golowasch J, Buchholtz F, Epstein IR, Marder E. Contribution of individual ionic currents to activity of a model stomatogastric ganglion neuron. J Neurophysiol. 1992;67:341–349. doi: 10.1152/jn.1992.67.2.341. [DOI] [PubMed] [Google Scholar]
- 16.Golowasch J, Abbott LF, Marder E. Activity-dependent regulation of ionic currents in an identified neuron of the stomatogastric ganglion of the crab Cancer borealis. J Neurosci. 1999a;19:RC33. doi: 10.1523/JNEUROSCI.19-20-j0004.1999. [DOI] [PMC free article] [PubMed] [Google Scholar]
- 17.Golowasch J, Casey M, Abbott LF, Marder E. Network stability from activity-dependent regulation of neuronal conductances. Neural Comput. 1999b;11:1079–1096. doi: 10.1162/089976699300016359. [DOI] [PubMed] [Google Scholar]
- 18.Guckenheimer J, Gueron S, Harris-Warrick RM. Mapping the dynamics of a bursting neuron. Philos Trans R Soc Lond [Biol] 1993;341:345–359. doi: 10.1098/rstb.1993.0121. [DOI] [PubMed] [Google Scholar]
- 19.Guckenheimer J, Harris-Warrick R, Peck J, Willms A. Bifurcation, bursting, and spike frequency adaptation. J Comput Neurosci. 1997;4:257–277. doi: 10.1023/a:1008871803040. [DOI] [PubMed] [Google Scholar]
- 20.Gurantz D, Ribera AB, Spitzer NC. Temporal regulation of Shaker- and Shab-like potassium channel gene expression in single embryonic spinal neurons during K+ current development. J Neurosci. 1996;16:3287–3295. doi: 10.1523/JNEUROSCI.16-10-03287.1996. [DOI] [PMC free article] [PubMed] [Google Scholar]
- 21.Gurantz D, Lautermilch NJ, Watt SD, Spitzer NC. Sustained upregulation in embryonic spinal neurons of a Kv3.1 potassium channel gene encoding a delayed rectifier current. J Neurobiol. 2000;42:347–356. [PubMed] [Google Scholar]
- 22.Harris-Warrick RM, Flamm RE. Multiple mechanisms of bursting in a conditional bursting neuron. J Neurosci. 1987;7:2113–2128. doi: 10.1523/JNEUROSCI.07-07-02113.1987. [DOI] [PMC free article] [PubMed] [Google Scholar]
- 23.Harris-Warrick RM, Marder E. Modulation of neural networks for behavior. Annu Rev Neurosci. 1991;14:39–57. doi: 10.1146/annurev.ne.14.030191.000351. [DOI] [PubMed] [Google Scholar]
- 24.Harris-Warrick RM, Coniglio LM, Barazangi N, Guckenheimer J, Gueron S. Dopamine modulation of transient potassium current evokes phase shifts in a central pattern generator network. J Neurosci. 1995a;15:342–358. doi: 10.1523/JNEUROSCI.15-01-00342.1995. [DOI] [PMC free article] [PubMed] [Google Scholar]
- 25.Harris-Warrick RM, Coniglio LM, Levini RM, Gueron S, Guckenheimer J. Dopamine modulation of two subthreshold currents produces phase shifts in activity of an identified motoneuron. J Neurophysiol. 1995b;74:1404–1420. doi: 10.1152/jn.1995.74.4.1404. [DOI] [PubMed] [Google Scholar]
- 26.Hooper SL, Marder E. Modulation of the lobster pyloric rhythm by the peptide proctolin. J Neurosci. 1987;7:2097–2112. doi: 10.1523/JNEUROSCI.07-07-02097.1987. [DOI] [PMC free article] [PubMed] [Google Scholar]
- 27.Kiehn O, Harris-Warrick RM. 5-HT modulation of hyperpolarization-activated inward current and calcium-dependent outward current in a crustacean motor neuron. J Neurophysiol. 1992;68:496–508. doi: 10.1152/jn.1992.68.2.496. [DOI] [PubMed] [Google Scholar]
- 28.Kloppenburg P, Levini RM, Harris-Warrick RM. Dopamine modulates two potassium currents and inhibits the intrinsic firing properties of an identified motor neuron in a central pattern generator network. J Neurophysiol. 1999;81:29–38. doi: 10.1152/jn.1999.81.1.29. [DOI] [PubMed] [Google Scholar]
- 29.LeMasson G, Marder E, Abbott LF. Activity-dependent regulation of conductances in model neurons. Science. 1993;259:1915–1917. doi: 10.1126/science.8456317. [DOI] [PubMed] [Google Scholar]
- 30.Levitan IB. Modulation of ion channels by protein phosphorylation and dephosphorylation. Annu Rev Physiol. 1994;56:193–212. doi: 10.1146/annurev.ph.56.030194.001205. [DOI] [PubMed] [Google Scholar]
- 31.Liu Z, Golowasch J, Marder E, Abbott LF. A model neuron with activity-dependent conductances regulated by multiple calcium sensors. J Neurosci. 1998;18:2309–2320. doi: 10.1523/JNEUROSCI.18-07-02309.1998. [DOI] [PMC free article] [PubMed] [Google Scholar]
- 32.MacLean JN, Harris-Warrick RM. Accommodation of neuronal intrinsic properties in response to over-expression of a K+ channel. Soc Neurosci Abstr. 2000;26:1579. [Google Scholar]
- 33.Manor Y, Nadim F, Abbott LF, Marder E. Temporal dynamics of graded synaptic transmission in the lobster stomatogastric ganglion. J Neurosci. 1997;17:5610–5621. doi: 10.1523/JNEUROSCI.17-14-05610.1997. [DOI] [PMC free article] [PubMed] [Google Scholar]
- 34.Namkung Y, Smith SM, Lee SB, Skrypnyk NV, Kim HL, Chin H, Scheller RH, Tsien RW, Shin HS. Targeted disruption of the Ca2+ channel β3 subunit reduces N- and L-type Ca2+ channel activity and alters the voltage-dependent activation of P/Q-type Ca2+ channels in neurons. Proc Natl Acad Sci USA. 1998;95:12010–12015. doi: 10.1073/pnas.95.20.12010. [DOI] [PMC free article] [PubMed] [Google Scholar]
- 35.Press WH, Teukolsky SA, Vetterling WT, Flannery BP. Numerical recipes in C: the art of scientific programming, 2nd edition. Cambridge UP; New York: 1997. [Google Scholar]
- 36.Ribera AB, Spitzer NC. Developmental regulation of potassium channels and the impact on neuronal differentiation. Ion Channels. 1992;3:1–38. doi: 10.1007/978-1-4615-3328-3_1. [DOI] [PubMed] [Google Scholar]
- 37.Ribera AB, Spitzer NC. Development of electrical excitability: mechanisms and roles. J Neurobiol. 1998;37:1–2. [PubMed] [Google Scholar]
- 38.Sharp AA, O'Neil MB, Abbott LF, Marder E. Dynamic clamp: computer-generated conductances in real neurons. J Neurophysiol. 1993a;69:992–995. doi: 10.1152/jn.1993.69.3.992. [DOI] [PubMed] [Google Scholar]
- 39.Sharp AA, O'Neil MB, Abbott LF, Marder E. The dynamic clamp: artificial conductances in biological neurons. Trends Neurosci. 1993b;16:389–394. doi: 10.1016/0166-2236(93)90004-6. [DOI] [PubMed] [Google Scholar]
- 40.Siegel M, Marder E, Abbott LF. Activity-dependent current distributions in model neurons. Proc Natl Acad Sci USA. 1994;91:11308–11312. doi: 10.1073/pnas.91.24.11308. [DOI] [PMC free article] [PubMed] [Google Scholar]
- 41.Spitzer NC. Development of voltage-dependent and ligand-gated channels in excitable membranes. Prog Brain Res. 1994;102:169–179. doi: 10.1016/S0079-6123(08)60538-5. [DOI] [PubMed] [Google Scholar]
- 42.Spitzer NC, Ribera AB. Development of electrical excitability in embryonic neurons: mechanisms and roles. J Neurobiol. 1998;37:190–197. [PubMed] [Google Scholar]
- 43.Swensen AM, Marder E. Multiple peptides converge to activate the same voltage-dependent current in a central pattern generating circuit. J Neurosci. 2000;20:6752–6759. doi: 10.1523/JNEUROSCI.20-18-06752.2000. [DOI] [PMC free article] [PubMed] [Google Scholar]
- 44.Turrigiano G, Abbott LF, Marder E. Activity-dependent changes in the intrinsic properties of cultured neurons. Science. 1994;264:974–977. doi: 10.1126/science.8178157. [DOI] [PubMed] [Google Scholar]
- 45.Turrigiano GG, Marder E. Modulation of identified stomatogastric ganglion neurons in primary cell culture. J Neurophysiol. 1993;69:1993–2002. doi: 10.1152/jn.1993.69.6.1993. [DOI] [PubMed] [Google Scholar]
- 46.Turrigiano GG, LeMasson G, Marder E. Selective regulation of current densities underlies spontaneous changes in the activity of cultured neurons. J Neurosci. 1995;15:3640–3652. doi: 10.1523/JNEUROSCI.15-05-03640.1995. [DOI] [PMC free article] [PubMed] [Google Scholar]
- 47.Weimann JM, Marder E, Evans B, Calabrese RL. The effects of SDRNFLRFamide and TNRNFLRFamide on the motor patterns of the stomatogastric ganglion of the crab Cancer borealis. J Exp Biol. 1993;181:1–26. doi: 10.1242/jeb.181.1.1. [DOI] [PubMed] [Google Scholar]
- 48.Weimann JM, Skiebe P, Heinzel H-G, Soto C, Kopell N, Jorge-Rivera JC, Marder E. Modulation of oscillator interactions in the crab stomatogastric ganglion by crustacean cardioactive peptide. J Neurosci. 1997;17:1748–1760. doi: 10.1523/JNEUROSCI.17-05-01748.1997. [DOI] [PMC free article] [PubMed] [Google Scholar]
- 49.Wickman K, Nemec J, Gendler SJ, Clapham DE. Abnormal heart rate regulation in GIRK4 knockout mice. Neuron. 1998;20:103–114. doi: 10.1016/s0896-6273(00)80438-9. [DOI] [PubMed] [Google Scholar]