Abstract
Using the mitochondrial membrane potential (ΔΨm)-sensitive fluorescent dyes 5,5′,6,6′-tetrachloro-1,1′,3,3′-tetraethylbenzimidazolocarbocyanine iodide (JC-1) and tetramethylrhodamine methyl ester (TMRM), we have observed spontaneous changes in the ΔΨm of cultured forebrain neurons. These fluctuations in ΔΨm appear to represent partial, transient depolarizations of individual mitochondria. The frequency of these ΔΨmfluctuations can be significantly lowered by exposure to a photo-induced oxidant burden, an ATP synthase inhibitor, or a glutamate-induced sodium load, without changing overall JC-1 fluorescence intensity. These spontaneous fluctuations in JC-1 signal were not inhibited by altering plasma membrane activity with tetrodotoxin or MK-801 or by blocking the mitochondrial permeability transition pore (PTP) with cyclosporin A. Neurons loaded with TMRM showed similar, low-amplitude, spontaneous fluctuations in ΔΨm. We hypothesize that these ΔΨmfluctuations are dependent on the proper functioning of the mitochondria and reflect mitochondria alternating between the active and inactive states of oxidative phosphorylation.
Keywords: mitochondria, membrane potential, ATP, JC-1, TMRM, F1FO ATPase
Mitochondria have been implicated in excitotoxic injury pathways, as well as injury mechanisms manifested as apoptotic or necrotic death processes. The mitochondrial membrane potential (ΔΨm) has often been used as a marker for mitochondrial activity and neuronal viability during the various cell death cascades (for review, see Kroemer et al., 1998;Nicholls and Ward, 2000). Injurious stimuli, leading to either excitotoxicity or apoptosis, can lead to profound depolarization of ΔΨm resulting from abnormalities in neuronal processes, including alterations in intracellular calcium dynamics and the opening of the mitochondrial permeability transition pore (PTP) (Ankarcrona et al., 1995; Nieminen et al., 1996; Schinder et al., 1996;White and Reynolds, 1996; Vergun et al., 1999; Budd et al., 2000). Although a loss of ΔΨm may be linked to various inducers of cell death, these are observed as large and possibly catastrophic changes in mitochondrial function.
Mitochondria under physiological conditions also play active roles in the maintenance of normal cellular functioning. A key feature of mitochondria that allows them to participate in cell survival is proton pumping across the impermeable inner membrane. This generates an electrochemical gradient, composed of ΔΨm and ΔpH, which is used for ATP synthesis, ADP–ATP exchange, uptake of respiratory substrates and inorganic phosphate, transport of K+, Na+, and anions to regulate volume, and regulation of protons to control heat production (for review, see Bernardi, 1999). Mitochondria also play protective roles by buffering cells against high concentrations of calcium (Budd and Nicholls, 1996; White and Reynolds, 1997; Stout et al., 1998) and sequestering proapoptotic agents, such as cytochrome c (for review, see Green and Reed, 1998; Desagher and Martinou, 2000). Compared with the catastrophic changes in acute injury states, healthy mitochondria may exhibit smaller functional changes in ion transport, ATP production or consumption, volume, and permeability, all of which may impact ΔΨm, to optimize the balance between the need for respiration and ATP synthesis and the production of free radicals (Nicholls and Budd, 2000). In the present experiments, the physiological activity of mitochondria has been assessed using ΔΨm-sensitive fluorescent dyes. These dyes exhibit exceptional sensitivity to small changes in ΔΨm (Ward et al., 2000) and offer the opportunity to study subtle activities inherent in mitochondria.
Several laboratories have reported fluctuations in ΔΨm in isolated mitochondria (Ichas et al., 1997; Huser and Blatter, 1999), cardiomyocytes (Duchen et al., 1998), neuroblastoma (Loew et al., 1994; Fall and Bennett, 1999), vascular endothelial (Huser and Blatter, 1999), and pancreatic B-cells (Krippeit-Drews et al., 2000). We report here that spontaneous, low-amplitude changes in the ΔΨm occur in neuronal mitochondria. The widespread occurrence of these spontaneous fluctuations have prompted us to hypothesize that mitochondria exhibit partial, transient depolarizations that represent an inherent physiological function of mitochondria thus far undescribed in neurons. A significant role for the functional state of mitochondria in these fluctuations in ΔΨm is discussed.
MATERIALS AND METHODS
Cell culture
All procedures were in strict accordance with the NIH Guide for the Care and Use of Laboratory Animals and were approved by the Institutional Animal Care and Use Committee of the University of Pittsburgh. Primary forebrain neurons were prepared as described previously (White and Reynolds, 1995). Briefly, forebrains from embryonic day 17 Sprague Dawley rats were removed and dissociated. Cells were plated on poly-d-lysine-coated 31 mm glass coverslips at a density of 450,000 per milliliter (1.5 ml/coverslip) and inverted after 24 hr to decrease glial growth. Experiments were performed when cells were 12–14 d in culture.
Solutions
Coverslips were perfused with HBSS containing (in mm): 137 NaCl, 5 KCl, 10 NaHCO3, 20 HEPES, 5.5 glucose, 0.6 KH2PO4, 0.6 Na2HPO4, 1.4 CaCl2, and 0.9 MgSO4, pH adjusted to 7.4 with NaOH. (+)-5-Methyl-10,11-dihydro-5H-dibenzo [a,d] cyclohepten-5,10-imine maleate (MK-801) (10 mm stock in dH2O) was purchased from Research Biochemicals (Natick, MA), cyclosporin A (20 mmstock in methanol) from Calbiochem (San Diego, CA), kainic acid (10 mm stock in dH2O), oligomycin (10 mm stock in ethanol), andp-(trifluoromethoxy)phenylhydrazone (FCCP) (750 μm in methanol) from Sigma (St. Louis, MO), and tetrodotoxin (TTX) (200 mm stock in dH2O) from Alomone Labs (Jerusalem, Israel). Tetramethylrhodamine methyl ester (TMRM) and 5,5′,6,6′-tetrachloro-1,1′,3,3′-tetraethylbenzimidazolocarbocyanine iodide (JC-1) were purchased from Molecular Probes (Eugene, OR).
Fluorescence imaging
Coverslips were mounted on a BX50WI Olympus Optical (Tokyo, Japan) light microscope fitted with an Olympus Optical LUMPlanFI 60× water immersion quartz objective. All recordings were made at room temperature while cells were perfused with 10 ml/min HBSS (alone or containing various drugs, as described below). Imaging was performed using a 75 W xenon lamp-based monochromator light source (T.I.L.L. Photonics GmbH, Martinsried, Germany), and light was detected using a CCD camera (Orca; Hamamatsu, Shizouka, Japan). Data acquisition was controlled using Simple PCI software (Compix, Cranberry, PA). For JC-1 (see below), cells were illuminated with a 485 ± 12 nm light (incident light is attenuated with neutral density filters; Omega Optical, Brattleboro, VT), and emitted fluorescence was passed through 500 nm long-pass dichroic mirror. The aggregate signal was obtained using a 605/55 nm filter, and the monomer signal was collected using a 535/25 nm filter. For TMRM (see below), cells were illuminated with a 550 ± 12 nm light, emitted fluorescence was passed through a 570 nm long-pass dichroic mirror, and the single emission signal was obtained using a 605/55 nm filter. An image was collected every 5 sec for the duration of the 10 min experiment.
JC-1. Coverslips were incubated for 20 min at 37°C with a 3 μm JC-1 and then rinsed in HBSS for 15 min at room temperature. Coverslips were mounted on the microscope and perfused with HBSS. A region of cell processes (adjacent to healthy cell bodies) was chosen, and a differential interference contrast image of this field was digitally captured. Mitochondria within neuronal processes, but not cell bodies, were used in these analyses because the dimensions of these processes are such that the movement of mitochondria is constrained to the x–y plane (noz-plane depth) and mitochondrial movement is readily observable.
The length of time cells were illuminated was minimized and kept constant across coverslips. The coverslip was briefly illuminated with 485 nm light, an image of the aggregate signal was captured, and the monomer signal was focused. The coverslip was then left unilluminated for 3 min while the dye reequilibrated (after light exposure). For post-treated coverslips, basal fluorescence was recorded for 4 min, followed by a 5 min drug exposure and a 1 min recovery. Data were collected from neurons from at least four separate culture dates (except for BAPTA experiments, in which two culture dates were tested).
TMRM. Optimal conditions for TMRM were observed when cells were loaded for 30 min with 200 nm TMRM in HBSS and perfused with 20 nm TMRM during the experiment. At this concentration of TMRM, the dye that accumulates in the mitochondria becomes quenched and a depolarization leads to an increase in fluorescence (Ward et al., 2000). The TMRM experiments were identical to those with JC-1, except that cells were not exposed to light before the initiation of the experiment because TMRM does not appear to reequilibrate after light exposure as JC-1 does.
Data analysis
A 640 × 512 pixel field of neuronal processes was imaged, and a “mask” that identified regions of interest (ROIs) that correlated with the expected number, appearance, and distribution of mitochondria within these neuronal processes was generated. The mask was made using a single JC-1 aggregate image taken before the initiation of the monomer imaging or from a stacking of TMRM images. The mask isolated individual spots of fluorescence that had a fluorescence intensity indicative of physiological ΔΨm and were more than eight contiguous pixels. Cell bodies present in the imaged field were excluded from the mask to prevent analysis of mitochondrial clusters often observed within these regions. Using the fluorescence images from these dyes, ∼1000 ROIs per field were detected. The ROIs generated from the punctate JC-1 aggregate signal were transferred onto the diffuse JC-1 monomer signal, and the fluorescence intensity within each individual ROI was analyzed over time. TMRM, unlike JC-1, is a single wavelength dye that has nonfluorescent, quenching aggregates. Thus, to locate mitochondria, fluorescent images collected during the 10 min experiment were stacked, and a mask was generated based on the brightest spots of fluorescence. ROIs were further qualified based on size, as they were with JC-1 (more than eight pixels, not within cell bodies).
The differences in the techniques used to identify mitochondria with JC-1 and TMRM were useful in determining whether mitochondrial motility was a significant factor in the assessment of ΔΨm fluctuations. With JC-1, mitochondrial location was identified only at the onset of the experiment, a percentage of mitochondria moved during the experiment (for review, seeOverly et al., 1996), and a decrease in the number of ΔΨm fluctuations was observed. This decrease was at least partially attributable to mitochondria moving out of the defined ROI. Using an image-stacking procedure to identify mitochondria in TMRM-loaded cells, the number of mitochondria was overestimated because the same mitochondrion could be identified at more than one location. With TMRM, we corrected for mitochondrial motility (there was no decrease in the number of fluctuations) but, in turn, underestimated the number of fluctuations occurring per 1000 ROIs. By using both dyes, we were thus able to determine the overall pattern of spontaneous ΔΨm fluctuations.
The fluorescence intensity data from each ROI were analyzed separately, allowing us to determine ΔΨm in individual mitochondria within cultured neuronal processes and measure changes in that ΔΨm over the course of 10 min. Several mathematical criteria were set to detect the spontaneous fluctuations in mitochondrial fluorescence intensity. The first criterion was set to determine whether the changes in the raw fluorescence values exceeded basal fluctuations. Preliminary data suggested that inherent variability within the system accounted for fluorescent fluctuations of 4 units or less. Therefore, the first criterion was that changes in raw fluorescence between two sequential images (taken 5 sec apart) were >4 fluorescent units. The second criterion for detection of a spontaneous ΔΨm fluctuation was that the slope of the fluorescence change had to be >0.3 fluorescent units per second for both the rise and fall of the fluctuation. The slope was determined using a moving average of three sequential images. This criterion was set to distinguish fluctuations from changes in basal fluorescence attributable to photo-oxidation, focus drifts, debris in the field temporarily impeding fluorescence detection, or other spurious changes in signal. Using these two criteria, preliminary analysis showed substantial correspondence between the observation of changes in fluorescence (on the computer screen) and the statistical detection of a spontaneous ΔΨm fluctuation.
The number of a spontaneous ΔΨm fluctuation detected in a field of neuronal processes was determined and normalized as the number of spontaneous ΔΨm fluctuations occurring per minute per 1000 ROIs. Data were graphed as either the percentage of fluctuations in a drug-treated field versus an untreated control field (for pretreatment experiments) or as a ratio of the number of spontaneous ΔΨm fluctuations per minute per 1000 ROIs before versus after drug treatment (for post-treatment experiments). Presentation of a ratio was chosen because, as a result of mitochondrial motility, all JC-1-loaded neuronal fields analyzed showed a decreasing number of fluctuations with time. For the post-treatment experiments, the number of fluctuations occurring per minute per 1000 ROIs was counted, and the average of minutes 2–4 (baseline) and minutes 6–8 (treatment) were calculated. This corrected for any instability in the baseline at the onset of the experiment and allowed treatment effects to stabilize for 2 min before analysis. Data from controls and individual drug treatments were averaged across coverslip and culture date and statistically compared using a t test or ANOVA.
To distinguish between long-term, global mitochondrial depolarizations and the spontaneous, small-amplitude fluctuations in ΔΨm, the average fluorescence intensity in all mitochondria in a field of neurons was calculated. This enabled us to determine whether there was an association between average ΔΨm and the occurrence of spontaneous fluctuations. Average fluorescence intensity (in arbitrary units) is presented for all pharmacological experiments.
RESULTS
Under physiological conditions, mitochondria located within cultured neuronal processes exhibit a great deal of spontaneous activity, including repetitive, small-amplitude depolarizations. Our previous measurements of ΔΨm were limited in both spatial and temporal resolution (White and Reynolds, 1996; Scanlon and Reynolds, 1998), and thus these phenomena were undetected. Using the wide-field imaging system described here, we captured images at 0.2 Hz with resolution adequate to monitor signals from neuronal processes. Replaying these images at a rate of 6 Hz revealed some unappreciated dynamics in the dye signal. Mitochondria traverse several tens of micrometers and, more surprisingly, exhibit extensive spontaneous alterations in dye signal consistent with depolarization of ΔΨm over the period of the experiment. With real-time imaging (0.2 Hz), fluctuations in ΔΨm could occasionally be observed; however, on playback (6 Hz), this phenomenon was observed throughout the field of neurons during the entirety of the experiment.
Figure 1 illustrates the spontaneous ΔΨm fluctuations in JC-1-loaded (Fig. 1A) and TMRM-loaded (Fig. 1B) neurons. This figure shows small regions of fluorescence (arrowheads) within untreated neuronal processes that appear to be spontaneously increasing and decreasing in intensity. We were unable to determine whether there was a propagation of this signal down a process, although this did not appear to be the case. The fluctuations in fluorescence within individual mitochondria appear independent, and no wave-like activity was noted. Movies of JC-1- and TMRM-loaded neurons illustrating this phenomenon are included in the supplemental data section located in the on-line version of this article. For details of these movies, see the legend for Figure1.
Fig. 1.
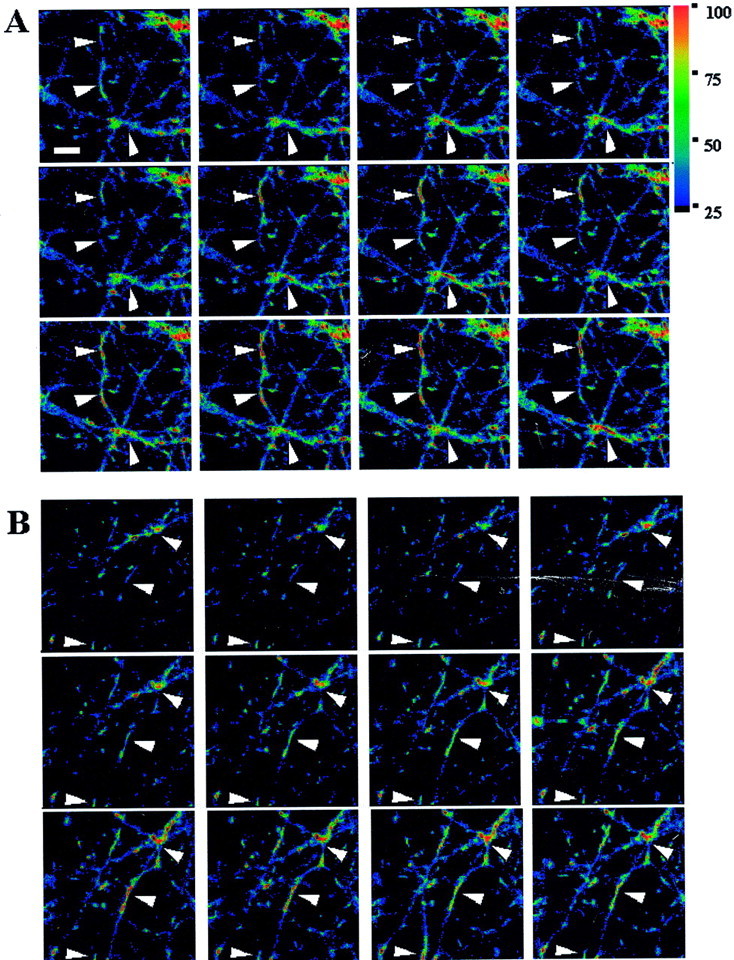
Representative fluorescent images of ΔΨm fluctuations. A, JC-1-loaded neuronal processes. B, TMRM-loaded processes. Thesepanels show spontaneous changes in fluorescent intensity occurring in small regions of neuronal processes. Images show a 200 × 200 pixel field. Images were taken 30 sec apart.Arrowheads identify examples of regions of fluorescence that correspond to the expected size and shape of neuronal mitochondria and show readily observed fluctuations in intensity. Increases in fluorescence imply depolarization. TMRM-loaded cells have lower basal fluorescence because light levels were kept low to avoid light-induced increase in fluorescence. Scale bar, 10 μm. Movie files corresponding to JC-1-loaded (A) and TMRM-loaded (B) neurons have been included in the supplemental data section located in the on-line version of this article. Movie images were taken 5 sec apart, and time is shown in minutes and seconds. Both spontaneous fluctuations and dye intensity and mitochondrial motility are evident.
Measurement of spontaneous ΔΨm fluctuations
To provide a quantitative analysis of this phenomenon, we developed a technique for identifying individual mitochondria within a field of neuronal cell bodies and processes (Fig.2). The majority of the data presented were collected using the potentiometric dye JC-1, although qualitatively similar results were obtained with TMRM. JC-1 was preferred for these experiments because its aggregates accumulate within the mitochondria based on ΔΨm and are fluorescent. This allowed us to use the aggregate fluorescent signal to locate individual mitochondria and the monomer signal to detect changes in ΔΨm. A loss of ΔΨm results in an increase in JC-1 monomer fluorescence in the regions in and around the mitochondria.
Fig. 2.
Imaging technique used to measure spontaneous changes in mitochondrial membrane potential using JC-1.A, Bright-field image, using differential interference contrast. The arrow shows a healthy neuronal cell body with processes within a field of neurites. B–Erepresent fluorescent images from this same field. B, The JC-1 aggregate image. Note the punctate nature of the label within the processes. C, The mask (red) created to discern ROIs thought to correspond to mitochondria. The bright fluorescent spots observed with the JC-1 aggregate image (same as B, now white) are detected using image analysis software based on size criteria. Regions uniformly labeled (e.g., cell bodies) are excluded from the mask based on size.D, The JC-1 monomer image. Note the diffuse nature of the label within the processes. E, The “overlay.” The mask generated in C (red) is overlaid onto the JC-1 monomer image from D(green). Scale bar, 20 μm.
A differential interference contrast image was taken (Fig.2A), followed by a single fluorescent image of the JC-1 aggregate signal (Fig. 2B). We then isolated each individual fluorescent area and identified it as an ROI depicting what is likely to be a single mitochondrion (Fig. 2C). Because of the thickness of the cell bodies and the wide-field microscopy used, it was difficult to distinguish individual mitochondria within the soma. This is evidenced by the large regions of aggregate fluorescence present in the cell body (arrowhead), most likely resulting from numerous mitochondria overlapping in thez-axis. These large regions of fluorescence, most typically seen in cell bodies, were excluded from analysis based on size. The mask containing the ROIs (Fig. 2C) was overlaid onto the JC-1 monomer signal (Fig. 2D), and the fluorescence intensity from each individual ROI was recorded (Fig.2E). This technique allowed us to measure the fluorescence intensity of ∼1000 ROIs per field from images collected every 5 sec for 10 min.
A graphical illustration of the spontaneous ΔΨm fluctuations is presented in Figure3, A and B. There appears to be no regularity in amplitude or frequency of the spontaneous depolarizations. Note that the individual mitochondria in each of these graphs (traces a–d) exhibit numerous spontaneous depolarizations and repolarizations over the course of the experiments, with the overall basal fluorescence intensity remaining relatively stable. However, not all mitochondria exhibit spontaneous fluctuations (trace eon both graphs). Over 35,000 mitochondria from untreated cells were assessed for spontaneous ΔΨm fluctuations in these experiments. The percentage of mitochondria that exhibit at least one ΔΨm fluctuation was calculated from ∼15,600 mitochondria in JC-1-loaded control fields, and 55% of these mitochondria were inherently active.
Fig. 3.
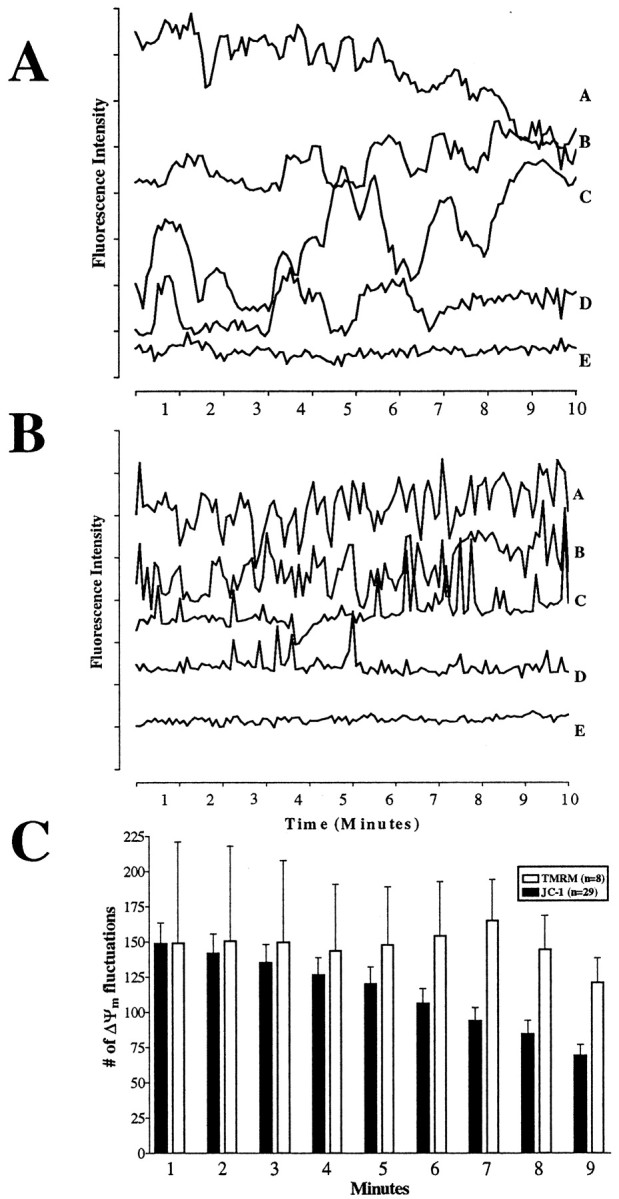
Quantification of ΔΨmfluctuations within individual mitochondria. A, JC-1 monomer traces. B, TMRM fluorescence traces. Eachtrace represents in a single ROI corresponding to an individual mitochondrion. An increase in fluorescence is associated with depolarization. Note that the basal fluorescence in both graphs remains stable and that fluctuations are not all of the same magnitude or of regular frequency. Approximately 1000 such traces were collected per field. The y-axis represents arbitrary fluorescence units, with each tick mark equaling 10 units.Traces have been offset from one another for display purposes. A, Tracea shows a mitochondrion that fluctuates repeatedly followed by a loss of fluorescence, most likely indicating the movement of the mitochondrion out of the ROI. Trace b shows a mitochondrion that fluctuates especially as the experiment continues.Trace c shows large fluctuations and then a slow increase in fluorescence suggesting a gradual depolarization.Trace d initially exhibits fluctuations, but by 7 min activity ceases. B, Tracesa and b show mitochondria that fluctuate repeatedly throughout the experiment.Trace c shows a mitochondrion that fluctuates especially as the experiment continues. Traced initially has fluctuations, but by 5 min activity ceases. Trace e from both figures shows background noise in the system and reflects mitochondria that do not exhibit spontaneous fluctuations. C, Average number of spontaneous ΔΨm fluctuations in JC-1- or TMRM-loaded neurons from traces such as those presented in A and B. Criteria for a spontaneous fluctuation in ΔΨm were set a priori: fluorescence changes >4 fluorescent units and a slope >0.3 fluorescent units per second. The number of ΔΨm fluctuations that occurred per minute per 1000 ROIs is presented. A decrease in the number of ΔΨm fluctuations over time was observed in JC-1-loaded, but not in TMRM-loaded, neurons (see Results). Data are presented as means ± SEM. The number of fields (n) imaged (∼1000 ROIs per field) is presented in the key.
From Figure 3, it is evident that the fluctuations appear different in JC-1- and TMRM-loaded mitochondria. The ΔΨmfluctuations appear slower in JC-1-loaded neurons, probably because of the differences in the properties of the dyes. TMRM equilibrates faster across membranes, and thus the fluctuations appear more rapid. This difference in the rate of reequilibration of these dyes thus results in the same phenomenon having a somewhat different appearance, depending on the dye used (Nicholls and Ward, 2000).
JC-1- and TMRM-loaded mitochondria can also be distinguished by the fluctuation frequency, which appears to decrease over time with JC-1 but remain stable or increase with TMRM (Fig. 3C). This may be explained by the rapid distribution of TMRM across membranes, which necessitated the addition of TMRM into the perfusate to maintain the level of fluorescence within the neurons (Fig. 3B, note the stability of the basal fluorescence within the ROIs). In contrast, JC-1 was not included in the perfusate, making it likely that there is only a partial reaggregation of the dye during repolarization, with some dye diffusing out of the cell. This could lead to a decrease in JC-1 aggregate fluorescence, which could imply less monomer release until eventually the magnitude of the increase in monomer fluorescence would fall below the criterion needed to indicate a fluctuation. This explanation however seems unlikely because, when JC-1 aggregate fluorescence in neurons was decreased by high-light exposure, depolarization could still be observed as a rise in monomer fluorescence (data not shown).
Another factor that may impact the number of fluctuations is that a percentage of mitochondria are known to be motile within neurons (Overly et al., 1996). In fact, we note that a fraction of the mitochondria move throughout the processes of our cultured neurons, regardless of which dye we used. With JC-1, mitochondria were located and ROIs identified only at the onset of the experiment, using the JC-1 aggregate signal. Thus, over time, the regions being analyzed may no longer correlate with the regions exhibiting the changes in fluorescence (i.e., a mitochondrion may move out of the defined ROI). TMRM-loaded mitochondria were located using image stacking; thus, when a mitochondrion moves, each location may be associated with an independent ROI. This would suggest that TMRM overestimates the number of ROIs and thus underestimates the number of fluctuations per 1000 ROIs. These technical differences can explain why TMRM-loaded mitochondria appear more active than JC-1-loaded mitochondria, a fact that is not reflected in the average number of fluctuations reported in Figure 3C. In addition, they suggest that the percentage of mitochondria that move is stable because the decrease in fluctuations observed with JC-1 is very consistent. It is important to note, however, that regardless of the cause, we have corrected for this loss of fluctuation detection in subsequent pharmacological experiments by analyzing only the ratio of spontaneous ΔΨmfluctuations at the beginning versus end of the experiment.
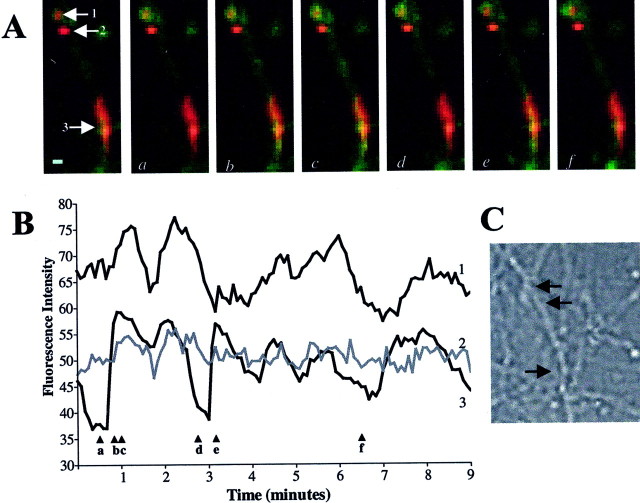
It was important to rule out nonphysiological influences on the fluctuations in ΔΨm. Fluorescence imaging of organelles as small as mitochondria requires careful maintenance of the correct focal plane. Drifts in focus could lead to the appearance and/or disappearance of ΔΨm fluctuations. To minimize inclusion of focus changes in our quantitation of ΔΨm fluctuations, we used a moving average paradigm to smooth out brief irregularities in whole-field fluorescence (see Materials and Methods). However, because the cells were also being perfused throughout the experiment, it was possible that smaller regions of the field were drifting in and out of focus, thus leading to the graphical appearance of fluctuations. To show that the ΔΨm fluctuations were not attributable to focus drift, we identified three adjacent mitochondria located within a single neuronal process and analyzed them for spontaneous ΔΨm fluctuations (Fig.4). If the ΔΨmfluctuations were the result of drifts in focus, then mitochondria in close proximity to one another should all exhibit simultaneous fluctuations. This was not observed. Three neighboring ROIs were identified using the JC-1 aggregate signal (Fig. 4A,red), and the fluorescence intensity of JC-1 monomer signal (Fig. 4A, green) within each ROI was determined. As the monomer signal increases (indicating depolarization), the ROIs appear increasingly yellow (Fig.4A) and an increase in fluorescence intensity is observed graphically (Fig. 4B). The fluctuations in fluorescence intensity observed qualitatively and quantitatively appear to correspond, with no evidence of changes in focus in any of the ROIs. Moreover, two mitochondria demonstrate fluctuations (ROIs 1 and 3), whereas the ROI in the middle does not (ROI 2). This strongly argues against a drift in focus or movement of the process as the underlying mechanism of this phenomenon.
Fig. 4.
ΔΨm fluctuations are not attributable to focus drift. Three individual ROIs located within a single neuronal process analyzed for spontaneous ΔΨmfluctuations. A, In this series of images, the JC-1 aggregate signal (red, depicting individual ROIs) has been overlaid on the corresponding JC-1 monomer (green) images (as shown in Fig.2E). The first image in this series identifies three mitochondria at the onset of imaging (arrows). Thenumbers associated with each mitochondrion correspond to the traces in B. In imagesa–f, a static aggregate (red) image has been used; thus, changes in the ratio of green tored represent changes in JC-1 monomer fluorescence. (i.e., when mitochondria appear yellow, monomer signal has increased, suggesting depolarization). Note that fluctuations in JC-1 monomer fluorescence intensity can be observed qualitatively over time. B, Fluorescence intensity of the JC-1 monomer signal within each of the three ROIs identified in A was quantified (arrowheadsa–f show the time points when the images in A were taken). Note thattraces 1 and 3 show significant fluctuations in fluorescence intensity, but trace 2 does not. This illustrates that changes in fluorescence intensity are not simply attributable to a drift in focus or movement of the process. If this were the case, then all three mitochondria within this process should exhibit similar ΔΨm fluctuations.C, A differential interference contrast image showing the neuronal process from which the fluorescent images were taken. Thearrows correspond to the ROIs analyzed. Scale bar, 5 μm.
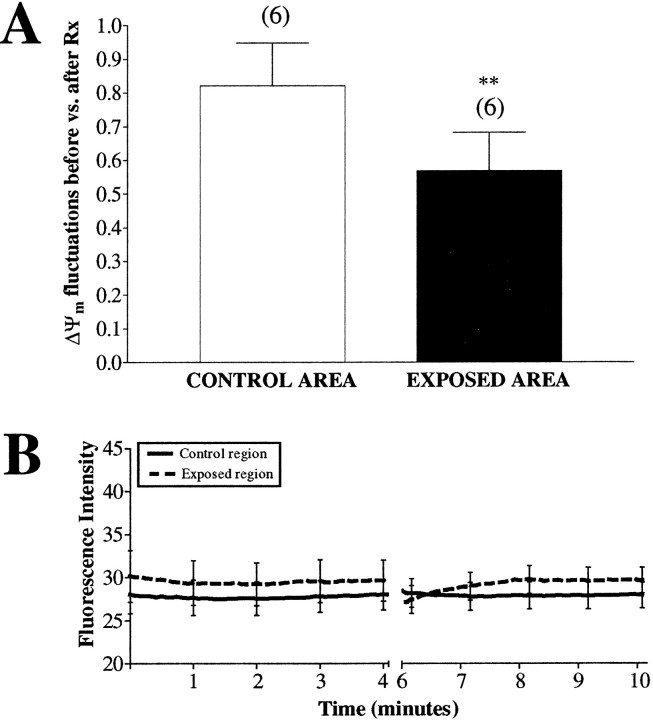
Illumination of mitochondria loaded with cationic fluorescence dyes has been reported to lead to the generation of reactive oxygen species (ROS) and thus mitochondrial damage (Bunting, 1992). Photo damage to the mitochondria could therefore be a potential cause of the observed fluctuations in ΔΨm. Typically, during imaging, neurons were exposed to attenuated fluorescent light (5% transmitted light) for ∼0.1 sec every 5 sec over the course of a 10 min experiment. To determine the relative contribution of light, we took JC-1-loaded neurons and exposed a portion of the field to a brief, intense light. For our high-light conditions, we maintained the exposure time of 0.1 sec (per 5 sec) but increased transmitted light to 100%. In these experiments, JC-1-loaded neuronal processes were imaged under standard conditions for 50 frames (one frame per 5 sec). The microscope aperture size was then decreased so that light exposure was limited to the center of the neuronal field and the processes in this central region were illuminated, for 20 frames (one frame per 5 sec), with a 20-fold higher light intensity. Light conditions were then returned to normal. We separated the imaged field into the exposed center region (illuminated under high-light conditions) and the peripheral, control region (unilluminated for the same 20 frames). The ratio of fluctuations occurring before versus after intense light exposure were compared across the control and exposed regions. The region exposed to high-light conditions showed significantly fewer spontaneous ΔΨm fluctuations (Fig.5A), without a concurrent change in average fluorescence intensity (Fig. 5B). Thus, photo damage cannot account for the observation of these phenomena; in fact, these data suggest that light exposure can lead to the loss of ΔΨm fluctuations, potentially through a photo-induced oxidant burden.
Fig. 5.
ΔΨm fluctuations in JC-1-loaded neurons are not caused by light. Untreated neurons were loaded with JC-1 and imaged under our standard light conditions for 50 frames (neutral density attenuating transmitted light to 5%). The aperture on the microscope was then closed to allow light to hit only the center portion of the field, and the cells were imaged for 20 frames. Under this condition, the middle portion of the coverslip was exposed to intense light (100% transmitted light; EXPOSED AREA), whereas the periphery of the coverslip was left unexposed (CONTROL AREA). The imaging conditions were then returned to the standard conditions from the beginning of the experiment for 50 more frames. A, The number of fluctuations in ΔΨm per minute per 1000 ROIs was determined in the control and exposed regions, and the ratio of fluctuations occurring before versus after intense light exposure are presented (note that the control area received no light during this period). Data are presented as means ± SEM, and thenumbers above each bar equal the number of fields imaged. The region exposed to high-light conditions showed significantly fewer spontaneous ΔΨm fluctuations (paired t test; t = 3.77; df = 5; p < 0.05). B, Average fluorescence intensity of all mitochondria imaged, with representative error bars indicating SEM. Basal fluorescence did not change after light exposure.
Pharmacological analysis of spontaneous ΔΨm fluctuations
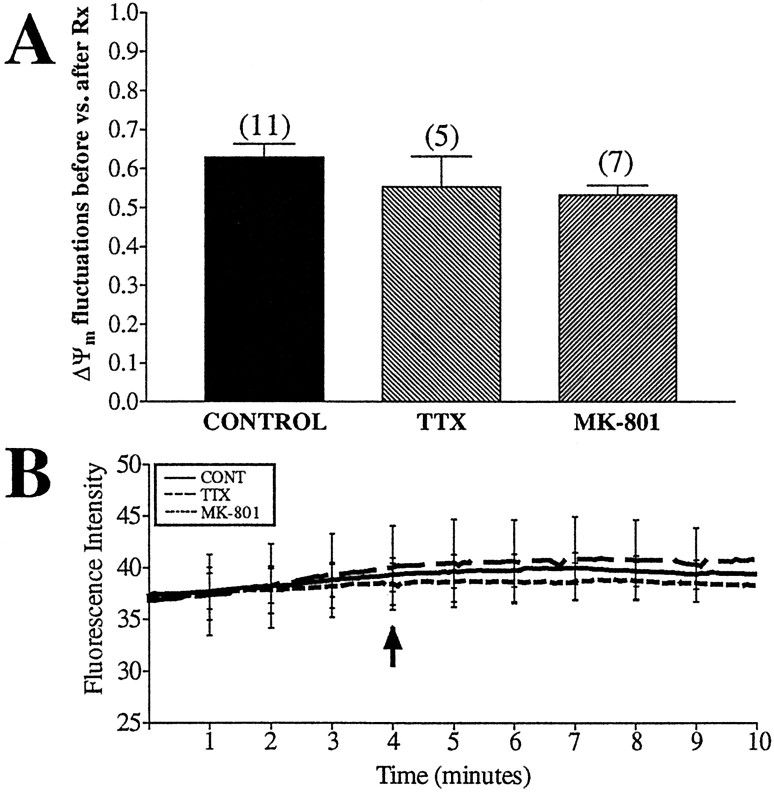
Having established methods to measure spontaneous fluctuations in fluorescence intensity in JC-1-loaded mitochondria in untreated neurons, we explored mechanisms underlying this phenomenon. We first tested the possibility that the ΔΨmfluctuations were the result of synaptic activity and thus were reflecting plasma membrane potential changes or calcium influx. Neurons were treated with TTX (200 nm), a sodium channel blocker, to inhibit spontaneous synaptic activity. We also tested an NMDA receptor antagonist, MK-801 (10 μm), to block a major route of calcium entry. JC-1-loaded neurons were perfused with HBSS for 4 min to establish basal activity. Neurons were then exposed to the inhibitors for 5 min. The ratio of fluctuations occurring before versus those occurring after drug treatment was graphed to correct for the decrease in the number of fluctuations that occurs even in untreated control mitochondria (Fig. 3C). There was no difference in the ratio of fluctuations between control mitochondria and those treated with TTX or MK-801 (Fig.6A). These treatments did not alter the average fluorescence intensity of the JC-1 monomer signal within the mitochondria (Fig. 6B). This suggests that drugs that inhibit plasma membrane activities do not inhibit spontaneous fluctuations or change the resting level of ΔΨm.
Fig. 6.
ΔΨm fluctuations are not attributable to synaptic activity. Untreated neurons were loaded with JC-1 and imaged for 4 min before the addition of drugs (arrow). TTX (200 nm) (a Na+ channel blocker) or 10 μm MK-801 (NMDA antagonist) were perfused over the cells for 5 min, and fluorescence intensity and number of fluctuations per minute per 1000 ROIs were calculated. A, The ratio of fluctuations occurring during the baseline to those occurring after drug treatment. This corrected for the consistent decrease in fluctuations observed in untreated mitochondria (see Fig. 3). Data are presented as means ± SEM, and the numbers above each barequal the number of fields imaged (∼1000 ROIs per field). Neither treatment had a significant impact on ΔΨm fluctuations (TTX, t = 1.03, df = 14, p> 0.05; MK-801, t = 1.98, df = 16,p > 0.05). B, Average fluorescence intensity of all mitochondria imaged, with representative error bars indicating SEM. Neither treatment altered basal fluorescence.
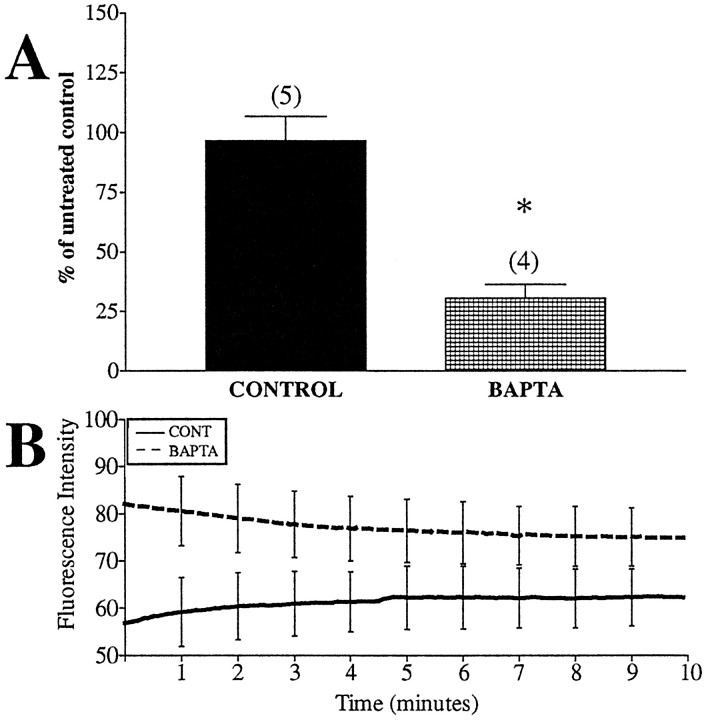
There are several additional routes of calcium entry beyond NMDA receptor activation. Mitochondria are intricately involved in shaping calcium dynamics (Duchen, 1999), and calcium has also been suggested to regulate ΔΨm fluctuation in other cells (Loew et al., 1994; Ichas et al., 1997; Duchen, 1999; Krippeit-Drews et al., 2000). BAPTA, an intracellular calcium chelator, interrupts calcium-mediated events that result from calcium influx and release from intracellular stores. Because of the close apposition of mitochondria to endoplasmic reticulum, release of calcium from the reticular stores can alter mitochondrial function by creating microdomains of high calcium (Rizzuto et al., 1993, 1998; Hajnoczky et al., 1995). Thus, any involvement of calcium-mediated activity in the observed spontaneous mitochondrial depolarizations should become evident with BAPTA treatment. Neurons were preincubated with BAPTA-AM (50 μm) showed a dramatic decrease in the number of spontaneous fluctuations compared with controls (Fig.7A). However, this BAPTA-induced inhibition was associated with a dramatic rise in fluorescence intensity (Fig. 7B). This implies that BAPTA-AM, at this concentration, leads to mitochondrial depolarization. The mechanism by which this occurs is unclear and cannot necessarily be attributed to calcium chelation. Respiratory complex inhibitors and the uncoupler FCCP depolarized ΔΨm and decreased the number of spontaneous fluctuations (data not shown). This raises the possibility that the effects of BAPTA are attributable to general mitochondrial depolarization, which occludes the smaller fluctuations rather than a result of modifying intrinsic calcium changes.
Fig. 7.
An intracellular calcium chelator alters ΔΨm fluctuations and basal fluorescence. Neurons loaded with JC-1 were treated with 50 μm BAPTA-AM for 15 min before imaging. The fluorescence intensity and number of fluctuations per minute per 1000 ROIs were calculated. A, The percentage of fluctuations occurring in BAPTA-pretreated mitochondria to untreated mitochondria. Data are presented as means ± SEM.Numbers above each bar equal the number of fields imaged (∼1000 ROIs per field). BAPTA decreased ΔΨm fluctuations (t = 5.17; df = 7; *p < 0.05; but see Discussion).B, Average fluorescence intensity of all mitochondria imaged, with representative error bars indicating SEM. BAPTA increased the average fluorescence intensity. (Note that the scale is twice that of Figs. 8-10).
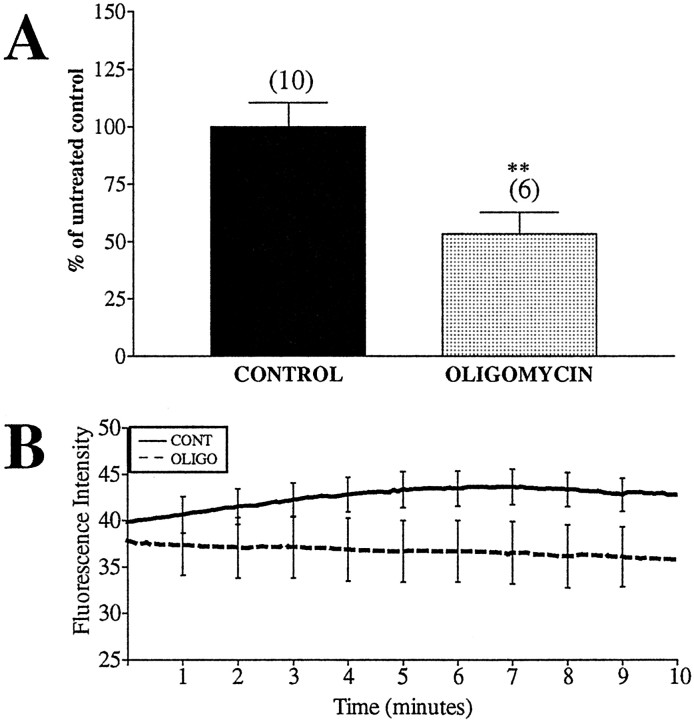
Activity of the respiratory chain complexes leads to the extrusion of protons from the mitochondrial matrix, whereas synthesis of ATP through the F1FO ATPase (ATP synthase) is driven by proton reentry. Thus, whereas inhibition at the respiratory chain complexes may lead to a slow loss of ΔΨm, inhibition at the ATP synthase should lead to a subtle hyperpolarization in healthy, ATP-generating mitochondria and a depolarization in damaged, ATP-consuming mitochondria (Scott and Nicholls, 1980; Nicholls and Ward, 2000). Neurons pretreated with oligomycin (15 min) showed a significant decrease in the number of spontaneous ΔΨmfluctuations compared with untreated control mitochondria (Fig.8A) but no significant change in initial basal fluorescence (Fig. 8B). Because it is unlikely that all mitochondria within a field of neurons are of equivalent membrane potential and ATP synthase activity and ∼1000 mitochondria were averaged per field, small changes in overall fluorescence intensity were not detected.
Fig. 8.
ΔΨm fluctuations are decreased by pretreatment with an ATP synthase inhibitor. Neurons loaded with JC-1 were treated with 10 μm oligomycin (OLIGO) for 15 min before imaging to ensure substantial inhibition of the synthase. Fluorescence intensity and number of fluctuations per minute per 1000 ROIs were calculated. A, Percentage of fluctuations in oligomycin-pretreated to untreated mitochondria (means ± SEM). Oligomycin significantly decreased ΔΨm fluctuations (t = 3.03;df = 14; **p < 0.01).Numbers above bars equals the number of fields imaged (∼1000 ROIs per field). B, Average fluorescence intensity of all mitochondria, with representative error bars indicating SEM. Oligomycin had no effect.
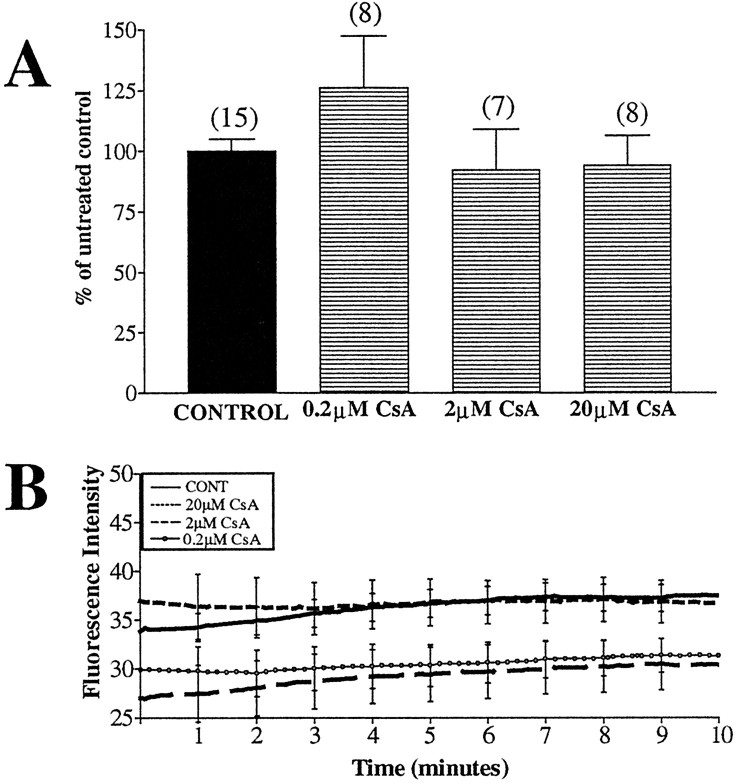
The PTP is thought to regulate matrix Ca2+, pH, ΔΨm, and volume (Susin et al., 1998). Its opening is triggered by a wide variety of treatments, including increased Ca2+ (Zoratti and Szabo, 1995), and is inhibited by cyclosporin A (Crompton et al., 1988). Two open states for this pore have been proposed, with the low-conductance state causing transient openings that aid in stabilizing ΔΨm and volume (Ichas et al., 1997) and the high-conductance state involved in irreversible openings, complete dissipation of the ΔΨm, extensive swelling, and cell death (Petit et al., 1996; Susin et al., 1997). Transient depolarizations in ΔΨm have been reported to coincide with activation of the low-conductance state of the PTP in isolated mitochondria, which could represent a physiological process necessary for regulating ΔΨm (Ichas et al., 1997) and limiting the generation of ROS in hyperpolarized mitochondria (Skulachev, 1996). We tested whether cyclosporin A influenced the frequency of the ΔΨm fluctuations in our cultured neurons. No effect was observed at any concentration tested (Fig. 9A); however, cyclosporin A caused a modest decrease in fluorescence intensity at lower concentrations (Fig. 9B).
Fig. 9.
ΔΨm fluctuations are not altered by treatment with cyclosporin A. Neurons loaded with JC-1 were treated with 0.2–20 μm cyclosporin A (CsA) for 15 min before imaging. Fluorescence intensity and number of fluctuations per minute per 1000 ROIs were calculated. A, Percentage of fluctuations in cyclosporin A-pretreated mitochondria to untreated mitochondria. Cyclosporin A did not significantly alter ΔΨm fluctuations (F(3,34) = 1.27; p> 0.05). Data are presented as means ± SEM, and thenumbers above bars equal the number of fields imaged (∼1000 ROIs per field). B, Average fluorescence intensity, with representative error bars indicating SEM. Cyclosporin A did not substantially alter the average fluorescence intensity.
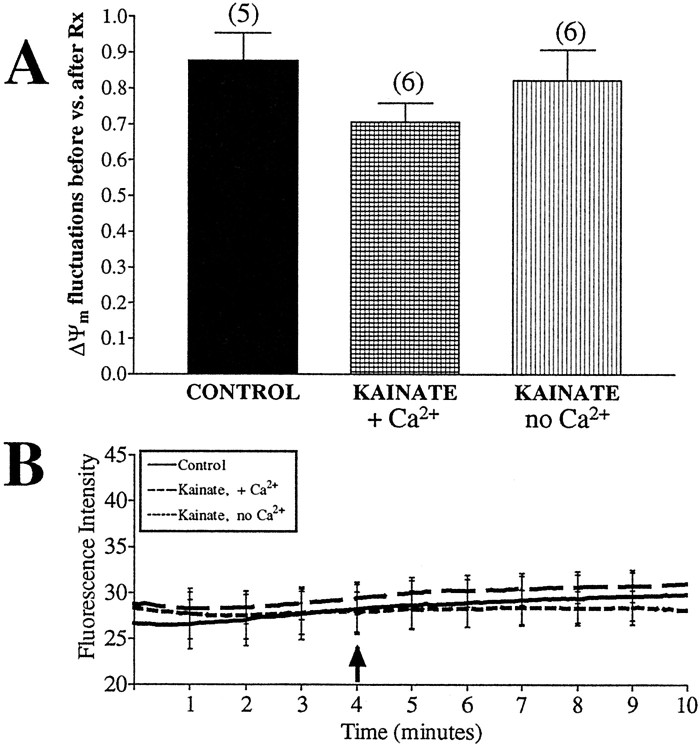
Taxing neurons by increasing synaptic activity may lead to an increase in mitochondrial activity. Stimulation of neurons by high concentrations of glutamate causes large calcium fluxes that directly influence mitochondrial function (White and Reynolds, 1995) and have been proposed to increase ATP demand by the plasma membrane ATPases. Although inhibition of basal synaptic activity with a sodium channel blocker or a glutamate receptor antagonist did not alter the frequency of ΔΨm fluctuations (Fig.6A), we tested whether increasing synaptic activity, and presumably increasing the demand placed on the mitochondria, would alter the frequency of fluctuations. Treatment with glutamate in the presence of extracellular calcium leads to an increase in fluorescence intensity in a similar manner to that observed with BAPTA-AM. In fact, stimulation with glutamate is known to cause mitochondrial calcium influx and depolarization (Ankarcrona et al., 1995; White and Reynolds, 1996). We attempted to circumvent the problem of the superimposition of the catastrophic depolarization on the smaller spontaneous changes using two approaches. First, we treated neurons with kainic acid, an agonist of the AMPA–kainate subtype of glutamate receptors. Activation of glutamate receptors with kainic acid results in increased intracellular sodium and calcium but does not lead to mitochondrial depolarization (Courtney et al., 1995, Hoyt et al., 1998). Accumulation of calcium within mitochondria is also significantly lower using kainic acid than it is with NMDA (Budd and Nicholls, 1996; Stout et al., 1998). Therefore, neurons were treated with 100 μm kainic acid for 5 min, in either the presence or absence of calcium, but no evidence of altered ΔΨm fluctuation frequency (Fig.10A) or overall fluorescence intensity (Fig. 10B) was observed.
Fig. 10.
ΔΨm fluctuations are not altered by treatment with kainic acid. Untreated neurons were loaded with JC-1 and imaged for 4 min before the addition of drug (arrow). Kainic acid (100 μm) was perfused over the cells in a buffer containing 1.4 mm(+Ca2+) or 0 mm(no Ca2+) calcium for 5 min, and fluorescence intensity and number of fluctuations per minute per 1000 ROIs were calculated. A, The ratio of fluctuations occurring during baseline to those occurring after drug treatment. Data are presented as means ± SEM, and the numbersabove each bar equal the number of fields imaged (∼1000 ROIs per field). Neither treatment had a significant impact on ΔΨm fluctuations (with Ca2+,t = 1.90, df = 9, p > 0.05; without Ca2+, t = 0.48, df = 9, p > 0.05). B, Average fluorescence intensity of all mitochondria imaged, with representative error bars indicating SEM. Neither treatment altered basal fluorescence.
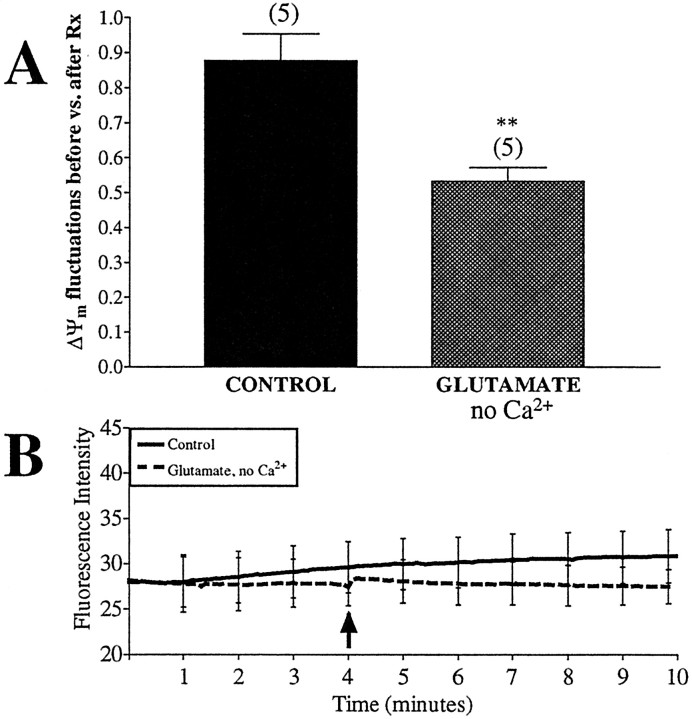
We then attempted to increase synaptic activity and mitochondrial demand without flooding mitochondria with calcium and depolarizing them by treating neurons with glutamate (in the presence of its coagonist glycine) in buffer that is nominally calcium free. This should lead to the activation of the glutamate receptors without the concurrent increase in intracellular and intramitochondrial calcium concentrations. Receptor activation should, however, lead to an influx of sodium and thus manipulate mitochondrial ion concentrations through sodium-related pathways. JC-1-loaded neurons were treated with 100 μm glutamate and 10 μm glycine in calcium-free buffer for 5 min. This treatment led to a significant decrease in ΔΨm fluctuations (Fig.11A) without a concomitant rise in fluorescence intensity (Fig.11B). The differences between glutamate and kainate on ΔΨm fluctuations are not surprising in light of the observation that their ability to activate glutamate receptors is not equivalent qualitatively or quantitatively (Hoyt et al., 1998; Sattler et al., 1998; Brocard et al., 2001).
Fig. 11.
ΔΨm fluctuations are decreased after treatment with glutamate in a calcium-free buffer. Untreated neurons were loaded with JC-1 and imaged for 4 min before the addition of drug (arrow). Glutamate (100 μm,with 10 μm glycine) was perfused over the cells in a Ca2+-free buffer for 5 min. Fluorescence intensity and number of fluctuations per minute per 1000 ROIs were calculated. Glutamate in the presence of Ca2+ caused mitochondrial depolarization and thus was not tested. A, The ratio of fluctuations occurring during baseline to those occurring after drug treatment. Data are presented as means ± SEM, and thenumbers above each bar equal the number of fields imaged (∼1000 ROIs per field). Glutamate in Ca2+-free buffer significantly decreased the number of spontaneous fluctuations (t = 4.04; df = 8; **p < 0.01). B, Average fluorescence intensity of all mitochondria imaged, with representative error bars indicating SEM. Glutamate (no Ca2+) treatment did not alter basal fluorescence.
DISCUSSION
In this study, we report that mitochondria in neuronal cultures display small, spontaneous fluctuations in ΔΨm and that these fluctuations can be dramatically decreased, without a concurrent change in basal fluorescence, by treatments that alter mitochondrial activity. Although there has been a great deal of recent interest in large-scale changes in mitochondrial function associated with neuronal injury, the present findings reveal a previously unappreciated property of mitochondria in resting, uninjured neurons.
The ΔΨm is a key marker of mitochondrial function, generated by the pumping of protons across the inner mitochondrial membrane in association with electron transport. In turn, ΔΨm drives many key mitochondrial functions, including ATP synthesis, calcium accumulation, and maintenance of ion gradients that permit the influx of substrates and egress of metabolic products. Clearly, ΔΨm has a number of important functions, and thus a variety of activities could account for the spontaneous changes in ΔΨm reported here. Our observations of ΔΨm fluctuations could reflect inherent changes in mitochondrial ion transport, ATP production–consumption, respiration, or volume, all of which are essential for proper mitochondrial function. We believe that spontaneous ΔΨm fluctuations represent a normal physiological feature of neuronal mitochondria such that the presence or absence of these fluctuations may be useful as a novel marker for mitochondrial activity.
The pharmacological approach of using tetrodotoxin or MK-801 clearly excludes alterations in plasma membrane potential and ion fluxes as the basis for the change in the mitochondrial dye signal. However, the mitochondrial mechanism that causes the fluctuations is less clear. Attempts to regulate the permeability transition pore with cyclosporin A had no effect on either ΔΨm fluctuations or fluorescence intensity, which ostensibly excludes low-amplitude transition as a basis for these changes (Ichas et al., 1997). Oligomycin, however, significantly decreased the frequency of fluctuations, which argues that the fluctuations are associated with oxidative phosphorylation.
Oxidative phosphorylation may impact ΔΨmfluctuations by one of two mechanisms. The first mechanism would suggest that, as mitochondria go from a resting state to active phosphorylation (state 4 to state 3), the fluctuations reflect the transient loss of ΔΨm as proton flux increases (Nicholls and Ferguson, 1992). In this case, the increase in dye signal would be attributable to the disaggregation and subsequent dissipation of dye from mitochondria. Alternatively, because state 3 mitochondria adopt a condensed configuration whereas state 4 mitochondria adopt the larger orthodox configuration (Scalettar et al., 1991), the fluctuations would reflect changes in mitochondrial matrix volume. In this case, the increase in dye signal attributable to the increased volume would lead to a disaggregation of dye that is retained within the mitochondrial matrix. Although these mechanisms are contradictory in that the first proposes that a fluctuation is associated with the onset of phosphorylation whereas the second suggests that the signal should be associated with the termination of active phosphorylation, the key feature of both mechanisms is that the fluctuations represent an on–off transition. Thus, either mechanism could explain the decrease in fluctuations observed with a glutamate-induced sodium load. In this condition, an increase in ATP demand presumably occurs causing the mitochondria to spend a greater fraction of the time engaged in active phosphorylation rather than switching on and off. One could also argue that light-induced damage places greater demands on the mitochondria to be met by increasing ATP synthesis (or perhaps by decreasing synthetic capacity).
Predicting manipulations that increase the frequency of fluctuations is harder. We have observed differences in the number fluctuations on a culture-to-culture basis but have not yet established a mechanism for these differences. We are not aware of any previous studies that have suggested that individual mitochondria can be observed to change between states of resting and active phosphorylation. However, the architecture of neurons is uniquely suited to making such observations because optically isolating individual mitochondria in neuronal processes is straightforward (Figs. 1, 2).
Cationic dyes used to measure ΔΨm (such as JC-1 and TMRM) can lead to toxicity resulting from light-induced singlet oxygen generation (Bunting, 1992) and inhibition of respiration. Although light exposure was carefully controlled and minimized to that necessary for adequate recordings, some effects of light exposure were observed even under these low-light conditions. With JC-1, exposure to light before recording stabilized the baseline, and with TMRM, increasing light exposure tended to increase the overall fluorescent signal. Both of these light-induced changes in dye signal could be indicative of a potential impact of phototoxicity in ΔΨm measurements. A more immediate concern was that the spontaneous changes were triggered by light exposure. Thus, if a brief, intense light augmented the frequency of ΔΨm fluctuations, it would suggest that these fluctuations were merely reflecting photo damage. We saw, however, a decrease in the number of fluctuations under high-light conditions, suggesting that dye-loaded mitochondria exhibit spontaneous fluctuations in ΔΨm, which were not a consequence of illumination. These high-light conditions led to a decrease in the JC-1 aggregate signal without a concurrent change in the monomer signal (data not shown), similar to what is observed with oxidant treatments, such as hydrogen peroxide (Scanlon and Reynolds, 1998; Chinopoulos et al., 1999). However, treatment with the uncoupler FCCP at the end of the high-light experiments led to an increase in monomer fluorescence of the same magnitude in both the exposed and unexposed regions (data not shown). This supports the hypothesis that JC-1 aggregate fluorescence responds to more than just changes in ΔΨm (Scanlon and Reynolds, 1998; Chinopoulos et al., 1999) but indicates that light-induced changes in aggregate fluorescence do not change the ability of the JC-1 monomer signal to respond to changes in ΔΨm.
Calcium may have a profound impact on mitochondrial function in general and on membrane potential in particular. Small transient changes in ΔΨm observed in cardiomyocytes were reported to be the result of mitochondrial calcium transport (Duchen et al., 1998; Fall and Bennett, 1999). Furthermore, calcium can induce the generation of ROS, alter respiration (McCormack et al., 1990), and possibly open the large, nonselective PTP (Zoratti and Szabo, 1995). This suggests that calcium could be a key mediator of changes in ΔΨm. Inhibiting the NMDA receptor, thus decreasing the entry accumulation of calcium (Fig.6A), chelating extracellular calcium with EGTA (data not shown), and inhibiting the PTP with cyclosporin A (Fig. 9) all failed to change ΔΨm fluctuations, which argues against this possibility. Chelating intracellular calcium with BAPTA (Fig. 7A) did decrease fluctuations, but this occurred in conjunction with a considerable mitochondrial depolarization. The large rise in monomer fluorescence induced by BAPTA most likely occluded our ability to detect small fluctuations and was similar to the effects of the protonophore FCCP. However, it remains unclear how adding BAPTA influences the free calcium because, under resting conditions, the calcium concentration in both the cytoplasm and mitochondria of these neurons is low (Brocard et al., 2001).
We believe that these are the first experiments that illustrate spontaneous changes in ΔΨm in neurons. Previous studies have suggested cyclosporin A-stimulated changes in whole-cell TMRM signal in neuroblastoma cells (Fall and Bennett, 1999), which are obviously distinct from the single organelle signals reported here. In cardiomyocytes, transient depolarizations in single mitochondria have been seen (Duchen et al., 1998), but these changes were the consequence of calcium movements. Other studies have investigated single mitochondria but only after their isolation from cells (Ichas et al., 1997; Huser and Blatter, 1999). Apparently none of these studies have reported oligomycin sensitivity of the fluctuations.
Herein, we have documented a novel feature of mitochondrial physiology in neurons. Unlike previous studies that have reported large changes in ΔΨm associated with neuronal injury, the spontaneous changes in ΔΨm reported here appear to be a normal characteristic of mitochondrial function in neurons and may reflect alterations in the activity of individual mitochondria associated with the transition between rest and active oxidative phosphorylation. We suggest that this phenomenon that may prove to be a useful marker of mitochondrial function in neurons and hypothesize that these fluctuations in ΔΨmreflect variations in the cellular environment associated with altered states of respiratory control or ion-induced matrix swelling.
Footnotes
This work was supported by United States Army Medical Research and Materiel Command Grant DAMD-17–98-1–8627 (I.J.R.), the Scaife Family Foundation (I.J.R.), and National Institutes of Health Grants T32NS07391 (J.F.B.) and F32NS11147 (J.F.B.). We thank Jacques Brocard, Gareth Dewalt, Kirk Dineley, and Yong Yun Han for their assistance in data collection and analysis.
Correspondence should be addressed to Dr. Ian J. Reynolds, Department of Pharmacology, University of Pittsburgh, W1351 Biomedical Sciences Tower, Pittsburgh, PA 15261. E-mail: iannmda+@pitt.edu.
REFERENCES
- 1.Ankarcrona M, Dypbukt JM, Bonfoco E, Zhivotovsky B, Orrenius S, Lipton SA, Nicotera P. Glutamate-induced neuronal death: a succession of necrosis or apoptosis depending on mitochondrial function. Neuron. 1995;15:961–973. doi: 10.1016/0896-6273(95)90186-8. [DOI] [PubMed] [Google Scholar]
- 2.Bernardi P. Mitochondrial transport of cations: channels, exchangers, and permeability transition. Physiol Rev. 1999;79:1127–1155. doi: 10.1152/physrev.1999.79.4.1127. [DOI] [PubMed] [Google Scholar]
- 3.Brocard JB, Tassetto M, Reynolds IJ. Quantitative evaluation of mitochondrial calcium content following a glutamate stimulation in rat cortical neurones. J Physiol (Lond) 2001;531:793–805. doi: 10.1111/j.1469-7793.2001.0793h.x. [DOI] [PMC free article] [PubMed] [Google Scholar]
- 4.Budd SL, Nicholls DG. Mitochondria, calcium regulation, and acute glutamate excitotoxicity in cultured cerebellar granule cells. J Neurochem. 1996;67:2282–2291. doi: 10.1046/j.1471-4159.1996.67062282.x. [DOI] [PubMed] [Google Scholar]
- 5.Budd SL, Tenneti L, Lishnak T, Lipton SA. Mitochondrial and extramitochondrial apoptotic signaling pathways in cerebrocortical neurons. Proc Natl Acad Sci USA. 2000;97:6161–6166. doi: 10.1073/pnas.100121097. [DOI] [PMC free article] [PubMed] [Google Scholar]
- 6.Bunting JR. A test of the singlet oxygen mechanism of cationic dye photosensitization of mitochondrial damage. Photochem Photobiol. 1992;55:81–87. doi: 10.1111/j.1751-1097.1992.tb04212.x. [DOI] [PubMed] [Google Scholar]
- 7.Chinopoulos C, Tretter L, Adam-Vizi V. Depolarization of in situ mitochondria due to hydrogen peroxide-induced oxidative stress in nerve terminals: inhibition of alpha-ketoglutarate dehydrogenase. J Neurochem. 1999;73:220–228. doi: 10.1046/j.1471-4159.1999.0730220.x. [DOI] [PubMed] [Google Scholar]
- 8.Courtney MJ, Enkvist MO, Akerman KE. The calcium response to the excitotoxin kainate is amplified by subsequent reduction of extracellular sodium. Neuroscience. 1995;68:1051–1057. doi: 10.1016/0306-4522(95)00211-z. [DOI] [PubMed] [Google Scholar]
- 9.Crompton M, Ellinger H, Costi A. Inhibition by cyclosporin A of a Ca2+-dependent pore in heart mitochondria activated by inorganic phosphate and oxidative stress. Biochem J. 1988;255:357–360. [PMC free article] [PubMed] [Google Scholar]
- 10.Desagher S, Martinou JC. Mitochondria as the central control point of apoptosis. Trends Cell Biol. 2000;10:369–377. doi: 10.1016/s0962-8924(00)01803-1. [DOI] [PubMed] [Google Scholar]
- 11.Duchen MR. Contributions of mitochondria to animal physiology: from homeostatic sensor to calcium signalling and cell death. J Physiol (Lond) 1999;516:1–17. doi: 10.1111/j.1469-7793.1999.001aa.x. [DOI] [PMC free article] [PubMed] [Google Scholar]
- 12.Duchen MR, Leyssens A, Crompton M. Transient mitochondrial depolarizations reflect focal sarcoplasmic reticular calcium release in single rat cardiomyocytes. J Cell Biol. 1998;142:975–988. doi: 10.1083/jcb.142.4.975. [DOI] [PMC free article] [PubMed] [Google Scholar]
- 13.Fall CP, Bennett JP., Jr Visualization of cyclosporin A and Ca2+-sensitive cyclical mitochondrial depolarizations in cell culture. Biochim Biophys Acta. 1999;1410:77–84. doi: 10.1016/s0005-2728(98)00177-7. [DOI] [PubMed] [Google Scholar]
- 14.Green DR, Reed JC. Mitochondria and apoptosis. Science. 1998;281:1309–1312. doi: 10.1126/science.281.5381.1309. [DOI] [PubMed] [Google Scholar]
- 15.Hajnoczky G, Robb-Gaspers LD, Seitz MB, Thomas AP. Decoding of cytosolic calcium oscillations in the mitochondria. Cell. 1995;82:415–424. doi: 10.1016/0092-8674(95)90430-1. [DOI] [PubMed] [Google Scholar]
- 16.Hoyt KR, Stout AK, Cardman JM, Reynolds IJ. The role of intracellular Na+ and mitochondria in buffering of kainate-induced intracellular free Ca2+ changes in rat forebrain neurones. J Physiol (Lond) 1998;509:103–116. doi: 10.1111/j.1469-7793.1998.103bo.x. [DOI] [PMC free article] [PubMed] [Google Scholar]
- 17.Huser J, Blatter LA. Fluctuations in mitochondrial membrane potential caused by repetitive gating of the permeability transition pore. Biochem J. 1999;343:311–317. [PMC free article] [PubMed] [Google Scholar]
- 18.Ichas F, Jouaville LS, Mazat JP. Mitochondria are excitable organelles capable of generating and conveying electrical and calcium signals. Cell. 1997;89:1145–1153. doi: 10.1016/s0092-8674(00)80301-3. [DOI] [PubMed] [Google Scholar]
- 19.Krippeit-Drews P, Dufer M, Drews G. Parallel oscillations of intracellular calcium activity and mitochondrial membrane potential in mouse pancreatic B-cells. Biochem Biophys Res Commun. 2000;267:179–183. doi: 10.1006/bbrc.1999.1921. [DOI] [PubMed] [Google Scholar]
- 20.Kroemer G, Dallaporta B, Resche-Rigon M. The mitochondrial death/life regulator in apoptosis and necrosis. Annu Rev Physiol. 1998;60:619–642. doi: 10.1146/annurev.physiol.60.1.619. [DOI] [PubMed] [Google Scholar]
- 21.Loew LM, Carrington W, Tuft RA, Fay FS. Physiological cytosolic Ca2+ transients evoke concurrent mitochondrial depolarizations. Proc Natl Acad Sci USA. 1994;91:12579–12583. doi: 10.1073/pnas.91.26.12579. [DOI] [PMC free article] [PubMed] [Google Scholar]
- 22.McCormack JG, Halestrap AP, Denton RM. Role of calcium ions in regulation of mammalian intramitochondrial metabolism. Physiol Rev. 1990;70:391–425. doi: 10.1152/physrev.1990.70.2.391. [DOI] [PubMed] [Google Scholar]
- 23.Nicholls DG, Budd SL. Mitochondria and neuronal survival. Physiol Rev. 2000;80:315–360. doi: 10.1152/physrev.2000.80.1.315. [DOI] [PubMed] [Google Scholar]
- 24.Nicholls DG, Ferguson SJ. Bioenergetics 2. Academic; San Diego: 1992. [Google Scholar]
- 25.Nicholls DG, Ward MW. Mitochondrial membrane potential and neuronal glutamate excitotoxicity: mortality and millivolts. Trends Neurosci. 2000;23:166–174. doi: 10.1016/s0166-2236(99)01534-9. [DOI] [PubMed] [Google Scholar]
- 26.Nieminen AL, Petrie TG, Lemasters JJ, Selman WR. Cyclosporin A delays mitochondrial depolarization induced by N-methyl-d-aspartate in cortical neurons: evidence of the mitochondrial permeability transition. Neuroscience. 1996;75:993–997. doi: 10.1016/0306-4522(96)00378-8. [DOI] [PubMed] [Google Scholar]
- 27.Overly CC, Rieff HI, Hollenbeck PJ. Organelle motility and metabolism in axons vs dendrites of cultured hippocampal neurons. J Cell Sci. 1996;109:971–980. doi: 10.1242/jcs.109.5.971. [DOI] [PubMed] [Google Scholar]
- 28.Petit PX, Susin SA, Zamzami N, Mignotte B, Kroemer G. Mitochondria and programmed cell death: back to the future. FEBS Lett. 1996;396:7–13. doi: 10.1016/0014-5793(96)00988-x. [DOI] [PubMed] [Google Scholar]
- 29.Rizzuto R, Brini M, Murgia M, Pozzan T. Microdomains with high Ca2+ close to IP3-sensitive channels that are sensed by neighboring mitochondria. Science. 1993;262:744–747. doi: 10.1126/science.8235595. [DOI] [PubMed] [Google Scholar]
- 30.Rizzuto R, Pinton P, Carrington W, Fay FS, Fogarty KE, Lifshitz LM, Tuft RA, Pozzan T. Close contacts with the endoplasmic reticulum as determinants of mitochondrial Ca2+ responses. Science. 1998;280:1763–1766. doi: 10.1126/science.280.5370.1763. [DOI] [PubMed] [Google Scholar]
- 31.Sattler R, Charlton MP, Hafner M, Tymianski M. Distinct influx pathways, not calcium load, determine neuronal vulnerability to calcium neurotoxicity. J Neurochem. 1998;71:2349–2364. doi: 10.1046/j.1471-4159.1998.71062349.x. [DOI] [PubMed] [Google Scholar]
- 32.Scalettar BA, Abney JR, Hackenbrock CR. Dynamics, structure, and function are coupled in the mitochondrial matrix. Proc Natl Acad Sci USA. 1991;88:8057–8061. doi: 10.1073/pnas.88.18.8057. [DOI] [PMC free article] [PubMed] [Google Scholar]
- 33.Scanlon JM, Reynolds IJ. Effects of oxidants and glutamate receptor activation on mitochondrial membrane potential in rat forebrain neurons. J Neurochem. 1998;71:2392–2400. doi: 10.1046/j.1471-4159.1998.71062392.x. [DOI] [PubMed] [Google Scholar]
- 34.Schinder AF, Olson EC, Spitzer NC, Montal M. Mitochondrial dysfunction is a primary event in glutamate neurotoxicity. J Neurosci. 1996;16:6125–6133. doi: 10.1523/JNEUROSCI.16-19-06125.1996. [DOI] [PMC free article] [PubMed] [Google Scholar]
- 35.Scott ID, Nicholls DG. Energy transduction in intact synaptosomes. Influence of plasma-membrane depolarization on the respiration and membrane potential of internal mitochondria determined in situ. Biochem J. 1980;186:21–33. doi: 10.1042/bj1860021. [DOI] [PMC free article] [PubMed] [Google Scholar]
- 36.Skulachev VP. Role of uncoupled and non-coupled oxidations in maintenance of safely low levels of oxygen and its one-electron reductants. Q Rev Biophys. 1996;29:169–202. doi: 10.1017/s0033583500005795. [DOI] [PubMed] [Google Scholar]
- 37.Stout AK, Raphael HM, Kanterewicz BI, Klann E, Reynolds IJ. Glutamate-induced neuron death requires mitochondrial calcium uptake. Nat Neurosci. 1998;1:366–373. doi: 10.1038/1577. [DOI] [PubMed] [Google Scholar]
- 38.Susin SA, Zamzami N, Castedo M, Daugas E, Wang HG, Geley S, Fassy F, Reed JC, Kroemer G. The central executioner of apoptosis: multiple connections between protease activation and mitochondria in Fas/APO-1/CD95- and ceramide-induced apoptosis. J Exp Med. 1997;186:25–37. doi: 10.1084/jem.186.1.25. [DOI] [PMC free article] [PubMed] [Google Scholar]
- 39.Susin SA, Zamzami N, Kroemer G. Mitochondria as regulators of apoptosis: doubt no more. Biochim Biophys Acta. 1998;1366:151–165. doi: 10.1016/s0005-2728(98)00110-8. [DOI] [PubMed] [Google Scholar]
- 40.Vergun O, Keelan J, Khodorov BI, Duchen MR. Glutamate-induced mitochondrial depolarisation and perturbation of calcium homeostasis in cultured rat hippocampal neurones. J Physiol (Lond) 1999;519:451–466. doi: 10.1111/j.1469-7793.1999.0451m.x. [DOI] [PMC free article] [PubMed] [Google Scholar]
- 41.Ward MW, Rego AC, Frenguelli BG, Nicholls DG. Mitochondrial membrane potential and glutamate excitotoxicity in cultured cerebellar granule cells. J Neurosci. 2000;20:7208–7219. doi: 10.1523/JNEUROSCI.20-19-07208.2000. [DOI] [PMC free article] [PubMed] [Google Scholar]
- 42.White RJ, Reynolds IJ. Mitochondria and Na+/Ca2+ exchange buffer glutamate-induced calcium loads in cultured cortical neurons. J Neurosci. 1995;15:1318–1328. doi: 10.1523/JNEUROSCI.15-02-01318.1995. [DOI] [PMC free article] [PubMed] [Google Scholar]
- 43.White RJ, Reynolds IJ. Mitochondrial depolarization in glutamate-stimulated neurons: an early signal specific to excitotoxin exposure. J Neurosci. 1996;16:5688–5697. doi: 10.1523/JNEUROSCI.16-18-05688.1996. [DOI] [PMC free article] [PubMed] [Google Scholar]
- 44.White RJ, Reynolds IJ. Mitochondria accumulate Ca2+ following intense glutamate stimulation of cultured rat forebrain neurones. J Physiol (Lond) 1997;498:31–47. doi: 10.1113/jphysiol.1997.sp021839. [DOI] [PMC free article] [PubMed] [Google Scholar]
- 45.Zoratti M, Szabo I. The mitochondrial permeability transition. Biochim Biophys Acta. 1995;1241:139–176. doi: 10.1016/0304-4157(95)00003-a. [DOI] [PubMed] [Google Scholar]


