

Abstract
Somatodendritic release of dopamine (DA) in midbrain represents a novel form of intercellular signaling that inherently differs from classic axon-terminal release. Here we report marked differences in the Ca2+ dependence and time course of stimulated increases in extracellular DA concentration ([DA]o) between the substantia nigra pars compacta (SNc) and striatum. Evoked [DA]o was monitored with carbon-fiber microelectrodes and fast-scan cyclic voltammetry in brain slices. In striatum, pulse-train stimulation (10 Hz, 30 pulses) failed to evoke detectable [DA]o in 0 or 0.5 mmCa2+ but elicited robust release in 1.5 mm Ca2+. Release increased progressively in 2.0 and 2.4 mm Ca2+. In sharp contrast, evoked [DA]o in SNc was nearly half-maximal in 0 mm Ca2+ and increased significantly in 0.5 mm Ca2+. Surprisingly, somatodendritic release was maximal in 1.5 mmCa2+, with no change in 2.0 or 2.4 mmCa2+. Additionally, after single-pulse stimulation, evoked [DA]o in striatum reached a maximum (tmax) in <200 msec, whereas in SNc, [DA]o continued to rise for 2–3 sec. Similarly, the time for [DA]o to decay to 50% of maximum (t50) was 12-fold longer in SNc than striatum. A delayed tmax in SNc compared with striatum persisted when DA uptake was inhibited by GBR-12909 and D2 autoreceptors were blocked by sulpiride, although these agents eliminated the difference in t50. Together, these data implicate different release mechanisms in striatum and SNc, with minimal Ca2+ required to trigger prolonged DA release in SNc. Coupled with limited uptake, prolonged somatodendritic release would facilitate DA-mediated volume transmission in midbrain.
Keywords: calcium, dopamine, dopamine transporter, substantia nigra pars compacta, voltammetry, volume transmission, synaptic transmission
Dopamine (DA) neurons of the substantia nigra pars compacta (SNc) send axon projections to the dorsal striatum via the median forebrain bundle (Fallon et al., 1978). Importantly, these midbrain cells release DA from somata and dendrites, known as somatodendritic release (Geffen et al., 1976; Nieoullon et al., 1977; Rice et al., 1994; Jaffe et al., 1998), as well as from axon terminals in striatum. Both somatodendritic and terminal release are critical for the control of movement mediated by the basal ganglia (Robertson and Robertson, 1989; Timmerman and Abercrombie, 1996;Crocker, 1997).
Logic might dictate that somatodendritic release is mediated by a novel mechanism, given the novel source of release. However, no known characteristics contradict the original proposal by Geffen et al. (1976) that release in SNc is vesicular and mediated by exocytosis, as it is in striatum. Indeed, somatodendritic DA release is depolarization and Ca2+dependent (Geffen et al., 1976;Cheramy et al., 1981; Rice et al., 1994, 1997) and reserpine-sensitive (Elverfors and Nissbrandt, 1991; Rice et al., 1994; Heeringa and Abercrombie, 1995). Other pharmacological agents, including DA-releasing drugs such as amphetamine, DA transport inhibitors, and D2 autoreceptor antagonists, cause parallel increases in extracellular DA concentration ([DA]o) in SNc and striatum, although to a lesser extent in SNc (Santiago and Westerink, 1992; Heeringa and Abercrombie, 1995; Cragg and Greenfield, 1997; Cragg et al., 1997;Hoffman and Gerhardt, 1999).
In particular, evidence for the Ca2+dependence of release is often taken as confirmatory of vesicular release, because Ca2+ entry is required for exocytosis (Douglas and Rubin, 1963; Simon and Llinás, 1985;Burgoyne and Morgan, 1995; Catterall, 1999). Influx of Ca2+ promotes vesicle fusion via molecular machinery that includes the vesicle membrane proteins synaptobrevin and synaptotagmin, and the presynaptic membrane proteins syntaxin and SNAP-25 (synaptosomal-associated protein of 25 kDa) (Jahn and Südhof, 1994; Catterall, 1999). Moreover, the amount of transmitter released depends on extracellular Ca2+ concentration ([Ca2+]o), with increased Ca2+ entry and enhanced release in elevated [Ca2+]o (Dodge and Rahamimoff, 1967). Consistent with classical exocytosis, axon-terminal DA release in striatum increases with increasing [Ca2+]o bothin vivo (Moghaddam and Bunney, 1989) and in vitro(Chen et al., 2001).
Somatodendritic DA release in SNc also requires Ca2+. In contrast to striatal release, however, evoked DA release in SNc persists in low-Ca2+ media (Hoffman and Gerhardt, 1999). Indeed, prolonged incubation in Ca2+-free media plus EGTA is required to inhibit release by 90% (Rice et al., 1994, 1997), suggesting a potential difference in the Ca2+dependence of somatodendritic versus terminal release.
Despite apparently strong pharmacological support for similar mechanisms of somatodendritic and axon terminal release, the discrepancy in Ca2+ dependence indicated that additional investigation was necessary. To this end, we evaluated [DA]o evoked during pulse-train stimulation in varying [Ca2+]o in striatum and SNc in guinea pig brain slices. Additionally, real-time monitoring of DA release after single-pulse stimulation permitted comparison of the time course of somatodendritic versus terminal release; contributions from differences in DA transporter (DAT) activity and D2 autoreceptor regulation were also assessed.
MATERIALS AND METHODS
Slice preparation and solutions. Male Hartley guinea pigs (150–250 gm) were deeply anesthetized with 40 mg/kg pentobarbital (intraperitoneally) and decapitated. All animal handling procedures were in accordance with National Institutes of Health guidelines and were approved by the New York University School of Medicine Animal Care and Use Committee. Coronal striatal and midbrain slices (400 μm) were prepared as described previously (Rice et al., 1997; Chen et al., 2001) using a Vibratome (Ted Pella, St. Louis, MO). Slice coordinates for midbrain were between 7.3 and 8.3 mm anterior to the interaural line (Smits et al., 1990). All slices were cut in ice-cold HEPES-buffered artificial CSF (ACSF) containing (in mm): 120 NaCl, 5 KCl, 20 NaHCO3, 6.7 HEPES acid, 3.3 HEPES salt, 2 CaCl2, 2 MgSO4, and 10 glucose (saturated with 95% O2–5% CO2). After cutting, slices were bisected and then allowed to recover in HEPES-buffered ACSF for at least 1 hr at room temperature before being transferred to a submersion recording chamber (Warner Instruments, Hamden, CT). Once in the recording chamber, slices were equilibrated for an additional 30 min with ACSF, which contained (in mm): 124 NaCl, 3.7 KCl, 26 NaHCO3, 0, 0.5, 1.5, 2.0, or 2.4 CaCl2, 1.3 MgSO4, 1.3 KH2PO4, and 10 glucose (saturated with 95% O2–5% CO2). Chamber temperature was maintained at 32°C with a flow rate of 1.2 ml/min. The influence of DA uptake and D2 autoreceptor activation on the time course of evoked [DA]o was examined using the selective DAT inhibitor GBR-12909 (0.3 and 2 μm) (Bull et al., 1990; Cragg et al., 1997, 2001) and the D2antagonist sulpiride (1 μm) (Cragg and Greenfield, 1997; Chen et al., 2001).
Microelectrodes and voltammetric instrumentation.Carbon-fiber electrodes made from 7–8 μm carbon fibers (type HM, unsized, Courtaulds) were spark-etched to a tip diameter of 2–4 μm (MPB Electrodes; Queen Mary and Westfield College, London, UK). The voltammetric method used for all experiments was fast-scan cyclic voltammetry (FCV). Data were obtained using a Millar Voltammeter (PD Systems International, West Molesey, UK), with data acquisition controlled by Clampex 7.0 software (Axon Instruments, Foster City, CA), which imported voltammograms to a personal computer via a DigiData 1200B analog-to-digital converter board (Axon Instruments). Scan rate for FCV was 800 V/sec, with a sampling interval of 100 msec controlled by an external timing circuit. Scan rage was −0.7 V to +1.3 V (vs Ag/AgCl). Voltammograms were obtained in two-electrode mode, with an Ag/AgCl wire in the recording chamber as the reference electrode. Electrodes were calibrated in the recording chamber at 32°C with 0.5–2 μm DA in all media used in a given experiment (Kume-Kick and Rice, 1998; Chen and Rice, 1999), e.g., ACSF with varying Ca2+ concentration and/or containing GBR-12909 plus sulpiride. We have reported previously that DA concentrations are stable in oxygenated ACSF at 32°C in the recording chamber (Kume-Kick and Rice, 1998). Evoked [DA]o was calculated using post-experiment DA calibration factors (typically 2–3 nA/μm) to convert measured oxidation current to concentration. Although a relatively high level of GBR-12909 (10 μm) can alter electrode sensitivity to DA (Davidson et al., 2000), the lower concentrations used in the present studies had no effect.
Electrical stimulation. Bipolar stimulating electrodes were made from Teflon-coated platinum wire (50 μm bare, 75 μm coated) with tip separation of ∼50 μm. The electrode was placed on the slice surface with the carbon-fiber microelectrode positioned between the electrical poles and inserted 50–100 μm into the slice, as described previously (Rice et al., 1997; Chen et al., 2001). Pulse-train (10 Hz, 30 pulses) and single-pulse stimulation were used to evoke DA release. Pulse duration was 100 μsec for trains and 1000 μsec for single pulses; pulse amplitude was 0.4–0.8 mA. With these stimulating electrodes and protocols, evoked DA release in SNc is tetrodotoxin sensitive (data not shown), as it is in striatum (Chen et al., 2001). This contrasts with the tetrodotoxin insensitivity of DA release elicited using larger stimulating electrodes and higher stimulus intensity in our previous studies in midbrain and striatum (Rice et al., 1997).
Experimental design. In striatum, consistent evoked [DA]o can be elicited with repetitive local stimulation (Bull et al., 1990; Chen et al., 2001). Here, striatal DA release was evoked at 10 min intervals in both pulse-train and single-pulse experiments. For Ca2+-dependence studies in striatum, the third of three consistent evoked increases in [DA]o was included in data averages for each [Ca2+]o. For initial uptake and autoreceptor studies in striatum, one-pulse control records were obtained, and then GBR-12909 plus sulpiride applied. Maximal effects were seen after 1 hr. For subsequent studies in striatum, slices were preincubated for 1 hr in these agents, and the third of three consistent records was used in data averages; similar results were obtained with both protocols. The contralateral hemisphere served as the control for experiments in which preincubation was used. In SNc, maximal release is seen with the first stimulus and then progressively decreases with repetition (Rice et al., 1997). Thus, for measurements in SNc with varying Ca2+, pulse-train-evoked DA release was obtained in medial SNc in a given [Ca2+]o; a different [Ca2+]owas tested on the contralateral side. For single-pulse studies with GBR-12909 and sulpiride in SNc, one hemisphere of a given midbrain slice was superfused with the drugs for 1 hr; the contralateral side served as the paired control and was superfused with ACSF for 1 hr before release was elicited.
Drugs and chemicals. Sulpiride, DA, and components of ACSF and HEPES–ASCF were obtained from Sigma (St. Louis, MO); GBR-12909 was from Research Biochemicals (Natick, MA). All solutions were made immediately before use.
Statistical analysis. All data are given as means ± SEM, in which n is the number of slices. Differences in evoked [DA]o in varying Ca2+ were assessed using one-way ANOVA, followed by Kruskal–Wallis post hoc analysis of maximum evoked [DA]o. Differences in the time course of increases in [DA]o between SNc and striatum and after DAT and autoreceptor inhibition in each region were assessed using t test comparisons of time of maximum [DA]o (tmax) of the time after the stimulus at which [DA]ohad decayed to 50% of the maximum (t50).
RESULTS
Under most conditions examined, absolute levels of evoked [DA]o differed between SNc and striatum. To facilitate comparisons among different conditions between regions, therefore, the data were normalized with respect to a defined control condition for each region (100%). Data are illustrated as percentage of control, with peak [DA]o for each condition indicated in the text. For analysis of the Ca2+ dependence of release, maximum evoked [DA]o in 1.5 mmCa2+ in striatum or in SNc was considered to be 100% for that region, because that was the concentration in which [DA]o was maximal in SNc.
Ca2+ dependence of evoked DA release in striatum and SNc
In striatum, DA release elicited by a train of 30 pulses delivered at 10 Hz showed a marked dependence on [Ca2+]o (Fig.1A). Release was below detection limits after 30 min superfusion of ACSF with nominally 0 or 0.5 mm Ca2+ and then increased progressively with increasing [Ca2+]o. Peak [DA]o was 0.65 ± 0.05 μm (n = 17) in 1.5 mm Ca2+, 1.10 ± 0.13 μm (n = 10) in 2.0 mm Ca2+, and 1.81 ± 0.14 μm (n = 6) in 2.4 mm Ca2+ (Fig.1A). Each increase in [DA]owas significantly higher than in the previous Ca2+ (p < 0.001). Taking maximum evoked [DA]o in 1.5 mm Ca2+ as 100%, increasing Ca2+ to 2.0 mm caused an increase in [DA]o to 170%, with an additional increase to 280% in 2.4 mm [DA]o(Fig. 2). These data suggest an approximately exponential dependence of DA release from striatal terminals on [Ca2+]o.
Fig. 1.
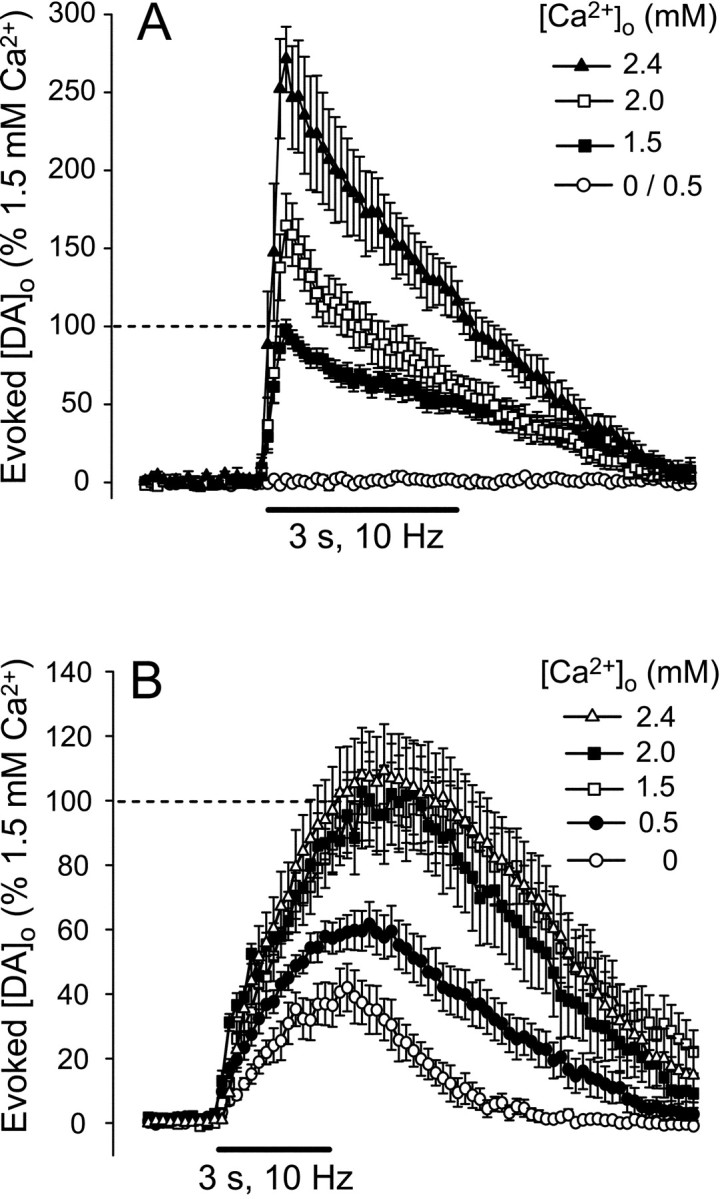
Evoked [DA]o in the presence of varying [Ca2+]o in striatum and SNc. Average evoked [DA]o during pulse-train stimulation (10 Hz, 30 pulses) in striatum (A) and SNc (B) in 0, 0.5, 1.5, 2.0, and 2.4 mmCa2+. Maximum [DA]o in 1.5 mm was taken as 100%. In striatum, peak [DA]o was significantly increased by each step increase in [Ca2+]o(p < 0.001; 0 and 0.5 mmCa2+; data from striatum were pooled). In SNc, significant increases were observed between 0 and 0.5 and 1.5 mmCa2+ (p < 0.01); however, no additional increases were seen in 2.0 or 2.4 mmCa2+. Data are means ± SEM (n = 6–17). The dashed linesindicate 100%, and solid bars indicate the stimulation period. Note the difference in time scale between A andB.
Fig. 2.
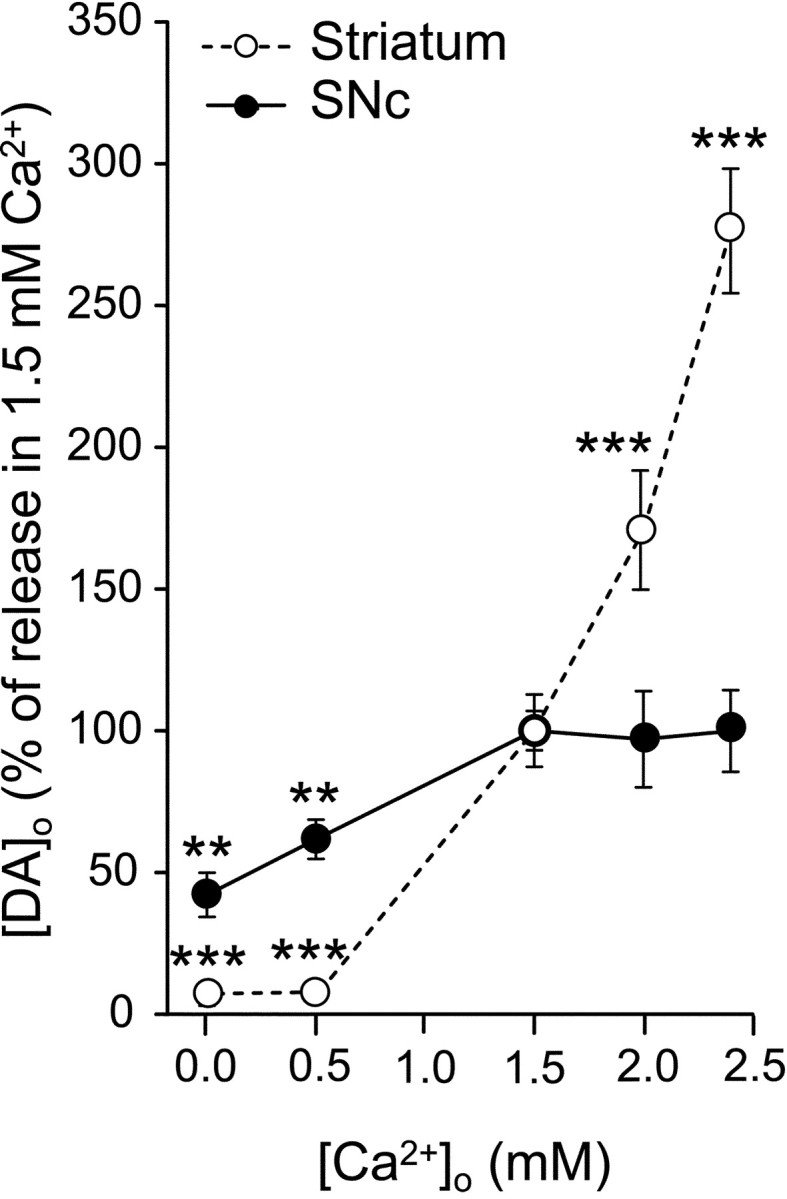
Ca2+ dependence of evoked DA release in striatum and SNc. Data were normalized such that 100% is the average maximum evoked [DA]o during pulse-train stimulation (3 sec, 10 Hz) in 1.5 mmCa2+. In striatum, evoked [DA]oincreased progressively with increasing Ca2+ from 1.5 to 2.4 mm. In contrast, DA release was nearly half-maximal in nominally 0 mm Ca2+ in SNc but reached a plateau at 1.5 mmCa2+. Data are means ± SEM (n = 6–17). **p < 0.01 and ***p < 0.001 indicates difference from the response in 1.5 mm Ca2+ for each region.
Evoked [DA]o in the SNc showed a dependence on [Ca2+]o that was opposite to that seen in striatum (Fig. 1B). In SNc, DA release was readily detected in nominally 0 mmCa2+, with an average maximum [DA]o of 0.30 ± 0.06 μm (n = 7) (Fig.1B). Evoked [DA]o increased significantly when [Ca2+]o was increased to 0.5 mmCa2+ (0.49 ± 0.05 μm; n = 8) and again in 1.5 mm Ca2+ (0.78 ± 0.09 μm; n = 14;p < 0.01 for each increase). Somatodendritic DA release was maximal in 1.5 mmCa2+, however, with no additional increases in 2.0 or 2.4 mmCa2+ (0.76 ± 0.12 μm in 2.0 mmCa2+, n = 8; 0.79 ± 0.10 μm in 2.4 mmCa2+, n = 24) (Fig.1B). This plateau could be clearly seen when [DA]o was plotted against [Ca2+]o (Fig. 2; again taking evoked [DA]o in 1.5 mm Ca2+ as 100%). This suggests that somatodendritic DA release is relatively Ca2+ independent beyond a minimal range of [Ca2+]o required to trigger release.
Because [DA]o is more strongly limited by DA uptake and D2 autoreceptor activation in striatum than in SNc (Cragg and Greenfield, 1997; Cragg et al., 1997, 2001;Hoffman and Gerhardt, 1999), low release in 0 mmCa2+ in striatum could appear to be no release if [DA]o were kept below detection limits by uptake or autoreceptor-mediated inhibition. To test this, we evaluated striatal release evoked by pulse-train stimulation (10 Hz, 30 pulses) in 0 mm Ca2+ in the presence of the DAT inhibitor GBR-12909 (2 μm) (Cragg et al., 2001) and the D2 autoreceptor antagonist sulpiride (1 μm) (Cragg and Greenfield, 1997; Chen et al., 2001). Under these conditions, there was still no detectable increase in evoked [DA]o in striatum in 0 Ca2+ (n = 5; data not shown).
Differing time course of evoked [DA]o in striatum and SNc
A second difference between terminal and somatodendritic DA behavior was indicated by the distinct time course of evoked [DA]o during pulse-train stimulation in striatum versus SNc. In striatum, [DA]o rose to a maximum within the first two to five pulses of the train and then decayed during continued stimulation (Fig. 1A). In contrast, evoked [DA]o in the SNc not only increased throughout the stimulus train but also continued to rise for 1–2 sec after the train ended, with the exception of the response in 0 mm Ca2+ (Fig.1B). To characterize the time courses of these responses more fully, we used single-pulse stimulation to evoke DA release; 2.4 mm Ca2+was used to ensure reproducible evoked [DA]o in striatum.
Single-pulse stimulation elicited consistent DA release in both striatum and SNc (Fig. 3). As in pulse-train experiments, the time course of the responses differed markedly between these regions (Fig. 3A). Whereas the time of maximal evoked [DA]o(tmax) was <200 msec after stimulus onset in striatum (190 ± 40 msec; n = 8), in SNc, evoked [DA]o did not reach a maximum for 2–3 sec in SNc (2490 ± 460 msec; n = 9) (p < 0.001 for SNc vs striatum). Importantly, the released substance was clearly identified as DA in both regions by the characteristic DA voltammograms recorded at the response maxima (Fig. 3B). The return to baseline was also more rapid in striatum than in SNc, with values fort50 (the time after stimulus at which maximal [DA]o had fallen by 50%) of 540 ± 80 msec (n = 8) in striatum and 6400 ± 240 msec (n = 9) in SNc (p < 0.001; SNc vs striatum).
Fig. 3.
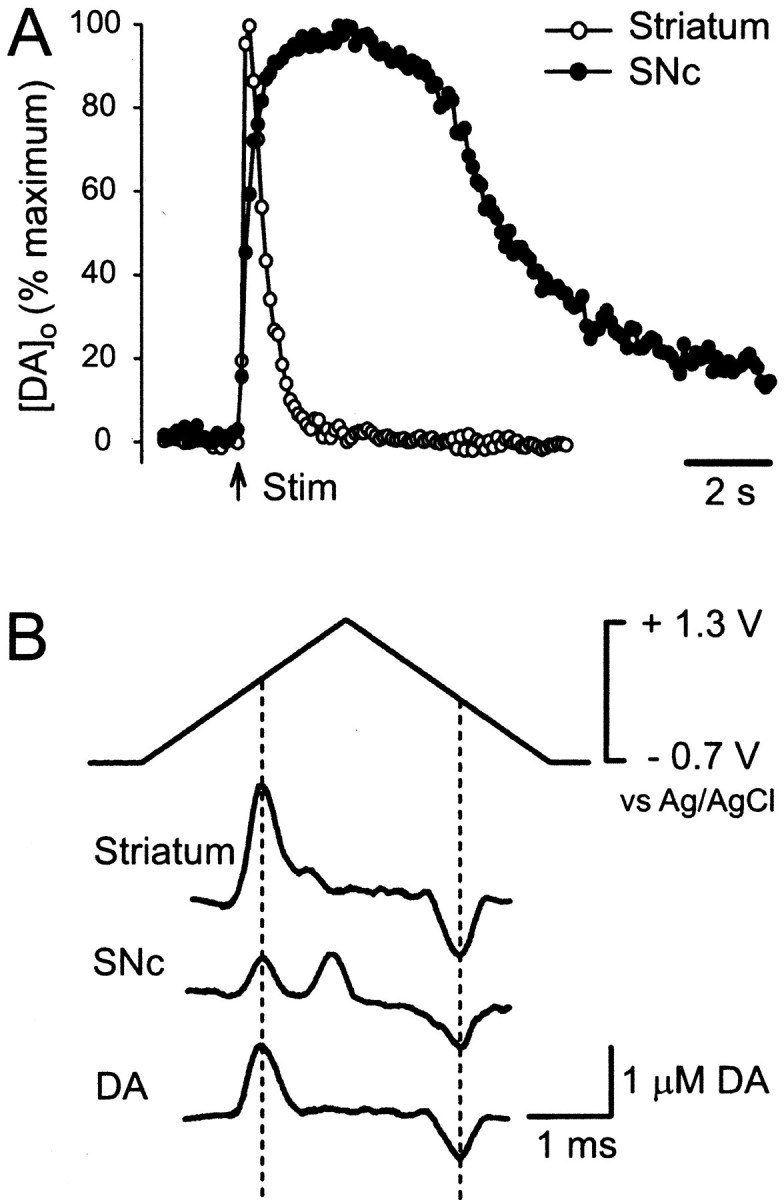
Time course of evoked [DA]o in striatum and SNc after single-pulse stimulation. A, Average evoked [DA]o by a single pulse (1 msec) in striatum (n = 8) and SNc (n = 9) (error bars have been omitted for clarity; see Fig. 4). The pattern of release differed significantly, as indicated by the difference in the time of maximum [DA]o(tmax) and time to decay to 50% of maximum (t50) (p < 0.001 for both parameters; see Results for details). B, DA voltammograms recorded at the time of the maximum evoked [DA]o in striatum and SNc compared with a 1 μm DA calibration voltammogram; these characteristic voltammograms confirm the identity of the released substance as DA (Rice et al., 1997; Chen et al., 2001).
Like [DA]o amplitude, as discussed above, the duration of stimulated increases in [DA]o can also be curtailed by DA uptake and D2autoreceptor activation, again with greater efficacy in striatum than in SNc (Cragg and Greenfield, 1997; Cragg et al., 1997, 2001; Jones et al., 1998; Hoffman and Gerhardt, 1999). To address the extent to which these factors might differentially influence time course in the present studies, we examined two concentrations of GBR-12909 (0.3 and 2 μm) (Cragg et al., 1997, 2001) in the presence of a single, supramaximal concentration of the D2autoreceptor antagonist sulpiride (1 μm) (Cragg and Greenfield, 1997; Chen et al., 2001). Consistent with the anticipated effects of these drugs, evoked increases in [DA]o elicited by single-pulse stimulation were enhanced and prolonged in both striatum (Fig.4A) and SNc (Fig.4B). In striatum, peak [DA]oincreased to ∼200% of control in either 0.3 or 2 μm GBR plus sulpiride (p< 0.001; n = 6–8) (Fig. 4A). The enhancement was similar in SNc, with an increase to ∼165% of control (p < 0.05; n = 9); in SNc, [DA]o records in 0.3 and 2 μm GBR-12909 were indistinguishable and were pooled (Fig. 4B).
Fig. 4.

Influence of DAT and D2 autoreceptor inhibition on evoked [DA]o in striatum and SNc after single-pulse stimulation. In the presence of GBR-12909 (GBR; 0.3 or 2 μm) and sulpiride (sulp; 1 μm), average maximum [DA]o evoked by a single pulse (1 msec) was significantly higher than in controls in striatum (A;p < 0.001 for both 0.3 and 2 μmGBR-12909; n = 6–8) and SNc (B;p < 0.05 for pooled data from 0.3 and 2 μm GBR-12909; n = 9) (see Results for details). Data are means ± SEM; the average maximum [DA]o in control conditions was taken as 100% for each region, indicated by the dashed lines.
The changes in time course could best be seen when the curves were normalized, such that maximum [DA]o for each region and condition was set to 100% (Fig.5). In striatum, the entire response was prolonged in a dose-dependent manner: in 0.3 μm GBR plus sulpiride, tmax increased to 670 ± 90 msec (n = 6), with an additional increase to 1700 ± 110 msec (n = 8) in 2 μm GBR plus sulpiride (Fig. 5A). Similarly, t50 increased to 1980 ± 330 msec in 0.3 μm GBR and to 8500 ± 670 msec in 2 μm GBR. All differences intmax andt50 between control and each GBR concentration were significant (p < 0.001) (Fig. 5A). The changes in [DA]o time course in SNc were much less dramatic than those in striatum, with similar effects in either 300 nm or 2 μm GBR-12909 plus sulpiride, as noted above. Although there was no change in the rising phase of DA records, the falling phase was clearly prolonged (Fig. 5B). In fact, the slightly higher tmax (3180 ± 410 msec; n = 9) did not differ significantly from control (p > 0.05), whereas the 30% increase int50 to 8320 ± 550 msec (n = 9) was significantly later (p < 0.01).
Fig. 5.
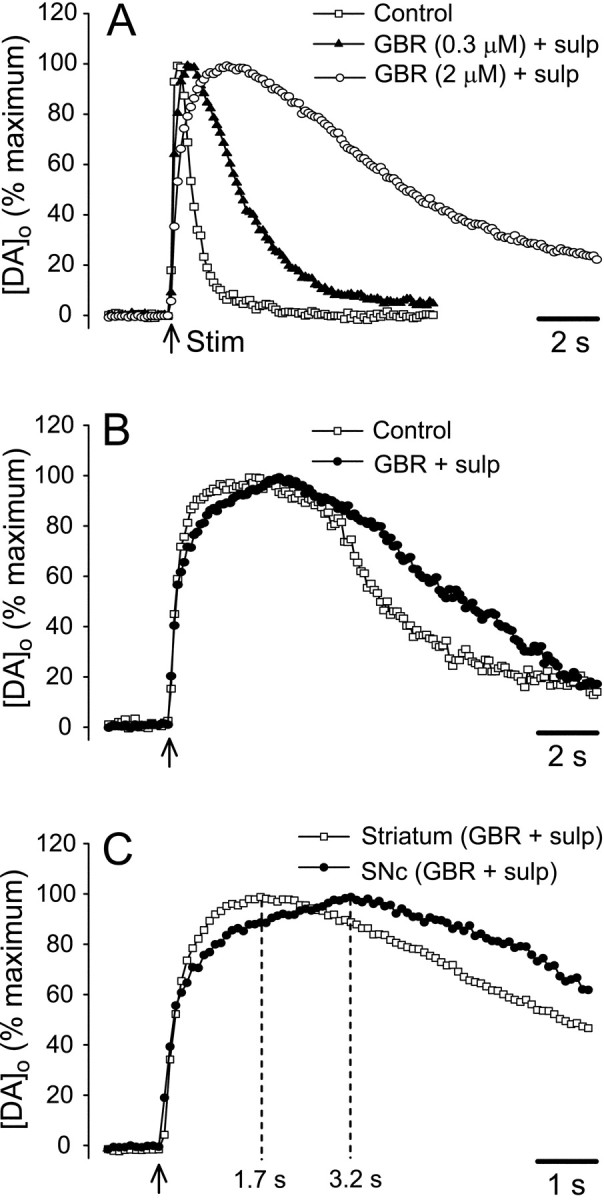
Normalized evoked [DA]o curves indicate differences in time course between SNc versus striatum. Average [DA]o evoked by a single pulse in striatum (A) and SNc (B) in the presence and absence of GBR-12909 (GBR) plus sulpiride (sulp), with the maximum for each condition normalized to 100%. In striatum, both the tmax andt50 of evoked [DA]o increased significantly in GBR-12909 in a concentration-dependent manner (p < 0.001 for each step compared with control; n = 6–8). Although thet50 in SNc was also increased compared with control (p < 0.01; n = 9 for pooled data from 0.3 and 2 μm GBR-12909),tmax was not altered (p > 0.05). C, When normalized curves for evoked [DA]o in SNc and striatum in maximally effective GBR-12909 plus sulpiride were superimposed on an expanded time scale, the overall time courses were similar (compare with Fig. 3A), with t50 values that did not differ significantly (p > 0.05). The time to reach maximum [DA]o,tmax, however, remained significantly longer in the SNc (p < 0.01); dashed lines indicate tmax for each region. Data are normalized means; error bars have been omitted for clarity (see Fig. 4).
With complete blockade of the DAT and D2autoreceptors, DA overflow curves from striatum and SNc became much more similar (compare Figs. 3A, 5C), primarily because of the much greater changes in DA behavior in striatum. Under these conditions, the initial rising phases of the curves were similar, and the t50values for the two regions were statistically indistinguishable (p > 0.05). In SNc, however, [DA]o continued to increase after the falling phase in striatum had already begun, so that a difference intmax between terminal and somatodendritic release persisted (Fig. 5C). The averagetmax in striatum (1700 msec) was significantly earlier than the time to reach maximum in SNc (3180 msec) (p < 0.01). Moreover, [DA]o in SNc also remained near this maximum for a longer period than in striatum, suggesting more sustained release (Fig. 5C).
DISCUSSION
The present comparative studies of the Ca2+ dependence and kinetics of DA release in striatum and SNc offer important new insights into both axon terminal and somatodendritic processes. Key results include demonstration of the dependence of evoked [DA]oin striatum on [Ca2+]o. These data are consistent with previous results showing that basal [DA]o in DA terminal regions is higher when sampled using microdialysis solutions with elevated Ca2+ (Moghaddam and Bunney, 1989). Even more intriguing is the relative independence of evoked [DA]o in SNc on [Ca2+]o. Together with the longer time to reach maximum [DA]o in SNc compared with striatum, even in the presence of complete DAT and autoreceptor blockade, these data argue for different underlying mechanisms of axon terminal and somatodendritic release.
Previous studies have questioned classical exocytotic release in the substantia nigra on anatomical grounds: synaptic sites available for vesicle fusion are rare. Although dendrodendritic synapses have been described in the SNc (Wilson et al., 1977), these are primarily absent in the SN pars reticulata (SNr) and thus comprise <1% of synaptic input to DA dendrites (Groves and Linder, 1983). Moreover, depolarization-induced DA release can be elicited from the SNr in isolation (Geffen et al., 1976; Rice et al., 1994), suggesting that dendrodendritic synapses are not required for release. Moreover, the number of vesicles in DA somata and dendrites is small. Whereas vesicles are densely localized in identified DA terminals in striatum (Nirenberg et al., 1996a, 1997), there are few vesicles in DA dendrites SNc (Wilson et al., 1977; Groves and Linder 1983; Nirenberg et al., 1996a), implying a limited source for exocytotic release (Nirenberg et al., 1996a). However, somatodendritic DA is stored in saccules of smooth endoplasmic reticulum (Mercer et al., 1978; Wassef et al., 1981), as well as in vesicles (Wilson et al., 1977; Groves and Linder, 1983). Consistent with dual storage sites, the vesicular monoamine transporter VMAT2 is expressed in tuberovesicles that appear to be saccules of smooth endoplasmic reticulum and, less commonly, in vesicles (Nirenberg et al., 1996b). Whether both storage sites contribute to the releasable pool of DA is unknown. Both sites would be susceptible to the DA-depleting actions of reserpine, an irreversible inhibitor of VMAT2, which weakens the argument that reserpine sensitivity indicates vesicular release (Heeringa and Abercrombie, 1995).
Differing Ca2+ dependence and kinetics of somatodendritic versus terminal release
In contrast to evoked [DA]o in striatum, which fell below detectable levels in nominally 0 mmCa2+ even when DA uptake and D2 autoreceptors were blocked, DA release in SNc persisted in 0 mm Ca2+ (Figs.1, 2), consistent with earlier studies (Hoffman and Gerhardt, 1999). Indeed, evoked [DA]o was half-maximal in 0 mm Ca2+. Moreover, evoked DA release from synaptic terminals in striatum continued to increase with increasing [Ca2+]o, whereas somatodendritic release was maximal at 1.5 mmCa2+. These data demonstrate a remarkably limited dynamic range for regulation of somatodendritic release of DA by [Ca2+]o (Fig.2). Somatodendritic release does require Ca2+, however, because evoked release can be primarily eliminated by extended incubation in 0 mmCa2+ plus 1 mm EGTA and then restored when Ca2+ is added back to the medium (Rice et al., 1994, 1997). Together, these results suggest that a minimal level of Ca2+ entry may trigger somatodendritic DA release by a process that is distinct from the classical, Ca2+-dependent exocytotic release from axon terminals in striatum.
Additional evidence for differing mechanisms comes from the prolonged time course of release in SNc compared with striatum (Fig. 3). It is well established that both evoked and exogenously introduced increases in [DA]o in striatum are enhanced and prolonged when the DAT is inhibited or eliminated (Bull et al., 1990; Kawagoe et al., 1992; Cass et al., 1993; Cragg et al., 1997; Jones et al., 1998) or when D2 autoreceptors are blocked (Cass and Gerhardt, 1994; Cragg and Greenfield, 1997; Hoffman and Gerhardt 1999). Similar, albeit smaller, increases in evoked [DA]o in SNc have also been reported after DAT inhibition (Cragg et al., 1997, 2001) or D2antagonism (Cragg and Greenfield, 1997; Hoffman and Gerhardt, 1999). The effect of these agents on the time course of evoked [DA]o in SNc had not been described previously.
As anticipated, the effect of GBR-12909 plus sulpiride on [DA]o time course was much greater in striatum than SNc (Fig. 4), consistent with the higher expression the DAT in striatum (Donnan et al., 1991; Ciliax et al., 1995; Freed et al., 1995); similar regional comparisons of D2autoreceptor expression are not available. The main effect on time course is likely to be from DAT inhibition, however. Indeed, the concentration-dependent effects of GBR-12909 on [DA]o time course in striatum in the presence of constant sulpiride levels were strikingly similar to the effects of graded DAT loss on single-pulse-evoked DA overflow in wild-type versus heterozygous and homozygous DAT knock-out mice (Jones et al., 1998). Moreover, previous studies have shown that D2receptor antagonism does not alter peak [DA]oevoked with brief (100 msec), high-frequency stimulation in either striatum or SNc (Cragg and Greenfield, 1997; Chen et al., 2001), reflecting minimal D2 receptor occupancy and efficacy within this time window (Singer, 1988). Because of known interactions between D2 activation and DAT activity (Meiergerd et al., 1993; Parsons et al., 1993; Cass and Gerhardt, 1994; Wieczorek and Kruk, 1994; Hoffman et al., 1999), however, sulpiride was included with GBR-12909 in the present studies to prevent possible synergistic interactions.
Whereas differences in DA clearance (t50) between striatum and SNc were eliminated when DA uptake and autoreceptor-mediated suppression of release were inhibited, a significant difference intmax remained (Fig. 5C). Because synaptic DA release in striatum presumably occurs within milliseconds of a stimulus (Garris and Wightman, 1995), atmax of >1 sec presumably reflected the time required for diffusion to the electrode from distant sites. The difference in tmax between SNc and striatum, however, cannot be explained by differences in diffusion properties. Although the extracellular volume fraction (α) is 50% larger in SNc than in striatum (Cragg et al., 2001), this parameter will influence the amplitude of [DA]o but not its time course. More importantly, the geometric parameter that governs the apparent diffusion coefficient of a substance in tissue, the tortuosity factor λ, is similar in these regions (Rice and Nicholson, 1991; Cragg et al., 2001) and could not contribute to the twofold difference in tmax.
Implications
In combination, the differences in the Ca2+ dependence and time course of DA release in SNc and striatum point to an underlying difference in release as well as termination characteristics. The most plausible sources of release differences might be in Ca2+ entry and/or regulation or in the releasable pool of DA in somata and dendrites versus axon terminals. Indeed, Wilson and Callaway (2000) showed recently that intracellular Ca2+ concentration ([Ca2+]i) in DA cells of the SNc builds up slowly during a depolarizing step induced by current injection and then persists for a second or more in dendrites and soma when the depolarizing current stops. Time-dependent rather than concentration-dependent Ca2+ entry, therefore, might contribute to the relative independence of evoked [DA]o in SNc on Ca2+ above a certain minimal level. Slow clearance of an increase in [Ca2+]i might also contribute to protracted DA release (Wilson and Callaway, 2000), possibly by facilitating fusion of multiple vesicles rather than the single vesicle assumed in classic synaptic transmission (Triller and Korn, 1982; Stevens, 1993; Matveev and Wang, 2000) or fusion of additional or alternative structures, such as tuberovesicles, which store DA (Mercer et al., 1978; Wassef et al., 1981; Nirenberg et al., 1996b) and conceivably could participate in nonclassical somatodendritic release. Release from multiple compartments, i.e., dendrites and somata (Rice et al., 1994; Jaffe et al., 1998), might also contribute. The behavior of evoked [DA]oin SNc after single-pulse stimulation is consistent with multiple sources or sites of release. After an initially rapid rise in [DA]o that is similar in SNc and striatum (Fig.5C), the subsequent increase in [DA]o in SNc is slower and more sustained, such that tmax in SNc occurs after [DA]o in striatum has already begun to return to baseline (here by diffusion, because uptake was inhibited) (Fig.5C).
Regardless of release mechanism, delayed and prolonged increases in [DA]o in midbrain after a single stimulus have implications for DA as a mediator of volume transmission. In SNc and SNr, DA receptors on DA cell bodies and dendrites are primarily extrasynaptic (Sesack et al., 1994; Yung et al., 1995; Nirenberg et al., 1996a, 1997). Extrasynaptic D1 receptors are also found on nondopaminergic terminals in these regions (Yung et al., 1995). Physiological studies suggest that somatodendritically released DA acting at these receptors modulates GABA release from presumed striatonigral GABAergic afferents to SNr (Miyazaki and Lacey, 1998;Radnikow and Misgeld, 1998). Similarly, DA cells in the adjacent ventral tegmental area (VTA) also exhibit somatodendritic release of DA (Iravani et al., 1996; Rice et al., 1997), which can act at extrasynaptic receptors to modulate release of GABA and glutamate in VTA (Cameron and Williams, 1993; Koga and Momiyama, 2000) and which may influence glutamate-mediated plasticity in VTA neurons (Ungless et al., 2001). Thus, to mediate physiological responses, somatodendritically released DA relies on extracellular diffusion to reach its sites of action, which exemplifies volume transmission (Fuxe and Agnati, 1991;Rice, 2000). Prolonged somatodendritic release, as shown in the present studies in SNc, combined with limited DA uptake and D2 autoreceptor control (Cragg and Greenfield 1997; Cragg et al., 1997, 2001), will facilitate DA-mediated volume transmission in midbrain.
Footnotes
This study was supported by National Institute of Neurological Disorders and Stroke Grant NS-36362. We appreciate helpful discussions with Dr. M. V. Avshalumov.
Correspondence should be addressed to Dr. M. E. Rice, Department of Physiology and Neuroscience, New York University School of Medicine, 550 First Avenue, New York, NY 10016. E-mail: margaret.rice@nyu.edu.
REFERENCES
- 1.Bull DR, Palij P, Sheehan MJ, Millar J, Stamford JA, Kruk ZL, Humphrey PP. Application of fast cyclic voltammetry to measurement of electrically evoked dopamine overflow from brain slices in vitro. J Neurosci Methods. 1990;32:37–44. doi: 10.1016/0165-0270(90)90069-r. [DOI] [PubMed] [Google Scholar]
- 2.Burgoyne RD, Morgan A. Ca2+ and secretory-vesicle dynamics. Trends Neurosci. 1995;18:191–196. doi: 10.1016/0166-2236(95)93900-i. [DOI] [PubMed] [Google Scholar]
- 3.Cameron DL, Williams JT. Dopamine D1 receptors facilitate transmitter release. Nature. 1993;366:344–347. doi: 10.1038/366344a0. [DOI] [PubMed] [Google Scholar]
- 4.Cass WA, Gerhardt GA. Direct in vivo evidence that D2 dopamine receptors can modulate dopamine uptake. Neurosci Lett. 1994;176:259–263. doi: 10.1016/0304-3940(94)90096-5. [DOI] [PubMed] [Google Scholar]
- 5.Cass WA, Zahniser NR, Flach KA, Gerhardt GA. Clearance of exogenous dopamine in rat dorsal striatum and nucleus accumbens: role of metabolism and effects of locally applied uptake inhibitors. J Neurochem. 1993;61:2269–2278. doi: 10.1111/j.1471-4159.1993.tb07469.x. [DOI] [PubMed] [Google Scholar]
- 6.Catterall WA. Interactions of presynaptic Ca2+ channels and snare proteins in neurotransmitter release. Ann NY Acad Sci. 1999;868:144–159. doi: 10.1111/j.1749-6632.1999.tb11284.x. [DOI] [PubMed] [Google Scholar]
- 7.Chen BT, Rice ME. Calibration factors for cationic and anionic neurochemicals at carbon-fiber microelectrodes are oppositely affected by the presence of Ca2+ and Mg2+. Electroanalysis. 1999;11:344–348. [Google Scholar]
- 8.Chen BT, Avshalumov MV, Rice ME. H2O2 is a novel, endogenous modulator of synaptic dopamine release. J Neurophysiol. 2001;85:2468–2476. doi: 10.1152/jn.2001.85.6.2468. [DOI] [PubMed] [Google Scholar]
- 9.Cheramy A, Leviel V, Glowinski J. Dendritic release of dopamine in the substantia nigra. Nature. 1981;289:537–542. doi: 10.1038/289537a0. [DOI] [PubMed] [Google Scholar]
- 10.Ciliax BJ, Heilman C, Demchyshyn LL, Pristupa ZB, Ince E, Hersch S, Niznik HB, Levey AI. The dopamine transporter: immunocytochemical characterization and localization in brain. J Neurosci. 1995;15:1714–1723. doi: 10.1523/JNEUROSCI.15-03-01714.1995. [DOI] [PMC free article] [PubMed] [Google Scholar]
- 11.Cragg SJ, Greenfield SA. Differential autoreceptor control of somatodendritic and axon terminal dopamine release in substantia nigra, ventral tegmental area, and striatum. J Neurosci. 1997;17:5738–5746. doi: 10.1523/JNEUROSCI.17-15-05738.1997. [DOI] [PMC free article] [PubMed] [Google Scholar]
- 12.Cragg SJ, Rice ME, Greenfield SA. Heterogeneity of electrically-evoked dopamine release and uptake between substantia nigra, ventral tegmental area and striatum. J Neurophysiol. 1997;77:863–873. doi: 10.1152/jn.1997.77.2.863. [DOI] [PubMed] [Google Scholar]
- 13.Cragg SJ, Nicholson C, Kume-Kick J, Tao L, Rice ME. Dopamine-mediated volume transmission in midbrain is regulated by distinct extracellular geometry and uptake. J Neurophysiol. 2001;85:1761–1771. doi: 10.1152/jn.2001.85.4.1761. [DOI] [PubMed] [Google Scholar]
- 14.Crocker AD. The regulation of motor control: and evaluation of the role of dopamine receptors in the substantia nigra. Rev Neurosci. 1997;8:55–76. doi: 10.1515/revneuro.1997.8.1.55. [DOI] [PubMed] [Google Scholar]
- 15.Davidson C, Ellinwood EH, Douglas SB, Lee TH. Effect of cocaine, nomifensine, GBR 12909 and WIN 35428 on carbon fiber microelectrode sensitivity for voltammetric recording of dopamine. J Neurosci Methods. 2000;101:75–83. doi: 10.1016/s0165-0270(00)00264-8. [DOI] [PubMed] [Google Scholar]
- 16.Dodge FA, Jr, Rahamimoff R. Cooperative action of calcium ions in transmitter release at the neuromuscular junction. J Physiol (Lond) 1967;193:419–432. doi: 10.1113/jphysiol.1967.sp008367. [DOI] [PMC free article] [PubMed] [Google Scholar]
- 17.Donnan GA, Kaczmarczyk SJ, Paxinos G, Chilco PJ, Kalnins RM, Woodhouse DG, Mendelsohn FA. Distribution of catecholamine uptake sites in human brain as determined by quantitative [3H]mazindol autoradiography. J Comp Neurol. 1991;304:19–34. doi: 10.1002/cne.903040307. [DOI] [PubMed] [Google Scholar]
- 18.Douglas WW, Rubin RP. The mechanism of catecholamine re- lease from the adrenal medulla and the role of calcium in stimulation-secretion coupling. J Physiol (Lond) 1963;167:288–310. doi: 10.1113/jphysiol.1963.sp007150. [DOI] [PMC free article] [PubMed] [Google Scholar]
- 19.Elverfors A, Nissbrandt H. Reserpine-insensitive dopamine release in the substantia nigra? Brain Res. 1991;557:5–12. doi: 10.1016/0006-8993(91)90109-9. [DOI] [PubMed] [Google Scholar]
- 20.Fallon JH, Riley JN, Moore RY. Substantia nigra dopamine neurons: separate populations project to neostriatum and allocortex. Neurosci Lett. 1978;7:157–162. doi: 10.1016/0304-3940(78)90160-x. [DOI] [PubMed] [Google Scholar]
- 21.Freed C, Revay R, Vaughan RA, Kriek E, Grant S, Uhl GR, Kuhar MJ. Dopamine transporter immunoreactivity in rat brain. J Comp Neurol. 1995;359:340–349. doi: 10.1002/cne.903590211. [DOI] [PubMed] [Google Scholar]
- 22.Fuxe K, Agnati LF. Volume transmission in the brain. Raven; New York: 1991. [Google Scholar]
- 23.Garris PA, Wightman RM. Regional differences in dopamine release, uptake, and diffusion measured by fast-scan cyclic voltammetry. In: Boulton AA, Baker GB, Adams RN, editors. Neuromethods, Vol 27, Voltammetric methods in brain systems. Humana; Totowa, NJ: 1995. pp. 179–220. [Google Scholar]
- 24.Geffen LB, Jessell TM, Cuello AC, Iversen LL. Release of DA from dendrites in rat substantia nigra. Nature. 1976;260:258–260. doi: 10.1038/260258a0. [DOI] [PubMed] [Google Scholar]
- 25.Groves PM, Linder JC. Dendro-dendritic synapses in substantia nigra: descriptions based on analysis of serial sections. Exp Brain Res. 1983;49:209–217. doi: 10.1007/BF00238581. [DOI] [PubMed] [Google Scholar]
- 26.Heeringa MJ, Abercrombie ED. Biochemistry of somatodendritic dopamine release in the substantia nigra: an in vivo comparison with striatal dopamine release. J Neurochem. 1995;65:192–200. doi: 10.1046/j.1471-4159.1995.65010192.x. [DOI] [PubMed] [Google Scholar]
- 27.Hoffman AF, Gerhardt GA. Differences in pharmacological properties of dopamine release between the substantia nigra and striatum: an in vivo electrochemical study. J Pharmacol Exp Ther. 1999;289:455–463. [PubMed] [Google Scholar]
- 28.Hoffman AF, Zahniser NR, Lupica CR, Gerhardt GA. Voltage-dependency of the dopamine transporter in the rat substantia nigra. Neurosci Lett. 1999;260:105–108. doi: 10.1016/s0304-3940(98)00951-3. [DOI] [PubMed] [Google Scholar]
- 29.Iravani MM, Muscat R, Kruk ZL. Comparison of somatodendritic and axon terminal dopamine release in the ventral tegmental area and the nucleus accumbens. Neuroscience. 1996;70:1025–1037. doi: 10.1016/0306-4522(95)00396-7. [DOI] [PubMed] [Google Scholar]
- 30.Jaffe EH, Marty A, Schulte A, Chow RH. Extrasynaptic vesicular transmitter release from the somata of substantia nigra neurons in rat midbrain slices. J Neurosci. 1998;18:3548–3553. doi: 10.1523/JNEUROSCI.18-10-03548.1998. [DOI] [PMC free article] [PubMed] [Google Scholar]
- 31.Jahn R, Südhof TC. Synaptic vesicles and exocytosis. Annu Rev Neurosci. 1994;17:219–246. doi: 10.1146/annurev.ne.17.030194.001251. [DOI] [PubMed] [Google Scholar]
- 32.Jones SR, Gainetdinov RR, Jaber M, Giros B, Wightman RM, Caron MG. Profound neuronal plasticity in response to inactivation of the dopamine transporter. Proc Natl Acad Sci USA. 1998;95:4029–4034. doi: 10.1073/pnas.95.7.4029. [DOI] [PMC free article] [PubMed] [Google Scholar]
- 33.Kawagoe KT, Garris PA, Wiedemann DJ, Wightman RM. Regulation of transient dopamine concentration gradients in the microenvironment surrounding nerve terminals in the rat striatum. Neuroscience. 1992;51:55–64. doi: 10.1016/0306-4522(92)90470-m. [DOI] [PubMed] [Google Scholar]
- 34.Koga E, Momiyama T. Presynaptic dopamine D2-like receptors inhibit excitatory transmission onto rat ventral tegmental dopaminergic neurones. J Physiol (Lond) 2000;523:163–173. doi: 10.1111/j.1469-7793.2000.t01-2-00163.x. [DOI] [PMC free article] [PubMed] [Google Scholar]
- 35.Kume-Kick J, Rice ME. Dependence of dopamine calibration factors on media Ca2+ and Mg2+ at carbon-fiber microelectrodes used with fast-scan cyclic voltammetry. J Neurosci Methods. 1998;84:55–62. doi: 10.1016/s0165-0270(98)00087-9. [DOI] [PubMed] [Google Scholar]
- 36.Matveev V, Wang XJ. Implications of all-or-none synaptic transmission and short-term depression beyond vesicle depletion: a computational study. J Neurosci. 2000;20:1575–1588. doi: 10.1523/JNEUROSCI.20-04-01575.2000. [DOI] [PMC free article] [PubMed] [Google Scholar]
- 37.Meiergerd SM, Patterson TA, Schenk JO. D2 receptors may modulate the function of the striatal transporter for dopamine: kinetic evidence from studies in vitro and in vivo. J Neurochem. 1993;61:764–767. doi: 10.1111/j.1471-4159.1993.tb02185.x. [DOI] [PubMed] [Google Scholar]
- 38.Mercer L, del Fiacco M, Cuello AC. The smooth endoplasmic reticulum as a possible storage site for dendritic dopamine in substantia nigra neurones. Experientia. 1978;35:101–103. doi: 10.1007/BF01917903. [DOI] [PubMed] [Google Scholar]
- 39.Miyazaki T, Lacey MG. Presynaptic inhibition by dopamine of a discrete component of GABA release in rat substantia nigra pars reticulata. J Physiol (Lond) 1998;513:805–817. doi: 10.1111/j.1469-7793.1998.805ba.x. [DOI] [PMC free article] [PubMed] [Google Scholar]
- 40.Moghaddam B, Bunney BS. Ionic composition of microdialysis perfusing solution alters the pharmacological responsiveness and basal outflow of striatal dopamine. J Neurochem. 1989;53:652–654. doi: 10.1111/j.1471-4159.1989.tb07383.x. [DOI] [PubMed] [Google Scholar]
- 41.Nieoullon A, Cheramy A, Glowinski J. Release of DA in vivo from cat SN. Nature. 1977;266:375–377. doi: 10.1038/266375a0. [DOI] [PubMed] [Google Scholar]
- 42.Nirenberg MJ, Vaughan RA, Uhl GR, Kuhar MJ, Pickel VM. The dopamine transporter is localized to dendritic and axonal plasma membranes of nigrostriatal dopaminergic neurons. J Neurosci. 1996a;16:436–447. doi: 10.1523/JNEUROSCI.16-02-00436.1996. [DOI] [PMC free article] [PubMed] [Google Scholar]
- 43.Nirenberg MJ, Chan J, Liu Y, Edwards RH, Pickel VM. Ultrastructural localization of the vesicular monoamine transporter-2 in midbrain dopaminergic neurons: potential sites for somatodendritic storage and release of dopamine. J Neurosci. 1996b;16:4135–4145. doi: 10.1523/JNEUROSCI.16-13-04135.1996. [DOI] [PMC free article] [PubMed] [Google Scholar]
- 44.Nirenberg MJ, Chan J, Liu Y, Edwards RH, Pickel VM. Vesicular monoamine transporter-2: immunogold localization in striatal axons and terminals. Synapse. 1997;26:194–198. doi: 10.1002/(SICI)1098-2396(199706)26:2<194::AID-SYN10>3.0.CO;2-Y. [DOI] [PubMed] [Google Scholar]
- 45.Parsons LH, Schad CA, Justice JB. Co-administration of the D2 antagonist pimozide inhibits up-regulation of dopamine release and uptake by repeated cocaine. J Neurochem. 1993;60:376–379. doi: 10.1111/j.1471-4159.1993.tb05864.x. [DOI] [PubMed] [Google Scholar]
- 46.Radnikow G, Misgeld U. Dopamine D1 receptors facilitate GABAA synaptic currents in the rat substantia nigra pars reticulata. J Neurosci. 1998;18:2009–2016. doi: 10.1523/JNEUROSCI.18-06-02009.1998. [DOI] [PMC free article] [PubMed] [Google Scholar]
- 47.Rice ME. Distinct regional differences in dopamine-mediated volume transmission. Prog Brain Res. 2000;125:277–290. doi: 10.1016/S0079-6123(00)25017-6. [DOI] [PubMed] [Google Scholar]
- 48.Rice ME, Nicholson C. Diffusion characteristics and extracellular volume fraction during normoxia and hypoxia in slices of rat neostriatum. J Neurophysiol. 1991;65:264–272. doi: 10.1152/jn.1991.65.2.264. [DOI] [PubMed] [Google Scholar]
- 49.Rice ME, Richards CD, Nedergaard S, Hounsgaard J, Nicholson C, Greenfield SA. Direct monitoring of dopamine and 5-HT release from substantia nigra and ventral tegmental area in vitro. Exp Brain Res. 1994;100:395–406. doi: 10.1007/BF02738400. [DOI] [PubMed] [Google Scholar]
- 50.Rice ME, Cragg SJ, Greenfield SA. Characteristics of electrically evoked somatodendritic dopamine release in substantia nigra and ventral tegmental area in vitro. J Neurophysiol. 1997;77:853–862. doi: 10.1152/jn.1997.77.2.853. [DOI] [PubMed] [Google Scholar]
- 51.Robertson GS, Robertson HA. Evidence that l-Dopa-induced rotational behavior is dependent on both striatal and nigral mechanisms. J Neurosci. 1989;9:3326–3331. doi: 10.1523/JNEUROSCI.09-09-03326.1989. [DOI] [PMC free article] [PubMed] [Google Scholar]
- 52.Santiago M, Westerink BH. Simultaneous recording of the release of nigral and striatal dopamine in the awake rat. Neurochem Int. 1992;20:107S–110S. doi: 10.1016/0197-0186(92)90220-l. [DOI] [PubMed] [Google Scholar]
- 53.Sesack SR, Aoki C, Pickel VM. Ultrastructural localization of D2 receptor-like immunoreactivity in midbrain dopamine neurons and their striatal targets. J Neurosci. 1994;14:88–106. doi: 10.1523/JNEUROSCI.14-01-00088.1994. [DOI] [PMC free article] [PubMed] [Google Scholar]
- 54.Simon SM, Llinás RR. Compartmentalization of the submembrane calcium activity during calcium influx and its significance in transmitter release. Biophys J. 1985;48:485–498. doi: 10.1016/S0006-3495(85)83804-2. [DOI] [PMC free article] [PubMed] [Google Scholar]
- 55.Singer EA. Transmitter release from brain slices elicited by single pulses: a powerful method to study presynaptic mechanisms. Trends Pharmacol Sci. 1988;9:274–276. doi: 10.1016/0165-6147(88)90004-1. [DOI] [PubMed] [Google Scholar]
- 56.Smits RPJ, Steinbusch HWM, Mulder AH. Distribution of DA-immunoreactive cell bodies in the guinea-pig brain. J Chem Neuroanat. 1990;3:101–123. [PubMed] [Google Scholar]
- 57.Stevens CF. Quantal release of neurotransmitter and long-term potentiation. Cell [Suppl] 1993;72:55–63. doi: 10.1016/s0092-8674(05)80028-5. [DOI] [PubMed] [Google Scholar]
- 58.Timmerman W, Abercrombie ED. Amphetamine-induced release of dendritic dopamine in substantia nigra pars reticulata: D1-mediated behavioral and electrophysiological effects. Synapse. 1996;23:280–291. doi: 10.1002/(SICI)1098-2396(199608)23:4<280::AID-SYN6>3.0.CO;2-3. [DOI] [PubMed] [Google Scholar]
- 59.Triller A, Korn H. Transmission at a central inhibitory synapse. III. Ultrastructure of physiologically identified and stained terminals. J Neurophysiol. 1982;48:708–736. doi: 10.1152/jn.1982.48.3.708. [DOI] [PubMed] [Google Scholar]
- 60.Ungless MA, Whistler JL, Malenka RC, Bonci A. Single cocaine exposure in vivo induces long-term potentiation in dopamine neurons. Nature. 2001;411:583–587. doi: 10.1038/35079077. [DOI] [PubMed] [Google Scholar]
- 61.Wassef M, Berod A, Sotelo C. Dopaminergic dendrites in the pars reticulata of the rat substantia nigra and their striatal input. Combined immunocytochemical localization of tyrosine hydroxylase and anterograde degeneration. Neuroscience. 1981;6:2125–2139. doi: 10.1016/0306-4522(81)90003-8. [DOI] [PubMed] [Google Scholar]
- 62.Wieczorek WJ, Kruk ZL. A quantitative comparison on the effects of benztropine, cocaine and nomifensine on electrically evoked dopamine overflow and rate of re-uptake in the caudate putamen and nucleus accumbens in the rat brain slice. Brain Res. 1994;657:42–50. doi: 10.1016/0006-8993(94)90951-2. [DOI] [PubMed] [Google Scholar]
- 63.Wilson CJ, Callaway JC. Coupled oscillator model of the dopamine neuron of the substantia nigra. J Neurophysiol. 2000;83:3084–3100. doi: 10.1152/jn.2000.83.5.3084. [DOI] [PubMed] [Google Scholar]
- 64.Wilson CJ, Groves PM, Fifková E. Monoaminergic synapses, including dendro-dendritic synapses in the rat substantia nigra. Exp Brain Res. 1977;30:161–174. doi: 10.1007/BF00237248. [DOI] [PubMed] [Google Scholar]
- 65.Yung KKL, Bolam JP, Smith AD, Hersch SM, Ciliax BJ, Levey AI. Immunocytochemical localization of D1 and D2 dopamine receptors in the basal ganglia of the rat: light and electron microscopy. Neuroscience. 1995;65:709–730. doi: 10.1016/0306-4522(94)00536-e. [DOI] [PubMed] [Google Scholar]