Abstract
Stretch-receptor (SR) axons form a parallel array of 20 excitatory synapses with target neurons in the crayfish CNS. In each postsynaptic neuron, EPSPs from different SR axons differ significantly in size. These amplitudes are correlated with the segment in which each axon originates and form a segmental gradient of synaptic excitation in individual postsynaptic neurons. These differences might arise postsynaptically because of differential postsynaptic attenuation or presynaptically because of local regulation of the strength of each synapse. To examine these possibilities, we stimulated each SR axon separately and studied integration of its EPSPs in an identified neuron, Flexor Inhibitor 6 (FI6). Transmission from SR axons to FI6 was chemical and direct: EPSPs were accompanied by an increased postsynaptic conductance, were affected by extracellular Ca2+, and showed frequency-dependent depression. EPSPs from different SR axons summed linearly. The rise times of EPSPs from different SR axons were not significantly different.
We also filled individual SR axons and FI6 neurons and mapped and counted their points of contact. Each SR axon contacted each FI6 bilaterally, and contacts of SR axons from different segments were intermingled on FI6. SR axons that made the strongest synapses made more points-of-contact with FI6. These results imply that differences in strength do not arise because of differential postsynaptic attenuation of EPSPs, but rather because certain SR axons predictably make more points of contact with FI6 than do others. Thus, this gradient in excitation requires that each synapse be regulated by an exchange between the SR axon and its target neuron.
Keywords: afferent synapse, synaptic depression, summation, gradient of excitation, synaptic integration, crayfish
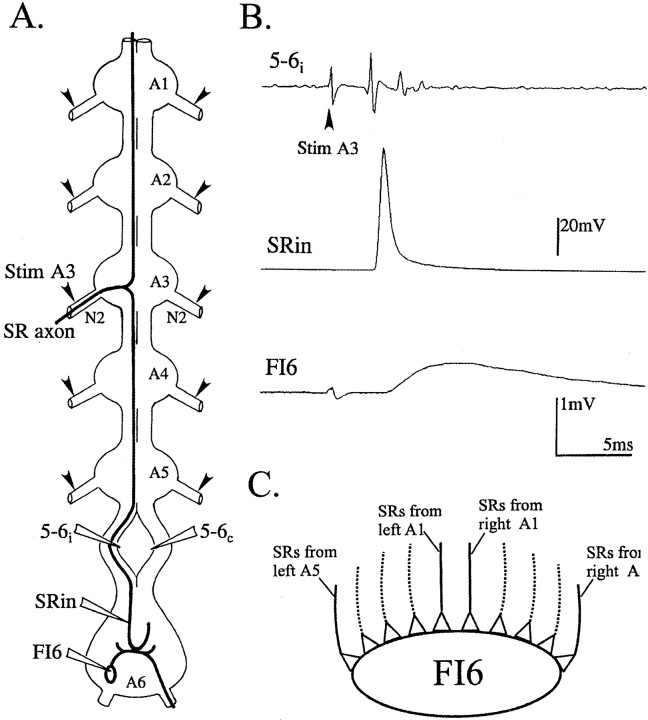
Sets of afferents from some sensory receptors in insects and crayfish form maps of sensory space within the CNS. They do so by projecting to specific regions of a neuropil, where afferents that conduct information from different regions of sensory space contact different positions on the dendrites of target neurons (Jacobs and Theunissen, 1996; Paydar et al., 1999). In crayfish, the stretch-receptor (SR) neurons form a population of 20 cholinergic presynaptic axons that carry information about the relative positions of the abdominal segments (Barker et al., 1972; Fields, 1976). All of these SR axons converge in the terminal abdominal ganglion, A6, to synapse with the same target neurons (Fig.1). In these target neurons, EPSPs caused by SR axons originating in particular segments of the abdomen are significantly larger than those of SR axons from neighboring segments, gradients in strength that are observed consistently from animal to animal (Bastiani and Mulloney, 1988a). We speculated that these differences in synaptic strength might reflect a map of the relative positions of the abdominal segments, whose anatomical manifestation would be a difference in the location of the synaptic contacts made by each SR axon. This positional difference would lead to differential postsynaptic decay of EPSPs arising at different sites on a given target neuron, and so cause the observed differences in strength.
Fig. 1.
A, Diagram of the isolated ventral nerve cord that shows the axonal projections of one SR axon that originates in segment 3. Anterior is at the top of the diagram. Before the axon enters the third abdominal ganglion (A3), it can be stimulated selectively (Stim A3) with an electrode on the second nerve of the ganglion (N2). Its action potentials can be recorded with an extracellular electrode on the ipsilateral half of the interganglionic connective between A5 and A6 (5–6i) or with a microelectrode in its terminal processes (SRin) in the most posterior ganglion (A6). A second extracellular recording electrode placed on the opposite half of the connective (5–6c) would record the action potentials of contralateral SR axons, but not this SR axon. A second microelectrode can record the responses of a target neuron, FI6. Other SR axons can be stimulated selectively by other stimulating electrodes (arrowheads) placed on other N2s. B, Simultaneous recordings of the SR action potential in the connective between A5 and A6 (5–6i) and in axon terminals (SRin), and of the EPSP in the target neuron, FI6, that follows this action potential. Stim A3 (arrowhead) marks the stimulus artifact that precedes the action potential and the EPSP. Each trace is the average of 50 trials. C, A diagram that illustrates the convergence of SR axons from different segments onto the same target neuron, FI6. Five pairs of SR1 axons and five pairs of SR2 axons synapse in parallel with each target neuron.
To test this idea, we first selected an identifiable target neuron in A6, the Flexor Inhibitor 6 neuron (FI6) (Dumont and Wine, 1987), and confirmed that its synapses with SR axons from different segments differed significantly in strength. Throughout the paper, we intend that “synapse” refer to a physiological connection between two neurons. We confirmed that SR to FI6 synapses were predominantly chemical, explored their activity-dependent dynamics, and examined summation of EPSPs from different SR axons in the same FI6 neuron. To look for evidence of differential postsynaptic attenuation, we compared the relative sizes of SR EPSPs recorded at different postsynaptic sites and measured the rise times of EPSPs from SR axons originating in different segments.
The anatomical substrate of a synapse could be one or more points of contact between these neurons, each point equipped with presynaptic vesicles and release apparatus, and postsynaptic receptors. To map the positions of SR synapses on individual FI6 neurons, we filled pairs of presynaptic axons and FI6s and compared the locations of points of contact for SR axons with strong EPSPs and SR axons with weak EPSPs. We also cut serial sections in plastic and counted points-of-contact between the two neurons. The results of these experiments contradicted the hypothesis that differences in synaptic strength are produced postsynaptically because of differential attenuation of EPSPs arising at different sites. Instead, they suggest that differences in synaptic strength are produced by systematic differences in the numbers of synaptic contacts made by SR axons originating in different segments.
MATERIALS AND METHODS
Male and female crayfish, Pacifastacus leniusculus, were obtained from commercial fishermen and held in aerated aquaria. Animals ranged in size from 8 to 13 cm, measured from the tip to the end of the telson. This paper reports the results of >100 experiments.
The normal saline contained (in mm): 5.4 KCl, 2.6 MgCl2, 13.5 CaCl2, and 195 NaCl, buffered with 10 mm Tris maleate at pH 7.4. In certain experiments, Mg2+ was raised to 16 mm, and Ca2+ was omitted.
Dissections. The isolated ventral nerve cord preparation used for these experiments was a simplification of that developed by Bastiani and Mulloney (1988a,b). Crayfish were first anesthetized before dissection by chilling on ice. The abdomen was separated from the thorax, all swimmerets were removed, and the abdomen was pinned ventral side up in a saline-filled dish lined with silicone elastomer (Sylgard; Dow Corning). To remove the ventral nerve cord with long peripheral nerves attached (Fig. 1), a shallow pair of lateral incisions were made to free the ventral exoskeleton, which was then raised with forceps to expose the fast-flexor muscles. The insertions of these muscles and the three pairs of segmental nerves were cut in each segment. Then, the ventral exoskeleton with the nerve cord still attached was lifted off and placed dorsal side up in the same dish.
The paired second nerves, N2, were freed as far from each ganglion as possible (Fig. 1). The paired first and third nerves of abdominal ganglia 1 to 5 (A1–A5) were cut nearer each ganglion to make space for electrodes. When the necessary peripheral nerves had been dissected free, the nerve cord was transferred to a Sylgard-lined Petri dish. Each N2 of A1 through A5 was pinned out laterally to make room to place stimulating electrodes.
To permit insertion of microelectrodes into selected neurons, the sheath around the sixth abdominal ganglion, A6, was cut away with scissors. The interganglionic connective between A5 and A6 was also desheathed and separated along the midline suture so that extracellular recording electrodes could be placed on the medial surfaces of the left and right halves of the connective (Fig. 1).
Physiological identification of the SR axons. One SR neuron originates in each of the paired abdominal muscle receptor organs (MROs) of each of the first five abdominal segments (Alexandrowicz, 1951; Wiersma et al., 1953). On each side of a segment, the SR neurons from the two MROs, SR1 and SR2 (Bastiani and Mulloney, 1988b), differ in axon diameter, and so have different spike amplitudes, conduction velocities, and thresholds for extracellular stimulation (Fields, 1976). Each SR axon projects into the CNS through an N2 (Fig.1A) and then to the terminal ganglion, A6. Except for the N2s of A5, SR axons are the only axons in N2 that project posteriorly to A6 (Leise et al., 1987).
Each N2 contains one SR1 axon and one SR2 axon. The SR2 axons are the largest axons in each N2 (Alexandrowicz, 1951, 1967), and so have the lowest threshold to extracellular stimulation. SR1 axons are the next largest axons, and the second to be recruited by increasingly strong extracellular stimulation. Stainless steel pin electrodes (Mulloney and Selverston, 1974) were placed on each N2 to allow the different SR axons to be stimulated selectively. Ten electrodes were needed for the five pairs of N2s. With this arrangement, each SR2 axon could be selectively stimulated, or both SR1 and SR2 could be stimulated. Only rarely could we stimulate SR1 without also stimulating SR2.
To record impulses elicited by these stimuli, separate pin electrodes were placed on the left and right medial surfaces of the separated connective between A5 and A6 (Fig. 1A). SR axons from different segments run close together in the connectives near the medial surface (Wiersma, 1958; Wiersma and Hughes, 1961; Wiersma and Pilgrim, 1961; Wiersma and Bush, 1963; Leise et al., 1987; Bastiani and Mulloney, 1988b), so these two electrodes could record impulses in every SR axon. Impulses in SR2 axons could be distinguished from impulses in SR1 axons originating in the same N2 by the lower threshold of SR2, its faster conduction velocity, and the larger amplitude of its extracellularly recorded action potential in the connective.
Data analysis. SR action potentials and PSPs from target neurons were recorded on VCR tape with a Neurocorder 886 (Cygnus Technologies). Experimental recordings were later played back for display and analysis. Signal averaging, amplitude measurements, and time course analyses were done with the pClamp system (Axon Instruments, Foster City, CA). To get an accurate measure of the mean size of these EPSPs, the responses to 50 successive stimuli were averaged. To compare the relative strengths of EPSPs in Ca2+-free saline, the areas under the curves of different PSPs were digitized from chart records using a data tablet and SigmaScan software (Jandel Scientific, Corte Madera, CA).
Intracellular recordings and staining. Microelectrodes (fiber-filled, 1 mm outer diameter) were filled either with 2.5m KCl or with 5% Neurobiotin (Vector Laboratories, Burlingame, CA) dissolved in 0.5 mKCl + 0.05 m Tris buffer (Kita and Armstrong, 1991). KCl electrodes with resistances between 10 and 30 MΩ were preferred when it was necessary to record PSPs in Ca2+-free saline or to measure time courses of postsynaptic potentials. Neurobiotin electrodes had tip resistances between 20 and 40 MΩ. Microelectrodes made contact with a Getting M5 or Axoclamp-2 (Axon Instruments) preamplifier through a silver chloride bridge.
At the beginning of each experiment, the cell body of one of the paired Flexor Inhibitor neurons, FI6, in segment 6 of A6 (Dumont and Wine, 1987), was penetrated with a microelectrode. FI6 neurons were identified by the predictable position of their soma and by two physiological criteria: (1) FI6 received a relatively large, unitary EPSP from SR1 and SR2; (2) FI6 had a gradient of synaptic strength characteristically different from that observed in other target neurons (see Results). If the penetrated cell met these criteria, then after the physiological experiment, Neurobiotin was injected for 30 min with depolarizing current of +10 nA of 500 msec duration at 1 Hz.
After filling the FI6 neuron, an SR axon in A6 was penetrated with glass microelectrodes and filled with Neurobiotin. SR axons were identified by correlating an extracellular spike at the connective (Fig. 1B) with an intracellular spike in the axon that followed at a constant latency even at frequencies up to 200 Hz. After positive physiological identification, the cell was filled for 20 min by passing +10 nA depolarizing pulses of 500 msec duration at 1 Hz.
Histology. Once the selected neurons were filled, ganglia A5 and A6 were fixed overnight in 4% paraformaldehyde in Dulbecco's PBS (D5773; Sigma, St. Louis, MO). The ganglia were then washed in 0.1 m glycine in PBS, dehydrated to 95% EtOH, rehydrated, and further permeabilized in a wash buffer that contained 0.3% reduced Triton X-100 (Aldrich, Milwaukee, WI) in PBS. The ganglia were incubated in HRP-conjugated streptavidin (PRN. 1231; Amersham Pharmacia Biotech, Arlington Heights, IL) diluted 1:300 in the same wash buffer for 12–40 hr, at 4°C on a rotator. The tissue was subsequently washed in several changes of wash buffer and incubated in 0.05% diaminobenzidine (DAB) in 0.05m Tris buffer for 2 hr at room temperature, on a rotator in the dark. Then 10 μl of 0.3% H2O2 for each 1 ml of DAB solution was added and the reaction allowed to proceed for 1 hr on the rotator in the dark. Finally, the ganglia were rinsed in PBS, dehydrated in ethanol, cleared in methylsalicylate, and examined as whole mounts.
Ganglia selected for sectioning were subsequently rehydrated, washed in 0.1 m sodium cacodylate buffer, and post-fixed in 2% OsO4 in the same buffer for 2 hr at 4° C. The osmicated ganglia were then dehydrated, embedded in Spurr's resin, and sectioned at 20 μm using the methods described inLeise et al. (1986, 1987). Cleared ganglia and sections were drawn using a Zeiss camera lucida and Nikon planapochromatic lenses to reconstruct filled neurons, and to count their putative synaptic contacts. Some sections were photographed with planapochromatic lenses using Eastman Kodak (Rochester, NY) Techpan 120 film, 6 × 9 cm format. The resulting negatives were scanned at 600 pixels per inch, reversed in Adobe Photoshop, and printed with a Kodak DS8650 color printer.
RESULTS
We begin with a description of the responses of FI6 neurons to stimulation of different SR axons, and a detailed description of some physiological properties of these synapses. Then, we consider alternative mechanisms that might be responsible for differences in the sizes of their PSPs.
Synapses between SR axons and FI6 neurons
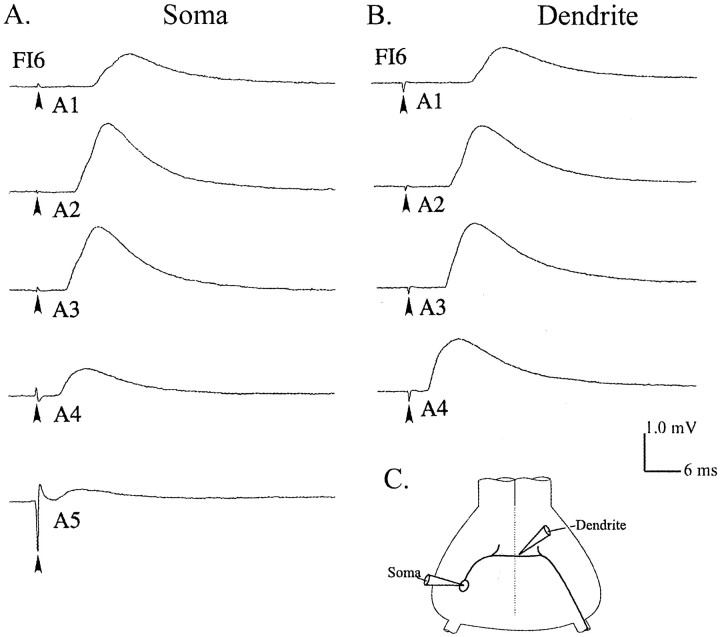
Each FI6 neuron received synaptic input from both SR1 and SR2 axons originating in each abdominal segment. These synapses occurred on the dendritic region of FI6 in the core of the neuropil of the ganglion. The cell body of FI6 is connected to the dendritic region by a narrow process (Fig.2C) but is not known to receive direct synaptic input. The FI6 axon extends from the dendritic region contralateral to the cell body and projects out a peripheral nerve to the flexor muscles. The spike-initiating zone is near the base of this nerve (Fig. 2C). To study EPSPs in FI6 quantitatively, we stimulated individual SR2 axons from different segments repeatedly and averaged the EPSPs these stimuli elicited, usually recording from the FI6 cell body. EPSPs from SR axons originating in middle segments of the abdomen were larger than those either from more anterior or more posterior SR axons (Fig. 2). Most FI6 neurons received their largest EPSPs from SR2s originating in A3. In a few preparations, the PSPs from SR2s originating in A2 or A4 were almost as big as those from the SR2s originating in A3, but PSPs from axons originating in A1 and A5 were always smaller, and often were not detectable. Because of segmental specializations of the anatomy of these crayfish, it was more difficult to stimulate SR axons originating in A1 and A5, so we sometimes could not record EPSPs from SR2 axons originating in these segments. However, we could always detect failure of the SR axons to respond to the stimulus by the absence of a spike on the five or six extracellular recording (Fig. 1B), so our measurements of EPSP sizes are not compromised by this problem. Whenever SR2s originating in A5 could be stimulated properly, FI6 received its smallest EPSPs from them.
Fig. 2.
EPSPs caused by stimulating different SR axons recorded from the cell body or from the dendritic region of FI6 neurons (C). A, Intracellular recordings from the cell body (Soma) of one FI6 neuron that demonstrate differences in the strengths of synapses made by SR axons originating in segments 1 through 5 (A1, A2, A3, A4, A5). Stimulation (arrowhead) of each N2 contralateral to the FI6 cell body elicited impulses in both SR1 and SR2 axons and EPSPs from each of them that are summed in these recordings. B, Recordings from the dendritic region (Dendrite) of another FI6 that show EPSPs from SR axons originating in contralateral A1, A2, A3, and A4. Contralateral N2s from each segment were stimulated (arrowhead) in the same way as in A. In this experiment, stimulation of the N2 of A5 failed, and EPSPs from the SRs entering A5 were not recorded. For each trace in A and B, the responses to 50 stimuli were averaged. C, A diagram that shows the two recording sites.
The probability of the largest PSP originating in each segment could be measured by pooling data from experiments in which SR EPSPs from all five segments were recorded (Table 1). For EPSPs from contralateral SR2 axons (n = 5 FI6 neurons), none from A2 and only 1 of 5 from A4 were as big as the EPSPs from A3. For EPSPs from ipsilateral SR2 axons (n = 6 FI6 neurons), 1 of 6 from A2 axons and 2 of 6 from A4 axons were as big as those from A3; none were larger. In this analysis, if two SR axons from different segments caused EPSPs of the same size, both axons were equally likely to cause the biggest EPSP and so were scored equally in Table 1.
Table 1.
Probabilities of largest EPSP being caused by an SR axon from different abdominal segments
| Segment | Contralateral | Ipsilateral | ||
|---|---|---|---|---|
| SR1 & SR2 | SR2 | SR1 & SR2 | SR2 | |
| 1 | 0 /6 | 0 /5 | 0 /6 | 0 /6 |
| 2 | 3 /6 | 0 /5 | 2 /6 | 1 /6 |
| 3 | 4 /6 | 5 /5 | 5 /6 | 6 /6 |
| 4 | 0 /6 | 1 /5 | 0 /6 | 2 /6 |
| 5 | 0 /6 | 0 /5 | 0 /6 | 0 /6 |
Data are the ratios of the number of FI6 neurons in which an SR axon from a given segment caused the largest EPSP recorded in that FI6 to the total number of FI6 neurons sampled. If SR axons from two different segments caused EPSPs of the same size, then both segments were credited with the largest PSP.
In FI6 neurons, both the largest SR2 EPSPs and the largest summed SR1 and SR2 EPSPs were most likely to come from axons originating in A3 (Table 1). It was more difficult to measure the strength of EPSPs from SR1 axons because they were usually summed with those of an SR2 axon in the same N2 (see Materials and Methods), but a trend was observed in the relative strengths of SR1 synapses similar to the gradient of EPSPs from SR2.
Transmission from SR axons to FI6 neurons was remarkably stable. We did not observe quantal fluctuations of these PSPs, and PSPs in FI6 followed each SR action potential 1:1 at frequencies as high as 200 Hz. The high reliability of these connections and the apparent absence of quantal fluctuation led us to doubt that they were predominantly chemical. We therefore tested the input conductance of FI6 during the PSP and the sensitivity of these synapses to extracellular Ca2+.
EPSPs from SR axons arose from a conductance increase
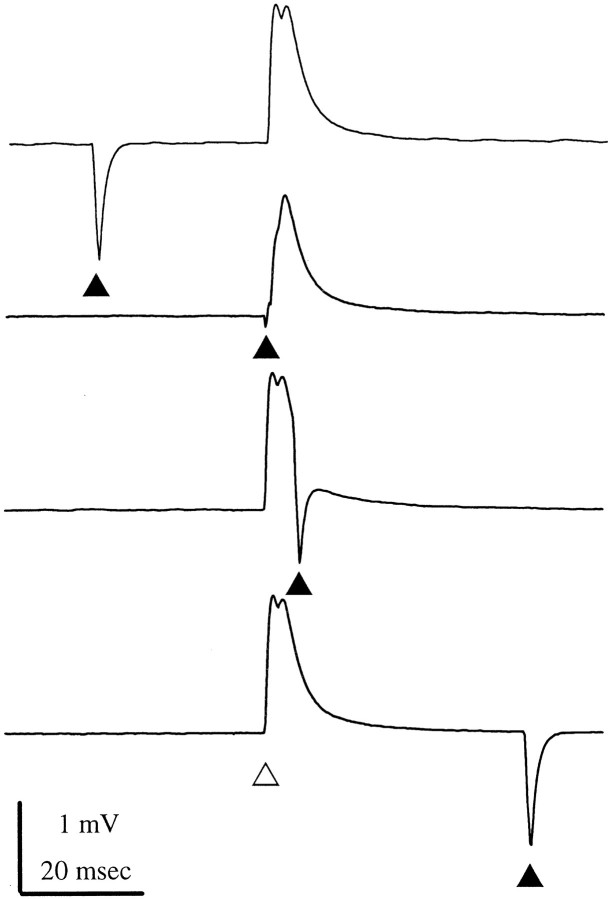
Transmission at a chemical synapse is normally accompanied by a change in postsynaptic input conductance because of a change in the conductance of channels in the postsynaptic membrane. To see if these EPSPs were accompanied by a change in postsynaptic conductance, we recorded from the dendritic region of an FI6 and monitored its input conductance by periodically injecting brief pulses of hyperpolarizing current. During an SR EPSP, we observed a drastic reduction of the voltage-transient caused by these current pulses, particularly during the rising phase of the EPSP (Fig. 3). This reduction is indicative of a brief increase in the input conductance of the FI6 neuron and is consistent with a chemical mechanism of transmission at these synapses.
Fig. 3.
The input conductance of FI6 increased briefly during each SR EPSP. These four traces show summed EPSPs recorded from the dendritic region of an FI6 that were elicited by stimulating the SR1 and SR2 axons in the contralateral N2 of A3. The four EPSPs are aligned and marked by the open triangle below the bottom trace. A brief pulse of hyperpolarizing current (filled triangle) was injected through a bridge circuit into the FI6 to measure the input conductance of the FI6 at different times relative to stimulation of the SR axons. In the top andbottom traces, the current pulses occurred well before or well after the PSPs. During the second trace, the current pulse occurred precisely at the start of the first EPSP; the voltage transient caused by the pulse was reduced. During the third trace, the current pulse occurred later, after the peak of the second EPSP; the voltage transient was larger again. Each trace shown is an average of 50 responses.
The SR–FI6 synapse was sensitive to changes in the concentrations of Ca2+ and Mg2+
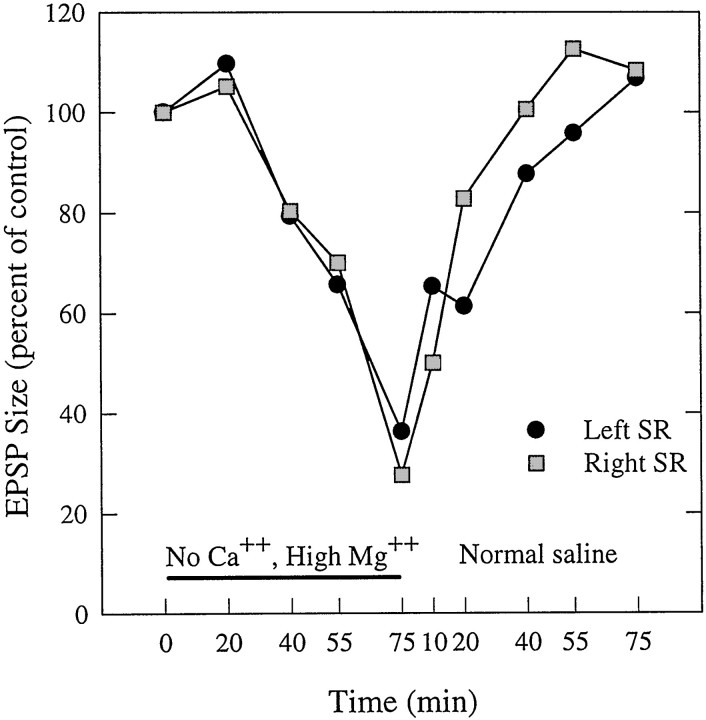
Synapses made by many primary afferent axons in crayfish have both an electrical component and a chemical component (Zucker, 1972; Miller et al., 1992; Newland et al., 1997; Edwards et al., 1999). Electrical synapses are not affected by extracellular Ca2+, but chemical synapses require extracellular Ca2+ to work, and this entry of Ca2+ is competitively blocked by extracellular Mg2+ (Katz and Miledi, 1967). In five experiments, when normal saline bathing the preparation was replaced with a high-Mg2+, Ca2+-free saline, the sizes of SR EPSPs were reduced (Fig. 4). These data were recorded from an FI6 soma while alternately stimulating the left and right N2 of A2 at 0.01 Hz. When the saline was replaced with Ca2+-free saline, the EPSPs were reduced in a graded and reversible manner. Stimulation of each N2 continued to produce EPSPs, but over a 75 min period these diminished in size gradually to approximately one-fourth of the original electrical charge. Once normal saline was reintroduced, the EPSPs recovered with a similar time course.
Fig. 4.
Gradual and reversible decline in size of SR EPSPs elicited in Ca2+-free saline (horizontal bar) and recorded from the cell body of an FI6 neuron. The left and right N2s of A2 were stimulated alternately to monitor the relative size of the summed EPSPs from SR1 and SR2 axons during removal and restoration of normal concentrations of Ca2+ and Mg2+. Size was measured as the area under each EPSP (see Materials and Methods).
The slow time course of the block in Figure 4 is consistent with the experience of others who have tried to alter the ionic concentrations in the core of this ganglion by superfusion (Brown and Sherwood, 1981); the neuropil of these euryhaline animals is well buffered against changes in the ionic composition of the extracellular fluid. We attempted to hasten the removal and reintroduction of extracellular Ca2+ by perfusing the preparation through the ventral artery (Brown and Sherwood, 1981; Acevedo et al., 1994) while recording from FI6, but did not manage to hold the intracellular recording throughout a change of solutions. This continuous change in EPSP size as a consequence of changing the concentrations of Ca2+ and Mg2+would be expected if the synapses between FI6 and the SR axons were chemically mediated, and the concentrations at the synapse changed continuously because of diffusion into the extracellular space from the bath.
EPSPs from SR axons showed frequency-dependent synaptic depression
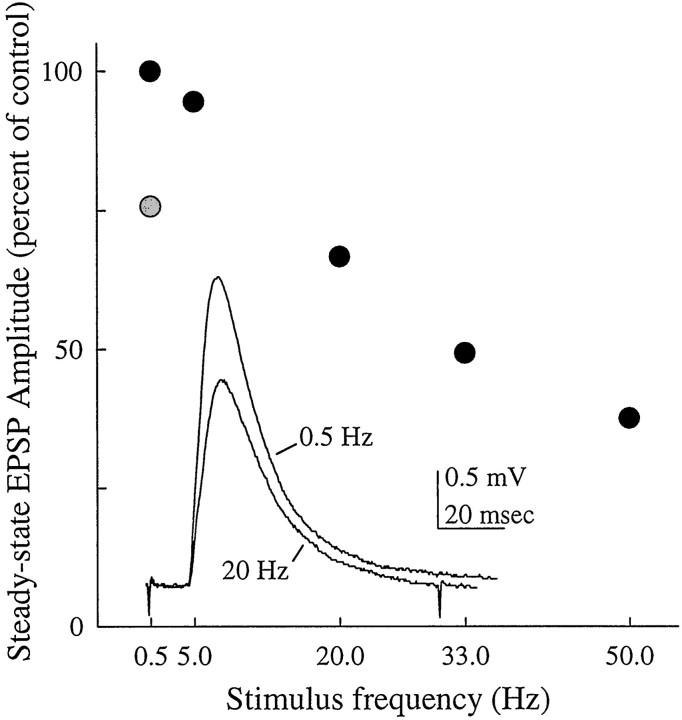
The chemical components of synapses from many other sensory afferents are susceptible to synaptic depression (Bryan and Krasne, 1977; Takahata and Wine, 1987; Zucker, 1999). By comparison, SR synapses are quite resistant to depression. At frequencies <14 Hz, the stimulus frequency we normally used, EPSPs in FI6 followed SR spikes indefinitely without any decrement. When SR axons were stimulated at >20 Hz, EPSPs showed clear synaptic depression (Fig.5). This depression was not pronounced; for example, at 50 Hz the steady-state amplitude of the PSPs in Figure5 was 37% of the maximum. SR1 neurons fire tonically through a wide range of frequencies as the posture of the abdomen changes (Fields, 1966; McCarthy and MacMillan, 1999), so these synapses would function reliably even during full flexion of the abdomen.
Fig. 5.
Frequency-dependent depression of SR EPSPs recorded from the dendritic region of an FI6. The graph shows steady-state amplitudes of EPSPs recorded at five different frequencies (black circles). In these experiments, both an SR1 and an SR2 axon from A3 were stimulated simultaneously. Once a stable amplitude had been reached, the summed responses to 50 stimuli were averaged. After the 50 Hz bout of stimulation, the amplitude of the EPSP recovered (gray circle).Inset, Steady-state EPSPs recorded during trains of stimuli at 0.5 and 20 Hz.
After the unitary EPSPs caused by driving an SR axon were depressed, FI6 could still generate full-sized EPSPs if another SR axon was stimulated (data not shown), so this depression was restricted to the synapse made by the driven SR axon. Once stimulation ceased, the depressed synapse recovered (Fig. 5).
In summary, the synapses from SR axons onto FI6 neurons showed all the hallmarks of chemical synapses: they required extracellular Ca2+ to function, they were associated with an increase in postsynaptic conductance, and they showed frequency-dependent depression of PSP amplitude. We looked for but did not observe quantal fluctuation of either SR1 or SR2 synapses, and it seems likely that the quantal content of each PSP is normally both high and stable.
PSPs from different SR axons summed linearly in the FI6 neurons
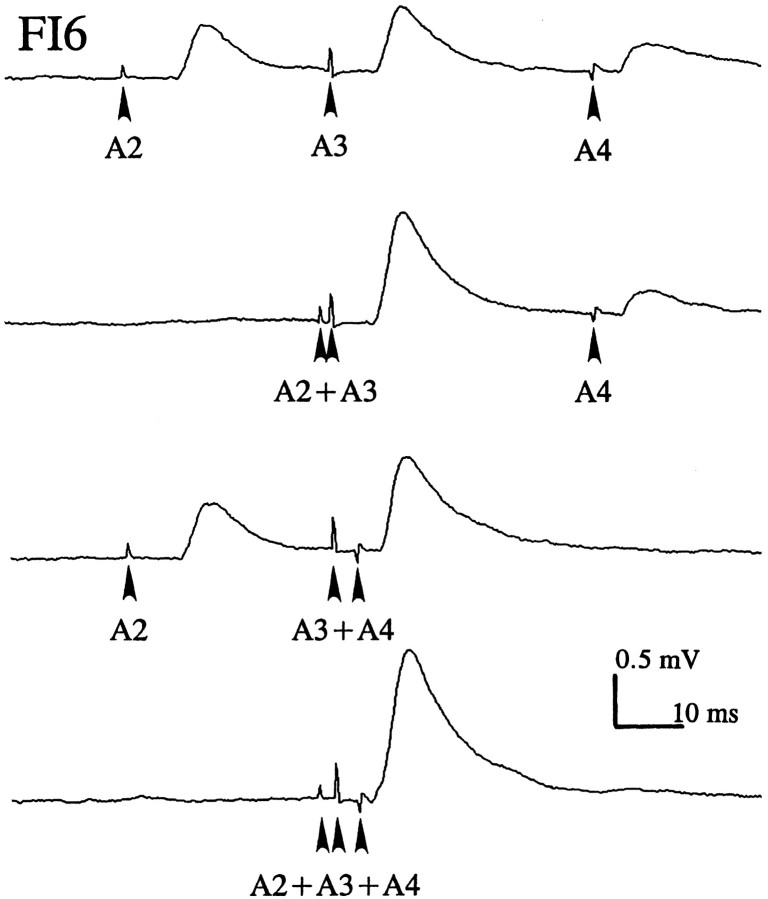
To examine integration of EPSPs produced by SR axons from different segments, the contralateral N2s of A2, A3, and A4 were stimulated independently, and the relative timing of the stimuli adjusted so that the SR spikes from different segments arrived in A6 at the same time (Fig. 6). These nerves were stimulated 50 times at either 0.4 or 4 Hz, and EPSPs were recorded from the FI6 soma and averaged. The amplitudes of summed EPSPs were almost the same as the value obtained from algebraic summation of the different EPSPs (Table 2). This linear summation indicates that the equilibrium potential of the synaptic currents that caused these SR EPSPs was much more positive than the resting potential of FI6 and that these synapses did not shunt one another.
Fig. 6.
Spatial summation of EPSPs from SR axons originating in different ganglia (A2, A3,A4) recorded from the cell body of an FI6 neuron. Each SR axon was stimulated separately (arrowhead) with an electrode on the N2 where it entered the CNS. To sum EPSPs from different SR axons, the different N2s were stimulated at different times so that the SR action potentials arrived simultaneously in A6; see conduction delays in Figure 2.
Table 2.
Linear summation of SR EPSPs from different abdominal segments
| Segments stimulated | 0.4 Hz | 4 Hz | ||
|---|---|---|---|---|
| Peak amplitude (mV) | Difference from sum (mV) | Peak amplitude (mV) | Difference from sum (mV) | |
| A2 | 0.47 | — | 0.42 | — |
| A3 | 0.60 | — | 0.53 | — |
| A4 | 0.24 | — | 0.21 | — |
| A2 & A3 | 1.00 | −0.07 | 0.93 | −0.02 |
| A3 & A4 | 0.84 | 0.00 | 0.81 | 0.07 |
| A2 & A3 & A4 | 1.35 | 0.04 | 1.33 | 0.17 |
What mechanisms might account for the observed gradients of synaptic strength? One possibility is that each SR axon makes the same number of synaptic contacts with FI6, but that SR axons originating from different segments contact different regions of FI6, forming a topographic map of the abdominal joints on the dendritic region of the neuron. In such a case, the gradients observed in the cell body might result from differential postsynaptic decay of EPSPs that arise at different loci.
The gradient of synaptic strength recorded in the FI6 cell body was not caused by differential electrotonic decrement
To test this possibility, we recorded EPSPs with a microelectrode in the integrating segment of FI6 (Edwards and Mulloney, 1987). A gradient in the sizes of EPSPs like that in the cell body was observed in the dendritic region, although the site of the recording had been changed from the periphery to the center of the dendritic region of FI6 (Fig. 2B).
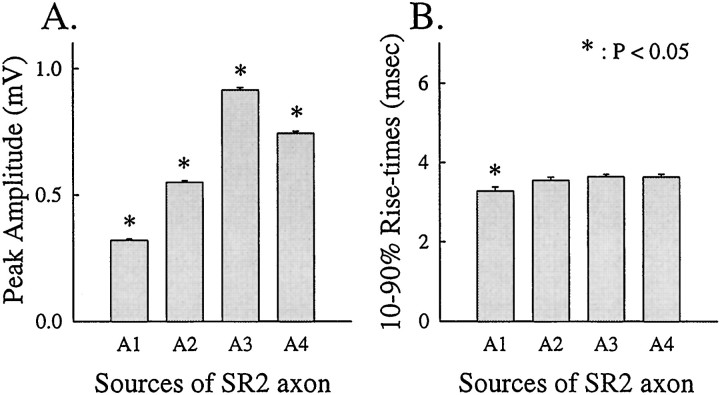
As another test of this possibility, we compared time courses of EPSPs from different SR axons (Fig. 7). In a passive dendrite, the 10–90% rise-time of a PSP is affected by the electrotonic distance between the recording site and the synaptic site, and is independent of the size of the PSP (Rall et al., 1967). If some SR PSPs are smaller than others because they arise farther from the recording site, then these smaller PSPs should have longer 10–90% rise times. We measured the amplitudes and rise times of EPSPs from both ipsilateral and contralateral SR2 axons recorded in five experiments. As expected, differences between the peak amplitudes of EPSPs from SR2 axons originating from different segments were significant (p < 0.05). On the other hand, there was no significant difference between the 10–90% rise times of EPSPs from SR axons originating in different segments (p > 0.05). These results suggest that larger EPSPs are not larger because they arise at synapses closer to the cell body than do smaller EPSPs.
Fig. 7.
A, Peak amplitude and 10–90% rise times (B) of EPSPs recorded in an FI6 cell body and elicited by stimulating SR2 axons from different segments. Each histogram shows mean ± SE. There is a significant difference (p < 0.05) in the peak amplitudes of EPSPs from different SR axons, but not in their rise times (p > 0.05). See Results for comment on the rise times of A1.
One exception was observed in the experiments illustrated in Figure 7: the 10–90% rise-time of the EPSP from the contralateral SR2 originating in A1 was significantly smaller than the rest. However, if the smaller size of this EPSP were caused by electrotonic decrement, its 10–90% rise-time would have been longer, not shorter than the rest; this was not the case. We think this difference in the rise-time of these EPSPs from an A1 SR axon was probably measurement error caused by the difficulty of detecting the peak of a tiny EPSP in the presence of spontaneous background noise.
Putative synaptic contacts between different SR axons and FI6 were located in the same regions on FI6
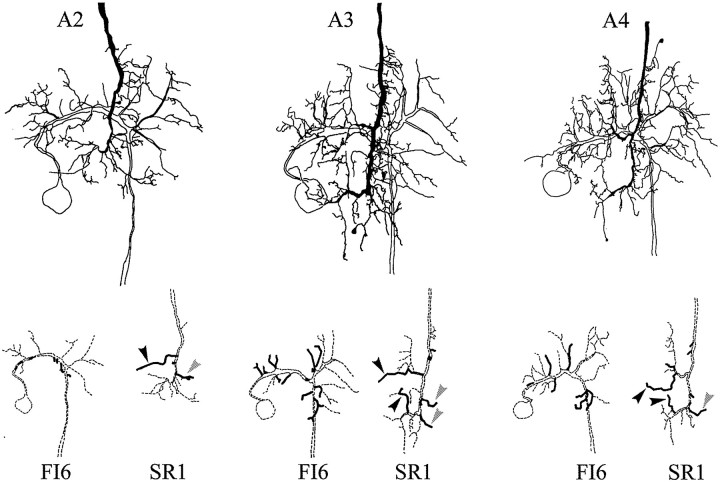
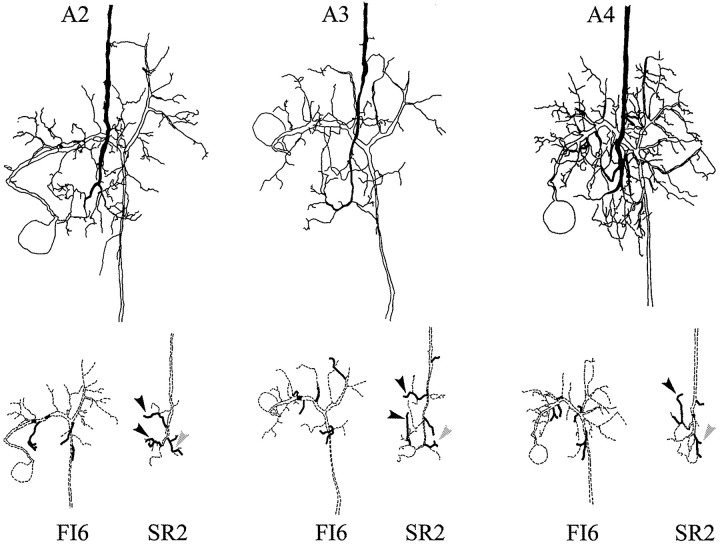
In most preparations, each SR axon in A6 can be individually identified, and the FI6 neurons in the A6 of every crayfish have the same anatomy (Dumont and Wine, 1987). Therefore, it should be possible to discover if SR axons originating in different segments synapse with different parts of the FI6 dendritic region. To map the locations of putative synaptic contacts between FI6 and SR axons from different segments, we filled selected SR axons and an FI6 with different amounts of Neurobiotin. By using streptavidin–HRP to visualize the Neurobiotin and limiting the time allowed for the DAB reaction, we were able to label the two filled cells in each ganglion with different densities of reaction product (see Materials and Methods). These preparations were studied as cleared whole mounts, and the regions of each preparation that contained processes of both neurons were drawn with a camera lucida. In Figures 8 and9, drawings of three different preparations illustrate the structures of FI6 neurons and the axon terminals of contralateral SR1 neurons, or of contralateral SR2 neurons. The top parts of the two figures show these three preparations as they appeared in the microscope. The pairs of drawings in the bottom part of each figure separate the FI6 and the SR axon to show their shapes and the locations of their putative contacts. Because both the presynaptic axons and the postsynaptic dendritic regions could be identified in these preparations, we could compare the putative contacts made by SR axons from different segments. These comparisons revealed five general features: (1) SR axons originating in different segments made similar patterns of branches on both sides of the A6 midline. Homologous branches of these SR axons made contacts with FI6. (2) All SR axons made synaptic contacts with the same regions of FI6. (3) One or two lateral branches from the SR axon contacted branches of FI6 just proximal to the FI6 spike-initiating zone (Figs. 8, 9,gray arrowheads). (4) A branch projecting medially from each SR axon and a second branch projecting anteriorly from the end of the SR axon made contact directly with the major dendritic region of FI6 or with postsynaptic branches that arose directly from the major neurite (Figs. 8, 9, black arrowheads). (5) The number of FI6 branches that contacted SR axons originating in A3 was larger than the numbers that contacted SR axons originating in either A2 or A4 (Figs.8, 9, Table 3).
Fig. 8.
Camera lucida drawings of paired fills of an FI6 neuron and an SR1 axon from contralateral A2, A3, or A4. The primary structure of each neuron is drawn with dashed lines at the bottom; branches that make putative synaptic contacts are drawn with solid lines. Black arrowheads mark branches that contacted the main dendritic region of FI6; gray arrowheads mark branches that contacted FI6 near its spike-initiating zone (see Results).
Fig. 9.
Camera lucida drawings of paired fills of FI6 neurons and SR2s originating in contralateral A2, A3, or A4. The primary structure of each neuron in the pair is illustrated separately with dashed lines at the bottom. Branches that appeared to make synaptic contacts are shown with solid lines.Black arrowheads mark branches that contacted the main dendritic region of FI6; gray arrowheads mark branches that contacted FI6 near its spike-initiating zone (see Results).
Table 3.
Numbers of putative synaptic contacts between different SR axons and F16 neurons
| Segment | SR1 | SR2 |
|---|---|---|
| A2 | 8 | 5 |
| A3 | 11 (11) | 7 (10) |
| A4 | 6 | 6 (7,8) |
In parentheses, data from four more whole-mount preparations.
Because the positions of contacts made by SR axons originating in different segments overlapped broadly on the postsynaptic dendrite, these anatomical observations contradict the hypothesis that the segmental gradient observed in FI6 is caused by differences in the locations of synapses made by different SR axons.
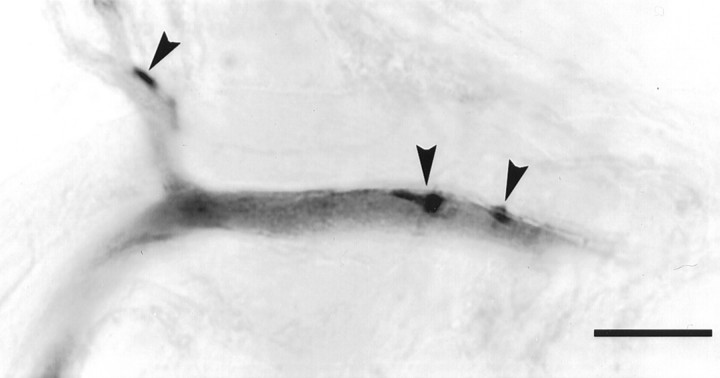
Another mechanism that might make some SR synapses stronger than others would be differences in the numbers of synaptic contacts between the presynaptic axon and the postsynaptic neuron. In crayfish neurons, synaptic release sites occur in local swellings along and at the ends of processes (Atwood and Lnenicka, 1986; Acevedo et al., 1994), and these swellings are visible in filled neurons under the light microscope. To count the numbers of contacts between FI6 and SR axons that made either strong or weak synapses, we filled pairs of cells with different amounts of Neurobiotin, cut serial plastic sections, and used high numerical aperture optics to resolve single points of contact (Fig. 10). A single point of contact was scored when the stained profiles of the two neurons became indistinguishably close.
Fig. 10.
A photograph of a 20 μm horizontal section through a paired fill of an FI6 and a contralateral SR2 from A3. The darkly labeled spots are boutons of the SR2; the lighter process is FI6. Three points of contact (arrowheads) occurred between a laterally projecting branch of SR2 and this process proximal to the spike initiating zone of FI6. Scale bar, 20 μm.
SR axons with stronger physiological synapses made more contacts with FI6
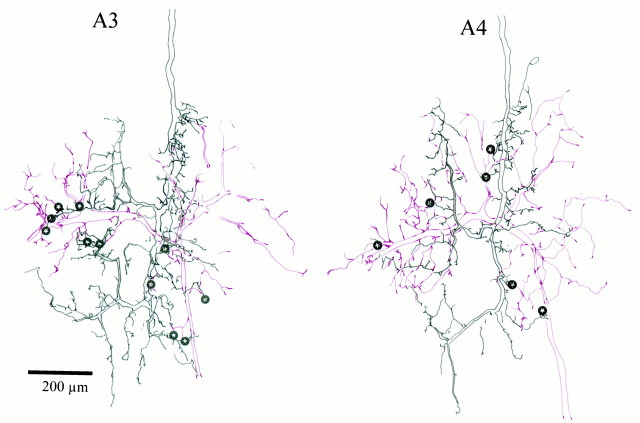
We successfully reconstructed the connections of six FI6 neurons with single SR axons from 20 μm serial horizontal sections. Two of these reconstructions are illustrated in Figure11, which shows the locations of putative synaptic contacts between these two pairs. The preparation on the left contained an SR1 originating in A3; that on the right had an SR1 originating in A4. These drawings include only those sections that contained parts of both neurons, so the cell body of FI6 and some of its branches were omitted because they lay in more ventral regions of A6, where SR branches did not go. These reconstructions also confirm that SR1s originating in A3 and A4 make contacts with the same regions on FI6. Table 3 presents the numbers of points of contact seen in each of these six reconstructions.
Fig. 11.
Locations of putative synaptic contacts between individual SR1 axons (black) and FI6 neurons (red), reconstructed from 20 μm serial plastic sections. On the left, a contralateral SR1 from A3 and an FI6 were filled. On the right, a contralateral SR1 from A4 and an FI6 were filled. The location of putative synaptic contacts (compare Fig. 8) are marked with stars. The gaps in some processes show places where the process continued dorsally or ventrally into sections not included in the reconstruction but then reentered the region of interest.
The SR1 from A3 made 11 putative synaptic contacts, whereas the SR1 from A4 made only six putative synaptic contacts (Fig. 11). As we observed in the whole-mount preparations (Figs. 8, 9), the number of contacts made by SR axons from A3 were larger than those made by SR axons originating in either A2 or A4. Because EPSPs from SR axons originating in A3 are larger than those from SR axons originating in either A2 or A4 (Figs. 2, 7, Table 1), these larger EPSPs are correlated with a larger number of putative synaptic contacts (Table3).
DISCUSSION
The segmental gradient of strengths of synapses between SR axons and FI6 neurons was present in every animal we examined. Details of this gradient differed from most others previously reported. Most other target neurons received their strongest EPSP from SRs entering A4, the most posterior segment regularly tested in the original experiments (Bastiani and Mulloney, 1988a). A small number of other neurons had a reversed gradient; they got their strongest EPSPs from SRs entering A1. FI6, an inhibitory motor neuron, had a third kind of gradient; its strongest EPSPs came from SRs entering A3 (Figs. 2, 7, Table 1). Another feature of the most common pattern is that contralateral SRs make weaker synapses than ipsilateral ones from the same segment, a feature absent from FI6 neurons. Despite these differences, we think that the gradient in FI6 is caused by the same underlying phenomena as the more common pattern, and the absence of ipsilateral–contralateral differences is because of the bilateral structure of FI6. Unlike many other A6 neurons that are also postsynaptic to SR axons, FI6 has bilateral dendritic branches, and individual SR axons contact multiple FI6 branches on both sides of the midline (Figs. 8, 9). FI neurons in more anterior ganglia also have bilateral dendritic regions and do not weight PSPs from ipsilateral axons more heavily than contralateral ones (Edwards and Mulloney, 1987).
The smooth progression of the no-Ca2+block is consistent with a monosynaptic chemical connection between these SR axons and FI6. If the connection were disynaptic, and made through a spiking relay neuron, we would predict a discontinuous change or disappearance of the PSPs as release from the SR declined and therefore the relay neuron failed to reach threshold. If there is an electrical component to these synapses, it contributes <20% of the total amplitude of the PSPs (Fig. 4).
Differences in the strength of SR synapses are not caused by differential spatial decrement of synaptic currents
If these gradients were caused by greater electrotonic decrement of some EPSPs than of others, the EPSPs would have different shapes as well as different amplitudes (Rall et al., 1967, 1992). The EPSPs that arise through stimulation of SR axons from different segments differ significantly in amplitude, but they do not differ in 10–90% rise time (Fig. 7). Rise time is a “shape index” that is sensitive to the electrical distance between the synapse and the recording site; PSPs from remote synapses have longer rise times than do those from nearby synapses (Rall and Rinzel, 1973; Rall et al., 1992). In contrast, these SR EPSPs have the same rise-times; they are simply scaled replicas of one another and cannot have arisen at different electrotonic differences from the recording site.
Differential attenuation of PSPs from different SR axons would require that these axons synapse at spatially segregated sites on branches of FI6. Spatial segregation of certain types of afferent terminals does occur in crayfish (Nagayama and Newland, 1993) and insects (Murphey, 1981; Burrows and Siegler, 1985; Jacobs et al., 1986; Hamon et al., 1990; Paydar et al., 1999). However, our analysis of the locations of point-of-contact between SR axons and FI6 (Figs. 8, 9) revealed that these axons contacted FI6 bilaterally and that the sites of contacts from different SR axons were intermingled in a way that would preclude differential postsynaptic decrement of their EPSPs. Therefore, this mechanism cannot account for these gradients in synaptic strength.
Nonlinear interactions between different SR synapses also do not appear to occur. On the contrary, the observed linear summation of SR EPSPs (Fig. 6, Table 2) suggests that FI6 integrates currents from these synapses in a straightforwardly passive manner, without either shunting or amplification of currents or presynaptic lateral interactions. This is different from the integration of information from cercal hairs in crickets (Jacobs et al., 1986), from leg hairs in locust (Burrows and Siegler, 1985), and from proprioceptor afferents from chorodotonal organs in the uropods of crayfish (Nagayama and Newland, 1993), all examples of central maps of sensory space. Therefore, these results contradict our speculation that the SR axons form a central map of positions of abdominal segments.
SR axons that made stronger synapses also made more contacts with FI6
In crustacea (Atwood and Lnenicka, 1986; Wojtowicz and Atwood, 1986; Atwood and Govind, 1990) and other animals (Bailey and Chen, 1989), processes like long-term facilitation or long-term sensitization that increase the functional strength of a synapse can also cause sprouting of the terminals of an axon and an increase in the area of synaptic contacts with its target cells. We were able to count individual points of contact between SR axons and FI6 neurons (Fig. 10, Table 3). If these contacts contain functional synaptic active zones, a possibility supported by electron microscopic and physiological evidence from axon terminals in other crustacean neurons (Atwood and Wojtowicz, 1986; Bradacs et al., 1997; Msghina et al., 1998, 1999), then these anatomical results might be evidence of presynaptic differences in release from SR axons originating in different segments. The numbers of contacts made by SR axons with stronger EPSPs were greater than the numbers made by other SR axons (Fig. 11, Table 3). If we assume that each contact is a functional release site with presynaptic vesicles and postsynaptic receptors and also assume that all contacts are equally effective, this difference in the numbers of contacts then suggests that SR axons from A3 have stronger synapses with FI6 because they have made more functional contacts with FI6. Because of this larger number of contacts, these axons release more transmitter onto FI6 than do other SR axons that have fewer points of contact.
What determines the relative strengths of SR synapses?
The strengths of SR synapses appear to be precisely tuned. The relative strengths of SR synapses with a particular target neuron are the same in different animals, but different target neurons predictably have different gradients (Bastiani and Mulloney, 1988a, their Figs. 6, 7). They demonstrated that different target neurons in the same preparation could have gradients of opposite slope; most got their biggest EPSPs from SRs entering A4 (the most posterior SRs tested), but some got their biggest EPSPs from SRs entering A1. So, whether an individual synapse of an SR axon with a particular target will be relatively stronger or weaker depends not only on the segment in which the SR originates but also on the identity of the postsynaptic neuron. For example, an SR2 from A1 would make weak a synapse with FI6 but a strong synapse with a local interneuron in the same ganglion. How does this occur?
Differences in presynaptic firing patterns can lead to long-lasting changes in release properties of crayfish motor neurons and in the anatomy of their synapses (Cooper et al., 1995), but in the case of the relative strengths of two synapses made by the same SR axon, the patterns of impulses that reach them are presumably identical. If this is right, the strength of each synapse made by each SR axon must be tuned by a mechanism that responds to cues from target neurons destined to have different gradients. Because there are target neurons whose strongest SR synapse comes from SRs from posterior segments and other targets whose weakest synapses come from these same SR axons, individual target neurons must either control the release properties of each SR synapse that contacts them or regulate separately the numbers of receptor molecules in the postsynaptic membrane opposite each release site. A similarly local specification of release properties of individual synapses has been demonstrated in the cercal afferent-giant interneurons system of crickets (Davis and Murphey, 1993, 1994) and also in synapses between a spiking local interneuron and different target neurons (Laurent and Sivaramakrishnan, 1992). There are excellent examples of structural and quantitative differences in strengths of synapses made by phasic motor neurons and tonic motor neurons innervating the same muscle fibers (Atwood and Wojtowicz, 1986;Lnenicka et al., 1991; Msghina et al., 1998, 1999), but because these neurons also differ in many other ways, it is unclear that the mechanisms that cause their synapses to differ are the same as those that shape these SR gradients. However, the same motor neuron can have different release properties at different synapses on fibers in the same muscle (Katz et al., 1993; Cooper et al., 1995), and the factors that establish those differences might also be at work in these central synapses.
Gradients of excitation and excitability have often been proposed to explain the ordered progression of movements during locomotion (Williams, 1992; Skinner and Mulloney, 1998), but unequivocal evidence of such gradients in adult animals is sparse (Tunstall and Roberts, 1994; Mulloney, 1997). Here we have demonstrated that an array of sensory afferents that arise in different segments converges onto individual neurons within the CNS to form chemical synapses. These synapses are qualitatively alike but differ significantly in strength. The patterns of these differences are stable and reproduced in every adult animal. These are the essential properties of a gradient of excitation.
Footnotes
This work was supported by National Institutes of Health Grants NS 21194 and NS 26742, by National Science Foundation Grant IBN 97-28791, and by Human Frontiers Science Program Grant RG0061/1998-B98. We thank Kim McAllister, Naranzogt, and Carolyn Sherff for reading critically various drafts of the manuscript, and Wendy Hall for invaluable assistance at every turn.
Correspondence should be addressed to Brian Mulloney, Section of Neurobiology, Physiology, and Behavior, University of California, Davis, Davis, CA 95616-8519. E-mail: bcmulloney@ucdavis.edu.
Dr. Nakagawa's present address: Department of Brain Science and Engineering, Faculty of Life Science and Systems Engineering, Kyushu Institute of Technology, Iizuka, Fukuoka 820–8502, Japan.
REFERENCES
- 1.Acevedo LD, Hall WM, Mulloney B. Proctolin and excitation of the crayfish swimmeret system. J Comp Neurol. 1994;345:612–627. doi: 10.1002/cne.903450411. [DOI] [PubMed] [Google Scholar]
- 2.Alexandrowicz JS. Muscle receptor organs in the abdomen of Homarus vulgaris and Palinuris vulgaris. Q J Microsc Sci. 1951;92:163–199. [Google Scholar]
- 3.Alexandrowicz JS. Receptor organs in thoracic and abdominal muscles of crustacea. Biol Rev. 1967;42:288–326. [Google Scholar]
- 4.Atwood HL, Govind CK. Activity-dependent and age-dependent recruitment and regulation of synapses in identified crustacean neurones. J Exp Biol. 1990;153:105–127. [Google Scholar]
- 5.Atwood HL, Lnenicka GA. Structure and function in synapses: emerging correlations. Trends Neurosci. 1986;9:248–250. [Google Scholar]
- 6.Atwood HL, Wojtowicz JM. Short-term and long-term plasticity and physiological differentiation of crustacean motor synapses. Int J Neurobiol. 1986;28:275–361. doi: 10.1016/s0074-7742(08)60111-7. [DOI] [PubMed] [Google Scholar]
- 7.Bailey CH, Chen M. Structural plasticity at identified synapses during long-term memory in Aplysia. J Neurobiol. 1989;20:356–372. doi: 10.1002/neu.480200508. [DOI] [PubMed] [Google Scholar]
- 8.Barker DL, Herbert E, Hildebrand JG, Kravitz EA. Acetylcholine and lobster sensory neurones. J Physiol (Lond) 1972;226:205–229. doi: 10.1113/jphysiol.1972.sp009981. [DOI] [PMC free article] [PubMed] [Google Scholar]
- 9.Bastiani MJ, Mulloney B. The central projections of the stretch receptor neurons of crayfish: segmental gradients of synaptic probability and strength. J Neurosci. 1988a;8:1264–1272. doi: 10.1523/JNEUROSCI.08-04-01264.1988. [DOI] [PMC free article] [PubMed] [Google Scholar]
- 10.Bastiani MJ, Mulloney B. The central projections of the stretch receptor neurons of crayfish: structure, variation, and postembryonic growth. J Neurosci. 1988b;8:1254–1263. doi: 10.1523/JNEUROSCI.08-04-01254.1988. [DOI] [PMC free article] [PubMed] [Google Scholar]
- 11.Bradacs H, Cooper RL, Msghina M, Atwood HL. Differential physiology and morphology of phasic and tonic motor axons in a crayfish limb extensor muscle. J Exp Biol. 1997;200:677–691. doi: 10.1242/jeb.200.4.677. [DOI] [PubMed] [Google Scholar]
- 12.Brown SK, Sherwood DN. Vascularization of the crayfish abdominal nerve cord. J Comp Physiol [A] 1981;143:93–101. [Google Scholar]
- 13.Bryan JS, Krasne FB. Protection from habituation of the crayfish lateral giant fiber escape response. J Physiol (Lond) 1977;271:351–368. doi: 10.1113/jphysiol.1977.sp012004. [DOI] [PMC free article] [PubMed] [Google Scholar]
- 14.Burrows M, Siegler MVS. Organization of receptive fields of spiking local interneurons in the locust with inputs from hair afferents. J Neurophysiol. 1985;53:1147–1157. doi: 10.1152/jn.1985.53.5.1147. [DOI] [PubMed] [Google Scholar]
- 15.Cooper RL, Marin L, Atwood HL. Synaptic differentiation of a single motor neuron: conjoint definition of transmitter release, presynaptic calcium signals, and ultrastructure. J Neurosci. 1995;15:4209–4222. doi: 10.1523/JNEUROSCI.15-06-04209.1995. [DOI] [PMC free article] [PubMed] [Google Scholar]
- 16.Davis GW, Murphey RK. A role for postsynaptic neurons in determining presynaptic release properties in the cricket CNS: evidence for retrograde control of facilitation. J Neurosci. 1993;13:3827–3838. doi: 10.1523/JNEUROSCI.13-09-03827.1993. [DOI] [PMC free article] [PubMed] [Google Scholar]
- 17.Davis GW, Murphey RK. Long-term regulation of short-term transmitter release properties: retrograde signaling and synaptic development. Trends Neurosci. 1994;17:9–13. doi: 10.1016/0166-2236(94)90028-0. [DOI] [PubMed] [Google Scholar]
- 18.Dumont JPC, Wine JJ. The telson flexor neuromuscular system of the crayfish I. Homology with the fast flexor system. J Exp Biol. 1987;127:249–277. [Google Scholar]
- 19.Edwards DH, Mulloney B. Synaptic integration in excitatory and inhibitory crayfish motoneurons. J Neurophysiol. 1987;57:1425–1445. doi: 10.1152/jn.1987.57.5.1425. [DOI] [PubMed] [Google Scholar]
- 20.Edwards DH, Heitler WJ, Krasne FB. Fifty years of a command neuron: the neurobiology of escape behavior in the crayfish. Trends Neurosci. 1999;22:153–161. doi: 10.1016/s0166-2236(98)01340-x. [DOI] [PubMed] [Google Scholar]
- 21.Fields HL. Proprioceptive control of posture in the crayfish abdomen. J Exp Biol. 1966;44:455–468. doi: 10.1242/jeb.44.3.455. [DOI] [PubMed] [Google Scholar]
- 22.Fields HL. Crustacean abdominal and thoracic muscle receptor organs. In: Mill PJ, editor. Structure and function of proprioceptors in the invertebrates. Plenum; New York: 1976. pp. 65–114. [Google Scholar]
- 23.Hamon A, Guillet JC, Callec JJ. A gradient of synaptic efficacy and its presynaptic basis in the cercal system of the cockroach. J Comp Physiol [A] 1990;167:363–376. doi: 10.1007/BF00192572. [DOI] [PubMed] [Google Scholar]
- 24.Jacobs GA, Theunissen FE. Functional organization of a neural map in the cricket cercal sensory system. J Neurosci. 1996;16:769–784. doi: 10.1523/JNEUROSCI.16-02-00769.1996. [DOI] [PMC free article] [PubMed] [Google Scholar]
- 25.Jacobs GA, Miller JP, Murphey RK. Integrative mechanisms controlling directional sensitivity of an identified sensory interneuron. J Neurosci. 1986;6:2298–2311. doi: 10.1523/JNEUROSCI.06-08-02298.1986. [DOI] [PMC free article] [PubMed] [Google Scholar]
- 26.Katz B, Miledi R. A study of synaptic transmission in the absence of nerve impulses. J Physiol (Lond) 1967;192:407–436. doi: 10.1113/jphysiol.1967.sp008307. [DOI] [PMC free article] [PubMed] [Google Scholar]
- 27.Katz PS, Kirk MD, Govind CK. Facilitation and depression at different branches of the same motor axon: evidence for presynaptic differences in release. J Neurosci. 1993;13:3075–3089. doi: 10.1523/JNEUROSCI.13-07-03075.1993. [DOI] [PMC free article] [PubMed] [Google Scholar]
- 28.Kita H, Armstrong W. A biotin-containing compound N-(2-aminoethyl)biotinamide for intracellular labeling and neuronal tracing studies: comparison with biocytin. J Neurosci Methods. 1991;37:141–150. doi: 10.1016/0165-0270(91)90124-i. [DOI] [PubMed] [Google Scholar]
- 29.Laurent G, Sivaramakrishnan A. Single local interneurons in the locust make central synapses with different properties of transmitter release on distinct postsynaptic neurons. J Neurosci. 1992;12:2370–2380. doi: 10.1523/JNEUROSCI.12-06-02370.1992. [DOI] [PMC free article] [PubMed] [Google Scholar]
- 30.Leise EM, Hall WM, Mulloney B. Functional organization of crayfish abdominal ganglia: I. The flexor systems. J Comp Neurol. 1986;253:25–45. doi: 10.1002/cne.902530104. [DOI] [PubMed] [Google Scholar]
- 31.Leise EM, Hall WM, Mulloney B. Functional organization of crayfish abdominal ganglia: II. Sensory afferents and extensor motor neurons. J Comp Neurol. 1987;266:495–518. doi: 10.1002/cne.902660405. [DOI] [PubMed] [Google Scholar]
- 32.Lnenicka GA, Hong SJ, Combatti M, LePage S. Activity-dependent development of synaptic varicosities at crayfish motor terminals. J Neurosci. 1991;11:1040–1048. doi: 10.1523/JNEUROSCI.11-04-01040.1991. [DOI] [PMC free article] [PubMed] [Google Scholar]
- 33.McCarthy BJ, MacMillan DL. Control of abdominal extension in the freely moving intact crayfish Cherax destructor. I. Activity of the tonic stretch receptor. J Exp Biol. 1999;202:171–181. doi: 10.1242/jeb.202.2.171. [DOI] [PubMed] [Google Scholar]
- 34.Miller MW, Vu ET, Krasne FB. Cholinergic transmission at the first synapse of the circuit mediating the crayfish lateral giant escape reaction. J Neurophysiol. 1992;68:2174–2184. doi: 10.1152/jn.1992.68.6.2174. [DOI] [PubMed] [Google Scholar]
- 35.Msghina M, Govind CK, Atwood HL. Synaptic structure and transmitter release in crustacean phasic and tonic motor neurons. J Neurosci. 1998;18:1374–1382. doi: 10.1523/JNEUROSCI.18-04-01374.1998. [DOI] [PMC free article] [PubMed] [Google Scholar]
- 36.Msghina M, Miller AG, Charlton MP, Govind CK, Atwood HL. Calcium entry related to active zones and differences in transmitter release at phasic and tonic synapses. J Neurosci. 1999;19:8419–8434. doi: 10.1523/JNEUROSCI.19-19-08419.1999. [DOI] [PMC free article] [PubMed] [Google Scholar]
- 37.Mulloney B. A test of the excitability-gradient hypothesis in the swimmeret system of crayfish. J Neurosci. 1997;17:1860–1868. doi: 10.1523/JNEUROSCI.17-05-01860.1997. [DOI] [PMC free article] [PubMed] [Google Scholar]
- 38.Mulloney B, Selverston AI. Organization of the stomatogastric ganglion of the spiny lobster. I. Neurons driving the lateral teeth. J Comp Physiol [A] 1974;91:1–32. [Google Scholar]
- 39.Murphey RK. The structure and development of a somatotopic map in crickets: the circal afferent projection. Dev Biol. 1981;88:236–246. doi: 10.1016/0012-1606(81)90167-6. [DOI] [PubMed] [Google Scholar]
- 40.Nagayama T, Newland PL. A sensory map based on velocity threshold of sensory neurones from a chordotonal organ in the tailfan of the crayfish. J Comp Physiol [A] 1993;172:7–15. doi: 10.1007/BF00214711. [DOI] [PubMed] [Google Scholar]
- 41.Newland PL, Aonuma H, Nagayama T. Monosynaptic excitation of lateral giant fibres by proprioceptive afferents in the crayfish. J Comp Physiol [A] 1997;181:103–109. [Google Scholar]
- 42.Paydar S, Doan CA, Jacobs GA. Neural mapping of direction and frequency in the cricket cercal sensory system. J Neurosci. 1999;19:1771–1781. doi: 10.1523/JNEUROSCI.19-05-01771.1999. [DOI] [PMC free article] [PubMed] [Google Scholar]
- 43.Rall W, Rinzel J. Branch input resistance and steady attenuation for input to one branch of a dendritic neuron model. Biophys J. 1973;13:648–688. doi: 10.1016/S0006-3495(73)86014-X. [DOI] [PMC free article] [PubMed] [Google Scholar]
- 44.Rall W, Burke RE, Smith TG, Nelson PG. Dendritic location of synapses and possible mechanisms for the monosynaptic EPSP in motoneurones. J Neurophysiol. 1967;30:1169–1193. doi: 10.1152/jn.1967.30.5.1169. [DOI] [PubMed] [Google Scholar]
- 45.Rall W, Burke RE, Holmes WR, Jack JJB, Redman SJ, Segev I. Matching dendritic neuron models to experimental data. Physiol Rev. 1992;72 [Suppl]:S159–S186. doi: 10.1152/physrev.1992.72.suppl_4.S159. [DOI] [PubMed] [Google Scholar]
- 46.Skinner FK, Mulloney B. Intersegmental coordination in invertebrates and vertebrates. Curr Opin Neurobiol. 1998;8:725–732. doi: 10.1016/s0959-4388(98)80114-1. [DOI] [PubMed] [Google Scholar]
- 47.Takahata M, Wine JJ. Feedforward afferent excitation of peripheral inhibitors in the crayfish escape system. J Neurophysiol. 1987;58:1452–1468. doi: 10.1152/jn.1987.58.6.1452. [DOI] [PubMed] [Google Scholar]
- 48.Tunstall MJ, Roberts A. A longitudinal gradient of synaptic drive in the spinal cord of Xenopus embryos and its role in co-ordination of swimming. J Physiol (Lond) 1994;474:393–405. doi: 10.1113/jphysiol.1994.sp020031. [DOI] [PMC free article] [PubMed] [Google Scholar]
- 49.Wiersma CAG. On the functional connections of single units in the central nervous system of the crayfish, Procambarus clarkii. J Comp Neurol. 1958;110:421–471. doi: 10.1002/cne.901100306. [DOI] [PubMed] [Google Scholar]
- 50.Wiersma CAG, Bush BMH. Functional neuronal connections between the thoracic and abdominal cords of the crayfish, Procambarus clarkii. J Comp Neurol. 1963;121:205–235. doi: 10.1002/cne.901210206. [DOI] [PubMed] [Google Scholar]
- 51.Wiersma CAG, Hughes GM. On the functional anatomy of neuronal units in the abdominal cord of the crayfish, Procambarus clarkii. J Comp Neurol. 1961;116:209–228. doi: 10.1002/cne.901160209. [DOI] [PubMed] [Google Scholar]
- 52.Wiersma CAG, Pilgrim RLC. Thoracic stretch receptors in crayfish and rock lobster. Comp Biochem Physiol. 1961;2:51–64. [Google Scholar]
- 53.Wiersma CAG, Furshpan E, Florey E. Physiological and pharmacological observations on muscle receptor organs of the crayfish. J Exp Biol. 1953;30:136–150. [Google Scholar]
- 54.Williams TL. Phase coupling by synaptic spread in chains of coupled neuronal oscillators. Science. 1992;662:662–665. doi: 10.1126/science.1411575. [DOI] [PubMed] [Google Scholar]
- 55.Wine JJ, Hagiwara G. Crayfish escape behavior. I. The structure of efferent and afferent neurons involved in abdominal extension. J Comp Physiol [A] 1977;121:145–172. [Google Scholar]
- 56.Wojtowicz JM, Atwood HL. Long-term facilitation alters transmitter releasing properties at the crayfish neuromuscular junction. J Neurophysiol. 1986;55:484–498. doi: 10.1152/jn.1986.55.3.484. [DOI] [PubMed] [Google Scholar]
- 57.Zucker RS. Crayfish escape behavior and central synapses. I. Neural circuit exciting lateral giant fiber. J Neurophysiol. 1972;35:599–620. doi: 10.1152/jn.1972.35.5.599. [DOI] [PubMed] [Google Scholar]
- 58.Zucker RS. Calcium- and activity-dependent synaptic plasticity. Curr Opin Neurobiol. 1999;9:305–313. doi: 10.1016/s0959-4388(99)80045-2. [DOI] [PubMed] [Google Scholar]


