

Abstract
The effect of retinoids on the expression of κ opioid receptor (KOR) gene was examined in normal and transgenic animals. KOR-lacZ transgene expression was specifically elevated in KOR-positive areas of the developing CNS by depleting vitamin A from animal diets. The endogenous KOR mRNA species, including all three isoforms, were also upregulated by depleting vitamin A in developing animals. Change in the expression of isoforms a and b is similar in prenatal stages but differs during postnatal development. Interestingly, upregulation of isoform c is most significant postnatally. The regulation of KOR gene by vitamin A was substantiated in a mouse embryonal carcinoma P19 culture system in which retinoic acid (RA), the most potent ingredient of vitamin A, was able to suppress the expression of all the three KOR isoforms and KOR protein. The RA-mediated suppression was blocked by an RA receptor antagonist and a histone deacetylase (HDAC) inhibitor. By using a reporter transfection assay in P19 cells, the potential genetic element responsible for RA-mediated suppression of KOR gene expression was located to intron 1 of the mouse KOR gene, which could also be blocked by HDAC inhibitor. Furthermore, suppression of KOR gene expression by RA in P19 cells appeared to be an indirect event and required protein synthesis. A role of RA in KOR gene regulation during developmental stages was discussed.
Keywords: κ opioid receptor, vitamin A, retinoic acid, transgenic mouse, gene expression, central nervous system
Three opioid receptor types, μ, δ, and κ, exist in animals, and their genes have been cloned (Goldstein and Naidu, 1989; Wei and Loh 1996). In knock-out animal models, it has been shown that opioid receptors mediate the pharmacological and toxic effects of morphine, as well as certain animal behaviors (Matthes et al., 1996; Sora et al., 1997; Tian et al., 1997; Loh et al., 1998; Simonin et al., 1998). The expression patterns of opioid receptors have been examined primarily by in situhybridization, immunohistochemistry, and ligand binding assays (Kitchen et al., 1990; Rius et al., 1991; Elde et al., 1995; Kieffer 1995; Knapp et al., 1995; Mansour et al., 1995; Zhu et al., 1998). Recently, the genetic basis underlying the ontogenesis of the κ opioid receptor (KOR) has been revealed in transgenic animals (Hu et al., 1999).
The expression of opioid receptors is detected primarily in the CNS; however, the mechanism underlying their unique expression patterns is not known. Recently, we have demonstrated the expression of opioid receptors in embryonal carcinoma cells P19 and that opioid receptor expression changes as these cells undergo differentiation, suggesting an association of opioid receptors with developmental programs (Chen et al., 1999). To gain an insight into the genetic information underlying their specific expression patterns, we have used a lacZ reporter strategy to generate KOR-lacZ transgenic mice (Hu et al., 1999). In this model, lacZ expression recapitulates most endogenous KOR expression during developmental stages (Zhu et al., 1998). The mouse KOR gene contains four exons and uses two promoters. Promoter 1 directs the expression of two mRNA isoforms that differ by 30 nucleotides attributable to alternative splicing at intron 1. Therefore, a total of three KOR isoforms can be generated, designated a, b, and c (Wei et al., 2000). The KOR-lacZ fusion gene represents the combined activities of KOR transcripts and provides an efficient tool to examine KOR gene activities in animals without performing extensive in situ hybridization or immunohistochemistry.
Retinoic acid (RA), the active ingredient of vitamin A, affects many developmental events in animals, including pattern formation, cell lineage determination, and apoptosis (Maden et al., 1997, 1998; Maden 1999). Vitamin A deficiency results in numerous developmental defects (White et al., 2000) as well as neurological dysfunction in adults, such as seizures (Lakritz et al., 1993). Therefore, of particular interest is whether the RA system affects opioid receptor expression in developing animals and whether RA is involved in the establishment of the developmental cue required for unique opioid receptor expression patterns. To address these questions, we first examined the established KOR-lacZ transgenic mouse model. We then investigated the effects of vitamin A status on endogenous KOR expression to confirm the fidelity of transgene analyses. Third, the regulation of KOR gene by vitamin A was substantiated in P19 in which the effects of RA on KOR gene and protein expression were examined. Finally, we begun to identify potential genetic elements responsible for RA-mediated KOR gene suppression.
MATERIALS AND METHODS
Manipulation of vitamin A status in animals.Manipulating the vitamin A status of animals was performed according to published studies (Lee et al., 1996; Wei et al., 1997). Briefly, normal female mice were kept on a vitamin A-deficient diet (TD86143; Harlan, Madison WI) 6 weeks before mating with KOR-lacZ transgenic male homozygotes and maintained on the same diet until the day the animal was killed. Embryos were obtained from the hypovitaminosis A (A−) female animals at the desired gestation stages and analyzed for RNA or lacZ expression. For postnatal stages, live born animals derived from these females were killed at the desired dates, and the brain and spinal cord were analyzed for KOR or KOR-lacZ expression.
Analyses of mRNA. RNA was isolated from mouse tissues using a TRIZOL solution (Life Technologies, Rockville, MD) as described previously (Wei et al., 2000). To detect the expression of endogenous KOR mRNA isoforms, an established reverse transcription (RT)-PCR procedure was used (Wei et al., 2000). Briefly, RNA was reverse-transcribed using oligo-dT as the primer for RT, followed by PCR with primer pairs specific to isoforms a, b, and c. Isoform a represents transcripts derived from the first promoter and spliced at the first identified splice acceptor site, and isoform b represents transcripts derived from the first promoter and alternatively spliced at 30 nucleotides 5′ to the first identified splice acceptor site. Isoform c represents transcripts derived from promoter 2 (Wei et al. 2000). In addition, an actin-specific primer pair was included in all of the reactions as the internal control. All of the primer sequences and PCR reaction conditions have been described previously (Wei et al. 2000). One-fifth of the PCR product was analyzed on 1% agarose gels, followed by Southern blot hybridization with probes specific to the mouse KOR and actin transcripts. Hybridization signals were quantified using a PhosphorImager (Molecular Dynamics, Sunnyvale, CA). KOR-specific signals were normalized to actin-specific signals to determine the relative level of specific KOR isoform expression, represented as the relative intensity. Three independent experiments were conducted to determine the means and SEM.
Enzyme histochemical analyses of transgene expression. In situ lacZ enzymehistochemistry was conducted as described previously (Wei and Chang, 1996; Hu et al., 1999). Briefly, the specimen (embryos, dissected brain regions, and spinal cord) were fixed in 0.25% glutaraldehyde in PBS at 4°C for 2 hr or longer. Specimens were washed three times with PBS and stained with a 5-bromo-4-chloro-3-indolyl-β-d-galactoside (0.5 mg/ml) solution at room temperature for 8–10 hr (Wei and Chang, 1996). The stained specimen were observed under a stereoscope. The images of whole-mount specimen were obtained from a Nikon (Tokyo, Japan) digital camera. The anatomic terminology was according to Kaufman (1992) andFranklin (1997).
P19 cell culture procedure. P19 cultures were maintained as described previously (Wei and Chang, 1996). All-trans RA was added at the concentration range of 10−6to 10−8m, and RNA was collected at different time points, followed by RT-PCR analysis as described above. A specific RA receptor (RAR) antagonist, AGN193109, was obtained from Allergan (Irvine, CA) and added to 10−6m. Trichostatin A (TSA) (Sigma, St. Louis, MO) was added to 50 nm. For cycloheximide treatment, 2 μg/ml cycloheximide was added to RA-treated cultures for a duration of 24 hr before the isolation of RNA at the time points indicated. RNA was subjected to RT-PCR analyses.
Immunohistochemical analyses of KOR protein on P19 cultures.Immunohistochemistry was performed as described previously (Chen et al., 1999). Briefly, P19 cells were fixed with ethanol/chloroform/acetic acid (6:3:1) and stained with either preimmune serum or a 1:50 dilution of a specific rabbit antibody (Chen et al., 1999), followed by reaction with a Cy3-conjugated donkey anti-rabbit antibody (Santa Cruz Biotechnology, Santa Cruz, CA). The image was observed under a Zeiss (Oberkochen, Germany) fluorescent scope.
KOR-luciferase reporters and transfection studies. Two luciferase reporters, with or without intron 1, of the mouse KOR gene were generated. The first reporter, k45, was constructed by fusing a 1.3 kb genomic fragment 5′ to the initiation codon, released byBamHI and NcoI digestion, toBglII/NcoI sites of the pGL3 vector (Promega, Madison, WI). The second reporter, k19, was constructed by fusing the identical 5′ upstream region from the KOR cDNA (deleting intron 1) to the same pGL3 reporter. P19 cultures were treated with 10−6m RA for 48 hr before plating for transfection. Transfection and determination of reporter activities were conducted as described previously (Chang and Wei, 1997). Briefly, 0.5 μg of luciferase reporter and 0.1 μg of lacZ internal control (Lee et al., 1998) were precipitated with calcium phosphate and introduced into cultures. Thirty hours after transfection, luciferase and lacZ activities were determined, and relative luciferase units (RULs) were calculated by normalizing luciferase activities to lacZ activities. Triplicate cultures were used in each experiments, and two independent experiments were conducted to obtain the means and SEM.
RESULTS
Expression of KOR-lacZ in animals fed a vitamin A-deficient diet
The expression of the KOR gene in animals has been shown primarily by the use of in situ hybridization and immunohistochemistry. However, these techniques are somewhat limited in revealing the entire pattern of KOR expression in animals. The use of lacZ reporter in transgenic animals can greatly reduce the amount of time on analyzing gene expression in animal tissues, and the expression pattern can be examined on the whole-mount specimen in a three-dimensional manner. Although the use of a reporter may not reveal the complete pattern of expression, this strategy does offer an opportunity to examine gene expression patterns more efficiently and to dissect the genetic information required for such expression patterns, as long as sufficient regulatory information is included in the reporter construct. Previously, we have created KOR-lacZ transgenic mouse lines in which lacZ expression pattern recapitulates most of the endogenous KOR gene activity in developing animals (Hu et al., 1999). By taking advantage of this transgenic mouse model, we attempted to examine changes in the expression pattern of the KOR gene resulting from experimental manipulation. For this study, a total of three transgenic lines that consistently express the KOR-lacZ transgene were used. All three lines express the transgene in a very similar pattern and exhibit a very similar response to dietary manipulation. The results obtained from one line were presented here. For consistency, transgenic male homozygotes were mated to nontransgenic females (fed a control or vitamin A-deficient diet) to obtain transgenic heterozygotes for analyses.
As reported previously, KOR-lacZ expression in control embryos is detected in hindbrain roof and bronchial arches as early as embryonic day 9 (E9) and extends to different brain regions, such as forebrain, midbrain, hindbrain, and the spinal cord at E11–E12 (Hu et al., 1999). By E13–E14, the expression in the sense organ primordia is intensified. Interestingly, transgene expression in embryos derived from A− mothers appears to be elevated, most significantly in E13–E14 embryos. Figure 1 shows the comparison of a whole-mount control (A, C) and an A− (B, D) embryo at E14. LacZ expression patterns of the whole-mount specimen are very similar in both control and A− groups; however, the intensity of lacZ staining is significantly elevated in the primordia of the eyes (ey), the ears (ea), and the nose (n) of the A− (B) embryo compared with the control (A). Change in internal lacZ staining of the whole-mount embryos can be demonstrated in embryos spliced sagittally in half, as shown in C and D. It is obvious that lacZ expression in specific brain areas, including cortex (c), hippocampus (h), dorsal thalamus (dt), ventral tegmental nucleus (v), pons (p), medulla (m), and the neural tube (nt), is significantly elevated in the A− embryo (D).
Fig. 1.

Elevation of KOR-lacZ expression in developing mouse embryos derived from vitamin A-deficient (A−) mothers.A, A control transgenic embryo stained with lacZ.B, An A− embryo stained with lacZ. C, Internal staining of control embryo shown in A.D, Internal staining of an A− embryo shown inB. c, Cortex; dt, dorsal thalamus; ea, ear; ey, eye;h, hippocampus; m, medulla;n, nose; nt, neural tube;p, pons; v, ventral tegmental nucleus.
To follow the effects of depleting vitamin A on KOR expression in the CNS of early postnatal animals, brain and spinal cord of postnatal animals were stained and analyzed. Figure2 shows the comparison of whole-mount lacZ staining patters of different brain areas and spinal cord between control (A, C, E, G) and A− (B, D, F, H) pups at 2 weeks of age. It appears that lacZ expression in brain and spinal cord of A− pups is also elevated compared with the control. In the forebrain (A, B), lacZ expression is highly elevated in accumbens nucleus (acb), lateral septal nucleus (ls), hippocampus (h), and cortex deep layer (co). In the midbrain (C, D), lacZ expression is highly elevated in periaqueductal gray (pag), external cortex (ec), parvicellular nucleus trigeminal nerve (pc5), and rubrospinal tract (rs). In the hindbrain (E, F), lacZ expression is elevated in solitary tract and solitary tract nucleus (sol), spinal trigeminal tract (stt), and spinal trigeminal nucleus (stn). In the spinal cord (G, H), lacZ expression is particularly elevated in the dorsal horn (dh).
Fig. 2.
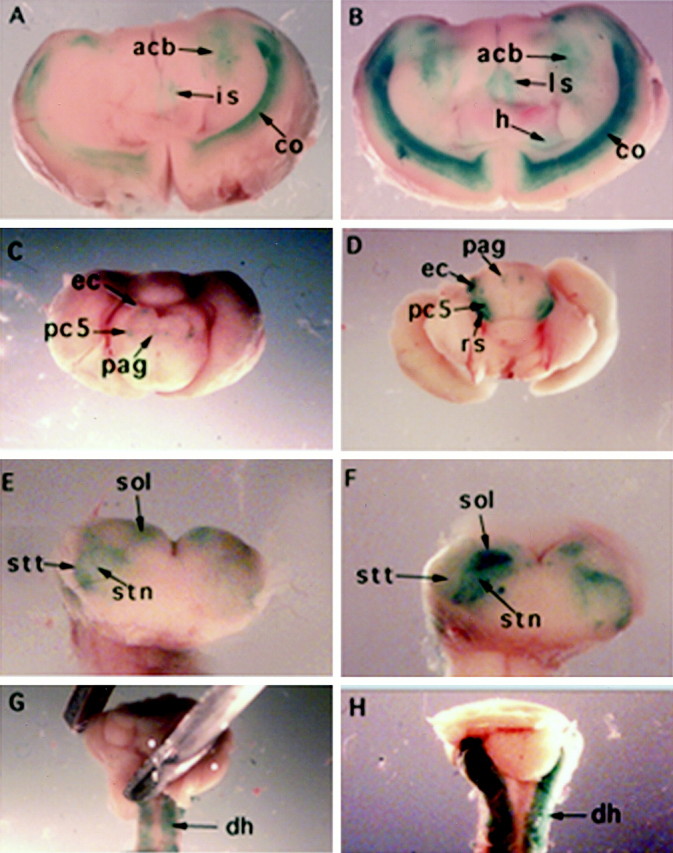
Elevation of KOR-lacZ expression in the developing CNS of A− transgenic mice. A, Control forebrain.B, A− forebrain. C, Control midbrain.D, A− midbrain. E, Control hindbrain.F, A− hindbrain. G, Control spinal cord.H, A− spinal cord. acb, Accumbens nucleus; co, cortex; dh, dorsal horn;ec, external cortex; h, hippocampus;ls, lateral septal nucleus; pag, periaqueductal gray; pc5, parvicellular nucleus trigeminal nerve; rs, rubrospinal tract;sol, solitary tract nucleus; stn, spinal trigeminal nucleus; stt, spinal trigeminal tract.
Therefore, KOR-lacZ transgene expression is elevated in specific areas of the developing CNS of animals fed a vitamin A-deficient diet. The effect is significant, beginning from midgestation stage (E14) to early postnatal stages (2 weeks). Furthermore, the elevation is specific to KOR-lacZ-positive areas, indicating that upregulation is specific to KOR-positive tissues.
Expression of endogenous KOR mRNAs in developing animals
To confirm the effects of depleting vitamin A on KOR expression, the expression of the endogenous KOR gene was monitored by using an established RT-PCR procedure as described in our previous studies (Wei et al., 2000). The positions of primers and the expected PCR products are shown in Figure 3A. The expression levels of the three endogenous KOR mRNA isoforms, a, b and c, in nontransgenic mice (including control and A− groups) at E12, E14, and 2 weeks postnatal were compared. A total of three or more independent experiments (from different animals) were conducted to obtain the statistic results. Figure 3B shows a represented RT-PCR analysis after hybridization, and Figure 3C–E show statistical analyses of quantitative changes in the expression of the three isoforms. It is obvious that the expression of all three KOR isoforms are elevated in specimen derived from A− animals (lanes 2, 4, 6, 8, 10,12) compared with control groups (lanes 1,3, 5, 7, 9, 11) in most time points examined. The changes are more significant as animals develop (E14 to 2 weeks old, lanes 5–12). Among the three isoforms, changes in expression of isoforms a and b are similar (C, D), confirming their common regulation by promoter 1. However, in postnatal 2-week-old animals, upregulation of isoform b (generated by alternative splicing) is particularly high in the brain (D), suggesting that regulation at alternative splicing becomes more significant during postnatal development. Elevation of transcript c, which is derived from the second promoter, is obvious in E14 body and postnatal CNS (E). For all of the KOR isoforms, change in the expression levels begin primarily at E14, suggesting a crucial time window of regulation for KOR expression during midgestation stages.
Fig. 3.
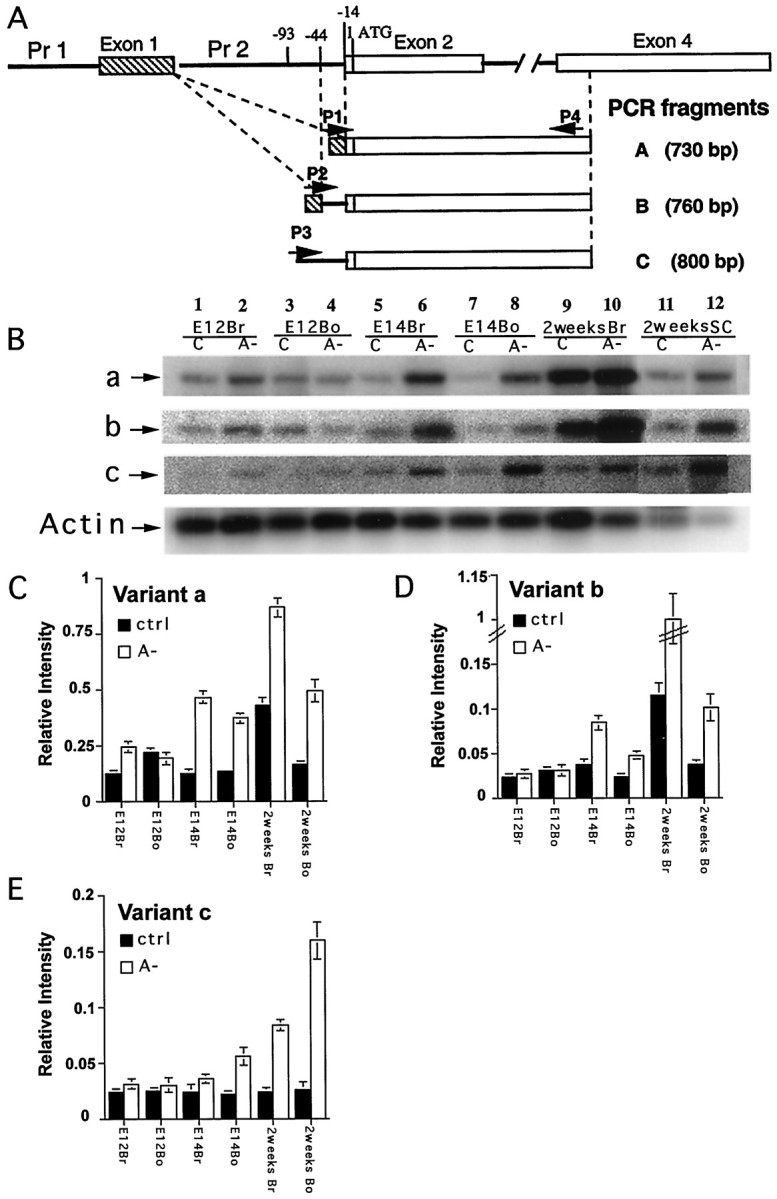
Upregulation of KOR mRNA in A− animals and embryos. A, The positions of primers (P1– P4) used to amplify KOR isoform mRNA and the sizes of the expected PCR products. P1spans the specific splicing junction of exons 1/2 of Variant A. P2 spans the specific splicing junction of exons 1/2 ofVariant B. P3 is specific for Variant C. P4 is the antisense primer in exon 4, which is common to all three variants.B, Embryos at E12 and E14 were obtained from control mothers (C) or A− mothers and were dissected into brain (Br) and body (Bo) for RNA isolation. Postnatal animals at 2 weeks old were killed, and brain and spinal cord (SC) were dissected out for RNA isolation. RT-PCR was conducted as described in Materials and Methods for the analyses of three KOR mRNA isoforms, a, b, and c. Internal control, actin, was included in each reaction. C, Statistical analyses of isoform a expression in control (ctrl) and A− animals during development. Three independent RT-PCR experiments were conducted to examine three animals, and the data were quantified by PhosphorImager analyses. The level of KOR isoform a expression was determined by normalizing KOR isoform a level to actin message level. D, Statistical analyses of KOR isoform b expression in control and A− animals during development.E, Statistical analyses of KOR isoform c expression in control and A− animals during development.
From these series of experiments, it is concluded that the expression of the endogenous KOR gene is also elevated by depleting vitamin A during developmental stages. All three KOR isoforms, a, b and c, are upregulated, and the sensitive time window begins at the midgestation stages. Isoforms a and b are similarly regulated in prenatal stages but differentially regulated at postnatal stages. Isoform c is upregulated most significantly in postnatal animals and the trunk of E14 embryos.
Regulation of KOR gene expression by RA in P19 cells
The observation that KOR gene expression was elevated by depleting vitamin A in developing animals prompted us to examine the effects of RA, the major active ingredient of vitamin A, on KOR gene expression. However, RA induced teratogenic effects in animals, and it was not possible to determine the specific effect of RA on KOR gene expression without the complication of its pleiotrophic effects in the animals. Therefore, we used P19 embryonal carcinoma stem cell culture, which expresses a basal level of KOR transcripts (Chen et al., 1999). During RA treatment, P19 cells undergo differentiation into a variety of cell lineages, including neurons. To examine the effects of RA on KOR expression in this culture model, P19 stem cells were treated with RA, and RNA was isolated and analyzed by RT-PCR to determine the level of KOR transcript expression. Figure4A shows suppression of all three KOR mRNA species by RA in an RA dose-dependent manner. Because RA at a concentration of 10−6m is most efficient in inducing neuronal differentiation, the effect of 10−6m RA on KOR expression at different time points was analyzed, as shown in Figure 4B. RA effectively suppressed the expression of all three isoforms at 3 (RAD3) and 5 (RAD5) d of treatment. However, the suppressive effect of RA is somewhat late during the course of treatment, and thus it was tempting to speculate that changes in transcription machinery or chromatin structure (e.g., histone acetylation) might be involved in RA-mediated suppression of this gene. As a preliminary test, the histone deacetylase (HDAC) inhibitor TSA was used to address this possibility. As shown in Figure 4C, it appeared that RA-mediated suppression of the three KOR isoforms (RAD3) was effectively alleviated by the addition of TSA (RAD3+TSA). The expression in the control (TSA) did not change KOR expression significantly.
Fig. 4.
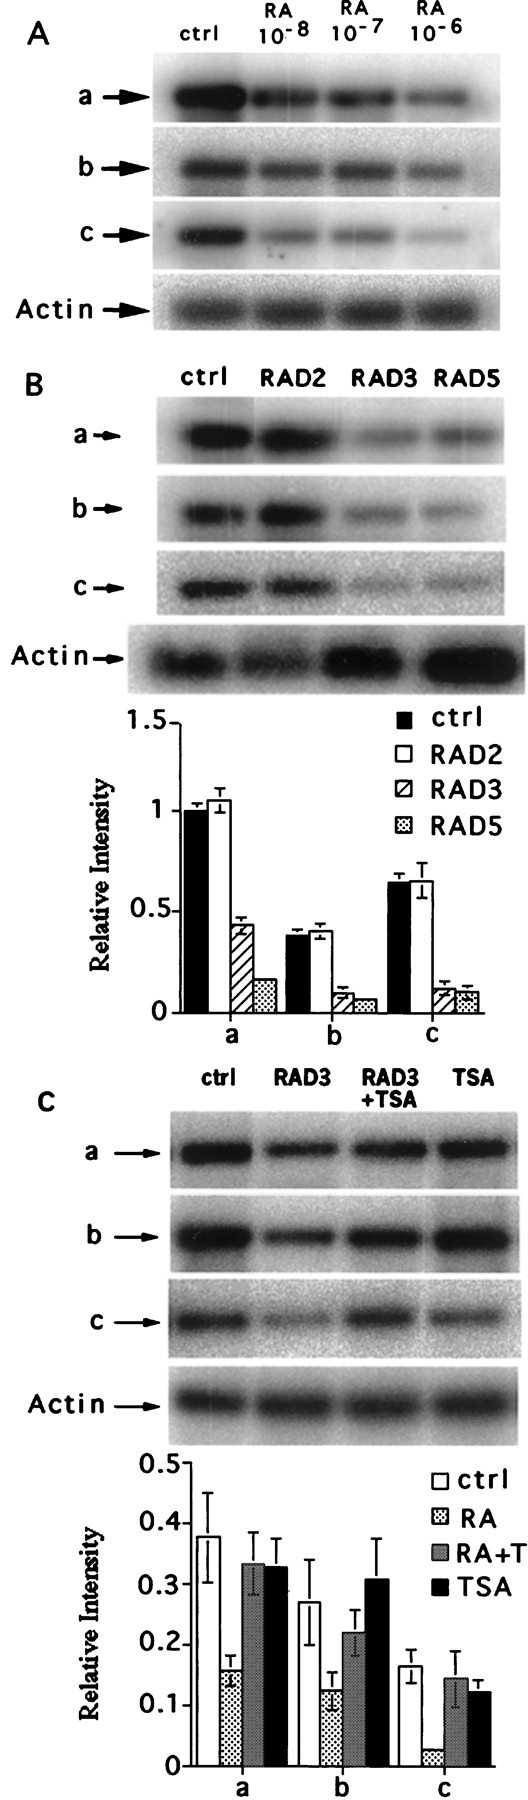
Suppression of KOR expression in P19 cells.A, RA dose-dependent suppression of KOR isoforms detected by RT-PCR. B, KOR isoform expression in P19 control culture (ctrl) and RA treatment for 2 (RAD2), 3 (RAD3), and 5 (RAD5) d was detected by RT-PCR as described in the legend for Figure 3. Statistical analyses are shown in thebottompanel. C, RA-mediated suppression of KOR expression can be blocked by TSA. RT-PCR analyses of RA-mediated suppression at day 3 (RAD3), in the presence of TSA (50 nm) (RAD3+TSA), and in cultures treated with TSA alone. Statistical analyses are shown in the bottom panel.
To demonstrate the specificity of the effect of RA on KOR gene expression, a specific RAR antagonist, AGN193109, was used to determine whether this effect was the result of an RAR-mediated process. As shown in Figure 5, the suppressive effect of RA (RAD3) was efficiently blocked by the addition of AGN193109 (RA+AgD3). As expected, the RAR antagonist by itself had no significant effects on KOR expression (AgD3).
Fig. 5.
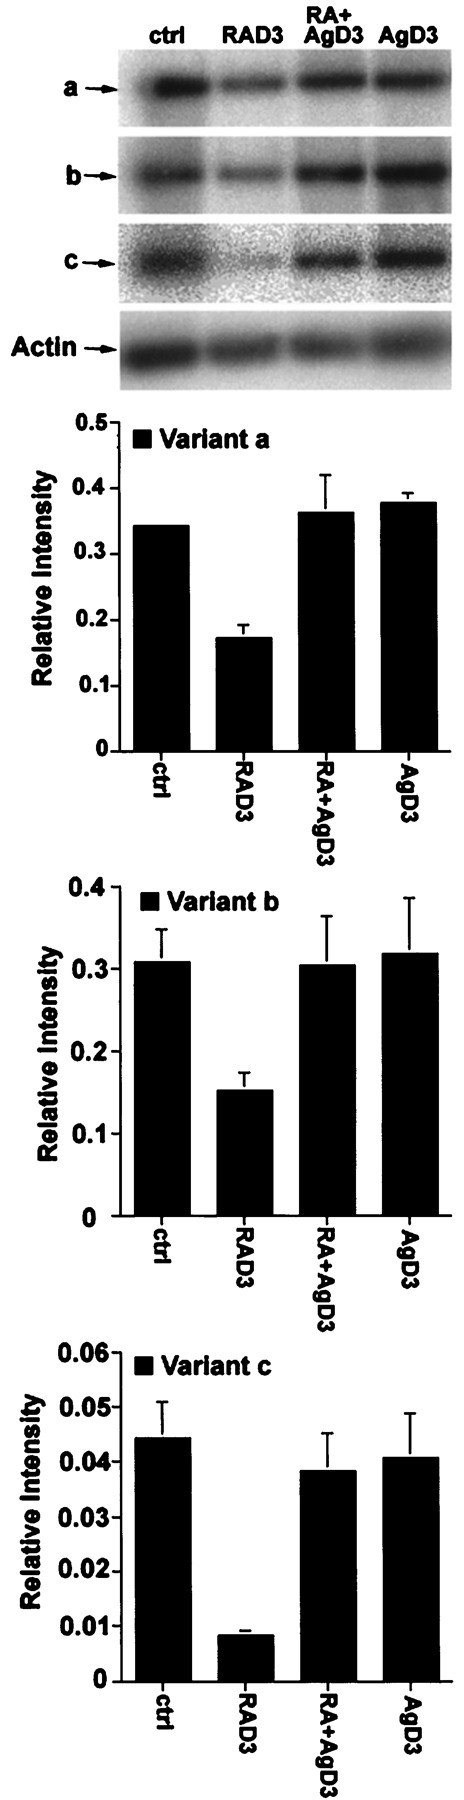
RA suppression of KOR expression can be reversed by a specific RAR antagonist. P19 treated with RA (RAD3) (10−6m), RA plus AGN193109 (RA+AgD3) (10−6m), or AGN193109 alone (AgD3). RT-PCR analyses of KOR isoform expression are shown in the top panel, and statistical analyses are shownbelow.
The fact that suppression of KOR expression by RA did not occur until 2–3 d of RA treatment suggested that other factors induced by RA were needed for such a regulatory event. A protein synthesis inhibitor, cycloheximide, was used to examine this possibility, as shown in Figure6. Cultures were treated with RA for 2, 4, or 6 d, followed by the addition of vehicle or cycloheximide for a duration of 24 hr. RNA was then isolated at days 3, 5, and 7 and subjected to RT-PCR analysis. Figure 6A shows representative blots of such analyses with the statistical results. The three KOR isoforms are consistently suppressed by RA treatment, and as expected, cycloheximide blocks the suppressive effect of RA on KOR expression as evidenced by the increased level of KOR expression in cycloheximide-treated cultures (RA+CH). However, as cultures are induced with RA for longer periods of time, the effect of cycloheximide becomes less significant, suggesting that additional factors may contribute to the expression of KOR in more differentiated or committed cells. For a control, cycloheximide alone was used in parallel experiments, as shown in Figure6B, in which RA effectively suppressed the expression of three KOR isoforms (RAD3). Additionally, this suppression was effectively blocked by cycloheximide (RAD3+CH). The control, cycloheximide alone, had no significant effects on KOR expression (CH).
Fig. 6.
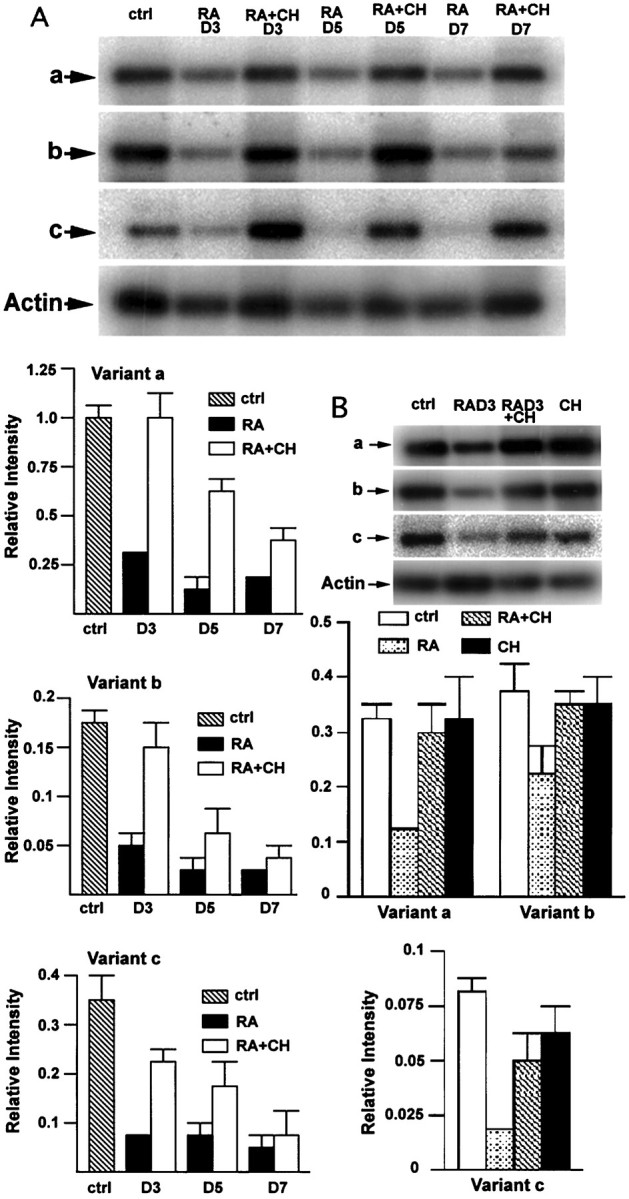
RA suppression of KOR expression requires protein synthesis. A, RT-PCR was conducted to determine KOR isoform expression in P19 control (ctrl), treated with RA for 3 (RAD3), 5 (RAD5), and 7 (RAD7) d, and treated with RA in the presence of cycloheximide at the final day of culture (RA+CH). Statistical analyses of KOR isoform expression are shown at the left panelbelow the picture. B, Parallel experiments examining the effect of cycloheximide on KOR expression. P19 was treated with RA (RAD3), RA plus cycloheximide (RAD3+CH), or cycloheximide alone (CH). Statistical analyses are shownbelow the picture.
To address whether the effect of RA on KOR mRNA expression could be translated to the level of protein expression, immunohistochemistry was performed to examine KOR protein expression in P19 cell cultures, as shown in Figure 7. C shows a P19 stem cell culture stained with an anti-KOR antibody (Chen et al., 1999), and D shows a bright-field image of this culture. Consistent with the RNA data, KOR expression in P19 cultures treated with RA for 3 (E, F) and 5 (G,H) d is also significantly reduced. In preimmune serum-stained control culture (A), no specific immunostaining is observed.
Fig. 7.
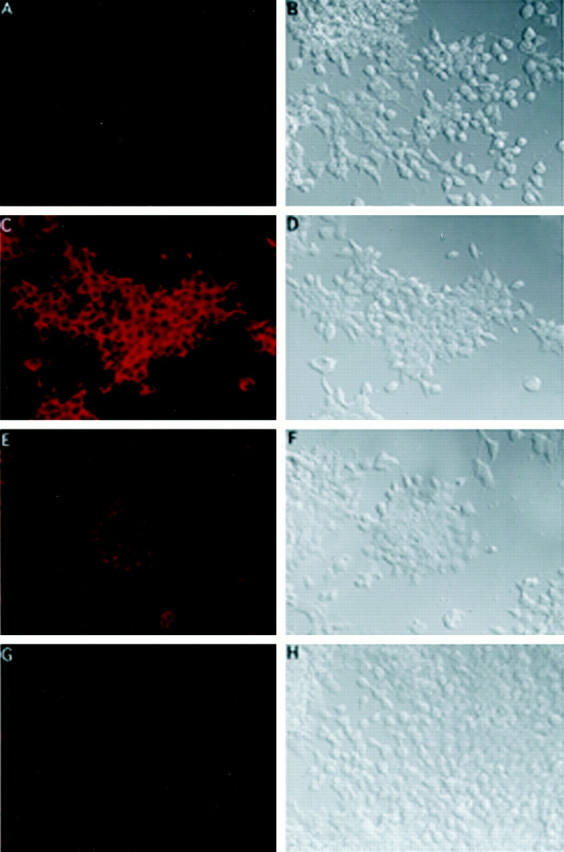
Immunohistochemical analyses of KOR protein expression in P19 cells. P19 stem cells (C,D) and cultures induced with RA for 3 (E,F) and 5 (G,H) d were stained with an anti-KOR antibody (Chen et al., 1999), followed by reaction with a Cy3-conjugated secondary antibody (C, E, G).D, F, and H show the bright-field image of C, E, andG, respectively. A negative control of P19 stem cells stained with preimmune serum is shown in A.B shows the bright-field image ofA.
Therefore, it is concluded that RA suppresses KOR mRNA and protein expression in differentiating P19 cells. Furthermore, RA-mediated suppression is a specific event that can be blocked by a specific RAR antagonist, requires protein synthesis, and may involve histone deacetylation.
Intron 1 of KOR gene is required for RA regulation of KOR expression
To understand the genetic basis for RA suppression of KOR expression, we have used a panel of KOR-lacZ fusion genes, each deleted in a various portion of promoter 1 and its upstream sequences (Lu et al., 1997) to perform transfection studies in P19 cells. It appeared that this panel of fusion genes were suppressed by RA (data not shown), and all of them contained intron 1. Therefore, a role of intron 1 in regulating KOR expression was suspected. To determine whether intron 1 played a role in the regulation of KOR gene by RA, we constructed two different luciferase reporters for transfection studies in P19 cells. Luciferase reporter was fused to KOR genomic segments to determine specific promoter activities of the dissected KOR genomic segments. A cytomegalovirus (CMV)-driven lacZ reporter was used as an internal control to normalize the efficiency of transfection procedures because this vector was not significantly affected by RA in this culture (the reporter activities decreased for ∼10–15% in RA treated cultures, no significant difference). Therefore, gene activity, represented by the normalized RUL, can be quantified more accurately. Two constructs were made to determine the role of KOR intron 1 on gene activity. The regulatory region of the first reporter, k45, contains promoter 1, exon 1, intron 1, and a portion of exon 2 derived from a contiguous KOR genomic segment ∼1.3 kb upstream from the initiation codon (ATG) of exon 2. The regulatory region of the second reporter, k19, starts from the same promoter 1 sequence used for k45 but is deleted in intron 1. Therefore, k45 and k19 differ only in the presence or absence of KOR intron 1 sequence in the regulatory region of these luciferase reporters. Control or RA-treated P19 cultures were transfected with either k45 or k19, each including a CMV-driven lacZ internal control. Thirty hours later, luciferase and lacZ activities were determined to obtain the specific luciferase reported activities (RUL). As shown in Figure8A, in cultures treated with RA, the activity of k45 consistently decreases for ∼30–40%, indicating a response of this intron 1-containing reporter to RA-mediated suppression. In contrast, the reporter activity of k19, which is deleted in intron 1 of KOR, remains relatively constant, suggesting that intron 1 deletion abolishes the response to RA-mediated suppression.
Fig. 8.
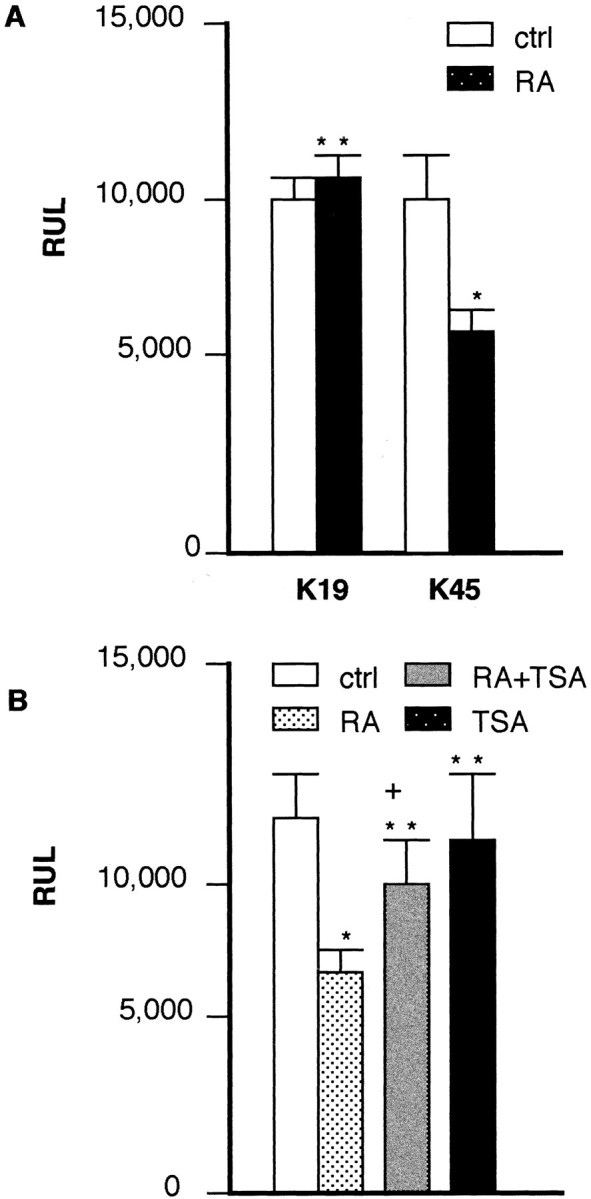
KOR-luciferase reporter activities in P19 cells.A, P19 cells, as either control culture (ctrl) or RA-induced cultures (RA), were transfected with k45 or k19 as described in Materials and Methods, and the specific reporter activity (RUL) was obtained by normalizing luciferase units to internal control lacZ units. Similar results were obtained when the luciferase units were normalized to the amount of protein used in the assays (data not shown). *p < 0.025 versus control; **p > 0.025, no significant difference versus control. B, P19 was transfected with k45 and treated with RA, RA plus TSA, or TSA alone. Specific reporter activity was determined as described above. Triplicate cultures were used in each experiment, and two independent experiments were conducted to obtain these results. *p < 0.025 versus control; **p > 0.025, no significant difference versus control; +p < 0.025 versus RA.
Finally, to provide further support that RA-mediated suppression of KOR through intron 1 involves histone deacetylation as suggested from results shown in Figure 4C, TSA was used in transfection studies with the reporter containing intron 1, k45. In this series of experiments, RA consistently suppressed k45 expression for ∼30–40%, and TSA was able to partially reverse this suppression to ∼80–85% of the control (p < 0.025; comparing TSA plus RA with RA), whereas TSA alone had no significant effects (Fig. 8B). Therefore, it is concluded that intron 1 of the KOR gene contains genetic information responsible for RA-mediated suppression of KOR expression, and this intron-1-mediated suppression involves histone deacetylation.
DISCUSSION
We have documented previously the mouse KOR gene expression pattern in a KOR-lacZ reporter transgenic mouse model (Hu et al., 1999) and demonstrated differential expression of three KOR isoform mRNAs by an established semiquantitative RT-PCR protocol (Wei et al., 2000). By using this transgenic mouse model and the RT-PCR protocol, the current study has demonstrated that the vitamin A status in developing animals affects the expression level of KOR. Specifically, a hypovitaminosis A condition elevates KOR-lacZ and the endogenous KOR mRNA expression. This observation was further substantiated in a cell culture model in which KOR expression was shown to be downregulated by RA, the most potent hormone of vitamin A. This downregulation was effectively reversed by an RAR antagonist and the HDAC inhibitor TSA. Furthermore, the regulation of KOR expression by RA does not occur until after 2–3 d of treatment, consistent with the fact that the suppressive effect of RA requires protein synthesis. Finally, downregulation of KOR expression is mediated by intron 1 of the KOR gene. This study provides evidence, for the first time, that KOR expression is affected by the vitamin A hormone RA, and this effect is mediated by the synthesis of protein factors that can potentially act on a KOR genomic segment, intron 1. Furthermore, this regulatory event may involve alteration in histone acetylation of the regulatory region of the KOR gene.
Despite RA suppression of KOR expression and the requirement for intron 1 in mediating this suppression, there are no direct RA response elements present in either intron 1 or promoter 1. This indicates that RA acts indirectly, through induction of negative transcription regulators in P19 cells and embryonic cells that express KOR transcripts. This is consistent with the relatively late action of RA and the sensitivity of this effect to cycloheximide.
The regulation of KOR mRNA isoforms involves both common and unique factors in developing animals. For instance, isoform c, the transcript derived from promoter 2, is elevated most significantly only after birth, although its slight upregulation by depleting vitamin A is also observed in E14 embryonic trunk. This would indicate that promoter 2, which overlaps with intron 1, is more actively regulated postnatally. Isoforms a and b are similarly upregulated in embryos, but they are regulated differentially in postnatal animals. In particular, isoform b, which involves alternative splicing at intron 1, is more dramatically elevated in postnatal spinal cord (Fig. 3). This would suggest that promoter 1, which controls isoforms a and b, is responsible for common regulation of these two isoforms, whereas alternative splicing may be involved in their differential regulation postnatally. Because depletion of vitamin A causes upregulation for all three KOR isoforms and RA suppresses the expression of all three isoforms in P19 cells, it is tempting to speculate that RA plays a critical role in KOR expression. By using a reporter strategy, it was concluded that intron 1 is required for the observed effects of RA. Because no typical RA response element can be found in intron 1 sequence and RA-mediated suppression requires protein synthesis, it is likely that RA-induced negative transcription factors may be involved in the regulation of KOR expression in the developing CNS. Studies are in progress to identify the DNA sequence responsible for such an inhibitory effect of RA and the transcription regulators binding to such sequence of intron 1 in the mouse KOR gene.
The expression of KOR gene is subjected to multiple levels of regulation, including transcriptional and posttranscriptional events (Wei et al., 2000). Although RA affects transcriptional regulation most significantly, it cannot be ruled out that RA may also affect posttranscriptional regulation, such as splicing efficiency, RNA stability, and translation efficiency. For instance, regulation of isoforms a and b differs only posttranscriptionally, and the effects of RA on steady-state levels of isoforms a and b appear to be different. Therefore, it is possible that RA may affect the splicing machinery or the stability of these isoforms. It will be interesting in the future to examine the efficiency of alternative splicing at intron 1 of the KOR gene and how it may be affected by RA signaling.
RA is a potent teratogen to animals; however, deficiency in RA signaling pathways, such as knock-out of RA receptors or RA synthesizing enzymes, results in a wide range of developmental abnormalities (Mark et al., 1999; Quadro et al., 1999; Niederreither et al., 2000). In classical nutritional studies in which animals are rendered vitamin A-deficient by maintaining on vitamin A-depleted diets, it is known that hypovitaminosis A is deleterious for animal survival in early developmental stages (Morriss-Kay, 1993; Ramakrishna, 1999; White et al. 2000). Recent studies using molecular markers further substantiate the connection of vitamin A homeostasis and developmental programs, most notably in the developing nervous system (Mark et al., 1999; Quadro et al., 1999; Ramakrishna, 1999;Niederreither et al., 2000). Opioid receptors are expressed primarily in the nervous system, and their function is known to be associated with not only pain sensation but also neurological processes, such as body temperature regulation and breathing control. Prenatal treatment with opioid drugs has also been shown to affect fetal development in some pharmacological studies, but the underlying mechanisms are not well understood (Shepanek et al., 1995; Malanga and Kosofsky, 1999). At the molecular level, κ opioid receptor activation is associated with neuronal growth–apoptosis. For instance, opiate antagonists caused increased brain size and cellular content in infant rats (Zagon and McLaughlin, 1983, 1987), and β-endorphin has been shown to be a potent inhibitor of brain cell proliferation via μ and κ opioid receptors (Barg et al., 1993). For embryos, it has also been shown that endogenous opioid systems are involved in the regulation of cell division in the ventricular zone of embryonic cortex (Reznikov et al., 1999). Activation of KOR with U69,593 mobilizes [Ca2+] and inhibits astrocytes proliferation (Gurwell et al., 1996). Although all of the opioid receptor knock-out animals survive in laboratory housing conditions, certain behavioral changes are noted (Childers, 1997; Kieffer, 1999). Apparently, the activities of opioid receptors must be well regulated for normal development and the maintenance of health. Our finding that hypovitaminosis A results in elevated expression level of KOR would suggest that the opioid system represents one of the signaling pathways modulated by the vitamin A hormonal system in the developing nervous system. It is tempting to speculate that the establishment of certain developmental cues by RA for nervous system development may be manifested by properly controlled endogenous opioid–receptor systems. An interesting question to be answered is whether vitamin A deficiency results in behavioral changes that are associated with the opioid systems in adults.
In this study, we used both animals and tissue cultures to explore the effects of opioid drugs and other agents known to affect CNS development, such as thyroid hormones, alcohol, and vitamin A. From these studies, we have come to the conclusion that opioid drugs, thyroid hormones, or alcohol do not significantly affect KOR expression (data not shown), whereas vitamin A significantly affects KOR gene expression in both animals and tissue cultures. The effect of RA, the most potent hormone of vitamin A, apparently requires additional factors besides its own receptors to suppress KOR expression. This is supported by the blockage of this suppression by a protein synthesis inhibitor. Regulation of KOR could involve many levels of control. A direct regulation of gene expression by basic transcription factors may operate when the local chromatin configuration is open in committed cells, whereas some other mechanisms that affect higher order chromatin structures, such as histone acetylation, may be required for regulation in uncommitted stem cells such as P19. This is supported by the result showing the alleviation of RA-mediated suppression by TSA, which inhibits HDAC activities. Currently, it is known that RA can potentially affect gene regulation at multiple levels, such as the function of many transcription factors and the recruitment of histone modifying enzymes and chromatin remodeling machinery (for review, seeXu et al., 1999). It will be interesting to investigate whether the chromatin of KOR promoters is differentially modified (such as acetylated) in different cell types or developmental stages and whether RA is involved in altering this particular genomic segment. Additionally, the nuclear factors responsible for silencing of KOR expression may be regulated by RA in cells undergoing differentiation. An interesting and important question to be addressed in the future is the mechanism of positive regulation of KOR gene expression in those fully differentiated KOR neurons.
Footnotes
This work was supported by National Institutes of Health Grants DA11190, DA11806, DA70554, and DA00564.
Correspondence should be addressed to Dr. Li-Na Wei, Department of Pharmacology, University of Minnesota Medical School, 6-20 Jackson Hall, 321 Church Street SE, Minneapolis, MN 55455-0217. E-mail:weixx009@tc.umn.edu.
REFERENCES
- 1.Barg J, Belcheva M, McHale R, Levy R, Vogel Z, Coscia CJ. β-Endophin is a potent inhibitor of thymidine incorporation into DNA via μ and κ opioid receptors in fetal rat brain cell aggregates in culture. J Neurochem. 1993;60:765–767. doi: 10.1111/j.1471-4159.1993.tb03214.x. [DOI] [PMC free article] [PubMed] [Google Scholar]
- 2.Chang L, Wei L-N. Characterization of a negative response DNA element in the upstream region of cellular retinoic acid binding protein I gene of the mouse. J Biol Chem. 1997;272:10144–10150. doi: 10.1074/jbc.272.15.10144. [DOI] [PubMed] [Google Scholar]
- 3.Chen H-C, Wei L-N, Loh HH. Expression of μ, κ and δ opioid receptors in P19 mouse embryonal carcinoma cells. Neuroscience. 1999;92:1143–1155. doi: 10.1016/s0306-4522(99)00030-5. [DOI] [PubMed] [Google Scholar]
- 4.Childers SR. Opioid receptors: pinning down the opiate targets. Curr Biol. 1997;7:R695–R697. doi: 10.1016/s0960-9822(06)00358-7. [DOI] [PubMed] [Google Scholar]
- 5.Elde R, Arvidsson U, Riedl M, Vulchanova L, Lee JH, Dado R, Nakano A, Chakrabarti S, Zhang X, Loh HH. Distribution of neuropeptide receptors. New views of peptidergic neurotransmission made possible by antibodies to opioid receptors. Ann NY Acad Sci. 1995;757:390–340. doi: 10.1111/j.1749-6632.1995.tb17497.x. [DOI] [PubMed] [Google Scholar]
- 6.Franklin KBJ. The mouse brain. Academic; San Diego, CA: 1997. [Google Scholar]
- 7.Goldstein A, Naidu A. Multiple opioid receptors: ligand selectivity profiles and binding signatures. Mol Pharmacol. 1989;36:265–272. [PubMed] [Google Scholar]
- 8.Gurwell JA, Duncan MJ, Maderspach K, Stiene-Martin A, Elde RP, Hauser KF. κ-opioid receptor expression defines a phenotypically distinct subpopulation of astroglia: relationship to Ca2+ mobilization, development and the antiproliferative effect of opioids. Brain Res. 1996;737:175–187. doi: 10.1016/0006-8993(96)00728-7. [DOI] [PMC free article] [PubMed] [Google Scholar]
- 9.Hu X, Cao S, Loh HH, Wei L-N. Promoter activity of mouse κ opioid receptor gene in transgenic mouse. Mol Brain Res. 1999;69:35–43. doi: 10.1016/s0169-328x(99)00077-7. [DOI] [PubMed] [Google Scholar]
- 10.Kaufman MH. The atlas of mouse development, pp149–370. Academic; San Diego: 1992. [Google Scholar]
- 11.Kieffer BL. Recent advances in molecular recognition and signal transduction of active peptides: receptors for opioid peptides. Cell Mol Neurobiol. 1995;15:615–635. doi: 10.1007/BF02071128. [DOI] [PMC free article] [PubMed] [Google Scholar]
- 12.Kieffer BL. Opioids: first lessons from knockout mice. Trends Pharmacol Sci. 1999;20:19–26. doi: 10.1016/s0165-6147(98)01279-6. [DOI] [PubMed] [Google Scholar]
- 13.Kitchen I, Kelly M, Viveros PM. Ontogenesis of kappa opioid receptors in rat brain using 3H-U69593 as a binding ligand. Eur J Pharmacol. 1990;175:93–96. doi: 10.1016/0014-2999(90)90157-2. [DOI] [PubMed] [Google Scholar]
- 14.Knapp RJ, Malatynska E, Collins N, Fang L, Wang JY, Hruby VJ, Roeske WR, Yamamura HI. Molecular biology and pharmacology of the cloned opioid receptors. FASEB J. 1995;9:516–525. doi: 10.1096/fasebj.9.7.7737460. [DOI] [PubMed] [Google Scholar]
- 15.Lakritz J, George LW, Moore J. Seizures and acute death attributable to hypovitaminosis A and suspected hypovitaminosis D in feeder pigs. J Am Vet Med Assoc. 1993;202:1276–1278. [PubMed] [Google Scholar]
- 16.Lee CH, Chang L, Wei LN. Molecular cloning and characterization of a mouse nuclear orphan receptor expressed in embryos and testes. Mol Reprod Dev. 1996;44:305–314. doi: 10.1002/(SICI)1098-2795(199607)44:3<305::AID-MRD4>3.0.CO;2-Q. [DOI] [PubMed] [Google Scholar]
- 17.Lee CH, Chinpaisal C, Wei LN. Cloning and characterization of mouse RIP140, a corepressor for nuclear receptor TR2. Mol Cell Biol. 1998;18:6745–6755. doi: 10.1128/mcb.18.11.6745. [DOI] [PMC free article] [PubMed] [Google Scholar]
- 18.Loh HH, Liu HC, Cavalli A, Yang W, Chen YF, Wei LN. μ opioid receptor knockout in mice: effects on ligand-induced analgesia and morphine lethality. Mol Brain Res. 1998;54:321–326. doi: 10.1016/s0169-328x(97)00353-7. [DOI] [PubMed] [Google Scholar]
- 19.Lu S, Loh HH, Wei LN. Studies of dual promoters of mouse k opioid receptor gene. Mol Pharmacol. 1997;52:415–420. doi: 10.1124/mol.52.3.415. [DOI] [PubMed] [Google Scholar]
- 20.Maden M. Vertebrate development: a nervous vitamin. Curr Biol. 1999;8:R846–R849. doi: 10.1016/s0960-9822(07)00528-3. [DOI] [PubMed] [Google Scholar]
- 21.Maden M, Graham A, Gale E, Rollinson C, Zile M. Positional apoptosis during vertebrate CNS development in the absence of endogenous retinoids. Development. 1997;124:2799–2805. doi: 10.1242/dev.124.14.2799. [DOI] [PubMed] [Google Scholar]
- 22.Maden M, Gale E, Zile M. The role of vitamin A in the development of the central nervous system. J Nutr. 1998;[Suppl 2] 128:471S–475S. doi: 10.1093/jn/128.2.471S. [DOI] [PubMed] [Google Scholar]
- 23.Malanga CJ, Kosofsky BE. Mechanisms of action of drugs of abuse on the developing fetal brain. Clin Perinatol. 1999;26:17–37. [PubMed] [Google Scholar]
- 24.Mansour A, Fox CA, Akil H, Watson SJ. Opioid receptor mRNA expression in the rat CNS: anatomical and functional implications. Trends Neurosci. 1995;18:22–29. doi: 10.1016/0166-2236(95)93946-u. [DOI] [PubMed] [Google Scholar]
- 25.Mark M, Ghyselinck NB, Wendling O, Dupe V, Mascrez B, Kastner P, Chambon P. A genetic dissection of the retinoid signalling pathway in the mouse. Proc Nutr Soc. 1999;58:609–613. doi: 10.1017/s0029665199000798. [DOI] [PubMed] [Google Scholar]
- 26.Matthes HW, Maldonado R, Simonin F, Valverde O, Slowe S, Kitchen I, Befort K, Dierich A, Le Meur M, Dolle P, Tzavara E, Hanoune J, Roques BP, Kieffer BL. Loss of morphine induced analgesia, reward effect and withdrawal symptoms in mice lacking the mu opioid receptor gene. Nature. 1996;383:819–823. doi: 10.1038/383819a0. [DOI] [PubMed] [Google Scholar]
- 27.Morriss-Kay G. Retinoic acid and craniofacial development: molecules and morphogenesis. BioEssays. 1993;15:9–15. doi: 10.1002/bies.950150103. [DOI] [PubMed] [Google Scholar]
- 28.Niederreither K, Vermot J, Schuhbaur B, Chambon P, Dolle P. Retinoic acid synthesis and hindbrain patterning in the mouse embryo. Development. 2000;127:75–85. doi: 10.1242/dev.127.1.75. [DOI] [PubMed] [Google Scholar]
- 29.Quadro L, Blaner WS, Salchow DJ, Vogel S, Piantedosi R, Gouras P, Freeman S, Cosma MP, Colantuoni V, Gottesman ME. Impaired retinal function and vitamin A availability in mice lacking retinol-binding protein. EMBO J. 1999;18:4633–4644. doi: 10.1093/emboj/18.17.4633. [DOI] [PMC free article] [PubMed] [Google Scholar]
- 30.Ramakrishna T. Vitamins and brain development. Physiol Res. 1999;48:175–187. [PubMed] [Google Scholar]
- 31.Reznikov K, Hauser KF, Nazarevskaja G, Trunova Y, Derjabin V, Bakalkin G. Opioids modulate cell division in the germinal zone of late embryonic neocortex. Eur J Neuros. 1999;11:2711–2719. doi: 10.1046/j.1460-9568.1999.00680.x. [DOI] [PubMed] [Google Scholar]
- 32.Rius RA, Barg J, Bem WT, Coscia CJ, Loh YP. The prenatal developmental profile of expression of opioid peptides and receptors in the mouse brain. Brain Res Dev Brain Res. 1991;58:237–241. doi: 10.1016/0165-3806(91)90010-G. [DOI] [PMC free article] [PubMed] [Google Scholar]
- 33.Shepanek NA, Smith RF, Anderson LA, Medici CN. Behavioral and developmental changes associated with prenatal opiate receptor blockade. Pharmacol Biochem Behav. 1995;50:313–319. doi: 10.1016/0091-3057(94)00232-8. [DOI] [PubMed] [Google Scholar]
- 34.Simonin F, Valverde O, Smadja C, Slowe S, Kitchen I, Dierich A, Le Meur M, Roques BP, Maldonado R, Kieffer BL. Disruption of the kappa opioid receptor gene in mice enhances sensitivity to chemical vesceral pain, impairs pharmacological actions of the selective kappa agonist U-50488 and attenuates morphine withdrawal. EMBO J. 1998;17:886–897. doi: 10.1093/emboj/17.4.886. [DOI] [PMC free article] [PubMed] [Google Scholar]
- 35.Sora I, Takahashi N, Ujike H, Revay RS, Donovan DM, Miner LL, Uhl GR. Opiate receptor knockout mice define mu receptor roles in endogenous nociceptive responses and morphine induced analgesia. Proc Natl Acad Sci USA. 1997;94:1544–1549. doi: 10.1073/pnas.94.4.1544. [DOI] [PMC free article] [PubMed] [Google Scholar]
- 36.Tian M, Broxmeyer HE, Fan Y, Lai Z, Zhang S, Aronica S, Cooper S, Bigsby RM, Steinmetz R, Engle SJ, Mestek A, Pollock JD, Lehman MN, Jansen HT, Ying M, Stambrook PJ, Tischfield JA, Yu L. Altered hematopoiesis, behavior, and sexual function in mu opioid receptor-deficient mice. J Exp Med. 1997;185:1517–1522. doi: 10.1084/jem.185.8.1517. [DOI] [PMC free article] [PubMed] [Google Scholar]
- 37.Wei LN, Chang L. Promoter and upstream regulatory activities of the mouse cellular retinoic acid binding protein-I gene. J Biol Chem. 1996;271:5073–5078. doi: 10.1074/jbc.271.9.5073. [DOI] [PubMed] [Google Scholar]
- 38.Wei LN, Loh HH. Molecular biology of opioid receptors and associate proteins. In: Blum K, Noble EP, editors. Handbook of psychiatric genetics. CRC; New York: 1996. pp. 77–88. [Google Scholar]
- 39.Wei LN, Lee CH, Filipcik P, Chang L. Regulation of the mouse cellular retinoic acid binding protein I gene by thyroid hormones and retinoids in transgenic mouse embryos and P19 cells. J Endocrinol. 1997;155:35–46. doi: 10.1677/joe.0.1550035. [DOI] [PubMed] [Google Scholar]
- 40.Wei LN, Hu X, Bi J, Loh HH. Post-transcriptional regulation of mouse κ opioid receptor expression. Mol Pharmacol. 2000;57:401–408. [PubMed] [Google Scholar]
- 41.White JC, Highland M, Kaiser M, Clagett-Dame M. Vitamin A deficiency results in the dose dependent acquisition of anterior character and shortening of the caudal hindbrain of the rat embryo. Dev Biol. 2000;220:263–284. doi: 10.1006/dbio.2000.9635. [DOI] [PubMed] [Google Scholar]
- 42.Xu L, Glass CK, Rosenfeld MG. Coactivator and corepressor complexes in nuclear receptor function. Curr Opin Genet Dev. 1999;9:140–147. doi: 10.1016/S0959-437X(99)80021-5. [DOI] [PubMed] [Google Scholar]
- 43.Zagon IS, McLaughlin PJ. Increased brain size and cellular content in infant rats treated with an opiate antagonist. Science. 1983;221:1179–1180. doi: 10.1126/science.6612331. [DOI] [PubMed] [Google Scholar]
- 44.Zagon IS, McLaughlin PJ. Endogenous opioid systems regulate cell proliferation in the developing rat brain. Brain Res. 1987;412:68–72. doi: 10.1016/0006-8993(87)91440-5. [DOI] [PubMed] [Google Scholar]
- 45.Zhu Y, Hsu MS, Pintar JE. Developmental expression of the μ, κ, and δ opioid receptor mRNAs in mouse. J Neurosci. 1998;18:2538–2547. doi: 10.1523/JNEUROSCI.18-07-02538.1998. [DOI] [PMC free article] [PubMed] [Google Scholar]