

Abstract
Spatial activation patterns within the olfactory bulb are believed to contribute to the neural representation of odorants. In this study, we attempted to predict the perceptions of odorants from their evoked patterns of neural activity in the olfactory bulb. We first describe the glomerular activation patterns evoked by pairs of odorant enantiomers based on the uptake of [14C]2-deoxyglucose in the olfactory bulb glomerular layer. Using a standardized data matrix enabling the systematic comparison of these spatial odorant representations, we hypothesized that the degree of similarity among these representations would predict their perceptual similarity. The two enantiomers of carvone evoked overlapping but significantly distinct regions of glomerular activity; however, the activity patterns evoked by the enantiomers of limonene and of terpinen-4-ol were not statistically different from one another. Commensurate with these data, rats spontaneously discriminated between the enantiomers of carvone, but not between the enantiomers of limonene or terpinen-4-ol, in an olfactory habituation task designed to probe differences in olfactory perception.
Keywords: olfactory coding, enantiomers, optical isomers, olfactory perception, neural representations, habituation, reinforcement learning, olfactory bulb, glomeruli
Perhaps the best criterion for assessing any putative neural code is how well it can predict perceptual phenomena. Olfactory sensory information appears to be represented in the activity of olfactory bulb glomeruli (Stewart et al., 1979; Rubin and Katz, 1999; Sachse et al., 1999; Johnson and Leon, 2000; Meister and Bonhoeffer, 2001), as well as in the identities and dynamics of their projection neurons (Doving, 1966; Imamura et al., 1992; Mori et al., 1992; Wehr and Laurent, 1996; Kashiwadani et al., 1999; Linster and Hasselmo, 1999; Teyke and Gelperin, 1999; Linster and Cleland, 2001). In comparing odor perceptions with such neural representations, it is important to avoid behavioral discriminations based on aspects of the chemical stimulus that may not normally signal odor quality. Such additional cues may include trigeminal or vomeronasal stimulation, or differences in either odorant concentration or odorant contaminants of stimuli. To minimize such differences in odorant stimuli, we compared the perceptions of odorant molecules with only a single structural difference, a difference that could produce a perceptual difference for rats.
Enantiomers differ from each other only in stereoconfiguration, with some pairs perceived as different odors (Friedman and Miller, 1971;Leitereg et al., 1971; Heth et al., 1992; Taniguchi et al., 1992; Laska and Teubner, 1999a,b; Laska et al., 1999a,b; Laska and Galizia, 2001;Rubin and Katz, 2001). Because enantiomers possess the same functional groups and chemical properties, they would be expected to have common representations of these molecular features in the olfactory brain. On the other hand, receptors often show strict stereoselectivity for their ligands. Therefore, we predict that any pair of odorant enantiomers that are perceived to be different should have neural representations comprised of identical, as well as distinct, components. Conversely, any pair of enantiomers that are not perceived to be different should have neural responses that do not differ.
Because olfactory sensory neurons appear to express a single odorant receptor (Chess et al., 1994; Malnic et al., 1999; Touhara et al., 1999; Serizawa et al., 2000) (but see Rawson et al., 2000) and because olfactory neurons homologous for a receptor type converge onto a small number of glomeruli (Ressler et al., 1994; Vassar et al., 1994;Mombaerts et al., 1996; Strottman et al., 2000), it is possible to use the glomerular response to indicate odorant receptor responses. Therefore, we exposed rats to three pairs of enantiomers [(+)/(−)-carvone, (+)/(−)-limonene, and (+)/(−)-terpinen-4-ol] (Fig. 1) after administration of [14C]2-deoxyglucose (2-DG) to reveal differential glomerular activity. After we determined the neural representations of these odorants, we asked whether these neural patterns corresponded to behavioral discrimination patterns.
Fig. 1.

Chemical structures of odorants used in this study. Note the similarities in structure across the different chemicals and the difference in geometry between enantiomers. Carvone differs from limonene by possessing a single ketone functional group, whereas terpinen-4-ol differs from limonene by possessing a hydroxyl group at the chiral carbon and by lacking a double bond in its isopropyl group. Filled wedges represent bonds extending above the plane of the cyclohexane ring, whereas hatched wedges are bonds extending below the plane. Hydrogen atoms not attached to chiral carbons are omitted for clarity.
MATERIALS AND METHODS
Odorant exposures for 2-DG uptake
Groups of six male Wistar rats (postnatal days 19–22) received a subcutaneous injection of [14C]2-DG (0.16 mCi/kg; Sigma, St. Louis, MO) immediately before a 45 min odorant exposure. Odorant exposures were conducted as reported previously (Johnson et al., 1999). For the experiments reported here, enantiomers of limonene were purchased from Aldrich Flavors and Fragrances (Milwaukee, WI), and enantiomers of carvone and terpinen-4-ol were purchased from Fisher Scientific/Acros Organics (Pittsburgh, PA). Purities reported by the manufacturers were 98% for (R)-(−)-carvone, 98% for (S)-(+)-carvone, >95% for (S)-(−)-limonene, >97% for (R)-(+)-limonene, 97% for (R)-(−)-terpinen-4-ol, and 95% for (S)-(+)-terpinen-4-ol. Odorants were volatilized by using high-purity nitrogen gas bubbled through a 100 ml column of pure liquid in a gas washing bottle at a flow rate of 250 ml/min. The nitrogen stream then was mixed with ultra zero-grade air for a final flow rate of 2 l/min (1:8 dilution of odorant vapor). After odorant exposure, rats immediately were decapitated. Brains were frozen rapidly in 2-methylbutane at approximately −45°C and then were stored at −70°C before sectioning.
Mapping 2-DG uptake
Coronal sections (20-μm-thick) were prepared by using a cryostat. Every sixth section was taken for autoradiography, and adjacent sections were stained with cresyl violet as described previously (Johnson et al., 1999). The stained sections were used both to direct sampling within the glomerular layer of the autoradiography section and to standardize the rostrocaudal position of sections in reference to anatomical landmarks (Johnson et al., 1999). Discrete measurements of 2-DG uptake were directed by a set of radial grids to give samples at ∼120 μm intervals around each section. Measurements were merged into standardized data arrays covering the entire glomerular layer (Johnson et al., 1999). Arrays from the two bulbs of each animal were averaged and then converted to nanocuries per gram 2-DG by using standards exposed to the autoradiography films. Values in these arrays then were transformed intoz-scores before statistical analyses (Johnson et al., 1999). The resulting arrays were visualized as contour charts. The contour charts presented here provide rolled-out maps of the glomerular layer wherein the bulb is opened dorsally, rostral is to the left, and lateral is in the upper half (Johnson et al., 1999).
Statistical analyses
Comparisons of patterns of 2-DG uptake were made by first calculating the maximal value of the z-score for 2-DG uptake in each of 27 modules that we described in the glomerular layer of the bulb (Johnson and Leon, 2000, 2001). These modules are glomerular domains in which responses to molecular features of odorants are reliably represented. We then subjected the values in each module for each set of enantiomers to a t test, followed by a false discovery rate analysis, a procedure that allows multiple comparisons to be made under stringent conditions (Curran-Everett, 2000). All tests were two-tailed, and the α level was set at 0.01.
Olfactory habituation
Behavioral testing. To determine how well neural representations predicted perception, we studied the discrimination of odorant enantiomers in an olfactory habituation task. An olfactory habituation task allows rats to demonstrate their ability to discriminate odorants by responding to a second odorant after being habituated to the original odorant. If the second odorant is not discriminated from the first, it would not evoke an increased response by the rat. Because no reward is associated with either odorant in this task and each test odor is compared with the habituated odor only once, it is likely to measure basic similarities between odorants, unaltered by reinforcement.
All habituation experiments were conducted in a black Plexiglas box (38 × 38 × 30 cm) in which a 2.5-cm-diameter hole had been drilled to hold a 20 ml glass vial. The rats were placed in the box and were allowed to become familiar with it in brief periods over several days. At that point, a vial containing only mineral oil was introduced into the box on successive days, and, during the last days of shaping, vials containing different odorants than those used in the experiment were introduced. For each rat, shaping was considered to be completed when the rat investigated a novel odorant vial for several seconds, with the length of their investigation decreasing after successive presentations of the same odorant.
Odorant sets. We determined how well rats discriminate between the (−) and (+) isomers of carvone, limonene, and terpinen-4-ol in the habituation paradigm. In addition to the enantiomer pairs, a control odorant, n-amyl acetate (banana odor) was used in two of three experiments to probe their ability to make olfactory discriminations, in the event that the rats made no discrimination among the closely related test odorants. We tested three different groups of adult male Sprague Dawley rats on one of three odor sets. The first group of rats was habituated to (−)-carvone, and their responses to (−)/(+)-carvone, (−)-limonene, (−)-terpinen-4-ol, and n-amyl-acetate were tested (Table1). The second group of rats was habituated to (−)-limonene, and their responses to (−)/(+)-limonene, (−)-terpinen-4-ol, and (−)-carvone were tested. The third group of rats was habituated to (−)-terpinen-4-ol, and their responses to (−)/(+)-terpinen-4-ol, (−)-limonene, (−)-carvone, andn-amyl-acetate were tested. Odorants were diluted in 5 ml of mineral oil (0.4% v/v). All test odorants were coded in such a way that the experimenter was blind to their identities.
Table 1.
Habituation and test odors used in each exposure set
| Odor set 1 | Odor set 2 | Odor set 3 | |
|---|---|---|---|
| Ohab | (−)-Carv | (−)-Lim | (−)-Terp |
| Test 1 | (−)-Carv | (−)-Lim | (−)-Terp |
| Test 2 | (+)-Carv | (+)-Lim | (+)-Terp |
| Test 3 | (−)-Lim | (−)-Terp | (−)-Lim |
| Test 4 | (−)-Terp | (−)-Carv | (−)-Carv |
| Control | n-amyl | n-amyl |
Carv, Carvone; Lim, limonene; Terp, terpinen-4-ol;n-amyl, n-amyl acetate;Ohab, habituated odorant.
For each rat, a test day consisted of 15 trials (13 trials in the experiment without a control odorant), each separated by a 10 min interval. During each trial, the rat was placed into the box in which an odorant vial had been placed. The rat was observed for a maximum of 90 sec, during which we recorded the amount of time that it investigated the odorant vial on its first approach. Investigation was defined as active sniffing within 1 cm of the vial. On testing days, each rat was subjected to the succession of trials shown in Table2. During the first two trials, the rat was exposed to a vial containing only 5 ml of mineral oil. The rats then were given three additional trials to habituate to one of the (−)-enantiomers. After habituation to the (−)-enantiomer, trials with one of the test and control odorants were presented in pseudorandom order, alternating between such stimuli and the previously habituated odorant. The trials with the previously habituated odorant were added to ensure that the rats remained habituated to the odorant during the trials. To record the response to the habituated odorants under the same conditions as the other odorants, we included the habituated odorant in the set of test stimuli, coded in such a way that the experimenter did not know its identity. The response levels reported for the (−)-enantiomers are those recorded during test trials and not those recorded during the intermittent exposures used to maintain odor habituation. The investigation times were recorded during all trials, except for those in which plain mineral oil was used.
Table 2.
Succession of trials
| Trial | 1 | 2 | 3 | 4 | 5 | 6 | 7 | 8 | 9 | 10 | 11 | 12 | 13 | 14 |
|---|---|---|---|---|---|---|---|---|---|---|---|---|---|---|
| Odorant | Null | Null | Ohab | Ohab | Ohab | Test 1 | Ohab | Test 2 | Ohab | Test 3 | Ohab | Test 4 | Ohab | Cont |
Cont, Control; Ohab, habituated odorant.
Data analysis. The data analysis was performed using SPSS (Chicago, IL) statistical software on the odorant investigation time during test trials. Only rats that investigated the habituated odorant for at least 5 sec during its first presentation were included in the analysis. After two-way ANOVA testing for differences in response levels among rats and using the test odorant as a within-subject factor, pairwise post hoc tests (Tukey's honestly significant difference test) were performed to determine whether the time investigating a test odorant was significantly different from the response to the habituated odorant. All tests were two-tailed, and the α level was set to 0.05.
RESULTS
Spatial patterns of 2-DG uptake
The patterns of 2-DG uptake evoked by the six odorants in the present study are illustrated as z-score standardized contour charts in Figure 2. Carvone enantiomers stimulated uptake along the dorsal surface of the bulb centered midway between the rostral pole and the beginning of the accessory olfactory bulb, as well as in a dorsomedial module just rostral to the accessory bulb (Fig. 2, top panels,large black arrows). The dorsal and dorsomedial regions of uptake are in the relative locations expected from the paired lateral and medial projection zones of olfactory sensory neurons expressing the same odorant receptor gene (Ressler et al., 1994; Vassar et al., 1994; Mombaerts et al., 1996). In addition, (−)-carvone activated a distinct caudal and ventromedial module that was not activated by (+)-carvone (Fig. 2, large white arrow). This stereospecific module was conspicuous in every bulb of every animal exposed to (−)-carvone (Fig. 3,black arrows), and there was no corresponding uptake in bulbs of rats exposed to (+)-carvone. This small module extended across 120–180 μm in the rostrocaudal dimension (two or three analyzed sections) and was associated with approximately one to three glomeruli in any given coronal section. The enantiomer (+)-carvone also activated reliably distinct glomerular areas not activated by (−)-carvone (Fig.2, two small white arrows), but these differences were not obvious until we had performed the statistical analyses described below.
Fig. 2.

Contour charts illustrating the spatial distribution of [14C]2-deoxyglucose uptake evoked by odorant enantiomers. The orientation of the rolled-out maps of glomerular uptake is shown the top right.Blackarrows denote areas of high uptake that are shared by different enantiomers with the same chemical formula. Similar arrows in each chart indicate paired responses. The white arrows indicate a (−)-carvone-specific glomerular module and a pair of (+)-carvone-specific modules. The z-score levels are shown next to their color representation in the map.
Fig. 3.
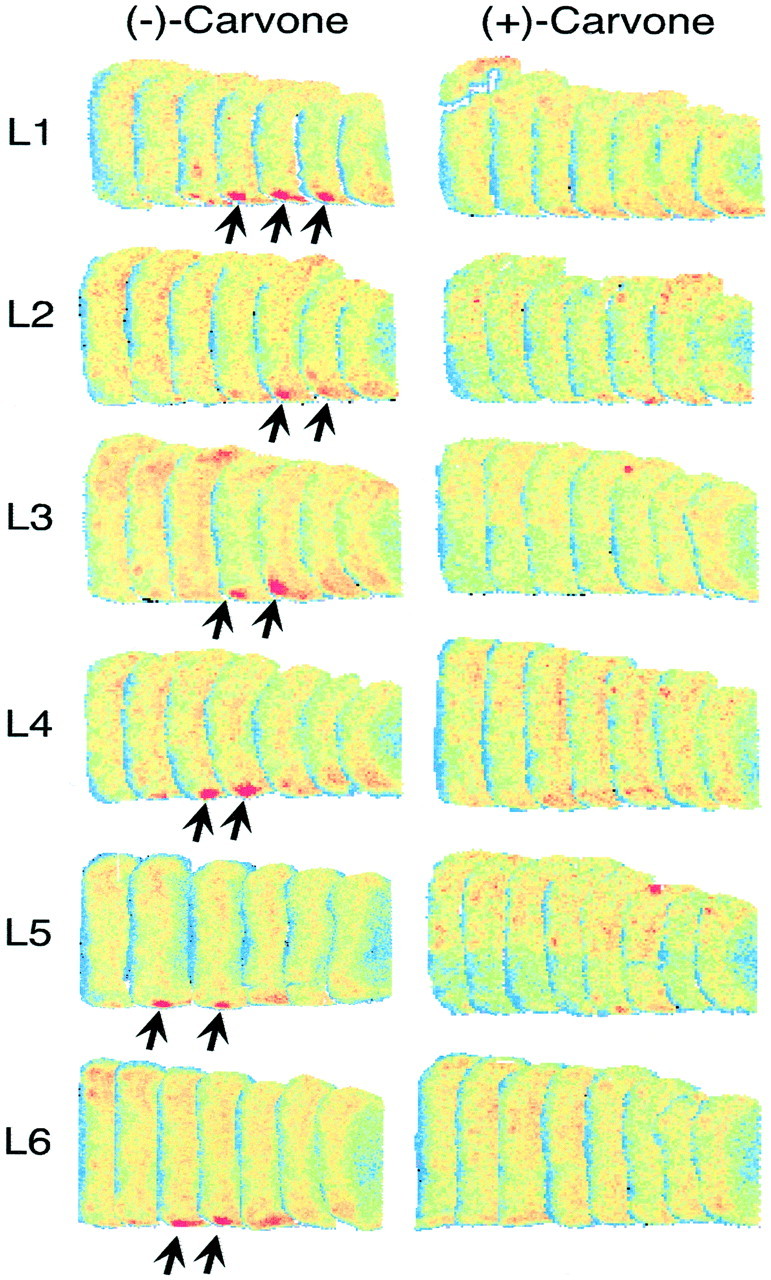
A glomerular module specific for (−)-carvone. Individual pseudocolor-enhanced autoradiograph sections are shown for one bulb of each rat exposed to carvone enantiomers. The 20 μm coronal sections span the area indicated by a large white arrow in the top left contour chart of Figure 2, and consecutive sections in this illustration are separated by 100 μm. The (−)-carvone-specific glomerular module is denoted byarrows. In each row, the (−)-carvone- and (+)-carvone-exposed rats were from the same litter. The pseudocolor scales were adjusted to give similar colors within the subependymal zone and granule cell layer for each bulb.
Limonene enantiomers elicited patterns of uptake that were almost entirely distinct from those produced by carvone enantiomers (Fig. 2). These patterns involved paired midlateral and midmedial modules (large black arrows), as well as paired ventrolateral and ventromedial modules (small black arrows).
Terpinen-4-ol enantiomers stimulated uptake in paired lateral and medial modules that overlapped partially with those activated by limonene enantiomers (Fig. 2, large black arrows), but terpinen-4-ol enantiomers did not activate ventral modules to the same extent as did the limonene enantiomers. In contrast to the clear difference between the representations of the two carvone enantiomers, neither the enantiomers of terpenen-4-ol nor those of limonene had any obvious differences in their patterns (Fig. 2). For each odorant, the largest responses to the (+)-enantiomer were found in a similar location as for the (−)-enantiomer (Fig. 2, black arrows).
To compare the neural representations quantitatively, we used a set of 27 glomerular domains, or modules, that we had identified previously in studies using a total of 54 odorants (Johnson and Leon, 2000, 2001). Each of the 54 odorants evoked a unique pattern of activity across these modules, comprised of groups of glomeruli displaying overlapping responses to specific odorant molecular features. These modules can be seen in Figure4, along with the maximal activity within a module, expressed as a z-score, for each of the odorants used in this study. There were statistically significant differences in three of the 27 modules for the enantiomers of carvone. (−)-Carvone showed higher activity than (+)-carvone in module I, the glomerular area activated in the bulbs exposed to (−)-carvone, indicated byblack arrows in Figure 3 and by a large white arrow in Figure 2. On the other hand, (+)-carvone had significantly higher activity relative to (−)-carvone in modules k and m, the glomerular regions identified in Figure 2 with two small white arrows. There were no statistically significant differences observed in any of the glomerular modules when we compared the enantiomers of either limonene or terpinen-4-ol.
Fig. 4.

Twenty-seven identified olfactory bulb glomerular response modules are shown on the right(Johnson and Leon, 2001). Mean maximal z-score response in each module evoked by the enantiomers of carvone, limonene, and terpinen-4-ol are shown on the left.Asterisks indicate significant differences (p < 0.01) between enantiomers in individual modules as judged by t tests and false discovery rate analysis. The lack of activity in modulei for terpinen-4-ol reflects a negativez-score for both enantiomers.
Odorant habituation
As can be seen in Figure 5, the duration of investigation of the odorant decreased with each presentation for all three pairs of enantiomers, indicating that habituation had occurred. For each odorant pair, there was a significant effect of trial number (p < 0.001), and, in each case, the response levels on trial 3 were significantly different from those on trials 4 and 5 (p < 0.001) (Fig. 5). There were no significant differences between the response levels in the three-odorant set among any of the enantiomers (p > 0.5). After habituating the rats (n = 11) to the odorless vial (trials 1 and 2) and to the primary habituation odorant (trials 3–5), the responses to the test odorants were recorded on trials 6, 8, 10, 12, and 14. Recall that the test trials were alternated with a trial using the previously habituated odorant to ensure that the rats remained habituated to it.
Fig. 5.

Mean time spent investigating (−)-carvone, (−)-terpinen-4-ol, and (−)-limonene on habituation trials 3–5, showing the decrement in response for all three odorants. Trials 1 and 2 involved habituation to the test apparatus.
Habituation to (−)-carvone
The investigation time after habituation to (−)-carvone differed across the test odorants (F(4,28) = 23.205, p < 0.001) (Fig.6A). The lowest investigation time was observed in response to the previously habituated odorant, (−)-carvone. The response to the enantiomer of the habituated odorant, (+)-carvone, was significantly different from that of the previously habituated odorant, (−)-carvone (p < 0.001). The responses of all other test odorants also were significantly different from (−)-carvone (p < 0.05). Among test odorants, the responses to (−)-limonene were different from those to n-amyl acetate and (+)-carvone.
Fig. 6.

Mean time spent investigating either the enantiomers of carvone (Carv), limonene (Lim), and terpinen-4-ol (Terp) orn-amyl acetate (n-amyl) as a control odorant after being habituated to (−)-carvone (A), (−)-limonene (B), or (−)-terpin-4-ol (C). No control odorant was used for the limonene comparisons. Single asterisks indicate a response that was significantly different from the habituated odor, and double asterisks indicate significant differences from the control odor.
Habituation to (−)-limonene
After habituation to (−)-limonene, the amount of time the rats investigated each odorant depended on the odorant that was being presented (F(3,30) = 8.8634,p < 0.001) (Fig. 6B). The lowest investigation times were observed in response to the habituated odor, (−)-limonene, and also to its optical isomer, (+)-limonene. Indeed, the responses to (−)-limonene and (+)-limonene were not significantly different from each other (p > 0.95), indicating that they were not discriminated. The responses to the other two test odorants, (−)-terpinen-4-ol and (−)-carvone, were significantly different from that to the habituated odorant (p < 0.01) but not significantly different from each other (p> 0.8).
Habituation to (−)-terpinen-4-ol
After habituation to (−)-terpinen-4-ol, investigation time again depended on the odorant (F(4,24)= 49.112, p < 0.001) (Fig. 6C). The lowest investigation times were observed in response to the habituated odorant, (−)-terpinen-4-ol, and also to its enantiomer, (+)-terpinen-4-ol. The responses to (−)-terpinen-4-ol and (+)-terpinen-4-ol were not significantly different from each other (p > 0.6). The responses to the other three test odors, (−)-limonene, (−)-carvone, and n-amyl acetate, were significantly different from the previously habituated odorant (p < 0.001). Among these odorants, only the responses to (−)-limonene and (−)-carvone were significantly different from each other (p < 0.005).
DISCUSSION
We were able to make successful predictions regarding the perceptions generated by odorant molecules having either similar or dissimilar neural representations in the glomerular layer of the olfactory bulb. Specifically, rats readily discriminated the enantiomers of carvone, which had clearly different glomerular representations. On the other hand, the enantiomers of limonene had very similar activation areas in the bulb, and the rats did not discriminate between them. The enantiomers of terpinen-4-ol were similarly difficult to discriminate and evoked areas of glomerular activation that were very similar to each other.
There are reports of both differences (Rubin and Katz, 2001) and a failure to find differences (Rubin and Katz, 1999) between the neural representations of carvone enantiomers in a dorsal region of the bulb in which we find no differences between the enantiomers. The technique used in those reports was not able to image the ventral areas in which we did observe differences between (+)- and (−)-carvone. It seems possible that the differences in these studies, when they were found, may have been attributable to either individual differences in glomerular response patterns or the minor contaminants found in the odorants used in such studies. Ma and Shepherd (2000) also reported differences in the representations of (+)- and (−)-carvone, as well as between (+)- and (−)-limonene, in the olfactory epithelium of the mouse. They found both shared and different responses of the olfactory receptor neurons to these enantiomers. It therefore would be interesting to see how their data in the epithelium map onto glomerular responses in the bulb.
Whereas humans, bees, and monkeys (Laska and Teubner, 1999a;Laska et al., 1999b; Laska and Galizia, 2001) have been shown to be able to discriminate the enantiomers of limonene, it is clear that the rats in this study did not make that discrimination. Such data suggest that rats may lack enantioselective receptors for both limonene and terpinene-4-ol. At the same time, it is remarkable that the neural response patterns to the enantiomers of limonene better predicted the perceptual response in the rat than the responses of other species to these odorants. Species differences in the responsiveness to odorants have been reported previously with other odorants, including enantiomers (Friedrich and Korsching, 1997; Laska et al., 1999b). Aside from species differences, however, the differences in odor discrimination observed among these species may arise from the differences in the behavioral tasks used; whereas in our task each odor pair is compared only once and no reward associations are made, the experiments in which subjects succeeded in discriminating the enantiomers of limonene used behavioral paradigms in which the animal is encouraged to learn to discriminate between even very similar odorants and is given repeated trials to do so.
The three pairs of enantiomers used in this study were selected, in part, because of their structural similarity. Carvone differs from limonene by a ketone group, and terpinen-4-ol differs from limonene by the presence of a hydroxyl group and the absence of a double bond in its isopropyl group. Despite these very small differences in molecular structure, there were remarkable differences in glomerular representation and perception among these odorants. These data support the idea that even small changes in molecular structure, especially when they involve different functional groups (Johnson and Leon, 2000), can have a large impact on olfactory coding.
The use of differential habituation may enable multivariate analyses among odorants that have been possible previously only with great difficulty (Youngentob et al., 1990). Because odorant molecules vary along many dimensions, the relationships among odorants must be established along a number of molecular parameters. The ability to compare odor perceptions in this way may well be needed to understand the relationships among large numbers of odorants that vary along many dimensions.
Footnotes
This research is funded by National Institute on Deafness and Other Communication Disorders Grant DC03545 to M.L. We thank Dr. T. A. Cleland for critical reading of this manuscript.
Correspondence should be addressed to Christiane Linster, Department of Neurobiology and Behavior, W249 Mudd Hall, Cornell University, Ithaca, NY 14853. E-mail: CL243@cornell.edu.
REFERENCES
- 1.Chess A, Simon I, Cedar H, Axel R. Allelic inactivation regulates olfactory receptor gene expression. Cell. 1994;78:823–834. doi: 10.1016/s0092-8674(94)90562-2. [DOI] [PubMed] [Google Scholar]
- 2.Curran-Everett D. Multiple comparisons: philosophies and illustrations. Am J Physiol Reg Integr Comp Physiol. 2000;279:R1–R8. doi: 10.1152/ajpregu.2000.279.1.R1. [DOI] [PubMed] [Google Scholar]
- 3.Doving KB. An electrophysiological study of odour similarities of homologous substances. J Physiol (Lond) 1966;186:97–109. doi: 10.1113/jphysiol.1966.sp008022. [DOI] [PMC free article] [PubMed] [Google Scholar]
- 4.Friedman L, Miller JG. Odor incongruity and chirality. Science. 1971;172:1044–1046. doi: 10.1126/science.172.3987.1044. [DOI] [PubMed] [Google Scholar]
- 5.Friedrich RW, Korsching SI. Combinatorial and chemotopic odorant coding in the zebrafish olfactory bulb visualized by optical imaging. Neuron. 1997;18:737–752. doi: 10.1016/s0896-6273(00)80314-1. [DOI] [PubMed] [Google Scholar]
- 6.Heth G, Nevo E, Ikan R, Weinstein V, Ravid U, Duncan H. Differential olfactory perception of enantiomeric compounds by blind subterranean mole rats (Spalax ehrenbergi). Experientia. 1992;48:897–902. doi: 10.1007/BF02118430. [DOI] [PubMed] [Google Scholar]
- 7.Imamura K, Mataga N, Mori K. Coding of odor molecules by mitral/tufted cells in rabbit olfactory bulb. I. Aliphatic compounds. J Neurophysiol. 1992;68:1986–2002. doi: 10.1152/jn.1992.68.6.1986. [DOI] [PubMed] [Google Scholar]
- 8.Johnson BA, Leon M. Modular representations of odorants in the glomerular layer of the rat olfactory bulb and the effects of stimulus concentration. J Comp Neurol. 2000;422:496–509. doi: 10.1002/1096-9861(20000710)422:4<496::aid-cne2>3.0.co;2-4. [DOI] [PubMed] [Google Scholar]
- 9.Johnson BA, Leon M. Modular representations of aromatic odorants in the rat olfactory bulb. Chem Senses. 2001;26:1111–1112. [Google Scholar]
- 10.Johnson BA, Woo CC, Hingco EE, Pham KL, Leon M. Multidimensional chemotopic responses to n-aliphatic acid odorants in the rat olfactory bulb. J Comp Neurol. 1999;409:529–548. [PubMed] [Google Scholar]
- 11.Kashiwadani H, Sasaki YF, Uchida N, Mori K. Synchronized oscillatory discharges of mitral/tufted cells with different molecular receptive ranges in the rabbit olfactory bulb. J Neurophysiol. 1999;82:1786–1792. doi: 10.1152/jn.1999.82.4.1786. [DOI] [PubMed] [Google Scholar]
- 12.Laska M, Galizia CG. Enantioselectivity of odor perception in honeybees (Apis mellifera carnica). Behav Neurosci. 2001;115:632–639. doi: 10.1037/0735-7044.115.3.632. [DOI] [PubMed] [Google Scholar]
- 13.Laska M, Teubner P. Olfactory discrimination ability of human subjects for ten pairs of enantiomers. Chem Senses. 1999a;24:161–170. doi: 10.1093/chemse/24.2.161. [DOI] [PubMed] [Google Scholar]
- 14.Laska M, Teubner P. Olfactory discrimination ability for homologous series of aliphatic alcohols and aldehydes. Chem Senses. 1999b;24:263–270. doi: 10.1093/chemse/24.3.263. [DOI] [PubMed] [Google Scholar]
- 15.Laska M, Galizia CG, Giurfa M, Menzel R. Olfactory discrimination ability and odor structure-activity relationships in honeybees. Chem Senses. 1999a;24:429–438. doi: 10.1093/chemse/24.4.429. [DOI] [PubMed] [Google Scholar]
- 16.Laska M, Liesen A, Teubner P. Enantioselectivity of odor perception in squirrel monkeys and humans. Am J Physiol. 1999b;277:R1098–R1103. doi: 10.1152/ajpregu.1999.277.4.R1098. [DOI] [PubMed] [Google Scholar]
- 17.Leitereg TJ, Guadagni DG, Harris J, Mon TR, Teranishi R. Evidence for the difference between the odours of the optical isomers (+)- and (−)-carvone. Nature. 1971;230:455–456. doi: 10.1038/230455a0. [DOI] [PubMed] [Google Scholar]
- 18.Linster C, Cleland TA. How spike synchronization among olfactory neurons can contribute to sensory discrimination. J Comput Neurosci. 2001;10:187–193. doi: 10.1023/a:1011221131212. [DOI] [PubMed] [Google Scholar]
- 19.Linster C, Hasselmo ME. Behavioral responses to aliphatic aldehydes can be predicted from electrophysiological responses of mitral cells in the olfactory bulb. Physiol Behav. 1999;66:497–502. doi: 10.1016/s0031-9384(98)00324-2. [DOI] [PubMed] [Google Scholar]
- 20.Ma M, Shepherd GM. Functional mosaic organization of mouse olfactory receptor neurons. Proc Natl Acad Sci USA. 2000;97:12869–12874. doi: 10.1073/pnas.220301797. [DOI] [PMC free article] [PubMed] [Google Scholar]
- 21.Malnic B, Hirono J, Sato T, Buck LB. Combinatorial receptor codes for odors. Cell. 1999;96:713–723. doi: 10.1016/s0092-8674(00)80581-4. [DOI] [PubMed] [Google Scholar]
- 22.Meister M, Bonhoeffer T. Tuning and topography in an odor map on the rat olfactory bulb. J Neurosci. 2001;21:1351–1360. doi: 10.1523/JNEUROSCI.21-04-01351.2001. [DOI] [PMC free article] [PubMed] [Google Scholar]
- 23.Mombaerts P, Wang F, Dulac C, Chao SK, Nemes A, Mendelsohn M, Edmonson J, Axel R. Visualizing an olfactory sensory map. Cell. 1996;87:675–686. doi: 10.1016/s0092-8674(00)81387-2. [DOI] [PubMed] [Google Scholar]
- 24.Mori K, Mataga N, Imamura K. Differential specificities of single mitral cells in rabbit olfactory bulb for a homologous series of fatty acid odor molecules. J Neurophysiol. 1992;67:786–789. doi: 10.1152/jn.1992.67.3.786. [DOI] [PubMed] [Google Scholar]
- 25.Rawson NE, Eberwine J, Dotson R, Jackson J, Ulrich P, Restrepo D. Expression of mRNAs encoding for two different olfactory receptors in a subset of olfactory receptor neurons. J Neurochem. 2000;75:185–195. doi: 10.1046/j.1471-4159.2000.0750185.x. [DOI] [PubMed] [Google Scholar]
- 26.Ressler KJ, Sullivan SL, Buck LB. Information coding in the olfactory system: evidence for a stereotyped and highly organized epitope map in the olfactory bulb. Cell. 1994;79:1245–1255. doi: 10.1016/0092-8674(94)90015-9. [DOI] [PubMed] [Google Scholar]
- 27.Rubin BD, Katz LC. Optical imaging of odorant representations in the mammalian olfactory bulb. Neuron. 1999;23:499–511. doi: 10.1016/s0896-6273(00)80803-x. [DOI] [PubMed] [Google Scholar]
- 28.Rubin BD, Katz LC. Spatial coding of enantiomers in the rat olfactory bulb. Nat Neurosci. 2001;4:355–356. doi: 10.1038/85997. [DOI] [PubMed] [Google Scholar]
- 29.Sachse S, Rappert A, Galizia CG. The spatial representation of chemical structures in the antennal lobe of honeybees: steps towards the olfactory code. Eur J Neurosci. 1999;11:3970–3982. doi: 10.1046/j.1460-9568.1999.00826.x. [DOI] [PubMed] [Google Scholar]
- 30.Serizawa S, Ishii T, Nakatani H, Tsuboi A, Nagawa F, Asano M, Sudo K, Sakagami J, Sakano H, Ijir T, Matsuda Y, Suzuki M, Yamamori T, Iwakura Y, Sakano H. Mutually exclusive expression of odorant receptor transgenes. Nat Neurosci. 2000;3:687–693. doi: 10.1038/76641. [DOI] [PubMed] [Google Scholar]
- 31.Stewart WB, Kauer JS, Shepherd GM. Functional organization of rat olfactory bulb analysed by the 2-deoxyglucose method. J Comp Neurol. 1979;185:715–734. doi: 10.1002/cne.901850407. [DOI] [PubMed] [Google Scholar]
- 32.Strottman J, Conzelmann S, Beck A, Feinstein P, Breer H, Mombaerts P. Local permutations in the glomerular array of the mouse olfactory bulb. J Neurosci. 2000;20:6927–6938. doi: 10.1523/JNEUROSCI.20-18-06927.2000. [DOI] [PMC free article] [PubMed] [Google Scholar]
- 33.Taniguchi M, Kashiwayanagi M, Kurihara K. Quantitative analysis on odor intensity and quality of optical isomers in turtle olfactory system. Am J Physiol. 1992;262:R99–R104. doi: 10.1152/ajpregu.1992.262.1.R99. [DOI] [PubMed] [Google Scholar]
- 34.Teyke T, Gelperin A. Olfactory oscillations augment odor discrimination not odor identification by Limax CNS. NeuroReport. 1999;10:1061–1068. doi: 10.1097/00001756-199904060-00030. [DOI] [PubMed] [Google Scholar]
- 35.Touhara K, Sengoku S, Inaki K, Tsuboi A, Hirono J, Sato T, Sakano H, Haga T. Functional identification and reconstitution of an odorant receptor in single olfactory neurons. Proc Natl Acad Sci USA. 1999;96:4040–4045. doi: 10.1073/pnas.96.7.4040. [DOI] [PMC free article] [PubMed] [Google Scholar]
- 36.Vassar R, Chao SK, Sitcheran R, Nuñez JM, Vosshall LB, Axel R. Topographic organization of sensory projections to the olfactory bulb. Cell. 1994;79:981–991. doi: 10.1016/0092-8674(94)90029-9. [DOI] [PubMed] [Google Scholar]
- 37.Wehr M, Laurent G. Odour encoding by temporal sequences of firing in oscillating neural assemblies. Nature. 1996;384:162–166. doi: 10.1038/384162a0. [DOI] [PubMed] [Google Scholar]
- 38.Youngentob SL, Markert LM, Mozell MM, Hornung DE. A method for establishing a five odorant identification confusion matrix task in rats. Physiol Behav. 1990;47:1053–1059. doi: 10.1016/0031-9384(90)90352-5. [DOI] [PubMed] [Google Scholar]