

Abstract
The highly regulated expression of neurofilament (NF) proteins during axon outgrowth suggests that NFs are important for axon development, but their contribution to axon growth is unclear. Previous experiments in Xenopuslaevis embryos demonstrated that antibody-induced disruption of NFs stunts axonal growth but left unresolved how the loss of NFs affects the dynamics of axon growth. In the current study, dissociated cultures were made from the spinal cords of embryos injected at the two-cell stage with an antibody to the middle molecular mass NF protein (NF-M), and time-lapse videomicroscopy was used to study early neurite outgrowth in descendants of both the injected and uninjected blastomeres. The injected antibody altered the growth dynamics primarily in long neurites (>85 μm). These neurites were initiated just as early and terminated growth no sooner than did normal ones. Rather, they spent relatively smaller fractions of time actively extending than normal. When growth occurred, it did so at the same velocity. In very young neurites, which have NFs made exclusively of peripherin, NFs were unaffected, but in the shaft of older neurites, which have NFs that contain NF-M, NFs were disrupted. Thus growth was affected only after NFs were disrupted. In contrast, the distributions of α-tubulin and mitochondria were unaffected; thus organelles were still transported into neurites. However, mitochondrial staining was brighter in descendants of injected blastomeres, suggesting a greater demand for energy. Together, these results suggest a model in which intra-axonal NFs facilitate elongation of long axons by making it more efficient.
Keywords: neurofilaments, neurite outgrowth, Xenopus laevis, spinal cord, time-lapse videomicroscopy, mitochondria
The cytoskeleton directly drives axonal outgrowth and branching. Thus, elucidating the contribution of each of its components is essential for a full mechanistic understanding of axon development. The axonal cytoskeleton consists of three polymers: microfilaments (MFs), microtubules (MTs), and neurofilaments (NFs), which are the intermediate filaments (IFs) of neurons. Of these, only MTs and MFs are absolutely essential for axonal outgrowth. The motile forces driving axon elongation and growth cone motility have been attributed to the complex interplay between the polymerization state of these two polymers, their structural stabilization and organization, and the forces generated by the mechanoenzymes that interact with them (Mitchison and Kirschner, 1988;Smith, 1988, 1994; Sheetz et al., 1992; Lin et al., 1994; Yu et al., 1996; Baas, 1997; Kobayashi and Mundel, 1998; Wylie et al., 1998). In contrast, because NFs are expendable for outgrowth (Szaro et al., 1991;Lin and Szaro, 1995; Zhu et al., 1997; Elder et al., 1998a; Levavasseur et al., 1999), they have received less attention.
During axon outgrowth, the molecular composition (Shaw and Weber, 1982;Carden et al., 1987; Szaro et al., 1989; Fliegner et al., 1994; Leake et al., 1999) and distribution of NFs change within developing axons and dendrites (Benson et al., 1996; Undamatla and Szaro, 2001) in patterns that correlate with different phases of outgrowth. For example, in fish and frog, type III NF proteins, which are orthologous to mammalian peripherin, emerge during the earliest stages of neurite outgrowth (Goldstone and Sharpe, 1998; Leake et al., 1999; Gervasi et al., 2000). These peripherin-like subunits are later supplemented by type IV, α-internexin-like subunits, such as gefiltin in fish (Glasgow et al., 1994) and Xenopus neuronal IF (XNIF) (Charnas et al., 1992) and xefiltin (Zhao and Szaro, 1997) in frog. In developing frog spinal cord, XNIF is coexpressed with middle molecular mass NF (NF-M), and the onset of this expression correlates with a transition from short, flattened neurites to longer, more cylindrical ones (Charnas et al., 1992; Undamatla and Szaro, 2001). Moreover, in these axons, peripherin is abundant in growth cones, whereas XNIF and NF-M emerge in a proximal to distal gradient of decreasing abundance from the cell body outward (Undamatla and Szaro, 2001), further suggesting that in developing axons the roles of these NFs differ. In transgenic mice (Zhu et al., 1997; Beaulieu et al., 2000) and mutant quails (Yamasaki et al., 1991, 1992; Jiang et al., 1996), the loss of low molecular mass NF (NF-L) results in 20% fewer axons at birth and in reduced rates of peripheral nerve regeneration. These observations thus indirectly implicate NFs in facilitating axon outgrowth.
More direct evidence comes from antisense oligonucleotide experiments in neuroblastoma cells (Shea and Beermann, 1999) and from antibody and RNA injection studies in Xenopus laevis embryos (Szaro et al., 1991; Lin and Szaro, 1995, 1996). In Xenopus, antibodies against NF-M or an RNA encoding a dominant negative mutant NF-M were injected into two-cell-stage embryos to disrupt NFs on one side of the embryo during early axon development. By the second day of axon outgrowth, these reagents produced shorter axons, both in intact embryos (Szaro et al., 1991; Lin and Szaro, 1996) and in culture (Lin and Szaro, 1995), indicating that NFs promote normal rates of axon elongation. Their endpoint analysis in fixed preparations, however, precluded identifying which parameters of axonal growth dynamics were compromised by the loss of NFs. The current study provides this information by using time-lapse video microscopy to study the growth of cultured embryonic spinal cord axons of embryos injected at the two-cell stage with one of the same NF-M antibodies used in the earlier studies. We found that developing axons lacking NFs grew more slowly because they spent relatively smaller fractions of their growth cycles extending than did normal axons from the same embryos.
MATERIALS AND METHODS
Embryonic blastomere injections. Fertilized eggs were continually collected in the morning from spawnings of periodic albino (ap/ap)Xenopus laevis frogs (Hoperskaya, 1975) induced by human chorionic gonadotropin (Chorulon, NLS Animal Health, Oklahoma City, OK) injected intraperitoneally the previous night. Fertilized eggs were collected, and their jelly coats were removed by brief treatment (1–2 min) in 10 mm dithiothreitol/50 mm Tris, pH 8, as described in Lin and Szaro (1995). Normally cleaving two-cell embryos were placed in 5% Ficoll in HEPES-buffered Steinberg's solution [HBS: 58.2 mm NaCl, 0.67 mm KCl, 0.34 mmCa(NO3)2, 0.83 mm MgSO4, 5 mm HEPES, pH 7.6] containing penicillin (5 U/ml; Sigma, St. Louis, MO) and streptomycin (3.8 U/ml, Sigma). Embryos were then microinjected into one blastomere near the animal pole as described elsewhere (Szaro et al., 1991; Lin and Szaro, 1995). Approximately 4 hr after injection, embryos were transferred through a series of graded dilutions into 20% HBS for rearing.
Solutions for microinjection. To disrupt NFs, we used a purified mouse monoclonal antibody (XC10C6) recognizing a nonphosphorylated epitope within the first 392 amino acids ofXenopus NF-M (Lin and Szaro, 1996). The production of this antibody (Szaro and Gainer, 1988), its specificity, the distribution of its epitope within developing Xenopus spinal cord neurons (Szaro et al., 1989; Lin and Szaro, 1994; Undamatla and Szaro, 2001), and its purification for injection into Xenopus embryos (Lin and Szaro, 1995) are described extensively elsewhere. This same antibody and its Fab fragments were used in two previous studies to disrupt NFs in developing Xenopus embryos (Szaro et al., 1991; Lin and Szaro, 1995). For clarity, we will refer to XC10C6 throughout the remainder of this paper as “anti-NF-M.”
In the two previous studies, several purified control antibodies were injected to confirm that the effects of injecting anti-NF-M on NFs and on axonal outgrowth were specific. These included a rabbit anti-sheep IgG and several mouse monoclonal IgGs directed against (1) a rat neurophysin, (2) an epitope on rat NF-M not found in Xenopus(Szaro et al., 1991), (3) Xenopus β-tubulin, and (4) bacterial β-galactosidase (Lin and Szaro, 1995). For the current study, we used only the last of these (anti-β-galactosidase), because large quantities of purified antibody may be obtained commercially (Promega, Madison, WI). We further prepared it for microinjection by dialyzing it extensively against HBS as described in Lin and Szaro (1995).
To label cells descended from the injected blastomere, antibodies were mixed either with lysinated Oregon Green Dextran 488 [OG-Dx 488 (Molecular Probes, Eugene OR), final concentration 7.5 mg/ml] or in the case of cultures stained for mitochondria, with lysinated rhodamine–dextran (Molecular Probes; final concentration 1.2 mg/ml). As described in the original study in cultured neurons (Lin and Szaro, 1995), antibody/fluorescent dye solutions were prepared and injected so that each embryo received an estimated 70–150 ng of antibody.
Preparation of dissociated embryonic spinal cord cultures. Injected embryos were raised to stage 22 (Nieuwkoop and Faber, 1994), which precedes the time when endogenous NF-M expression begins (Szaro et al., 1989). Normally developing embryos were examined briefly under a fluorescence dissecting microscope (Olympus SZX12), and only those with unilaterally labeled spinal cords were selected for culturing. The spinal cord and adjacent myotomes were dissected from the embryos, dissociated for 25 min in calcium–magnesium-free HBS, and placed into culture as described elsewhere (Tabti and Poo, 1991; Lin and Szaro, 1994). Cultures were grown in 35 mm polystyrene culture dishes (Nunc, Naperville, IL) in 600 μl of culture medium [60% Leibowitz's L-15 with glutamine (Life Technologies/BRL, Gaithersburg, MD), 39% HBS, 1% CPSR-1 serum substitute (Sigma, St. Louis, MO), penicillin (5U/ml, Sigma), streptomycin (3.8 U/ml, Sigma)]. Culture dishes were made of Nunclon Δ plastic, which provides a commercially prepared, uniform substrate that minimizes variability in the rates of neurite outgrowth among separate cultures; on this substrate, Xenopus spinal cord neurons express NF subunits at the same time as in intact embryos (Lin and Szaro, 1994; Undamatla and Szaro, 2001). After plating, cultures sat in a dark humidified chamber at room temperature until needed for histochemistry or time-lapse observation.
Histochemical procedures. The following antibodies were used to examine the effects of injected antibodies on the intracellular distributions of cytoskeletal proteins: (1) a sheep antiserum against bovine brain α-tubulin (diluted 1:100; Southern Biotechnology, Birmingham, AL), which was used previously to study the distribution of α-tubulin in neurons of anti-NF-M-injected Xenopus embryos (Lin and Szaro, 1995); (2) a rabbit antiserum againstXenopus peripherin (Gervasi et al., 2000), diluted 1:1000; and (3) a rabbit antiserum (diluted 1:1000) against XNIF, aXenopus NF subunit most closely related in mammals to α-internexin (Charnas et al., 1992). Cultures immunostained for α-tubulin were fixed (10% formalin, 2% sucrose in 0.1m sodium phosphate buffer (PB), pH 7.4, for 1 hr, and cells were then permeabilized (0.5% Triton X-100/2% sucrose in 0.1 m PB) for 30 min. Cultures immunostained for peripherin or XNIF were fixed in 100% methanol, as described elsewhere (Lin and Szaro, 1994). Biotinylated secondary antibodies (Vector Laboratories, Burlingame, CA) against the appropriate species and rhodamine-avidin D (Vector Laboratories) were used to visualize the distribution of primary antibody-antigen complexes. Procedures for indirect immunocytochemistry were otherwise as described previously (Lin and Szaro, 1995; Undamatla and Szaro, 2001). After staining, cultures were mounted (Permafluor, Shandon Lipshaw, Pittsburgh, PA) under cover glasses for epifluorescence observation on a Leitz Laborlux compound microscope through appropriate filters (N2 for rhodamine; I3 or K3 for Oregon Green Dextran 488).
Mitochondrial staining. To stain for mitochondria, we tested three different fluorescent vital dyes: MitoTracker Red (Molecular Probes), rhodamine 123 (Sigma), and 4-diethylamino-styryl-N-methylpyridinium iodide (4-Di-2-Asp; Molecular Probes). Of these, 4-Di-2-Asp was the most suitable, because MitoTracker Red also stained yolk platelets intensely, and the fluorescence spectra of rhodamine 123 overlapped with that of both OG-Dx 488 and rhodamine-dextran. At 24 hr after plating, 150 μl of medium containing 4-Di-2-Asp (6 μg/ml) was added directly to the 600 μl of culture medium, and cultures were incubated for 5 min. The staining solution was then removed, and cultures were rinsed in several changes of fresh medium until the background was reduced to acceptable levels. Live, stained cultures were observed through a long working distance, 40× objective [Leitz PL Fluotar, 0.6 numerical aperture (NA)] under epifluorescence illumination (50 W mercury) passed through an infrared reflecting mirror and a Leitz K3 filter, and images were captured with a Dage CCD300T-RC video camera. The gain and black level settings on the digital camera were kept the same between images. For quantitation, 23 images from three separate cultures were recorded from neurons that had long neurites (>85 μm) and were descended from NF-M antibody-injected blastomeres, and 30 images from the same cultures were recorded from cells with long neurites that were descended from the uninjected blastomere.
The “linescan” function of Metamorph was used to measure the intensity of 4-Di-2-Asp staining within the principal (longest) neuritic branch. This function integrates image intensities along a line created by tracing the length of the neurite. The width of this line was then adjusted to span the width of the neurite. This integrated image intensity was then corrected for background, which was determined by integrating along the same line moved to an adjacent region of the image that had no staining. This corrected integrated intensity was then normalized in two separate ways by (1) dividing it by the number of 4-Di-2-Asp-stained “clusters” of mitochondria within the neurite, and (2) dividing it by the length of the neurite. Also, the staining intensity within cell bodies was determined by integrating the image intensities contained within an outline of the soma. This integrated intensity was also corrected for background in a manner similar to that used for the neurite measurements and then normalized over the area occupied by the cell.
Time-lapse observation and analysis. The conditions for continuous time-lapse observation emerged from an extensive series of preliminary experiments done to verify that cells under constant observation on the microscope grew the same as those within the original humidified culture chamber used in our previous experiments (Lin and Szaro, 1994, 1995). For each experiment in this series, three cultures were kept under illumination on the microscope for 24 hr, and a second set of three cultures was grown in the original culture chamber. Cultures were then fixed, and the number of neurons and lengths of their neurites were measured and compared. Illumination conditions and humidity were modified until the cultures on the microscope were indistinguishable from those grown in the original chamber (Lin and Szaro, 1994, 1995).
For time-lapse observation, cultures were placed on the stage of an inverted fluorescence microscope (Leitz Fluovert) enclosed within a custom-made, darkened, humidified box at room temperature (20–25°C). The microscope has a programmable stage (Prior Scientific), accurate to 0.5 μm and holding up to six 35 mm dishes, and a motorized z-focus drive with auto focus to correct for drift in the height of the stage. For phase-contrast illumination, light from a 20 W tungsten lamp was passed through infrared reflecting and Schott low-pass (<600 nm) filters to remove heat, and then through a green (510–530 nm) bandpass filter to further reduce the phototoxic effects of blue light. The intensity of this light was lowered to the minimum that yielded good phase-contrast images. A desktop computer controlled the microscope and image acquisition through Metamorph software (version 3.5; Universal Image, West Chester, PA). Images were gathered through a Dage CCD300T-RC video camera and could be viewed simultaneously in real time on a Sony monitor and passed to the frame grabber (MuTech) of the computer.
For each time-lapse experiment, 20 fields of view from each of three cultures were observed. Cultures were placed on the microscope stage at 3 hr after plating, at which time cells were attached to the substrate. To capture the earliest phases of neurite outgrowth, groups of undifferentiated cells were selected at random. To maximize the number of cells within a field of view, and to increase the likelihood that the entire neurite would remain within the field of view during the observation period, cells were observed at low power (10× objective, 0.5× adapter). The fields of view were selected with cells at densities that were sufficiently low to reduce the likelihood that neurite growth dynamics would be altered by neurites making contact with neighboring cells. Before the time-lapse recording was started, the fields of view were first imaged successively under phase contrast (Fig. 1A) and epifluorescence (Fig. 1B) illumination (Leitz K3 filter), and their coordinates were programmed into the computer. Epifluorescence illumination was then turned off, and the conditions and optimal camera settings for phase-contrast illumination were set. Recording began as soon as programming was finished, typically 5–6 hr after plating, and continued until 21 hr after plating, which matched the time when cultures were fixed in our previous studies (Lin and Szaro, 1995). Images were collected every 10 min (Fig. 1C) from each of the 60 positions.
Fig. 1.

Time-lapse analysis of neurite outgrowth. From each culture, 20 fields of view were imaged 3–5 hr after plating, first under phase-contrast illumination (A) and then under fluorescence (B) for Oregon Green Dextran 488 (OG Dx). The scale bar in Aalso applies to B. Beginning at 5 hr after plating, phase-contrast images of each field were then collected every 10 min for 16 hr. C, A growing unlabeled neurite identified from the above panels (arrowhead in A andB), shown at selected 10 min intervals, as numbered in the top left-hand corner of each frame.
In all, 21 and 18 cultures were analyzed for embryos injected with anti-NF-M and anti-β-galactosidase, respectively. Neurons descended from the injected blastomere (labeled neurons) were distinguished from those descended from the uninjected blastomere (unlabeled neurons) by overlaying the fluorescence and phase-contrast images collected at the start of the observation period. For each neuron, the principal neuritic branch was selected by determining from the video record which branch became the longest. The maximum length attained by this branch during the observation period was measured from the edge of the soma to the growth cone, using the morphometric functions of Metamorph, and then stored in an Excel spreadsheet. The time-lapse tracking feature of Metamorph was used to measure the distance that the end of the neurite moved between frames. When neurites retracted, this distance was converted in Excel to a negative number. The velocity of axon growth at any given time was calculated by dividing this distance by the time elapsed between frames (10 min) and then converting this value to units of micrometers per hour.
RESULTS
The conditions and parameters of this study were chosen to reproduce, as closely as possible, those of our previous study, which examined the effects of anti-NF-M on axonal growth in fixed cultures of injected embryos (Lin and Szaro, 1995). In that study, we demonstrated that anti-NF-M, as a solution of either whole IgGs or Fab fragments, persisted for at least 24 hr after embryos were injected. The descendants of the injected blastomere produced neurites devoid of XNIF, an NF subunit that colocalizes with NF-M (Undamatla and Szaro, 2001). These neurites were shorter at 21 hr, but not at 9 hr. None of several control antibodies produced these effects. For a complete description of these results and the relevant controls, we refer the reader to this study (Lin and Szaro, 1995) and an earlier one (Szaro et al., 1991) that used two different NF-M antibodies to study the role of NFs in intact embryos.
Injected anti-NF-M specifically disrupted neuritic NFs containing NF-M
To determine the effects that the injected anti-NF-M antibody had on the intracellular distribution of other NF subunits, cultures of injected embryos were immunostained for XNIF at 8 hr (three cultures), 12 hr (three cultures), 21 hr (eight cultures), and 42 hr (five cultures) after plating. In earlier studies (Charnas et al., 1992; Lin and Szaro, 1994; Gervasi et al., 2000; Undamatla and Szaro, 2001), we have shown that XNIF and NF-M are coexpressed in elongating neurites, after outgrowth is initiated. During the first day of outgrowth, XNIF and NF-M are typically found primarily in neurites >50 μm and emerge gradually as neurites grow, with 40–60% of the neurites exceeding 50 μm expressing them at 12 hr after plating, and 80–90% at 24 hr. Moreover, during this period, they are most abundant in segments of the neurite closest to the cell body, generally exhibiting a proximal-to-distal gradient of decreasing intensity toward the distal end of the neurite (Undamatla and Szaro, 2001). An example of this gradient is shown in a control cell stained for XNIF (Fig.2A,B). In contrast, for cells descended from blastomeres injected with anti-NF-M, XNIF was always found trapped within perikarya (Fig.2C–E, 12 h injected) and was undetectable in neurites through 21 hr, which marked the end of the time-lapse study. This was in contrast to the distribution of the coinjected Oregon Green Dextran 488, which filled the neurite (Fig.2D). The disruption of XNIF persisted well beyond the observation period used in the current study, through at least 42 hr after plating (Fig. 2F–K). At this time, we could begin to find occasional small, scattered patches of XNIF immunoreactivity within the neurites (Fig. 2K). In contrast, injection of the control IgG (anti-β-galactosidase) had no effect on XNIF [data not shown; but see Lin and Szaro (1995)]. These experiments confirmed the effects of anti-NF-M on XNIF from the previous study, and further demonstrated that these effects persisted beyond the period of time-lapse observation, through the second day of culture.
Fig. 2.
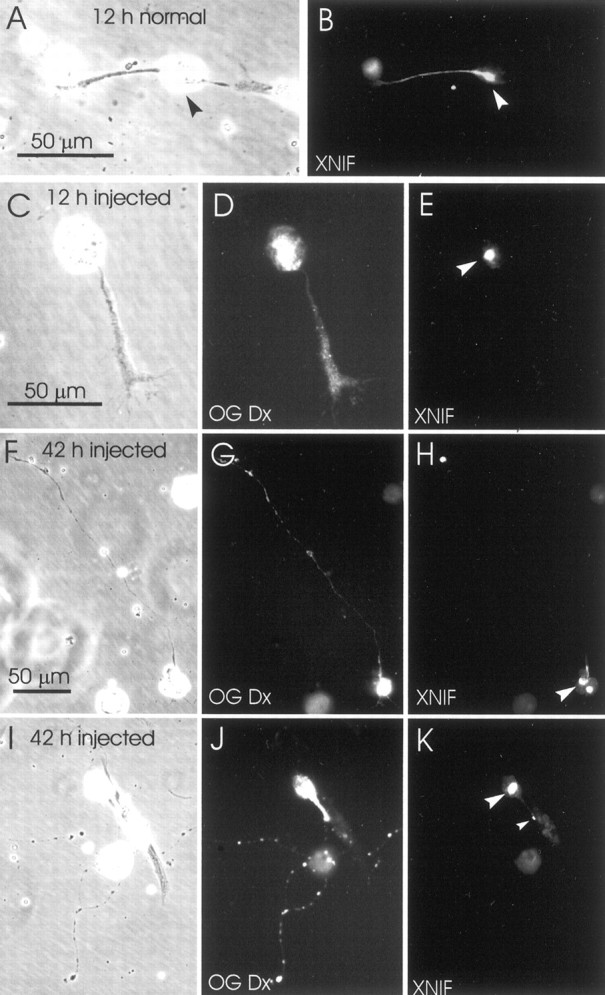
Effects of the injected anti-NF-M antibody on the intracellular distribution of XNIF. A, B, Typical distribution of XNIF immunoreactivity in a normal young neurite, 12 hr after plating. Staining extends from the cell body (arrowhead) through the neurite in a proximal-to-distal gradient of decreasing intensity. C–K, The distribution of XNIF in neurons descended from the blastomere that was injected with anti-NF-M. Left,center, and right columns show phase-contrast, Oregon Green Dextran 488 (OG Dx) fluorescence, and peripherin immunofluorescence views of the same neurons, respectively. C–E, Young neuron, 12 hr after plating. XNIF immunoreactivity was confined exclusively to the cell body (arrowhead).F–I, Older neurons, 42 hr after plating. XNIF immunoreactivity was still confined primarily to the cell body (large arrowheads) but also occasionally appeared as small dots scattered along the neurite (K, small arrowhead). The scale bars in A,C, and F also apply to B,D, E, andG–K, respectively.
A third NF protein, peripherin, which is expressed in embryonicXenopus spinal cord well before neurite outgrowth is initiated and NF-M and XNIF are expressed (Goldstone and Sharpe, 1998;Gervasi et al., 2000; Undamatla and Szaro, 2001), was initially unaffected by anti-NF-M. Within the shortest neurites present at the earliest time (6–8 hr, four cultures), the distribution of peripherin was comparable in labeled and unlabeled cells (a typical example is shown in Fig.3A–C), which is consistent with its expression preceding that of NF-M. In slightly longer and therefore older neurites, at both early (6–8 hr) and intermediate times (12 hr, three cultures) (Fig.3D–F), peripherin was still present in distal neurites (Fig. 3F, top arrowhead) but had also begun to accumulate within perikarya (Fig. 3F,bottom arrowhead). This observation suggested that peripherin, which gradually colocalizes with NF-M as neurites age (Undamatla and Szaro, 2001), was beginning to associate with NF-M, which became trapped within perikarya. By 21 hr (six cultures), when peripherin typically colocalizes with XNIF and NF-M along the entire length of normal neurites (Undamatla and Szaro, 2001), it was trapped entirely within perikarya (Fig. 3I). These results indicated that injected anti-NF-M specifically disrupted NFs only at times and in locations that NFs normally contain NF-M. Thus, the NFs of short neurites, which are made predominantly of peripherin, were relatively unaffected by the injected NF-M antibody, whereas those of longer neurites, which normally contain NF-M, gradually became disrupted and remained so throughout the entire period of the time-lapse study.
Fig. 3.
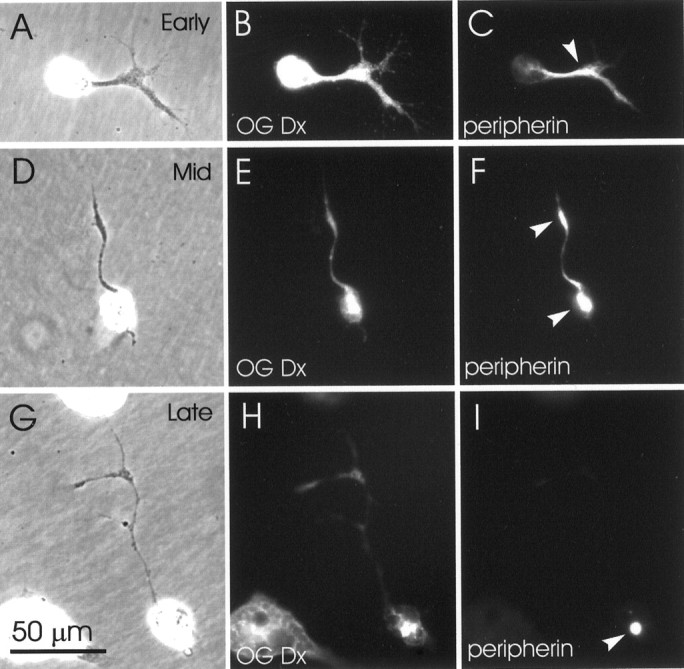
Progressively increasing effects of the injected anti-NF-M antibody on the intracellular distribution of peripherin.Left, center, and right columns show phase-contrast, Oregon Green-Dextran (OG Dx) fluorescence, and peripherin immunofluorescence views, respectively. A–C, An example of a very young neuron, 6–8 hr after plating. In very short neurites (corresponding to early outgrowth, when NF-M is typically not expressed), the distribution of peripherin within neurites (arrowhead) was unaffected.D–F, An example of a neuron at an intermediate stage (12 hr after plating). In neurons at this stage of outgrowth (when NF-M and XNIF are typically most abundant within proximal neurites), peripherin remained in distal regions of the neurite (top arrowhead) but began to become depleted from proximal regions of the neurite. In addition, peripherin began to accumulate within perikarya (bottom arrowhead).G–I, At 21 hr, representing late stages of outgrowth (when peripherin typically colocalizes with NF-M and XNIF), peripherin was confined entirely to perikarya (arrowhead). The scale bar in G applies to all panels.
Anti-NF-M reduced the number of neurons with long neurites
To determine what caused the previously observed differences in axon length between anti-NF-M-containing and noncontaining neurons (Szaro et al., 1991; Lin and Szaro, 1995), we determined from time-lapse observations both the maximum lengths that neurites achieved during the entire observation period (through 21 hr after plating) and the overall duration of the time that neurites remained active.
Figure 4 shows histograms of the distributions of maximum lengths achieved by neurites in cultures of anti-NF-M-injected embryos. The length of the principal (longest) neuritic branch was measured from the edge of the soma to the growth cone in the video frame in which the neurite reached its maximum length. For anti-NF-M-injected embryos, the distribution of unlabeled neurite lengths (Fig. 4A) was different from that of labeled ones (Fig. 4B) in that there were unlabeled neurites >210 μm but no labeled ones.
Fig. 4.

Distributions of the maximum lengths (in micrometers) achieved during the time-lapse observation period by the longest neuritic branch of each neuron from anti-NF-M-injected embryos. Distributions of labeled (A) and unlabeled (B) neurons are shown separately. The total number (N) of neurons in each category is indicated in the top right corner of each panel.
There were also fewer labeled (38% of the total) than unlabeled neurons. The reduced number of labeled versus unlabeled cells occurred equally with injections of control antibody (37%) (Table1) or Oregon Green Dextran 488 alone and is therefore unlikely to result from the loss of NFs. Instead, this result was more likely related either to how injected substances become distributed within the embryo or to the threshold of detection of Oregon Green fluorescence, in which case some proportion of cells containing very small amounts of injected dye might be scored as unlabeled. If so, our conclusions concerning changes in neurite length and growth dynamics would remain the same, because it would mean that the true differences between anti-NF-M-containing and noncontaining neurites would be even larger.
Table 1.
Maximum neurite lengths
| n | Average length (μm) | % Length <85 μm | % Length >85 μm | |
|---|---|---|---|---|
| Anti-NF-M-injected embryos | ||||
| Labeled neurons | 124 | 78 ± 41-a | 67 | 33 |
| Unlabeled neurons | 215 | 104 ± 5 | 56 | 44 |
| Anti-β-galactosidase-injected embryos | ||||
| Labeled neurons | 88 | 89 ± 6 | 61 | 39 |
| Unlabeled neurons | 141 | 86 ± 4 | 60 | 40 |
Shown are the maximum lengths achieved during the observation period by the longest neuritic branch of each neuron. The number of neurites that was measured (n), their average lengths (mean ± SEM), and the percentage of neurites with lengths that were shorter than or exceeded 85 μm are given. Labeled and unlabeled neurons were descended from the injected and uninjected blastomeres of the same embryos, respectively.
The lengths of labeled neurites of anti-NF-M-injected embryos were significantly shorter than those of the respective unlabeled neurites (p < 0.005, Student's t test performed on the log-normalized distributions), whereas those of anti-β-galactosidase-injected embryos were not (p > 0.5). The cutoff between long and short neurites (85 μm) was selected by determining the length above which the number of unlabeled neurites of anti-NF-M-injected embryos significantly (p < 0.05; fourfold χ2 test) exceeded that of their respective labeled neurites. These frequencies did not differ significantly for anti-β-galactosidase-injected embryos (p > 0.9).
Neuritic lengths differed between labeled and unlabeled cells only in the anti-NF-M-injected embryos, indicating that these differences were likely to reflect the disruption of NFs rather than nonspecific effects of intracellular IgGs. The range of neurite lengths differed significantly between labeled and unlabeled cells (p < 0.001; Tukey compact range test), with many more long unlabeled neurites than labeled ones, as did the mean lengths of labeled and unlabeled neurites (Table 1) (p < 0.005; the Student's t test was performed on data that was log normalized because of the skewness of the distributions). In contrast, in anti-β-galactosidase-injected embryos, the distributions of neurite lengths were not different between labeled and unlabeled cells (data not shown, but relevant statistics are listed in Table 1;p > 0.5; Student's t test using log normalized data).
The principal difference between the distributions of the lengths of labeled and unlabeled neurites in anti-NF-M-injected embryos was that there were fewer long labeled neurites than unlabeled ones. Thus, to simplify subsequent analysis of the dynamics of neurite growth, we decided to divide neurites into two groups: long and short. To establish a length criterion for distinguishing long neurites from short ones, we performed successive fourfold χ2 contingency tests on the frequencies of long versus short neurites to determine the minimum length at which the number of unlabeled long neurites was significantly greater than that of labeled ones (p < 0.05). This condition was met for all lengths >85 μm (Table 1). At 85 μm,p = 0.046. Among anti-β-galactosidase-injected embryos, the frequencies of long and short neurites (Table 1) were essentially the same for labeled and unlabeled neurons for all lengths (e.g., at 85 μm, χ2 = 0.072;p > 0.9). This indicated that the differences were specific for anti-NF-M and further strengthened the argument that disruption of NFs containing NF-M affects neurite length. Our next step was to determine how the dynamics of neurite outgrowth could account for this effect.
Disruption of NFs slowed the average rate of growth
Anti-NF-M-containing neurites might have been shorter either because of a delay in the initiation of neurite outgrowth or because neurite growth prematurely stopped at some critical length. Either of these possibilities would have resulted in a reduction in the overall duration of neurite growth. We defined this duration by the number of video frames (10 min per frame) from the moment the neurite was first initiated until the first of the following events occurred: (1) the cell died, (2) the neurite no longer changed length throughout the remainder of the time-lapse record (21 hr after plating), or (3) the time-lapse record ended. The overall durations of neurite growth (Table2) were not significantly different (p > 0.1; Student's t test) between labeled and unlabeled neurons in any category (i.e., long or short neurites in either anti-NF-M- or anti-β-galactosidase-injected embryos). Thus logically the lengths of anti-NF-M-containing neurons must have been shorter because their average rates of growth were reduced.
Table 2.
Overall duration of neurite growth
| n | Time (min) | |
|---|---|---|
| Anti-NF-M-injected embryos | ||
| Length >85 μm | ||
| Labeled neurites | 41 | 520 ± 35 |
| Unlabeled neurites | 95 | 510 ± 20 |
| Length <85 μm | ||
| Labeled neurites | 83 | 431 ± 24 |
| Unlabeled neurites | 120 | 401 ± 19 |
| Anti-β-galactosidase-injected embryos | ||
| Length >85 μm | ||
| Labeled neurites | 34 | 551 ± 37 |
| Unlabeled neurites | 57 | 476 ± 32 |
| Length <85 μm | ||
| Labeled neurites | 54 | 499 ± 36 |
| Unlabeled neurites | 84 | 567 ± 26 |
The average length of time is given as the mean ± SEM in minutes. The overall duration of neurite growth (mean ± SEM) is defined as the amount of time (minutes) from when neurites were first initiated until the first of the following events occurred: (1) cell death, (2) neurites stopped growing or retracting throughout the remainder of the time-lapse record, (3) the end of the time-lapse record. None of the times differed significantly between labeled and unlabeled neurites for any of the groups (Student's t test;p > 0.1).
Disruption of NFs alters the duty cycle of neurite outgrowth
Because neurites grow sporadically, exhibiting periods of forward extension punctuated by periods of idling and retraction, their average growth rates are a function of both the instantaneous velocity (how fast neurites extend during actual growth) and the duty cycle (the relative fraction of time neurites are actually extending as opposed to idling or retracting) of neurite outgrowth. We thus conducted a frame-by-frame analysis of the growth dynamics of each principal neuritic branch to determine the relative contributions of these two parameters.
The velocity of neurite outgrowth at any given time was calculated by measuring the distance that the tip of the neurite had moved since the previous video frame, dividing it by the time between frames (10 min), and converting this value to units of micrometers per hour. Positive and negative values represented neurite extensions and retractions, respectively, whereas a velocity of 0 μm/hr represented idling. Plots of velocity as a function of time after neurite outgrowth were highly variable for each neurite (data not shown), and no obvious trends emerged. Thus, we next sought to determine whether the proportion of time neurites spent growing at each velocity differed between labeled and unlabeled neurites.
First, for each neurite over its entire duration of growth (as defined previously), we created a histogram of the amount of time (number of video frames × 10 min per frame) a neurite spent moving at any given velocity. Then, to enable us to pool data from multiple neurons with different growth durations, we normalized these data for each neurite by dividing them by the growth duration of the neurite. We then averaged these data over all neurites in each category to obtain histograms (Fig. 5) relating the mean fraction of neurite growth periods (y-axis) to the 10 min growth velocity (x-axis). For both anti-NF-M- (Fig. 5) and anti-β-galactosidase-injected embryos (data not shown), no significant differences were seen in the modes or ranges of these velocity distributions between labeled and unlabeled neurons for either long (Fig. 5A) or short (Fig. 5B) neurites. Moreover, the average forward (>0 μm/hr) extension velocities (mean ± SE) of labeled and unlabeled cells of anti-NF-M-injected embryos were approximately the same (p > 0.5; Student's t test) for both the long (labeled cells, 40 ± 4 μm/hr; unlabeled cells, 41 ± 3 μm/hr) and the short neurites (labeled cells, 37 ± 3 μm/hr; unlabeled cells, 38 ± 2 μm/hr). These data thus demonstrate that the velocity of neurite extension while neurites were actually growing was unaffected by disruption of NFs.
Fig. 5.
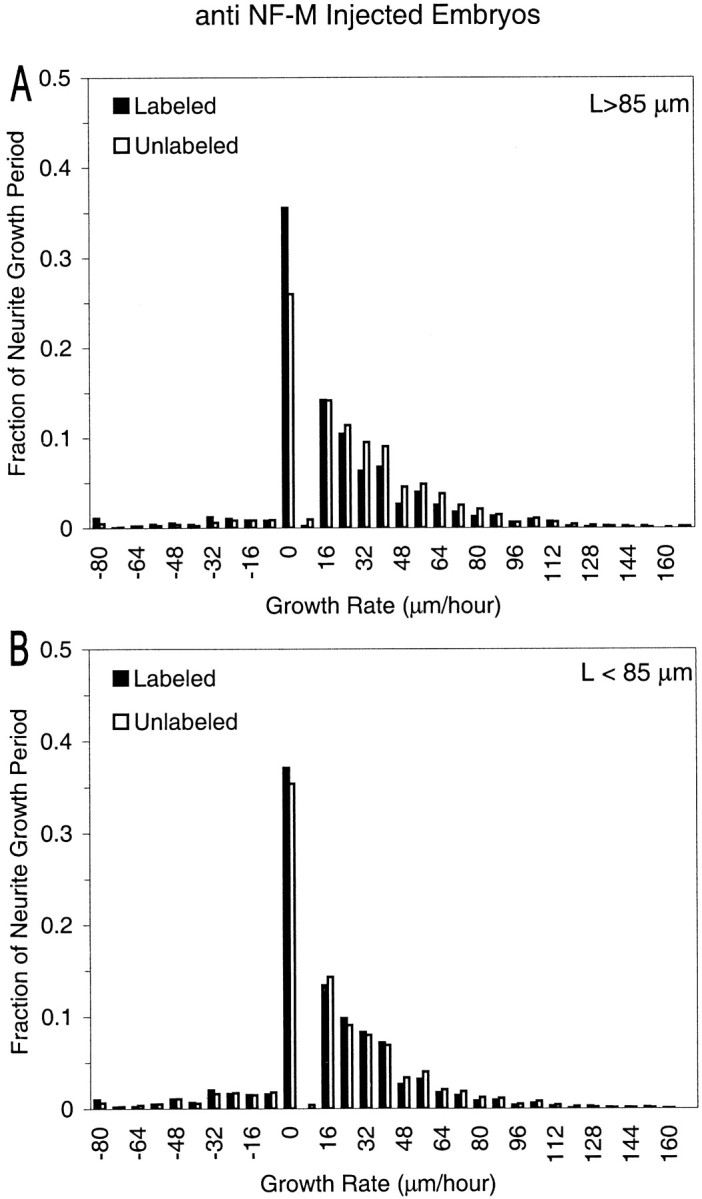
Distributions of neuritic extension velocities in anti-NF-M-injected embryos, normalized over the growth period. The growth velocity between 10 min time frames was calculated from the distance traveled by the tip of the principal neuritic branch. To obtain the fraction of the neurite growth period (y-axis) that each neurite spent moving at a given velocity (x-axis), the amount of time (number of frames × 10 min per frame) a neurite spent at a particular velocity was divided by the total length of the growth period for that neurite. These values were then averaged over all neurites in a given category [i.e., labeled (black) or unlabeled (white) and plotted separately for long (maximum length >85 μm; A) and short (maximum length <85 μm;B) neurites]. The number of neurites in each category is the same as in Table 1. Positive and negative velocities indicate extensions and retractions, respectively.
We next tested whether the duty cycles differed by determining the relative fractions of the growth period that neurites spent extending (velocities >0 μm/hr) versus idling (velocity = 0 μm/hr) or retracting (velocities <0 μm/hr). For anti-NF-M-injected embryos, the duty cycles of labeled and unlabeled neurons were significantly different (Student's t test) for long neurites (Fig.6A) (retraction,p < 0.05; idling, p < 0.05; extension, p < 0.001). They were not significantly different for either the short neurites of anti-NF-M-injected embryos (Fig. 6B) (retraction, p > 0.1; idling, p > 0.5; extension, p > 0.5), or for neurites of anti-β-galactosidase-injected embryos at any length (Fig. 7) (long neurites: retraction, p > 0.1; idling, p > 0.5; extension, p > 0.5; short neurites: retraction,p > 0.5; idling, p > 0.5; extension,p > 0.2). Thus, long neurites of anti-NF-M-injected embryos grew more slowly because of changes in the duty cycles of their neurite outgrowth rather than in their instantaneous growth rates.
Fig. 6.
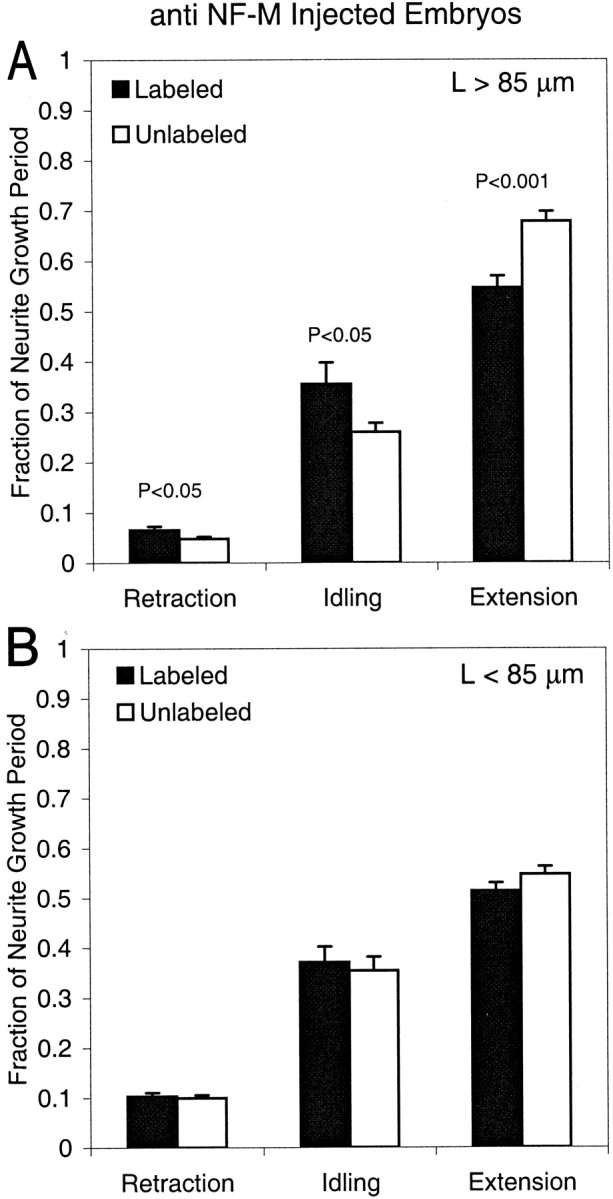
Relative fraction of the total growth period that neurites of anti-NF-M-injected embryos spent retracting (left), idling (center), or extending (right). Values (mean ± SE) from labeled (black) and unlabeled (white) neurons are plotted separately for long (length >85 μm) and short (length <85 μm) neurites (A and B, respectively). The differences between labeled and unlabeled neurons were significant (Student's t test; p < 0.05 for retraction and idling and p < 0.001 for extension) for only the long neurites. The number of neurites in each category is the same as in Table 2.
Fig. 7.
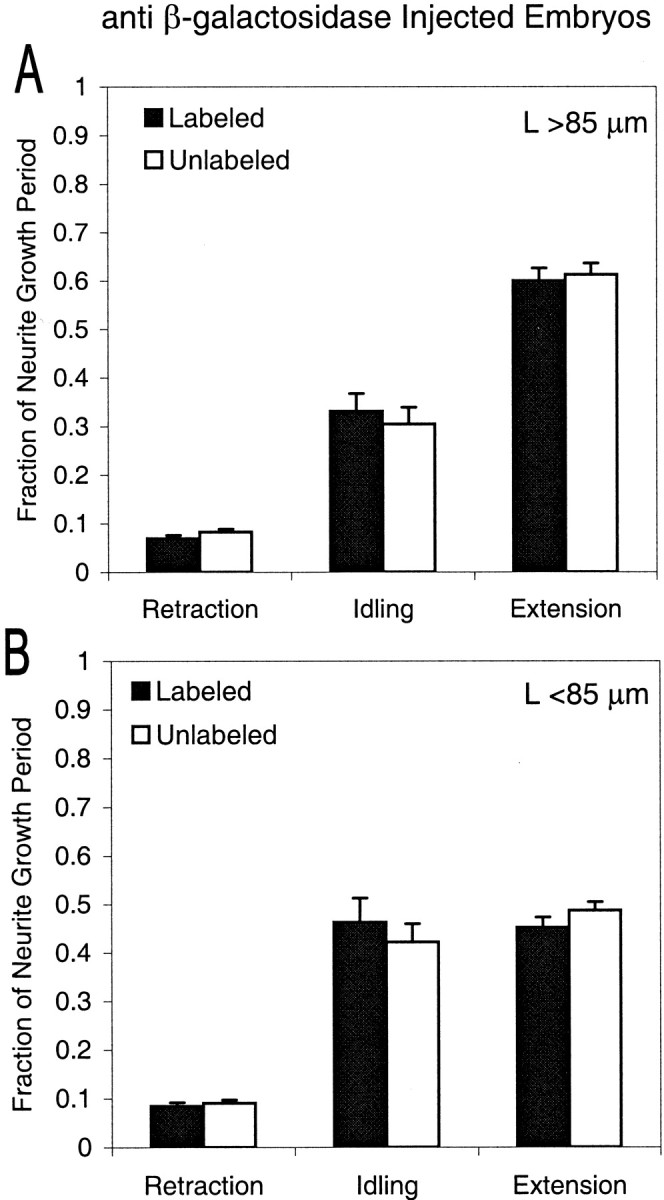
Relative fraction of the total growth period that neurites of anti-β-galactosidase-injected embryos spent retracting (left), idling (center), or extending (right). The categories of neurites are otherwise the same as in Figure 6. None of the differences between labeled and unlabeled neurons were significant (Student's t test), and the number of neurites in each category is the same as in Table2.
To determine whether differences in neurite growth occurred throughout the neurite growth period or at specific times after outgrowth was initiated, we plotted the total cumulative distance that neurites extended as a function of the absolute time that had elapsed since neurite outgrowth began for each cell. For each time point, we measured the distance a neurite had extended since the previous video frame (idlings and retractions were added as zeros) and added it to the total cumulative distance from the previous frame. These data were then averaged for each category and plotted (Fig.8 shows plots for anti-NF-M-injected embryos). Again, the most dramatic differences were observed among the long neurites. Initially, their curves overlapped, but then they gradually diverged, becoming detectably different at ∼3 hr and significantly different between 4 and 6 hr after neurites were initiated. The onset of this effect thus corresponds well with the time when NF-M is first expressed after neurite outgrowth is initiated (Undamatla and Szaro, 2001). Collectively, these data indicated that once NF-M is expressed, loss of NFs compromised neurite outgrowth continually throughout the neurite growth period.
Fig. 8.
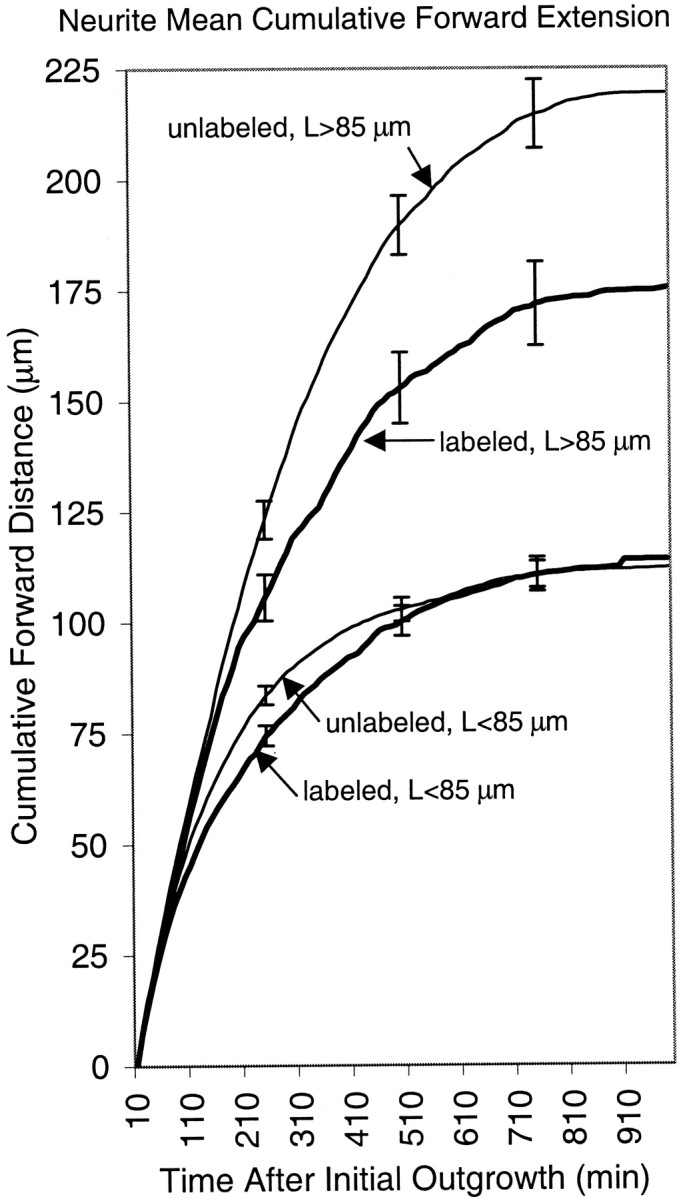
Mean cumulative distances of neuritic forward extensions (y-axis) plotted as a function of time after neurite initiation (x-axis; minutes after initial outgrowth) for neurites of anti-NF-M-injected embryos. The cumulative forward distance (micrometers) for each time point was determined by adding the distance that a neurite had extended since the previous video frame (retractions and idlings were added as zeros) to the total cumulative distance from all previous time frames since the start of neurite outgrowth. These values were then averaged (mean ± SE) among all neurites in each of the categories, as indicated by thelabeled arrows. The number of neurites is the same as in Table 2.
Injected anti-NF-M did not interfere with the entry of α-tubulin or mitochondria into neurites
One concern with using intracellularly injected antibodies to disrupt cellular proteins is that antigen–antibody complexes might cause nonspecific effects by trapping other proteins and organelles within them. This is a concern with NFs, because the NF aggregates in transgenic mice, especially those that form within the axon itself, can reduce axon survival by blocking the transport of organelles such as mitochondria (Collard et al., 1995; Beaulieu et al., 2000). Not all NF aggregates cause such effects, because those confined to perikarya are often tolerated throughout adulthood without side effects (Eyer and Peterson, 1994; Eyer et al., 1998).
To determine whether the effects of anti-NF-M on axonal growth could be attributed to a block of axonal transport, we examined the distribution of α-tubulin and mitochondria in cultures made from anti-NF-M-injected embryos. Confirming our observations for α-tubulin from earlier studies (Lin and Szaro, 1995), we found no evidence for deficiencies in neuritic α-tubulin staining in labeled neurons (a representative pair of neurons with long neurites from one of five cultures stained at 24 hr after plating is shown in Fig.9), suggesting that this cytoskeletal protein was transported normally into neurites.
Fig. 9.

Lack of effect of the injected NF-M antibody on the intracellular distribution of α-tubulin. Two representative examples of neurons immunostained for α-tubulin are shown, 1 d after plating. The distribution of staining was similar between neurons descended from blastomeres injected with NF-M antibody (B) and those descended from uninjected blastomeres (A). The arrowheads inB indicate the upper and lower bounds ofC, which shows the neurite at higher magnification so that minor processes, both stained and unstained, are easier to see.A and B were imaged through a 40× (0.7 NA) objective lens, and C was imaged through a 100× (1.32 NA) objective lens. A and B are at the same scale.
Because some of the effects of NF aggregates in transgenic mice have been attributed to deficits in axonal mitochondria (Collard et al., 1995), we also examined the number and distribution of mitochondria along labeled neurites of anti-NF-M-injected embryos at 24 hr after plating (five cultures) by using 4-Di-2-Asp as a fluorescent vital dye to stain mitochondria in living cells (Magrassi et al., 1987;Harrington and Atwood, 1995). In 4-Di-2-Asp-stained neurons, mitochondria appeared as stained dots scattered along the length of the neurite. Figure 10 shows representative examples of three pairs of labeled and unlabeled neurites of comparable lengths. Because the limit of resolution of the light microscope does not permit the determination of the precise number of mitochondria within each dot, we refer to them as mitochondrial “clusters” to acknowledge the fact that each may contain one or more mitochondria. There were no differences between anti-NF-M-containing and noncontaining neurites in either the average number of 4-Di-2-Asp-stained mitochondrial clusters per neurite (Table3 shows these data for long neurites) or in their distributions along the neurite.
Fig. 10.
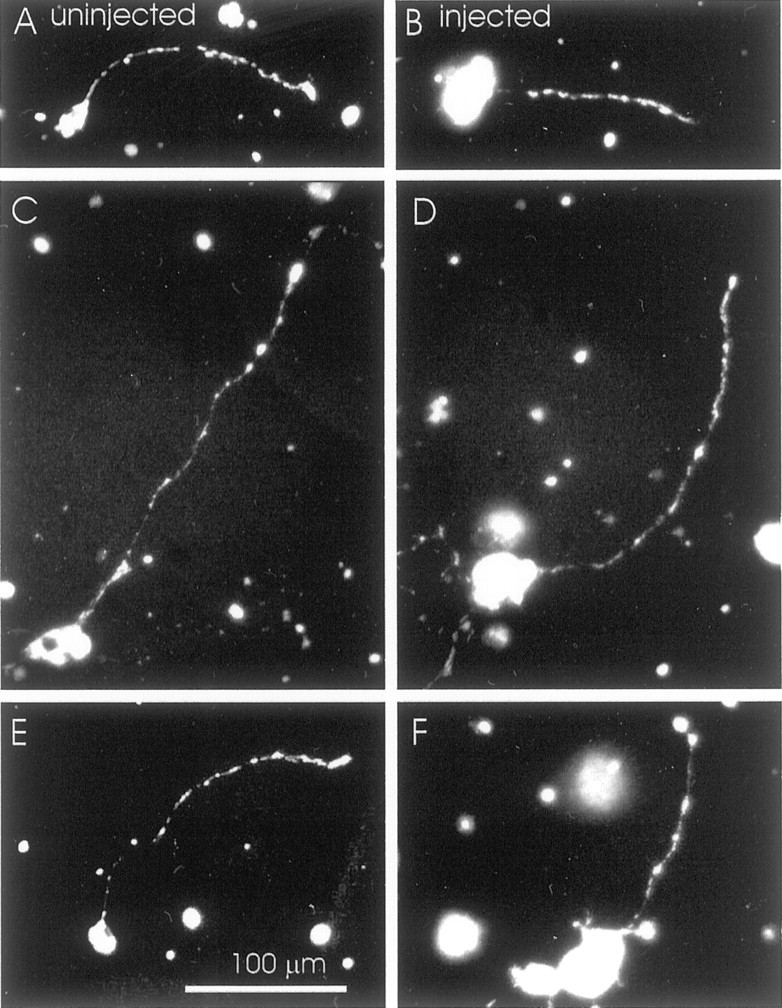
Lack of effects of the injected NF-M antibody on the distribution of mitochondria in neurites. Mitochondria were stained with 4-Di-2-Asp 24 hr after plating and then imaged in living neurons descended either from the uninjected blastomere (A,C, E) or from a blastomere injected with a mixture of anti-NF-M and rhodamine–dextran (B,D, F). Clusters of mitochondria appear as bright punctate spots along the neurite. As shown in these representative examples, the distributions of mitochondria were similar between labeled and unlabeled neurons. Scale bar in Eapplies to all panels.
Table 3.
Effects of injected anti-NF-M on mitochondrial staining
| n | Mitochondrial clusters per neurite | Intensity (IU) per mitochondrial cluster | Intensity per unit neurite length (IU/μm) | Soma intensity (IU/μm2) | |
|---|---|---|---|---|---|
| Labeled neurons | 23 | 23.9 ± 2.7 | 698 ± 92 | 99.4 ± 7.1 | 575.2 ± 20.4 |
| Unlabeled neurons | 30 | 24.9 ± 2.4 | 462 ± 36 | 64.5 ± 4.5 | 411.9 ± 20.4 |
| Level of significance | NS (p > 0.5) | p < 0.05 | p < 0.0001 | p< 0.0001 |
Embryos were injected with a mixture of rhodamine–dextran and anti-NF-M at the two-cell stage, then cultured and stained at 24 h after plating with 4-Di-2-Asp, to label mitochondria in living cells. Labeled and unlabeled neurons were descended from the injected and uninjected blastomeres, respectively. Data are from neurons with long neurites (>85 μm) from three separate cultures imaged under the same conditions to quantitate the intensity of 4-Di-2-Asp staining.n represents the number of neurites imaged. The intensities were measured as described in Materials and Methods and are given in relative intensity units (IUs) averaged among neurites (mean ± SE). The statistical levels of significance of the differences between labeled and unlabeled cells were determined by two-tailed ttest.
Because the intensity of mitochondrial staining with 4-Di-2-Asp depends on the mitochondrial membrane potential and thus correlates with the degree of oxidative phosphorylation of the mitochondria (Nguyen et al., 1997), changes in the intensity of staining of 4-Di-2-Asp are indicative of differences in metabolic activity (Nguyen et al., 1997) and underlie the observation that 4-Di-2-Asp stains active neuromuscular synapses more intensely than the rest of the axon. Thus, to rule out the possibility that despite having similar numbers of mitochondrial clusters anti-NF-M-containing neurites might have fewer or less active mitochondria than normal, we imaged 4-Di-2-Asp staining in three cultures of anti-NF-M-injected embryos under the same observation conditions to compare quantitatively the intensity of staining between labeled and unlabeled cells with long neurites.
The intensity of 4-Di-2-Asp staining was in fact greater in labeled long neurites than in unlabeled ones (Table 3). Whether normalized over the length of the neurites or over the number of mitochondrial clusters, this difference was significant. Moreover, the staining intensities of the cell bodies also differed significantly to approximately the same degree as did the neurites (the mitochondrial clusters, neurites, and cell bodies exhibited increases of 35, 37, and 39%, respectively). This suggests further that mitochondrial changes occurred throughout the cell rather than locally. To eliminate the possibility that these increases might have resulted from bleed-through of the fluorescence of the rhodamine-dextran across filters, we compared the staining of the segments between the mitochondrial clusters for rhodamine-dextran-labeled and unlabeled cells. There were no differences, and thus the observed differences were directly attributable to differences in 4-Di-2-Asp staining. These data argue conclusively against the hypothesis that NF-M antibody–antigen complexes interfered with the transport of mitochondria into the neurite. Interestingly, they further suggest that neurons descended from anti-NF-M-injected blastomeres may be metabolically more active than normal.
DISCUSSION
This study presents the first direct experimental evidence that loss of NFs can alter a specific parameter of neurite growth dynamics. We first showed that injecting anti-NF-M disrupted only those NFs composed of subunits that colocalize with NF-M and that this disruption persisted through 42 hr in culture. Time-lapse video recordings indicated that anti-NF-M-containing neurites, on average, grew more slowly than their unlabeled counterparts and that this effect was significant only among long (>85 μm) neurites. Moreover, long labeled neurites grew more slowly specifically because they spent relatively smaller fractions of their growth periods extending than did unlabeled neurites and not because they had lower extension velocities. These differences first became evident between 3 and 6 hr after neurite outgrowth was initiated and accumulated throughout the observation period.
A principal concern with using antibodies to block the function of intracellular proteins is the possibility of side effects from the accumulation of antigen–antibody complexes. In both these and our previous experiments, we have tried to control for them. In our previous studies (Szaro et al., 1991; Lin and Szaro, 1995), we showed the following: (1) two separate monoclonal antibodies (RM0270 and XC10C6) targeting distinct epitopes produce similar effects, thereby reducing the possibility that injected antibodies inhibited growth by binding to another molecule at lower specificity than to NF-M; (2) Fab fragments produce effects similar to those of whole IgGs, reducing the possibility that extensively cross-linked antigen-antibody complexes nonspecifically dam substances from entering the axon; (3) injection of a nonfunction blocking antibody to Xenopus β-tubulin (Chu and Klymkowsky, 1987) has no effect on axon development, further reducing the possibility that antigen–antibody complexes alone are responsible for the effects; (4) injection of additional control antibodies to rat NF-M, rat neurophysins, sheep IgGs, and bacterial β-galactosidase have no effect, further reducing the possibility of nonspecific effects from intracellular IgGs; (5) anti-NF-M-containing neurites are not deficient in actin or α-tubulin, further reducing the likelihood that essential proteins were nonspecifically blocked from entering neurites; and (6) disruption of NFs by expression of a dominant negative, truncated NF-M through RNA injections also stunts axon growth (Lin and Szaro, 1996), thereby strengthening the antibody injection experiments by using a different method to disrupt NFs.
In the current study, additional controls demonstrated the following: (1) mitochondrial number within neurites was unperturbed, further reducing the likelihood that antigen–antibody complexes interfered with entry of essential organelles into the axon; (2) injection of anti-β-galactosidase had no effect on neurite lengths or growth dynamics; and (3) effects of anti-NF-M were limited to those NF subunits that colocalized with NF-M, thereby strengthening the arguments for the specificity of the antibody. Moreover, the timing of the effects of anti-NF-M after the initial period of outgrowth was consistent with the onset of the expression of NF-M duringXenopus axon development. Although controlling for all possible side effects is impossible, we believe that these experiments argue strongly that NF-M, together with its partner subunits, facilitates axon elongation.
In Xenopus, direct comparison of cells with disrupted NFs with normal cells from the same embryos has revealed deficits in axonal growth dynamics. It would have been difficult to observe similar deficits in the studies of NF knock-out mice, because nearly all those observations were made postnatally [α-internexin (Levavasseur et al., 1999), NF-L (Zhu et al., 1997; Beaulieu et al., 2000), NF-M (Elder et al., 1998a), and NF-H (Elder et al., 1998b; Rao et al., 1998; Zhu et al., 1998; Jacomy et al., 1999)]. The deficits in Xenopusare consistent with the reduced lengths of neurites of neuroblastoma cells treated with α-internexin antisense oligonucleotides (Shea and Beermann, 1999) and may be easily reconciled with the mild loss of axons reported at birth in transgenic mice (Beaulieu et al., 2000) through compensatory mechanisms acting in utero. For example, mammals typically produce two to three times more peripheral neurons than are present at birth (Jacobson, 1991). If a loss of axonsin utero were compensated for by a decrease in cell death, then reductions in axon outgrowth would need to be large to be detected postnatally. Thus, the 20% reduction in axon number seen at birth in NF-L knock-out mice may indicate greater deficits earlier in development. In addition, NF transgenic mice (Jacomy et al., 1999) and mutant quails lacking NF-L (Zhao et al., 1994) exhibit greater than twofold increases in the number of axonal MTs, which may help compensate structurally for the loss of NFs. The perikaryal accumulations of several NF subunits and the eventual loss of NFs from developing neurites in anti-NF-M-injected Xenopus embryos were also comparable with what happens in NF-M knock-out mice (Elder et al., 1998a), supporting the latter study's conclusion that NF-M is essential for the transport of multiple NF subunits.
The molecular mechanism by which NFs assist axon outgrowth remains to be elucidated. Because NFs are the IFs of neurons, IF functions in other cell types suggest possibilities. IFs are the major mechanical stabilizers of the cytoplasm and form an integrated network with MTs and MFs that is essential for maintaining the mechanical integrity of tissues and cells (Fuchs and Cleveland, 1998). The salient property of IFs is that they are stable polymers of great tensile strength that are made and maintained by cells with little expenditure of energy. Despite their stability, IFs can move rapidly, especially in motile and dividing cells (Prahlad et al., 1998; Yoon et al., 1998), as can NFs and their precursors in axons (Yabe et al., 1999, 2001; Prahlad et al., 2000; Roy et al., 2000; Wang et al., 2000). This rapid movement most likely shuttles IFs efficiently to regions needing mechanical stability (Chou et al., 2001). In fibroblasts, IFs are targeted to regions of the cell that are richest in detyrosinated MTs, which comprise older, more stable MTs (Khawaja et al., 1988; Gurland and Gundersen, 1995), further supporting the idea that IFs enhance the mechanical strength and stability of particular regions of the cytoplasm. Loss of IFs from fibroblasts decreases both the mechanical stiffness of the cytoplasm and the average rate of cell motility (Wang and Stamenovic, 2000). Such stability would be especially useful for growing long axons and therefore may be the responsibility of NFs.
NF-M and XNIF, the principal NF subunits targeted by anti-NF-M, are more abundant within the axon shaft than in the growth cone, decreasing gradually in abundance from the soma toward the tip (Undamatla and Szaro, 2001). Elongating neurites of neuroblastoma cells exhibit a similar gradient for detyrosinated MTs (Shea, 2000), further suggesting, by analogy with fibroblasts, that intra-axonal NFs help MTs stabilize the axon from the soma outward. The possibility that this added stability would enhance axon elongation might at first seem surprising, because the paucity of NFs in growth cones has been taken as evidence against their playing a role in axon elongation (Gordon-Weeks, 2000). However, axons can elongate without growth cones (Ruthel and Hollenbeck, 2000), and thus, a major component of process extension must operate within the axon shaft. This component depends more on MTs than on MFs (Ruthel and Hollenbeck, 2000). Therefore, examining how NF loss affects MT organization during axonal growth might help to elucidate how this intra-axonal component works. In addition, because our experiments left the peripherin in growth cones intact, the possibility remains open that this subunit plays some additional role in supporting growth cone motility, a hypothesis that remains to be tested.
Because of their stability, NFs are said to consolidate the axonal cytoskeleton, yet until now, how such consolidation might contribute to axonal outgrowth has been unclear. Our results indicate that it makes elongation more efficient by inhibiting retractions while promoting the extension phase of the growth cycle, without increasing extension velocity. The increased intensity of mitochondrial staining in NF-disrupted neurons further suggests that without NFs, growing neurites expend more energy. These observations are all consistent with NFs providing a stable structural component that is built and maintained with little energy. Without this component, growing axons may compensate with other structural components such as MTs, which are more abundant both in transgenic mice lacking NFs and in arthropods, which have no NFs (Phillips et al., 1983). This in turn might retard elongation because these other components take time to accumulate within the axon. Alternatively, loss of NFs might result in more general deficiencies in mechanical stiffness of the cytoplasm, forcing growing axons to work harder.
Interestingly, normal short neurites also spent less of their duty cycles extending than long ones while also maintaining similar extension velocities. This observation is also consistent with NFs playing a role in enhancing the elongation of long axons, because inXenopus, very few neurites <50 μm long express NF-M during the first day of outgrowth (Undamatla and Szaro, 2001), and it suggests that expression of NF-M accompanies a transition to more efficient growth. In mammalian hippocampal neurons, axon outgrowth undergoes a transition from an early, slower phase to a later, more rapid phase (Banker and Dotti, 1987), and this transition coincides with the onset of NF-M expression (Benson et al., 1996). Thus, this transition probably involves reorganization of the cytoskeleton. Our studies in Xenopus suggest that NF-M, although not necessarily the trigger for this transition, nonetheless may provide an important component supporting it. A more detailed analysis of how the energetics of axon outgrowth and the reorganization of the cytoskeleton depend on NFs during this transition would be instructive.
Footnotes
This work was supported by National Institutes of Health Grant NS30682. We thank Christine Gervasi and Markus Mronz for technical help, Dr. Helmut Hirsch for helpful discussions on data analysis, and Drs. Helmut Hirsch, Suzannah Tieman, and John Schmidt for editorial advice on this manuscript. We also thank Drs. Gregory Lnenicka and Jeffrey Travis for their advice on mitochondrial vital staining and α-tubulin immunostaining, respectively.
Correspondence should be addressed to Ben G. Szaro, Department of Biological Sciences, University at Albany, State University of New York, 1400 Washington Avenue, Albany, NY 12222. E-mail:bgs86@cnsunix.albany.edu.
REFERENCES
- 1.Baas PW. Microtubules and axonal growth. Curr Opin Cell Biol. 1997;9:29–36. doi: 10.1016/s0955-0674(97)80148-2. [DOI] [PubMed] [Google Scholar]
- 2.Banker GA, Dotti CG. Experimentally induced alteration in the polarity of developing neurons. Nature. 1987;330:254–256. doi: 10.1038/330254a0. [DOI] [PubMed] [Google Scholar]
- 3.Beaulieu J-M, Jacomy H, Julien J-P. Formation of intermediate filament protein aggregates with disparate effects in two transgenic mouse models lacking the neurofilament light subunit. J Neurosci. 2000;20:5321–5328. doi: 10.1523/JNEUROSCI.20-14-05321.2000. [DOI] [PMC free article] [PubMed] [Google Scholar]
- 4.Benson DL, Mandell JW, Shaw G, Banker G. Compartmentation of alpha-internexin and neurofilament triplet proteins in cultured hippocampal neurons. J Neurocytol. 1996;25:181–196. doi: 10.1007/BF02284795. [DOI] [PubMed] [Google Scholar]
- 5.Carden MJ, Trojanowski JQ, Schlaepfer WW, Lee VMY. Two-stage expression of neurofilament polypeptides during rat neurogenesis with early establishment of adult phosphorylation patterns. J Neurosci. 1987;7:3489–3504. doi: 10.1523/JNEUROSCI.07-11-03489.1987. [DOI] [PMC free article] [PubMed] [Google Scholar]
- 6.Charnas LR, Szaro BG, Gainer H. Identification and developmental expression of a novel low molecular weight neuronal intermediate filament protein in Xenopus laevis. J Neurosci. 1992;12:3010–3024. doi: 10.1523/JNEUROSCI.12-08-03010.1992. [DOI] [PMC free article] [PubMed] [Google Scholar]
- 7.Chou Y-H, Helfand BT, Goldman RD. New horizons in cytoskeletal dynamics: transport of intermediate filaments along microtubule tracks. Curr Opin Cell Biol. 2001;13:106–109. doi: 10.1016/s0955-0674(00)00181-2. [DOI] [PubMed] [Google Scholar]
- 8.Chu DTW, Klymkowsky MW. Experimental analysis of cytoskeletal function in early Xenopus laevis embryos. First Int Symp Cytoskel Dev. 1987;8:140–142. [Google Scholar]
- 9.Collard J-F, Cote F, Julien J-P. Defective axonal transport in a transgenic mouse model of amyotrophic lateral sclerosis. Nature. 1995;375:61–64. doi: 10.1038/375061a0. [DOI] [PubMed] [Google Scholar]
- 10.Elder GA, Friedrich VL, Jr, Bosco P, Kang C, Giourov A, Tu P-H, Lee VMY, Lazzarini RA. Absence of the mid-sized neurofilament subunit decreases axonal calibers, levels of light neurofilament (NF-L) and neurofilament content. J Cell Biol. 1998a;141:727–739. doi: 10.1083/jcb.141.3.727. [DOI] [PMC free article] [PubMed] [Google Scholar]
- 11.Elder GA, Friedrich VL, Jr, Kang C, Bosco P, Gourov A, Tu P-H, Zhang B, Lee VMY, Lazzarini RA. Requirement of heavy neurofilament subunit in the development of axons with large calibers. J Cell Biol. 1998b;143:195–205. doi: 10.1083/jcb.143.1.195. [DOI] [PMC free article] [PubMed] [Google Scholar]
- 12.Eyer J, Peterson A. Neurofilament-deficient axons and perikaryal aggregates in viable transgenic mice expressing a neurofilament-beta-galactosidase fusion protein. Neuron. 1994;12:389–405. doi: 10.1016/0896-6273(94)90280-1. [DOI] [PubMed] [Google Scholar]
- 13.Eyer J, Cleveland DW, Wong PC, Peterson AC. Pathogenesis of two axonopathies does not require axonal neurofilaments. Nature. 1998;391:584–587. doi: 10.1038/35378. [DOI] [PubMed] [Google Scholar]
- 14.Fliegner KH, Kaplan MP, Wood TL, Pintar JE, Liem RKH. Expression of the gene for the neuronal intermediate filament protein alpha-internexin coincides with the onset of neuronal differentiation in the developing rat nervous system. J Comp Neurol. 1994;342:161–173. doi: 10.1002/cne.903420202. [DOI] [PubMed] [Google Scholar]
- 15.Fuchs E, Cleveland DW. A structural scaffolding of intermediate filaments in health and disease. Science. 1998;279:514–519. doi: 10.1126/science.279.5350.514. [DOI] [PubMed] [Google Scholar]
- 16.Gervasi C, Stewart C-B, Szaro BG. Xenopus laevis peripherin (XIF3) is expressed in radial glia and proliferating neural epithelial cells as well as in neurons. J Comp Neurol. 2000;423:512–531. [PubMed] [Google Scholar]
- 17.Glasgow E, Druger RK, Fuchs C, Lane WS, Schechter N. Molecular cloning of gefiltin (ON1): serial expression of two new neurofilament mRNAs during optic nerve regeneration. EMBO J. 1994;13:297–305. doi: 10.1002/j.1460-2075.1994.tb06262.x. [DOI] [PMC free article] [PubMed] [Google Scholar]
- 18.Goldstone K, Sharpe CR. The expression of Xif3 in undifferentiated anterior neuroectoderm, but not in primary neurons, is induced by the neuralizing agent noggin. Int J Dev Biol. 1998;42:757–762. [PubMed] [Google Scholar]
- 19.Gordon-Weeks PR. Neuronal growth cones. Cambridge UP; Cambridge, UK: 2000. [Google Scholar]
- 20.Gurland G, Gundersen GG. Stable, detyrosinated microtubules function to localize vimentin intermediate filaments in fibroblasts. J Cell Biol. 1995;131:1275–1290. doi: 10.1083/jcb.131.5.1275. [DOI] [PMC free article] [PubMed] [Google Scholar]
- 21.Harrington CC, Atwood HL. Satellite cells and nerve terminals in the crayfish opener muscle visualized with fluorescent dyes. J Comp Neurol. 1995;361:441–450. doi: 10.1002/cne.903610308. [DOI] [PubMed] [Google Scholar]
- 22.Hoperskaya OA. The development of animals homozygous for a mutation causing periodic albinism (ap) in Xenopus laevis. J Embryol Exp Morphol. 1975;34:253–264. [PubMed] [Google Scholar]
- 23.Jacobson M. Developmental neurobiology. Plenum; New York: 1991. Neuronal death and neurotrophic factors. pp. 311–358. [Google Scholar]
- 24.Jacomy H, Zhu Q, Beaulieu J-M, Julien J-P. Disruption of type IV intermediate filament network in mice lacking the neurofilament medium and heavy subunits. J Neurochem. 1999;73:972–984. doi: 10.1046/j.1471-4159.1999.0730972.x. [DOI] [PubMed] [Google Scholar]
- 25.Jiang XM, Zhao JX, Ohnishi A, Itakura C, Mizutani M, Yamamoto T, Murai Y, Ikeda M. Regeneration of myelinated fiber after crush injury is retarded in sciatic nerves of mutant Japanese quails deficient in neurofilaments. Acta Neuropathol (Berl) 1996;92:467–472. doi: 10.1007/s004010050548. [DOI] [PubMed] [Google Scholar]
- 26.Khawaja S, Gundersen GG, Bulinski JC. Enhanced stability of microtubules enriched in detyrosinated tubulin is not a direct function of detyrosination level. J Cell Biol. 1988;106:141–149. doi: 10.1083/jcb.106.1.141. [DOI] [PMC free article] [PubMed] [Google Scholar]
- 27.Kobayashi N, Mundel P. A role of microtubules during the formation of cell processes in neuronal and non-neuronal cells. Cell Tissue Res. 1998;291:163–174. doi: 10.1007/s004410050988. [DOI] [PubMed] [Google Scholar]
- 28.Leake D, Asch WS, Canger AK, Schechter N. Gefiltin in zebrafish embryos: sequential gene expression of two neurofilament proteins in retinal ganglion cells. Differentiation. 1999;65:181–189. doi: 10.1046/j.1432-0436.1999.6540181.x. [DOI] [PubMed] [Google Scholar]
- 29.Levavasseur F, Zhu Q, Julien J-P. No requirement of alpha-internexin for nervous system development and for radial growth of axons. Mol Brain Res. 1999;69:104–112. doi: 10.1016/s0169-328x(99)00104-7. [DOI] [PubMed] [Google Scholar]
- 30.Lin C-H, Thompson CA, Forscher P. Cytoskeletal reorganization underlying growth cone motility. Curr Opin Neurobiol. 1994;4:640–647. doi: 10.1016/0959-4388(94)90004-3. [DOI] [PubMed] [Google Scholar]
- 31.Lin W, Szaro BG. Maturation of neurites in mixed cultures of spinal cord neurons and muscle cells from Xenopus laevis embryos followed with antibodies to neurofilament proteins. J Neurobiol. 1994;25:1235–1248. doi: 10.1002/neu.480251006. [DOI] [PubMed] [Google Scholar]
- 32.Lin W, Szaro BG. Neurofilaments help maintain normal morphologies and support elongation of neurites in Xenopus laevis cultured embryonic spinal cord neurons. J Neurosci. 1995;15:8331–8344. doi: 10.1523/JNEUROSCI.15-12-08331.1995. [DOI] [PMC free article] [PubMed] [Google Scholar]
- 33.Lin W, Szaro BG. Effects of intermediate filament disruption on the early development of the peripheral nervous system of Xenopus laevis. Dev Biol. 1996;179:197–211. doi: 10.1006/dbio.1996.0251. [DOI] [PubMed] [Google Scholar]
- 34.Magrassi L, Purves D, Lichtman JW. Fluorescent probes that stain living nerve terminals. J Neurosci. 1987;7:1207–1214. doi: 10.1523/JNEUROSCI.07-04-01207.1987. [DOI] [PMC free article] [PubMed] [Google Scholar]
- 35.Mitchison T, Kirschner M. Cytoskeletal dynamics and nerve growth. Neuron. 1988;1:761–772. doi: 10.1016/0896-6273(88)90124-9. [DOI] [PubMed] [Google Scholar]
- 36.Nguyen PV, Marin L, Atwood HL. Synaptic physiology and mitochondrial function in crayfish tonic and phasic motor neurons. J Neurophysiol. 1997;78:281–294. doi: 10.1152/jn.1997.78.1.281. [DOI] [PubMed] [Google Scholar]
- 37.Nieuwkoop PD, Faber J. Normal table of Xenopus laevis (Daudin). Garland Publishing; New York: 1994. [Google Scholar]
- 38.Phillips L, Autilo-Gambetti L, Lasek RJ. Bodian's silver method reveals molecular variation in the evolution of neurofilament proteins. Brain Res. 1983;278:219–223. doi: 10.1016/0006-8993(83)90240-8. [DOI] [PubMed] [Google Scholar]
- 39.Prahlad V, Yoon M, Moir RD, Vale RD, Goldman RD. Rapid movements of vimentin on microtubule tracks: kinesin-dependent assembly of intermediate filament networks. J Cell Biol. 1998;143:159–170. doi: 10.1083/jcb.143.1.159. [DOI] [PMC free article] [PubMed] [Google Scholar]
- 40.Prahlad V, Helfand BT, Landford GM, Vale RD, Goldman RD. Fast transport of neurofilament protein along microtubules in squid axoplasm. J Cell Sci. 2000;113:3939–3945. doi: 10.1242/jcs.113.22.3939. [DOI] [PubMed] [Google Scholar]
- 41.Rao MV, Houseweart MK, Williamson TL, Crawford TO, Folmer J. Neurofilament-dependent radial growth of motor axons and axonal organization of neurofilaments does not require the neurofilament heavy subunit (NF-H) or its phosphorylation. J Cell Biol. 1998;143:171–181. doi: 10.1083/jcb.143.1.171. [DOI] [PMC free article] [PubMed] [Google Scholar]
- 42.Roy S, Coffee P, Smith G, Liem RKH, Brady ST, Black MM. Neurofilaments are transported rapidly but intermittently in axons: implications for slow axonal transport. J Neurosci. 2000;20:6849–6861. doi: 10.1523/JNEUROSCI.20-18-06849.2000. [DOI] [PMC free article] [PubMed] [Google Scholar]
- 43.Ruthel G, Hollenbeck PJ. Growth cones are not required for initial establishment of polarity or differential axon branch growth in cultured hippocampal neurons. J Neurosci. 2000;20:2266–2274. doi: 10.1523/JNEUROSCI.20-06-02266.2000. [DOI] [PMC free article] [PubMed] [Google Scholar]
- 44.Shaw G, Weber K. Differential expression of neurofilament triplet proteins in brain development. Nature. 1982;298:277–279. doi: 10.1038/298277a0. [DOI] [PMC free article] [PubMed] [Google Scholar]
- 45.Shea TB. Selective stabilization of microtubules within the proximal region of developing axonal neurites. Brain Res Bull. 2000;48:255–261. doi: 10.1016/s0361-9230(98)00019-7. [DOI] [PubMed] [Google Scholar]
- 46.Shea TB, Beermann ML. Neuronal intermediate filament protein alpha-internexin facilitates axonal neurite elongation in neuroblastoma cells. Cell Motil Cytoskeleton. 1999;43:322–333. doi: 10.1002/(SICI)1097-0169(1999)43:4<322::AID-CM5>3.0.CO;2-B. [DOI] [PubMed] [Google Scholar]
- 47.Sheetz MP, Wayne DB, Pearlman AL. Extension of filopodia by motor-dependent actin assembly. Cell Motil Cytoskeleton. 1992;22:160–169. doi: 10.1002/cm.970220303. [DOI] [PubMed] [Google Scholar]
- 48.Smith CL. The initiation of neurite outgrowth by sympathetic neurons grown in vitro does not depend on assembly of microtubules. J Cell Biol. 1994;127:1407–1418. doi: 10.1083/jcb.127.5.1407. [DOI] [PMC free article] [PubMed] [Google Scholar]
- 49.Smith SJ. Neuronal cytomechanics: the actin-based motility of growth cones. Science. 1988;883:708–715. doi: 10.1126/science.3055292. [DOI] [PubMed] [Google Scholar]
- 50.Szaro BG, Gainer H. Identities, antigenic determinants, and topographic distributions of neurofilament proteins in the nervous systems of adult frogs and tadpoles of Xenopus laevis. J Comp Neurol. 1988;273:344–358. doi: 10.1002/cne.902730306. [DOI] [PubMed] [Google Scholar]
- 51.Szaro BG, Lee VMY, Gainer H. Spatial and temporal expression of phosphorylated and non-phosphorylated forms of neurofilament proteins in the developing nervous system of Xenopus laevis. Dev Brain Res. 1989;48:87–103. doi: 10.1016/0165-3806(89)90095-3. [DOI] [PubMed] [Google Scholar]
- 52.Szaro BG, Grant P, Lee VMY, Gainer H. Inhibition of axonal development after injection of neurofilament antibodies into a Xenopus laevis embryo. J Comp Neurol. 1991;308:576–585. doi: 10.1002/cne.903080406. [DOI] [PubMed] [Google Scholar]
- 53.Tabti N, Poo M-M. Culturing spinal neurons and muscle cells from Xenopus embryos. In: Banker G, Goslin K, editors. Culturing nerve cells. MIT; Cambridge, MA: 1991. pp. 137–154. [Google Scholar]
- 54.Undamatla J, Szaro BG. Differential expression and localization of neuronal intermediate filament proteins within newly developing neurites in dissociated cultures of Xenopus laevis embryonic spinal cord. Cell Motil Cytoskeleton. 2001;49:16–32. doi: 10.1002/cm.1017. [DOI] [PubMed] [Google Scholar]
- 55.Wang L, Ho C-I, Sun D, Liem RKH, Brown A. Rapid movement of axonal neurofilaments interrupted by prolonged pauses. Nat Cell Biol. 2000;2:137–141. doi: 10.1038/35004008. [DOI] [PubMed] [Google Scholar]
- 56.Wang N, Stamenovic D. Contribution of intermediate filaments to cell stiffness, stiffening, and growth. Am J Physiol Cell Physiol. 2000;279:C188–C194. doi: 10.1152/ajpcell.2000.279.1.C188. [DOI] [PubMed] [Google Scholar]
- 57.Wylie SR, Wu P-J, Patel H, Chantler PD. A conventional myosin motor drives neurite outgrowth. Proc Natl Acad Sci USA. 1998;95:12967–12972. doi: 10.1073/pnas.95.22.12967. [DOI] [PMC free article] [PubMed] [Google Scholar]
- 58.Yabe JT, Aurea P, Shea TB. Kinesin-mediated transport of neurofilament protein oligomers in growing axons. J Cell Sci. 1999;112:3799–3814. doi: 10.1242/jcs.112.21.3799. [DOI] [PubMed] [Google Scholar]
- 59.Yabe JT, Chan WKH, Chylinski TM, Lee S, Pimenta AF, Shea TB. The predominant form in which neurofilament subunits undergo axonal transport varies during axonal initiation, elongation, and maturation. Cell Motil Cytoskeleton. 2001;48:61–83. doi: 10.1002/1097-0169(200101)48:1<61::AID-CM6>3.0.CO;2-S. [DOI] [PubMed] [Google Scholar]
- 60.Yamasaki H, Itakura C, Mizutani M. Hereditary hypotrophic axonopathy with neurofilament deficiency in a mutant strain of the Japanese quail. Acta Neuropathol. 1991;82:427–434. doi: 10.1007/BF00293376. [DOI] [PubMed] [Google Scholar]
- 61.Yamasaki H, Bennett GS, Itakura C, Mizutani M. Defective expression of neurofilament protein subunits in hereditary hypotrophic axonopathy of quail. Lab Invest. 1992;66:734–743. [PubMed] [Google Scholar]
- 62.Yoon M, Moir RD, Prahlad V, Goldman RD. Motile properties of vimentin intermediate filament networks in living cells. J Cell Biol. 1998;143:147–157. doi: 10.1083/jcb.143.1.147. [DOI] [PMC free article] [PubMed] [Google Scholar]
- 63.Yu W, Schwei MJ, Baas PW. Microtubule transport and assembly during axon growth. J Cell Biol. 1996;133:151–157. doi: 10.1083/jcb.133.1.151. [DOI] [PMC free article] [PubMed] [Google Scholar]
- 64.Zhao JX, Ohnishi A, Itakura C, Mizutani M, Yamamoto THH, Murai Y. Greater number of microtubules per axon of unmyelinated fibers of mutant quails deficient in neurofilaments: possible compensation for the absence of neurofilaments. Acta Neuropathol (Berl) 1994;87:332–336. doi: 10.1007/BF00313600. [DOI] [PubMed] [Google Scholar]
- 65.Zhao Y, Szaro BG. Xefiltin, a Xenopus laevis neuronal intermediate filament protein, is expressed in actively growing optic axons during development and regeneration. J Neurobiol. 1997;33:811–824. [PubMed] [Google Scholar]
- 66.Zhu Q, Couillard-Despres S, Julien J-P. Delayed maturation of regenerating myelinated axons in mice lacking neurofilaments. Exp Neurol. 1997;148:299–316. doi: 10.1006/exnr.1997.6654. [DOI] [PubMed] [Google Scholar]
- 67.Zhu Q, Lindenbaum M, Levavasseur F, Jacomy H, Julien J-P. Disruption of the NF-H gene increases axonal microtubule content and velocity of neurofilament transport: relief of axonopathy resulting from the toxin b,b′-iminodipropionitrile. J Cell Biol. 1998;143:183–193. doi: 10.1083/jcb.143.1.183. [DOI] [PMC free article] [PubMed] [Google Scholar]