

Abstract
We examined cell-surface behavior at nerve–muscle contacts during synaptogenesis in cocultures of rat ventral spinal cord (VSC) neurons and myotubes. Developing synapses in 1-d-old cocultures were identified by the presence of axon-induced acetylcholine receptor (AChR) aggregation. Identified regions were then examined by transmission and scanning electron microscopy. The myotube surface near contacts with axons that induced AChR aggregation typically displayed ruffles, microvilli, and filopodia (microprocesses), indicating motility of the myotube surface. At some of these contact sites microprocesses were wrapped around the axon, resulting in the partial or total “submersion” of the axon within the myotube contours. Sites of myotube contact with somata and dendrites of the same neurons showed much less evidence of motility and surface interaction than sites of contact with axons. Moreover, the distance between opposed membranes of axons and myotubes was smaller than between dendrites or somata and myotubes, suggesting stronger adhesion of axons. These results suggest polarized expression of molecules involved in the induction of microprocess formation and adhesion in developing VSC neurons. We therefore tested the ability of agrin, which is preferentially secreted by axons, to induce microprocess formation in myotubes. Addition of recombinant C-terminal agrin to culture medium resulted in formation of microprocesses within 3 hr. Myotubes transfected with full-length rat agrin constructs displayed numerous filopodia, as revealed by fluorescence microscopy. The results suggest that the induction of muscle cell surface motility may be linked to the signaling processes that trigger the initial formation of the neuromuscular junction.
Keywords: neuromuscular junction, synapse formation, acetylcholine receptor, cell adhesion, cell motility, neuronal polarity
Neuromuscular junction (NMJ) formation has been widely studied as a model for synaptogenesis. During this process, nerve and muscle cells exchange signals to induce the assembly of efficient machinery for synaptic transmission. This includes presynaptic active zones with clustered synaptic vesicles and a postsynaptic membrane specialization containing a high concentration of acetylcholine receptors (AChRs) (for review, see Hall and Sanes, 1993; Grinnell, 1995; Daniels, 1997; Sanes and Lichtman, 1999).
Molecules and mechanisms involved in the induction of synaptic differentiation have been identified through the use of nerve–muscle culture systems, especially those using Xenopus and chick cells, as well as through in vivo studies (Hall and Sanes, 1993; Fischbach et al., 1994; Kleiman and Reichardt, 1996; Sanes and Lichtman, 1999). Most notably, agrin (McMahan, 1990) has been identified as a critical molecule by which the motor neuron induces postsynaptic differentiation (Gautam et al., 1995; Burgess et al., 1999). We developed a mammalian coculture system in which ventral spinal cord (VSC) neurons are added to cultures containing extensive myotubes and few nonmuscle cells. This system is especially useful for the study of early mammalian NMJ formation because axons of VSC neurons rapidly induce aggregation of AChRs along the sites of contact with the myotubes, and these aggregation sites have molecular and structural specializations similar to those of the developing NMJin vivo (Dutton et al., 1995; Daniels et al., 2000). The culture system was used to demonstrate that the induction of AChR aggregation is specific to axons, as opposed to dendrites. This result suggested that one or more molecules involved in synaptogenesis are selectively targeted to the surface of motor axons or selectively secreted there (Dutton et al., 1995). In addition, it suggested that morphological aspects of neuron–myotube surface interactions might show a similar polarity, even before detectable postsynaptic differentiation.
Our initial electron microscopic observations on sites of neurite-induced AChR aggregation (Dutton et al., 1995) suggested an adhesive interaction between axons and the myotube surface that results in a partial “engulfment” of the axon. In the present study we further characterized the VSC neuron–muscle contact after 1 d in culture by scanning electron microscopy (SCEM) and transmission electron microscopy (TEM). We found that muscle cell surfaces adjacent to axons of neurons that induce AChR aggregation develop prominent microvilli, filopodia, and ruffles (microprocesses) indicative of motile activity and that many of these microprocesses closely contact the axon. This activity was evoked at much lower levels by dendrites and cell bodies of the same neurons. Agrin is preferentially secreted by the axons of motor neurons (Ma et al., 2000) and targeted to the axons of other central neurons (Escher et al., 1996; Ferreira, 1999). We found that treatment with recombinant agrin, either by addition to the medium or by transfection of the myotubes, induced the formation of microprocesses similarly to axon contact. Our results taken together suggest the coupling of this muscle cell-surface response to the signaling involved in synaptogenesis.
MATERIALS AND METHODS
Cell culture. Rat muscle cell cultures were prepared essentially as described (Daniels, 1990; Dutton et al., 1995) with the indicated modifications (Daniels et al., 2000). The myoblasts were selectively detached (∼48 hr after plating) from the culture dishes by incubation with a neutral protease (Dispase, Grade II; Boehringer Mannheim, Indianapolis, IN) at 0.025% in Dulbecco's PBS (DPBS), and collected (first harvest). To get cultures with even fewer fibroblasts, we further modified the collection procedure. After the first harvest, the cultures were incubated in fresh culture medium for 30 min to allow partially detached fibroblasts to reattach to the culture plates. Loosely attached and newly detached myoblasts were then dislodged from the surface by gentle tapping of the dishes, and collected (second harvest). The yield of cells was generally higher from the second harvest than the first. Cells from the second harvest or from a 1:1 mixture of the first and second harvest were plated at a density of 3.75–5 × 10⁴ cells per 13 mm glass coverslip coated with carbon and gelatin. Two days after plating, the cells were fed with DMEM, 10% horse serum (HS), 1.5 μm tetrodotoxin (TTX; to inhibit myotube contraction), penicillin–streptomycin (P–S; 100 U/100 μg/ml), fungizone (2.5 μg/ml), and 10 μm cytosine arabinoside (to kill dividing cells). Muscle cell cultures used to test the effects of transfection with agrin–GFP constructs and some of the cultures used for electron microscopy were prepared similarly, except that the enrichment of myoblasts was done according to “method 3” as described (Daniels et al., 2000), and the myoblasts were plated at 5 × 10⁵ per 35 mm dish containing three carbon and gelatin-coated coverslips.
Ventral spinal cord (VSC) neurons used in this study were obtained from embryonic day 16 (E16) rat fetuses as described (Walton et al., 1993; Dutton et al., 1995). Neurons were plated on the muscle cell cultures 24–48 hr after myoblast plating. The number of neurons per coverslip was adjusted to 2000–20,000 (usually 2000–5000) to have isolated neurons in contact with myotubes and minimal fasciculation of neurites. After incubation for 2–3 hr to allow for adhesion of neurons, 1.5 ml of culture medium consisting of 95% Eagle's Minimum Essential Medium (Life Technologies, Rockville MD), 5% HS supplemented with TTX, P–S, and fungizone as above, was added to the dishes.
AChR labeling and observation of living and fixed cultures.AChRs were labeled as described previously (Dutton et al., 1995), by incubating cultures with 5 × 10⁻⁸m tetramethylrhodamine-conjugated α-bungarotoxin (TRITC-BTX; Molecular Probes, Eugene, OR), for 1 hr at 37°C before observation. Labeled cultures were loaded into temporary chambers and were examined in the living state with a Zeiss Axioplan microscope. The microscope was equipped for fluorescence and phase-contrast microscopy with a 100 W mercury arc lamp, narrow-band filter sets, and 63× Plan-Apochromat (N.A. 1.40) and 40× Plan-Neofluor (N.A. 1.30) phase-contrast objective lenses (Carl Zeiss Inc., Thornwood, NY). Areas where induced AChR aggregates were associated with single neurons were located with a Venus low-light video camera (Carl Zeiss Inc.) and high-resolution images were obtained with a Hamamatsu C4880 cooled CCD camera (Hamamatsu Photonic Systems, Bridgewater, NJ). These observations were made with incident illumination reduced to 0.18% of maximum by neutral density filters, to prevent damage to the cells before fixation for electron microscopy. An additional series of cocultures to be prepared for SCEM and TEM were “prefixed” after labeling with TRITC–BTX and before observation. This facilitated the collection of identified neuron–myotube pairs for further fixation and ultrastructural examination. Prefixation was for 30 min in 4% paraformaldehyde, 4% sucrose, and 0.1m sodium phosphate buffer, pH 7.2. Fixative was prewarmed to 37°C, and the cultures were allowed to approach room temperature during fixation. These cultures were observed at routine levels of incident illumination, and the images were acquired with a Hamamatsu C4742–95 digital camera (Hamamatsu Photonic Systems)
Soluble agrin treatment. Recombinant C-terminal rat agrin4,8 (Ferns et al., 1993; subscripts refer to Y and Z site inserts) was prepared from conditioned medium of COS-7 cells transfected with agrin constructs according toForsayeth and Garcia (1994). The construct, containing the C-terminal base pairs 4069–7288 of rat agrin with His and Flag tags near the 5′ end, was generously provided by Dr. C. Sigal (National Institute of Mental Health, Bethesda, MD). Agrin was purified from conditioned medium by use of Talon IMAC resin (Clontech, Palo Alto, CA) according to the procedures recommended by Clontech. A Western blot of the purified agrin using a Flag antibody showed a single band at ∼100 kDa, as expected for this construct. To assay the AChR aggregating activity of the preparation, myotube cultures were exposed to dilutions of purified agrin from 1:100–1:10,000 for 24–48 hr, after which the AChRs were labeled with TRITC–BTX (see above), fixed, and examined with the 63× objective. The number of AChR aggregates at least 10 μm in longest dimension was counted in equivalent areas of duplicate coverslips for each dilution and control. AChR aggregation activity was maximal at a dilution of 1:1000 and approximately half-maximal at 1:5000. Additional C-terminal rat agrin4,8 and C-terminal rat agrin0,0 were generously provided by Dr. Sheridan Swope (Georgetown University Medical School, Washington, DC). These agrin preparations were in the form of conditioned medium from transfected COS-7 cells. Both conditioned media contained 10 nm agrin. Recombinant human epidermal growth factor (EGF) was obtained from BioSource International(Camarillo, CA) and was used at 2 ng/ml. Recombinant proteins were added to the cultures in serum-free DMEM 4 d after plating myoblasts, at which time myotubes were well formed.
After preparation for SCEM (see below), myotubes were assayed for microprocess formation as follows. For each datum, 7–12 myotubes of rather uniform width (6–14 μm) were selected at 240× magnification (at which microprocesses are not visible), and a segment near the center was photographed at 5000×. The ends of myotubes and broad, branching myotubes were avoided because these tended to have more microprocesses, especially large ruffles, in untreated cultures. Micrographs were scored for the abundance of microprocesses on an arbitrary scale of 0–4 (see Results). Each micrograph was scored independently by three observers who were unaware of the experimental treatments. If two observers gave the same score, that was recorded, if not, the median score was recorded. A large set of micrographs that had been scored in this manner was subjected to point-counting estimation (Ahere and Dunnill, 1982) of the proportion of the myotube surface covered by microprocesses. The scores of 0–4 corresponded, respectively, to 4, 8, 17, 24, and 35% of the myotube surface covered by microprocesses. The abundance of microprocesses on myotube surfaces in cocultures and control (aneural) cultures was evaluated by the same 0–4 scoring method.
Transfection with rat agrin–GFP constructs. The plasmids used for transfection of myoblasts in this study were designated agrin4,19, agrin4,19–GFPemd, agrin4,0-GFPemd, and GFPemd. Agrin4,19 and agrin4,0 in pCMV (Ferns et al., 1992) and GFPemd-N1 [F] (Packard Instruments Co., Meridan, CT) were used to create the agrin-GFPemd C-terminal fusion proteins. Agrin4,19-GFPemd was constructed by attaching GFPemd to the 3′ end of agrin4,19through a linker (CATCCG) using PCR. All regions containing PCR amplified products were verified by sequence analysis. Agrin4,0-GFPemd was constructed by replacing the agrin4,0 C terminus (C-terminal portion adjacent to the Z site) with the corresponding C-terminal part of agrin4,19-GFPemd.
Myoblasts were transfected 5 hr after plating, using the liposomal reagent FuGENE 6 (Roche, Indianapolis, IN). For each 35 mm dish, 3 μg of purified DNA (CONCERT High Purity Maxiprep: Life Technologies, Rockville, MD) and 9 μl of Fugene 6 in 90% DMEM, 10% HS, 10% fetal calf serum, and P-S and fungizone were added according to the manufacturer's instructions. After 12 hr, the transfection mixture was replaced with culture medium (see above). Cultures were processed for fluorescence microscopy or immunocytochemistry 3–4 d after transfection.
Muscle cultures were fixed with paraformaldehyde as described for cocultures. For immunofluorescence, cultures were then washed, permeabilized, blocked, and labeled with antibodies essentially as described (Dutton et al., 1995), except that permeabilization and blocking were combined in a single incubation without glycine. The primary antibody was an antiserum to GFP (Molecular Probes, Eugene, OR) diluted 1:5000.
Electron microscopy. Cells in cocultures to be examined by electron microscopy were selected according to the two following criteria: (1) the axon, soma, and dendrites of the neuron could be identified with phase-contrast microscopy and were in contact with the top surface or sides of a myotube (thus accessible for SCEM); (2) no nearby neurons showed evidence of direct contact or fasciculation with the neurites in question. Neurons were first identified by phase-contrast microscopy, and the presence or absence of associated induced AChR aggregates was determined. Digital images serving to map identified areas were acquired with MetaMorph (Universal Imaging Corporation, West Chester, PA) or HiPic (Hamamatsu Photonic Systems) software, and the areas were marked on the back of the coverslip with a Leitz diamond marker “objective” (Bunton Instrument Co., Rockville, MD). For TEM, cultures were fixed in 2.5% glutaraldehyde, 0.08% tannic acid, and 0.1 m sucrose in 0.12m sodium cacodylate buffer, pH 7.4, for 1 hr (the initial 15 min of fixation was without tannic acid). The additional series of cultures that was prefixed in paraformaldehyde before observation was fixed in 2.5% glutaraldehyde in 0.12m sodium cacodylate buffer, pH 7.4, for 1 hr. The cultures were post-fixed in OsO4,en bloc-stained with uranyl acetate, and further processed as described (Olek et al., 1986; Dutton et al., 1995). Marked regions were relocated in the embeddings and were sectioned transverse to the course of the neurites. Thin sections were stained with uranyl acetate and lead citrate.
For SCEM, cultures were fixed with 2.5% glutaraldehyde in 0.12m sodium cacodylate buffer for 30 min at room temperature, post-fixed with 1% OsO4 for 30 min on ice, dehydrated with an ethanol series, and air-dried after immersing the cultures in hexamethyldisilazane twice for 15 min. The cultures were sputter coated with gold before SCEM observation.
For in vivo observations of developing intercostal muscles, the thoracic body walls of E14–E17 rat fetuses were fixed in 2.5% glutaraldehyde, 0.12 m sodium cacodylate buffer, pH 7.4, at 4°C. After 1 hr fixation, the rib cages were further isolated and left in fixative overnight, then post-fixed in 1% OsO4, en bloc-stained, and embedded in Epon by standard procedures. Sections were cut transverse to the developing ribs and post-stained with uranyl acetate and lead citrate.
Measurement of intercellular distance. Transmission electron micrographs taken from samples with induced AChR aggregation were randomly selected and enlarged to final magnifications of 26,000 or 62,000×. Points of direct opposition between neurons and myotubes were marked at regular intervals over the span beginning where the two membranes converged to be parallel and ending where they finally diverged. The distances between the opposed membranes were measured at these marked sites. Sets of micrographs (6–18 in each set) from four neuron–myotube pairs were extensively examined. In two sets the growth cone, axon, dendritic stump, soma, and dendrite were all observed. In total, four axons, four somata, three dendrites, two dendritic stumps, and two growth cones were observed. At least 200 measurements were taken from each type of contact.
RESULTS
Morphology of VSC neurons associated with nerve-induced AChR aggregates
Most VSC neurons which had nerve-induced AChR aggregates along an axon were bipolar in shape. The cell bodies were typically oval with dendrites on both ends, the axons most often arising from one of the dendrites (dendritic stump). Dendrites were thicker, shorter, and more tapered than axons, and often branched, whereas axons were thinner, more uniform in diameter, and longer than dendrites (Figs.1-3). These observations were consistent with the immunocytochemical identification and morphology of axons and dendrites in low-density cocultures reported previously (Dutton et al., 1995). TEM showed abundant microtubules and some elements of the smooth endoplasmic reticulum and clear vesicles in the axons. Abundant polyribosomes were found in the cell body, dendrites, and dendritic stumps, but not in axons (Figs. 3, 4). This further supported the identification of these processes as axons or dendrites. The dendritic stump from which an axon arose had a core of microtubules similar to axons (Fig. 4A), unlike the other dendrites. Some axon segments displayed varicosities or filopodia-like projections (Fig. 3A) similar to those described by other investigators (Shimada and Fischman, 1975; Frank and Fischbach, 1979;Role et al., 1987).
Fig. 1.

Myotube surface structure at a site of contact with a neuron that induced AChR aggregation in a 24 hr coculture. (A) Phase contrast image of the neuron-muscle contact. (B) Distribution of AChRs in the same field shown by labeling with TRITC-BTX. (C–E) Scanning electron microscopic images from the same area. The areas shown in the SCEM images are marked with brackets in (A). E is an image of the area shown in (D) taken at a tilt angle of 60°. A bipolar neuron with denritic processes at both ends of the soma is sitting on top of a slender myotube. An axon arises from one of the dendrites (the dendritic stump, arrow in A) at a point near another neuronal soma that has not extended neurites (n). Induced AChR aggregation is located along a segment of the axon (B, segment bracketed on theright in A). The bright fluorescence near the dendrite probably indicates a spontaneously formed aggregate on the bottom and edge of the myotube. The contours of the dendrite and its growth cone (g), as well as the soma, are distinct from the myotube surface, which is relatively smooth in this area (C). In contrast, the myotube surface around the axon (D) contains abundant wave-like ruffles (large arrows), finger-like microvilli (small arrows and inset) and longitudinally extended folds (between arrowheads in D), some of which contact or even cover (left-hand end of D andE) parts of the axon. The relationship between the axon and the muscle folds and microvilli (small arrows) is clearest in the image obtained by tilting the specimen (E). Segments of the axon that are clearly exposed above the myotube surface are indicated by small arrowheads in E. Scale bars: A,B, 10 μm; C–E, 5 μm. Magnification of theinset is twice that of C–E.
Fig. 3.
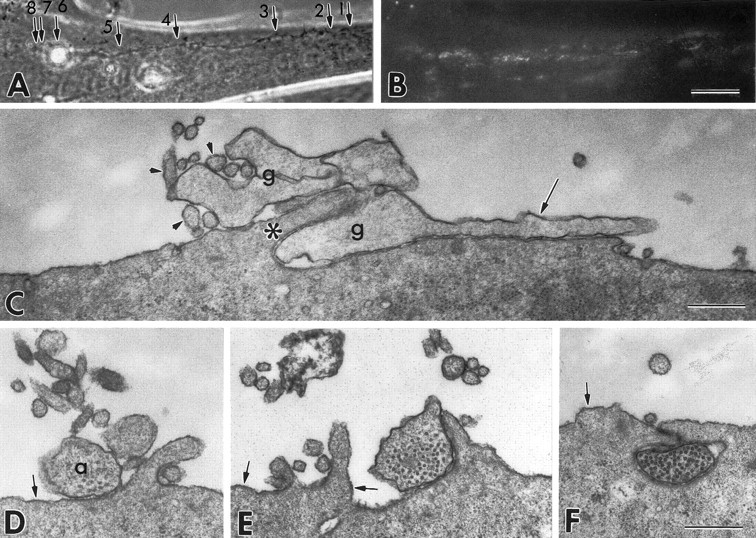
Interactions between a myotube and different regions of an axon that induced AChR aggregation in a 24 hr coculture. A, Phase contrast image of the neuron–muscle contact. B, Distribution of AChRs labeled with TRITC-BTX in the same field. C–F, Transmission electron micrographs taken at sites 1–4, respectively (small arrows in A). AChRs have formed microaggregates along the course of the axon, suggesting an early stage of nerve-induced AChR aggregation. At the most distal (arrow 1 in A) contact site shown (C), the growth cone (g) shows an intimate relationship with the myotube surface, with intercellular distances frequently <10 nm (Fig. 5). A filopodium (long arrow) is in close contact with the myotube surface, whereas elements resembling lamellipodia are interwoven with myotube microvilli (small arrowheads) and a fold in the myotube surface (asterisk). At a site proximal to the growth cone (D) and at a more proximal site (E), the axon (a) is located above the level of the myotube surface but is contacted or partially surrounded by microprocesses of the myotube. Small mounds in the myotube surface with a thickened sarcolemma, typical of an early stage of AChR aggregation, are seen (small arrows inD–F). Frequently, in the proximal portion, the axon profile is located below the level of the myotube surface in a groove or tunnel formed by the muscle surface processes (F) and the myotube surface may show a decreased number of microvilli. Scale bars: A, B, 20 μm; C–F, 0.5 μm.
Fig. 4.
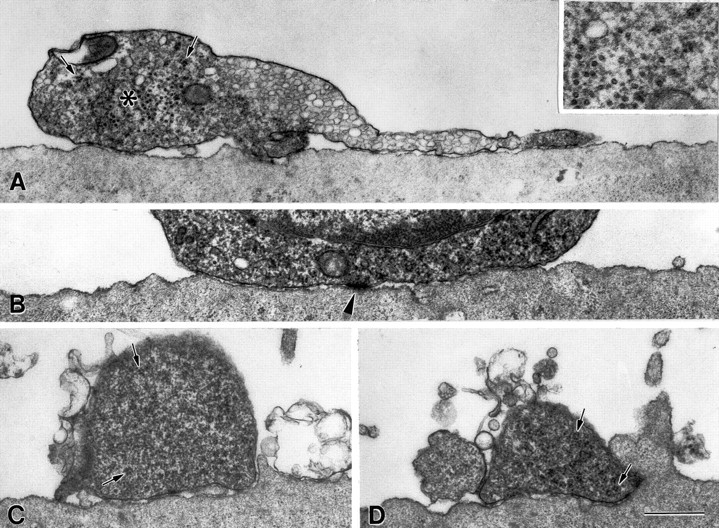
Interactions of the same myotube shown in Figure 3with the dendritic stump, soma, and dendrite of the neuron that induced AChR aggregation. The approximate locations of the sections shown inA–D are indicated by small arrows 5–8, respectively in Figure 3A. A dendritic stump (A), containing polyribosomes (examples indicated by short arrows in A, C, andD, inset in A) and a central core rich in microtubules (asterisk, inset in A) sits on top of the myotube surface and extends a process resembling those of growth cones. The neuronal soma (B) and dendrite (C, D) also sit on or above the myotube surface and, as with the dendritic stump there are relatively few microprocesses on the adjacent myotube surface. The abundance of microprocesses shown in D was the most observed in sections of the dendritic stump, dendrite or soma. A structure resembling a puncta adherens junction can be seen in B(arrowhead). The process to the left of the dendrite in (D) is a dendritic branch. Scale bars, 0.5 μm.Inset magnification is twice that of the other panels.
Structure of VSC neuron-induced AChR aggregates in 24 hr cocultures
In 24 hr cocultures, the most frequently observed form of the VSC neuron-induced AChR aggregates consisted of scattered microaggregates along the course of axons (Fig. 3B), consistent with an early stage of aggregation. Induced AChR aggregates with characteristic dense swaths of elevated AChR density adjacent to the axons were less frequently observed than in 48 hr cocultures (Dutton et al., 1995). The sarcolemmal and submembrane specializations seen by TEM in the neurite-induced AChR aggregates of 48 hr were rarely observed at these younger contacts. Instead, there were small convex mounds with a slightly thickened sarcolemma similar to the “microaggregates”, previously described as an early form of AChR aggregation (Fig.3D–F) (Steinbach, 1981; Olek et al., 1983,1986).
Preferential formation of microprocesses on myotube surfaces adjacent to contacts with axons that induce AChR aggregation
The surface morphology of myotubes in cocultures and aneural muscle cultures as seen by SCEM was evaluated both qualitatively and quantitatively. Quantitative evaluation was done by scoring the abundance of microprocesses on a scale of 0–4 as described in Materials and Methods (see also Fig. 6). Table1 summarizes the quantitative results for innervated myotubes in cocultures. Regions of contact between myotubes and VSC neurons that induced AChR aggregation within 24 hr displayed many microprocesses on the myotube surface near the contacting axons; the mean score of 18 such contact regions was 2.03 ± 0.24. The microprocesses we observed included wave-like ruffles and folds, finger-like microvilli ∼0.2 μm in diameter and up to a few micrometers in length, and filopodia that have a similar diameter to microvilli but are longer (Fig. 1D,E, Table 1). To determine whether the formation of microprocesses represented a response to neuronal contact we also examined myotubes not contacted by VSC neurons. The surfaces of myotubes in cultures without neurons were smooth compared with innervated myotubes; the mean score for 28 myotubes was 0.75 ± 0.20 (Fig. 2A). In cocultures, myotubes whose surfaces were free of VSC neurons or their processes were also smooth compared with innervated myotubes (Fig. 2B); the mean score for 12 of these myotubes was 1.33 ± 0.27. In addition, the mean score for 17 regions of myotubes beginning ∼10 μm from aggregation-inducing neuronal contacts was only 0.35 ± 0.12 (Table 1). These observations together suggest that the formation of microprocesses near axonal contacts was induced by the axons.
Fig. 6.

Examples of the extent of microprocess formation observed by SCEM on myotubes treated by the addition of recombinant C-terminal agrin, recombinant EGF, or no addition to serum-free culture medium. A, No addition. B, C-terminal agrin4,8 for 3 hr. C, C-terminal agrin4,8 for 6 hr. D, EGF for 12 hr. The myotubes shown in A–D were given scores of 1, 2, 3 and 1, respectively on a scale of 0–4. Scale bar, 5 μm.
Table 1.
Microprocesses on innervated myotubes
| Induced AChR aggregation | Axon | Soma | Dendrite | Distant regions |
|---|---|---|---|---|
| Yes (n = 18) | 2.03 ± 0.24* | 0.28 ± 0.11 | 0.47 ± 0.20 | 0.35 ± 0.12 |
| No (n = 18) | 1.03 ± 0.28* | 0.28 ± 0.15 | 0.72 ± 0.24 | 0.29 ± 0.18 |
The abundance of microprocesses on the surface of myotubes near contacts with VSC neurons was assayed on a scale of 0–4 (see Materials and Methods, Fig. 6). For each of 36 neurons, areas near the axon, soma, and dendrite were scored. Values represent the mean ± SE. Regions beginning ∼10 μm distant from the neuronal contact were scored for 18 of the AChR aggregation inducing contacts and seven of the contacts without aggregation.
These values were significantly different from one another (p < 0.02).
Fig. 2.

Myotube surface structure in areas not associated with nerve-induced AChR aggregation. The surfaces of myotubes in muscle cultures without VSC neurons (A) and cocultured myotubes that were not contacted by neurons (B) show few, if any microprocesses (arrows). A myotube surface contacted by a neuron that did not induce AChR aggregation (C) is similarly smooth, except for adherent pieces of cellular debris (arrowheads) that were formed from dividing cells killed by cytosine arabinoside. Scale bars, 5 μm.
To determine whether microprocess formation was induced preferentially by VSC neurons that induced AChR aggregation, we examined surface morphology in areas contacted by neurons that had not induced AChR aggregates (Fig. 2C, Table 1). Only 7 of 18 (38%) of these contacts showed many microprocesses, and the mean score was 1.03 ± 0.28. In contrast, 15 of 18 (83%) of the myotube surfaces contacted by neurons that had induced AChR aggregates along their axons showed many microprocesses, and the mean score was 2.03 ± 0.24 (as described above). The mean scores for aggregation-inducing and noninducing axon contacts were significantly different (Student'st test; p < 0.02). Because the frequency of AChR aggregation along axons increases markedly between 24 and 48 hr (Dutton et al., 1995), it is possible that some of the axons without AChR aggregates would have induced AChR aggregation later. Thus, our results may underestimate the correlation between the induction of AChR aggregation and the formation of microprocesses near axons.
We previously reported that the induction of AChR aggregation is a specific property of the axons of VSC neurons (Dutton et al., 1995). To further investigate the polarization of interactions between neurons and myotubes, we compared the structural interactions between different parts of identified neurons with muscle cells. Myotube surfaces near sites of contact with VSC axons that induced AChR aggregates showed many microprocesses in 83% of nerve–muscle pairs (above). In contrast, areas contacting soma and dendrites of the same neurons showed few microprocesses. The mean scores for 18 regions contacted by soma and dendrites were only 0.28 ± 0.11 and 0.47 ± 0.20, respectively, and these were significantly different (Student'st test) from scores at axonal contact regions (p < 0.001) (Figs. 1, 3, 4, Table 1). Only four of these nerve–muscle pairs (22%) had scores >1 along the dendrites. These results suggest that one or more molecular signals for the induction of motile activity of the myotube surface is expressed predominantly by axons.
Myotube interactions with the axonal growth cone in AChR aggregate-inducing axons
To investigate the earliest interactions between growing axons and the myotube surface, we examined the regions of contact with axon growth cones of VSC neurons that induced AChR aggregation. Generally, axon-induced AChR aggregation observed after 1 d of coculture occurred proximal to the growth cone (Fig. 3A,B). Therefore, AChR aggregation at a given site probably occurred subsequent to contact with the growth cone.
The growth cones of two AChR aggregate-inducing axons observed by phase contrast and TEM both showed close interactions with the muscle cell surface (Fig. 3C; see also Fig. 5 below). In one of the two, the growth cone was composed of a narrow lamellipodium and several filopodia, which were covered or intermingled with myotube microvilli. In contrast, a growth cone-like structure extending from the dendritic stump of the same neuron rested on top of the myotube surface and was not extensively associated with microvilli or other microprocesses of the myotube (Fig. 4A). In the second example (data not shown), a broad axonal growth cone was closely adherent to the myotube surface, and microprocesses of the myotube surface were found within 1 μm of the growth cone in 81% of the sections examined. Extensive coverage of a growth cone by microprocesses of the myotube such as seen in Figure 3C would probably prevent identification of the growth cone by SCEM. In 13 of the 18 axons observed by SCEM that induced AChR aggregation, the growth cone was not identified. It is likely that these growth cones were covered by myotube processes. The other five axonal growth cones were not “submerged” in the myotube surface. One of these growth cones was contacted and partially overlapped by microprocesses of the myotube surface (data not shown). The wide variation in the extent of microprocess formation around axonal growth cones may reflect the rate of forward movement of the growth cones at the time of fixation and the time required for microprocess formation by the myotube. In contrast to axonal growth cones, the three dendritic growth cones seen by SCEM had wide lamellipodia and sparse filopodial projections that rested on or above the myotube surface and were seldom associated with microprocesses on the myotube surface (Fig. 1C). The dendritic termini of the other 15 neurons examined consisted of blunt ends rather than growth cones. The myotube surfaces near these termini were evaluated as part of the dendrite contact region (described above). The observation of microprocess formation on the myotube surface at the site of axonal growth cone contact suggests that the response can occur very shortly after initial contact, and before the accumulation of AChR.
Fig. 5.

Frequency of intercellular distances at sites of opposition between myotubes and different parts of VSC neurons that had induced AChR aggregation. The distance between opposed neuron and myotube membranes was measured in enlargements of transmission electron micrographs such as the ones shown in Figures 3 and 4 (see Materials and Methods). The first bar on the left of each graph represents the percentage of all measurements <10 nm.
Axons have closer interactions with myotubes than dendrites and somata
The degree of adhesion between cell surfaces may be reflected in the proximity between opposing membranes. TEM observations suggested that membranes of axons and axonal growth cones were generally in closer proximity to the opposed myotube membranes than were membranes of dendrites and somata (Fig. 4). Measurements of the distances between the opposed myotube membrane and membranes of different neuronal parts revealed that axons and myotube membranes were significantly closer together than dendrites and somata. The frequency distributions of intercellular distances for axons and growth cones were skewed to the shorter distances relative to dendritic stumps, dendrites and somata (Fig. 5). The mean intercellular distances were (nm ± SE, with (n) = number of neuron-myotube contacts assayed): 21.0 ± 0.4 (2) for axon growth cones, 18.8 ± 0.8(4) for axons, 33.8 ± 8.9(2) for dendritic stumps, 28.5 ± 1.2(4) for somata, and 29.6 ± 3.2(3) for dendrites. The mean distance for the axons was significantly different from those of the dendrites and somata (Student's t test,p < 0.05 and p < 0.01, respectively). We also compared the intercellular distances of the different kinds of contacts using the pooled measurements from all the assayed cells. By this analysis, the median intercellular distances for the axonal growth cone and axons were significantly different from those of dendritic stumps, somata and dendrites (p < 0.001, Mann–Whitney rank sum test). In addition to the differences in mean intercellular distance, a striking difference was observed in the proportion of intermembrane distance measurements <10 nm: 37.1% for the axon growth cone, 44.0% for axons, 27.7% for dendritic stumps, 19.8% for somata, and 22.6% for dendrites (Fig. 5). These results together indicate that axons of VSC neurons that induced AChR aggregation had a greater area of close contact with myotubes than did dendrites and somata and thus may adhere more tightly to myotubes.
SCEM observations of 13 VSC neurons that induced AChR aggregation revealed that myotube processes had grown to cover a substantial portion of the axons of 11 neurons (Fig. 1D,E). Overall, 22.3 ± 2.1% of the length of aggregation-inducing axons were covered by myotube processes such that one or both sides of the axon could not be seen. In 7 of 11 axons that showed submersion, it was more pronounced in the halves of the axons closer to the cell body (41.6 ± 5.6% covered) than in the distal halves (19.8 ± 1.7% covered). In addition, submersion was most apparent in axon segments with adjacent AChR aggregates (Fig. 1D,E), 47.8 ± 5.8% of these segments being submerged. These results suggest that adhesive cell membrane interactions correlated with the induction of AChR aggregation may result in progressive submersion of axons by myotube processes. As illustrated in Figure 3D-F, this phenomenon was also revealed by TEM observations of 4 VSC neurons that induced AChR aggregation. The TEM observations revealed close contact between myotube processes and axons, emphasizing the possible role of cell-cell adhesion in this submersion. In the example shown, many microvilli arose from the myotube surface near the distal axon segment, often making contacts with the sides, and occasionally the “top” of the axon whereas the number of such microprocesses near the proximal axon segment was reduced (Fig. 3D-F). The myotube surface contacting the proximal axon segment instead formed a gutter in which the axon rested. At least one “side” and the “bottom” of the axon usually contacted the wall of the gutter, and some parts of the gutter were actually closed over by folds to form a tunnel surrounding the axon (Fig. 3F). Consistent with the SCEM results, the dendritic stump, soma and dendrite of the 4 neurons examined by TEM were associated with few microprocesses and were never covered by them (Fig. 4). Thus, whereas the interaction of VSC axons with myotube microprocesses resulting in submersion in the myotube contours was variable in degree, submersion was not seen with dendrites.
Agrin induces microprocess formation by myotubes
The observation that synapse-forming axons of VSC neurons selectively induce microprocess formation together with our previous observation that agrin is secreted predominantly along these axons (Ma et al., 2000), suggested the possibility that agrin might induce microprocess formation. To test this, we first examined the surface morphology of uninnervated myotubes after adding C-terminal rat agrin to culture medium. Myotubes were exposed to recombinant C-terminal rat agrins for 3, 6, 12 or 24 hr. Myotubes were examined by SCEM and scored for the abundance of microprocesses on a scale of 0–4. Examples of the scoring can be seen in Figure 6. Agrin4,8, an isoform that is highly active in AChR aggregation (Ferns et al., 1993) induced extensive microprocess formation. The number of microprocesses compared with untreated myotubes increased significantly by 3 hr (mean score of 3 experiments 1.93 ± 0.03 vs. 1.05 ± 0.13 for control) and peaked at 6 hr (mean score of 3 experiments 2.97 ± 0.16; Fig. 6, Table2). Agrin0,0, is inactive in AChR aggregation in soluble form. In a second series of experiments agrin0,0 appeared to induce a small increase in the number of microprocesses at 6 (1.40 ± 0.25) and 12 (1.60 ± 0.08) hr compared with control myotubes (0.78 ± 0.09 and 1.22 ± 0.20, respectively) which were exposed to medium conditioned by untransfected COS-7 cells. These values were not significantly different (Student's t test) from those of control myotubes. However, because of the variability and the gradual increase in scores over 24 hr for the control cultures in this series of experiments (possibly due to activity in COS-7 cell-conditioned medium), we cannot rule out a modest effect of agrin0,0 on microprocess formation. We also tested the effect of recombinant epidermal growth factor (EGF), which induces microprocess extension and migration in various cell types (for example, Chinkers et al., 1979). EGF (2 ng/ml) induced little or no microprocess formation on myotubes (Fig. 6D, Table 2).
Table 2.
Formation of microprocesses on myotubes exposed to soluble agrins or EGF
| Addition | 3 hr | 6 hr | 12 hr | 24 hr |
|---|---|---|---|---|
| Series A | ||||
| Agrin4,8 | 1.93 ± 0.03 (3) | 2.97 ± 0.16 (3) | 2.28 ± 0.18 (3) | 1.97 ± 0.18 (3) |
| EGF | 1.18 ± 0.13 (2) | 1.23 ± 0.03 (2) | 1.60 ± 0.3 (2) | 1.05 ± 0.05 (2) |
| None | 1.05 ± 0.13 (4) | 0.80 ± 0.0 (2) | 0.73 ± 0.13 (3) | 0.83 ± 0.06 (3) |
| Series B | ||||
| Agrin4,8 | 1.60 ± 0.30 (2) | 2.50 ± 0.15 (3) | 2.40 ± 0.12 (3) | 1.98 ± 0.01 (2) |
| Agrin0,0 | 0.85 ± 0.05 (2) | 1.40 ± 0.25 (3) | 1.60 ± 0.08 (3) | 1.65 ± 0.25 (2) |
| Control | 0.60 ± 0.20 (2) | 0.78 ± 0.09 (3) | 1.22 ± 0.20 (3) | 1.60 ± 0.00 (2) |
SCEMS of myotubes were scored for microprocess formation on a scale of 0–4 (see Materials and Methods; Fig. 6). Values are means ± SE; n = number of experiments. For each datum in an experiment, 7–12 myotubes were scored. The control for series B was medium-conditioned by untransfected COS-7 cells diluted as for the agrin-containing medium.
To further test the effect of agrin on myotube surface structure, we transfected myoblasts with constructs encoding full-length rat agrin and rat agrin-GFP fusion proteins. In transfected cell lines, these constructs generate forms of agrin that are not secreted, but are associated with the plasma membrane, where they probably exist as type II transmembrane proteins with the active C terminus on the extracellular side (Burgess et al., 2000; Neumann et al., 2001). Myotubes were examined by fluorescence microscopy 3–4 d after myoblast transfection. Bright cytoplasmic fluorescence in GFP-transfected myotubes allowed clear visualization of fine processes resembling filopodia that extended laterally near the substrate, but these were observed infrequently, except at the ends of myotubes (Fig.7A, B). Only 2.8% of GFP-transfected myotube segments observed with the 40× objective displayed >5 filopodia (mean of 3 experiments, 130 myotube segments). In myotubes transfected with agrin-GFP or agrin, surface topography was visualized by fluorescence or immunofluorescence of agrin-GFP or agrin associated with the cell surface. Transfected myotubes frequently displayed numerous lateral filopodia as well as filopodia on the dorsal surface of the myotubes. Quantitation was based on the number of lateral filopodia because these could be more clearly distinguished than those on the dorsal surface. The responses to transfection with agrin4,19-GFP, agrin4,19and agrin4,0-GFP constructs were similar in magnitude (Fig. 7C, D); 71.3, 75.6 and 69.4% of transfected myotube segments displayed many filopodia, respectively (mean of 3 experiments,n = 114, 78 and 120 myotube segments, respectively). In contrast, labeling with TRITC-BTX showed that myotubes transfected with agrin4,19-GFP or agrin4,19had many AChR aggregates on their dorsal surfaces whereas those tranfected with agrin4,0-GFP were indistinguishable from GFP-transfected myotubes (not shown). Similar results were obtained with agrin-tranfected myotubes whose membranes were labeled with the lipid membrane probe, DiI (not shown). This indicates that the use of GFP as a marker did not effect microprocess formation. However, DiI labeling proved erratic in our muscle cultures and so was not used for quantitation.
Fig. 7.

Microprocesses on myotubes expressing agrin-GFP or GFP alone. A, B, In cultures transfected with GFP alone, filopodia-like microprocesses are readily observed at the ends of GFP-expressing myotubes by immunofluorescence labeling of GFP (A) but rarely along the edges (B). In cultures transfected with agrin4,19-GFP (C) or agrin4,0-GFP (D), the majority of myotubes expressing the fusion proteins displayed many filopodia-like processes as well as shorter lamellipodia and microvilli (arrows) along the edges. Microprocesses were observed on the dorsal surfaces of these myotubes but are not in focus. Scale bar, 20 μm.
Microprocesses and axon-myotube interactionsin vivo
Our observations of microprocess formation on myotubes and extensive interactions between the membranes of axons and myotubes in culture prompted a preliminary examination of developing skeletal muscle tissue for this kind of cellular activity. Therefore we studied the ultrastructure of the developing intercostal muscles of rat embryos from E14 to E17, the period when motor axons first contact myotubes and establish simple, but ultrastucturally identifiable neuromuscular junctions (Kelly and Zacks, 1969). Throughout this period, microprocesses resembling filopodia or microvilli were readily observed on myotubes, many of them at sites of interaction between myotubes (Fig. 8A). This demonstrates that mammalian myotubes in vivo have the capacity to form microprocesses after the myoblasts fuse. We observed numerous contacts between axons or their growth cones and myotubes. For the most part these contacts resembled the developing NMJs described previously (Kelly and Zacks, 1969). Many of the contacts displayed close apposition between axonal and myotube membranes, (Kelly and Zacks, 1969) and location of the axon or growth cone profile in a depression of the myotube surface (Fig. 8B). At some of these sites microprocesses of the myotube were close to the axon or contacted it (Fig. 8B). In addition to myotube processes, processes of Schwann cells were observed around the contacts (as in Kelly and Zacks, 1969). Schwann cells near myotubes were identified by the similarity of their cytoplasmic constituents to those of the cells that ensheathed bundles of axons in the intercostal nerves and their branches (not shown). These Schwann cell processes appeared to interact with the axons at least as closely and extensively as did the myotube.
Fig. 8.
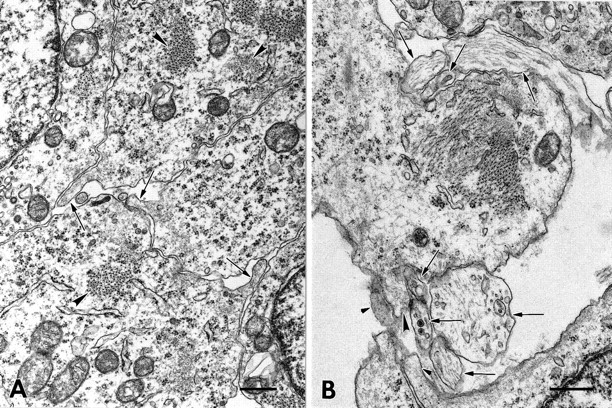
Muscle microprocesses and contacts between myotubes and axons in E15 intercostal muscle. A, Three myotubes (seen in transverse section) extend microprocesses (arrows) that contact one or more of the other myotubes. All myotubes were identified by the presence of myofibrils (examples atarrowheads). B, A myotube is seen in contact with several large and small axonal profiles (arrows), some of which may be branches of the same axon. Most of the axon profiles are in close contact with the myotube membrane and four of them reside within depressions on either side of the myotube. A microprocess (arrowhead) extends from the myotube and is in close contact with two of the smaller axonal profiles. A putative Schwann cell extends a microprocess (small arrowheads) into one of the areas of contact between axons and the myotube. Scale bars, 0.5 μm.
DISCUSSION
In this study we have described novel, specific interactions between the myotube surface and axons of VSC neurons that form synapses with the myotube. SCEM and TEM of identified axonal contacts showed the formation of microvilli, filopodia, ruffles and folds on the adjacent surface of the myotube and many of these processes formed intimate contacts with the axon. This kind of interaction occurred much less frequently in regions of contact with dendrites and somata or with axons that had not induced postsynaptic AChR aggregation. Little microprocess formation was observed on the surface of uncontacted myotubes. Together, these results suggest that contact with synaptogenic axons induces formation of microprocesses on the myotube surface. This is the first direct evidence that microprocess formation in a postsynaptic cell is induced by contact with the presynaptic cell. In addition, TEM showed closer contact between the membranes of axons and myotubes than between dendrites or somata of the same neurons and myotubes, implying greater adhesion with the axon. Finally, the formation of microprocesses on the myotube surface was induced by exposure of myotubes to recombinant agrin, a protein that is required for neuromuscular synaptogenesis and that is targeted to axons. This suggests a connection between the signaling processes involved in synaptogenesis and myotube surface motility.
Adhesive interactions
Our results suggest strong adhesive interactions between axons that induce AChR aggregation and the myotubes they contact. At axon-myotube contact sites, the membranes were separated by an irregular but narrow gap with small regions of apparently direct membrane contact. Our observations of greater areas of close apposition (<10 nm between opposing membranes) at axon-myotube contacts than dendrite- or soma-myotube contacts of the same neurons supports the idea that axons adhere more strongly to the myotube surface. However, more direct measurements of the strength of adhesion will be needed to confirm this. The combination of adhesiveness between axon and myotube and the motile activity indicated by the presence of microprocesses could explain the frequently observed wrapping of the axon by the myotube surface. Wrapping to this degree has not been reported in the developing rat NMJ in vivo (Kelly and Zacks, 1969) orin vitro (Nakajima et al., 1980). This may be attributed to the presence of Schwann cells or other nonmuscle cell types to which the axons also adhere, thus tending to pull the axon away from the myotube surface. Partial or complete surrounding of axons was also reported in a TEM study of chick myotubes cultured with spinal cord explants (James and Tresman, 1969).
It has been suggested, on the basis of several lines of evidence, that adhesion between nerve and muscle cells could serve as a signal for the induction of postsynaptic differentiation (Bloch and Pumplin, 1988). More recently, the role of agrin as a primary signal for postsynaptic differentiation has been established (reviewed in Sanes and Lichtman, 1999). Interestingly, it now appears that agrin interacts with integrins and integrins modulate the AChR aggregating activity of agrin (Martin and Sanes, 1997) and laminin (Burkin et al., 1998). Thus adhesion molecules may play a direct role in the signal transduction process leading to postsynaptic differentiation. It remains to be determined whether adhesion between axon and myotube is directly involved in triggering AChR aggregation. Nonetheless, the increase in area of axon-myotube contact resulting from adhesion and myotube surface motility may enhance the presentation of surface-bound neural factors such as agrin, neuregulin, heparin-binding growth factors, or surface-bound proteases to their receptors or substrates, thus facilitating their putative role in the initiation of NMJ formation and in its maturation. (McMahan, 1990; Peng et al., 1991; Anderson et al., 1991; Champaneria et al., 1992; Fischbach et al., 1994; Peng et al., 1995; Kleiman and Reichardt, 1996).
Adhesion between axon and myotube membranes must be mediated by specific cell-surface molecules. If, as our results suggest, the innervating axons adhere more strongly to the myotube than somata and dendrites, there may be a higher concentration of one or more adhesion molecules on the axon. There is evidence for involvement of N-CAM, L1 or other cell adhesion molecules (CAMs) in nerve-muscle interactions in developing embryos (Landmesser et al., 1988; Rafuse et al., 2000) and in culture (Grumet et al., 1982; Rutishauser et al., 1983). It will be important to determine which, if any, adhesion molecules are preferentially expressed by the axons of developing motor neurons and whether they are required for synaptogenesis.
Microprocess formation and synaptogenesis
We have shown that microprocesses on the myotube surface are induced by contact with synapse-forming axons. These surface changes could be seen as far distally as the vicinity of the growth cone and its filopodia, suggesting that they might represent a very early stage of nerve-muscle interaction. This activity may be the earliest morphological manifestation of the signal transduction process that triggers synaptic differentiation.
Similar surface activity appears to occur in vivo. InXenopus embryos, Kullberg et al. (1977) reported microvilli on the myofiber surface at the time of nerve-muscle contact formation. Here we report that in E14 to E17 rat intercostal muscles, processes resembling microvilli or filopodia extend from the surface of developing myotubes. Many of these processes appeared to be involved with interactions between myotubes, but some were associated with axons that contact myotubes. In addition, profiles of axons or growth cones were seen to sit within cup-shaped depressions in the myotube surface. These findings suggest that active remodeling of myotube surface contours that increases interaction with axons may occur during the early stage of NMJ formation in vivo. In the recognition phase of interaction between Drosophila motor neurons and their target muscle cells, appropriate axons and muscle cells both extend processes resembling filopodia that contribute to the formation of adherent junctions, and the retention of muscle cell microprocesses appears to be related to axonal contact (Ritzenthaler et al., 2000;Suzuki et al., 2000).
An interesting parallel can be drawn between the axon-induced formation of microprocesses that we have observed on myotubes and the active extension and retraction of filopodia along dendritic shafts in developing hippocampal neurons found in vivo and in culture (Dailey and Smith, 1996; Ziv and Smith, 1996). This activity is most prominent during the phase of active synaptogenesis, but its precise role remains unclear (Ziv and Smith, 1996; Fiala et al., 1998). Recent studies on the remodeling of dendrites during development (Threadgill et al., 1997; Ruechoeft et al., 1999; Wong et al., 2000) suggest that this activity is mediated by Rho-family small guanosine triphosphatases (GTPases) and may be dependent on activation of glutamate receptors (Wong et al., 2000).
Thus, the induction of myotube surface motility by synapse-forming axons is a novel example of motility in the postsynaptic “target” cell that may contribute to synaptogenesis. Alternatively, it may be simply a result of shared links in the signal transduction pathways for postsynaptic differentiation and microprocess formation. Formation of membrane ruffles and filopodia is one of the earliest structural changes in many cell types in response to various extracellular factors (Ridley, 1994). Formation of these motile processes involves reorganization of the actin cytoskeleton, mediated by activation of the small GTPases of the Rho family whose downstream targets directly affect assembly (reviewed in Ridley, 1994; Hall, 1998; Ridley, 1999). The AChR aggregating effect of agrin is mediated via the phosphorylation of a muscle-specific receptor tyrosine kinase, MuSK (Valenzuela et al., 1995; DeChiara et al., 1996; Glass et al., 1996). This appears to be dependent on the presence of alternatively spliced inserts in the “Z” site of the C-terminal domain of agrin (Ferns et al., 1992; Glass et al., 1996). Recent evidence suggests that the downstream activation of Rac and Cdc42, two Rho-family GTPases, plays a role in this pathway (Weston et al., 2000). This may provide an explanation for our finding that agrin induces microprocess formation on myotubes. Soluble agrin lacking Z site inserts had, at most, a modest ability to induce microprocess formation. This would be consistent with a role for MuSK in the induction of microprocess formation. However, we also found that expression of a full-length agrin-GFP lacking an insert in the C-terminal “Z” site was as effective as expression of agrin-GFP or agrin with a 19 amino acid insert. In contrast, transfection with the Z0construct did not increase AChR aggregation over control whereas the Z19 construct did. Thus, agrin may induce myotube surface motility through MuSK-dependent and independent pathways. It is possible that the existence of the transfected agrin forms as transmembrane proteoglycans (Burgess et al., 2000; Neumann et al., 2001) is involved in the MuSK independent signaling pathway. In this regard, it is interesting that overexpression of the transmembrane proteoglycan syndecan-2 in COS-1 and Swiss 3T3 cells results in the formation of filopodia (Granés et al., 1999). A MuSK-independent signaling pathway could play a role in the remodeling of neuronal processes in the developing CNS, where the transmembrane form of agrin is predominantly expressed (Burgess et al., 2000; Neumann et al., 2001).
The current evidence indicates that agrin secreted by the motor neuron (as opposed to transmembrane agrin) is required for NMJ formation (Burgess et al., 2000). Hence, our results with soluble agrin indicating a substantially MuSK-dependent microprocess induction may be more relevant to NMJ formation than the results of transfection of transmembrane agrin. Whatever the mechanism by which agrin induces microprocess formation, preferential induction of myotube cell-surface motility by synapse-forming axons is consistent with the preferential accumulation of secreted neuronal agrin along these axons in coculture (Ma et al., 2000).
Together, our results suggest a model of early nerve-muscle interaction in which agrin or other molecules secreted by the motor axon would, in addition to inducing AChR aggregation, induce the formation of motile microprocesses on the myotube surface. The adhesive interaction between these processes and the axon would increase contact area and thus enhance signaling between the two cells to promote postsynaptic differentiation. Future studies should test the validity of this model and further examine the signaling pathways leading to the remodeling of the myotube surface in response to motor axon contact.
Footnotes
C.-S.U. is supported by the Brain Korea 21 Project of the Ministry of Education and Human Resources Development, Republic of Korea. We are grateful to Dr. Chang-Hyun Park for help with scanning electron microscopy, Drs. Cathy Sigal and Robin Taylor for help in preparing C-terminal agrin, and Drs. Evelyn Ralston and Carol Torgan for a critical reading of the manuscript. We also thank Myoung-Soon Cho, Ashley Thuy-Doan, Matthew Rivellese, Eun Kyung Park, and Isaac Bernstein-Hanley for technical assistance.
Correspondence should be addressed to Dr. Mathew P. Daniels, Laboratory of Cell Biology, National Heart, Lung, and Blood Institute, National Institutes of Health, 50 South Drive, Room 3318, MSC 8017, Bethesda, MD 20892-8017. E-mail: danielsm@nhlbi.nih.gov.
REFERENCES
- 1.Ahere WA, Dunnill MS. Morphometry. Edward Arnold; London: 1982. [Google Scholar]
- 2.Anderson MJ, Champaneria S, Swenarchuk LE. Synaptic differentiation can be evoked by polymer microbeads that mimic localized pericellular proteolysis by removing proteins from adjacent surfaces. Dev Biol. 1991;147:464–479. doi: 10.1016/0012-1606(91)90305-m. [DOI] [PubMed] [Google Scholar]
- 3.Bloch RJ, Pumplin DW. Molecular events in synaptogenesis: nerve-muscle adhesion and postsynaptic differentiation. Am J Physiol. 1988;254:C345–C364. doi: 10.1152/ajpcell.1988.254.3.C345. [DOI] [PubMed] [Google Scholar]
- 4.Burgess RW, Nguyen QT, Son Y-J, Lichtman JW, Sanes JR. Alternatively spliced isoforms of nerve- and muscle-derived agrin: Their roles at the neuromuscular junction. Neuron. 1999;23:33–44. doi: 10.1016/s0896-6273(00)80751-5. [DOI] [PubMed] [Google Scholar]
- 5.Burgess RW, Skarnes WC, Sanes JR. Agrin isoforms with distinct amino termini: Differential expression, localization and function. J Cell Biol. 2000;151:45–52. doi: 10.1083/jcb.151.1.41. [DOI] [PMC free article] [PubMed] [Google Scholar]
- 6.Burkin DJ, Gu M, Hodges BL, Campanelli JT, Kaufman SJ. A functional role for specific spliced variants of the α7β1 integrin in acetylcholine receptor clustering. J Cell Biol. 1998;143:1067–1075. doi: 10.1083/jcb.143.4.1067. [DOI] [PMC free article] [PubMed] [Google Scholar]
- 7.Champaneria S, Swenarchuk LE, Anderson MJ. Increases in pericellular proteolysis at developing neuromuscular junctions in culture. Dev Biol. 1992;149:261–277. doi: 10.1016/0012-1606(92)90283-m. [DOI] [PubMed] [Google Scholar]
- 8.Chinkers M, McKanna JA, Cohen S. Rapid induction of morphological changes in human carcinoma cells A-431 by epidermal growth factors. J Cell Biol. 1979;83:260–265. doi: 10.1083/jcb.83.1.260. [DOI] [PMC free article] [PubMed] [Google Scholar]
- 9.Dailey ME, Smith SJ. The dynamics of dendritic structure in developing hippocampal slices. J Neurosci. 1996;16:2983–2994. doi: 10.1523/JNEUROSCI.16-09-02983.1996. [DOI] [PMC free article] [PubMed] [Google Scholar]
- 10.Daniels MP. Localization of actin, beta-spectrin, 43 × 10(3) Mr and 58 × 10(3) Mr proteins to receptor-enriched domains of newly formed acetylcholine receptor aggregates in isolated myotube membranes. J Cell Sci. 1990;97:615–626. doi: 10.1242/jcs.97.4.615. [DOI] [PubMed] [Google Scholar]
- 11.Daniels MP. Intercellular communication that mediates formation of the neuromuscular junction. Mol Neurobiol. 1997;14:143–170. doi: 10.1007/BF02740654. [DOI] [PubMed] [Google Scholar]
- 12.Daniels MP, Lowe BT, Shah S, Ma J, Samuelsson SJ, Lugo B, Parakh T, Uhm C-S. Rodent nerve-muscle cell culture system for studies of neuromuscular junction development: refinements and applications. Microsc Res Tech. 2000;49:26–37. doi: 10.1002/(SICI)1097-0029(20000401)49:1<26::AID-JEMT4>3.0.CO;2-8. [DOI] [PubMed] [Google Scholar]
- 13.DeChiara TM, Bowen DC, Valenzuela DM, Simmons MV, Poueymirou WT, Thomas S, Kinetz E, Compton DL, Rojas E, Park JS, Smith C, DiStefano PS, Glass DJ, Burden SJ, Yancopoulos GD. The receptor tyrosine kinase MuSK is required for neuromuscular junction formation in vivo. Cell. 1996;85:501–512. doi: 10.1016/s0092-8674(00)81251-9. [DOI] [PubMed] [Google Scholar]
- 14.Dutton EK, Uhm CS, Samuelsson SJ, Schaffner AE, Fitzgerald SC, Daniels MP. Acetylcholine receptor aggregation at nerve-muscle contacts in mammalian cultures: induction by ventral spinal cord neurons is specific to axons. J Neurosci. 1995;15:7401–7416. doi: 10.1523/JNEUROSCI.15-11-07401.1995. [DOI] [PMC free article] [PubMed] [Google Scholar]
- 15.Escher G, Bechade C, Levi S, Triller A. Axonal targeting of agrin in cultured rat dorsal horn neurons. J Cell Sci. 1996;109:2959–2966. doi: 10.1242/jcs.109.13.2959. [DOI] [PubMed] [Google Scholar]
- 16.Ferns M, Hoch W, Campanelli JT, Rupp F, Hall ZW, Scheller RH. RNA splicing regulates agrin-mediated acetylcholine receptor clustering activity on cultured myotubes. Neuron. 1992;8:1079–1086. doi: 10.1016/0896-6273(92)90129-2. [DOI] [PubMed] [Google Scholar]
- 17.Ferns MJ, Campanelli JT, Hoch W, Scheller RH, Hall Z. The ability of agrin to cluster AChRs depends on alternative splicing and on cell surface proteoglycans. Neuron. 1993;11:491–502. doi: 10.1016/0896-6273(93)90153-i. [DOI] [PubMed] [Google Scholar]
- 18.Ferreira A. Abnormal synapse formation in agrin-depleted hippocampal neurons. J Cell Sci. 1999;112:4729–4738. doi: 10.1242/jcs.112.24.4729. [DOI] [PubMed] [Google Scholar]
- 19.Fiala JC, Feinberg M, Popov B, Harris KM. Synaptogenesis via dendritic filopodia in developing hippocampal area CA1. J Neurosci. 1998;18:8900–8911. doi: 10.1523/JNEUROSCI.18-21-08900.1998. [DOI] [PMC free article] [PubMed] [Google Scholar]
- 20.Fischbach GD, Aratake H, Corfas G, Falls DL, Goodearl A, Rosen KM. Trophic interactions at developing synapses. Prog Clin Biol Res. 1994;390:173–190. [PubMed] [Google Scholar]
- 21.Forsayeth JR, Garcia PD. Adenovirus-mediated transfection of cultured cells. Biotechniques. 1994;17:354–358. [PubMed] [Google Scholar]
- 22.Frank E, Fischbach GD. Early events in neuromuscular junction formation in vitro: induction of acetylcholine receptor clusters in the postsynaptic membrane and morphology of newly formed synapses. J Cell Biol. 1979;83:143–158. doi: 10.1083/jcb.83.1.143. [DOI] [PMC free article] [PubMed] [Google Scholar]
- 23.Gautam M, Noakes PG, Mudd J, Nichol M, Chu GC, Sanes JR, Merlie JP. Failure of postsynaptic specialization to develop at neuromuscular junctions of rapsyn-deficient mice. Nature. 1995;377:232–236. doi: 10.1038/377232a0. [DOI] [PubMed] [Google Scholar]
- 24.Glass DJ, Bowen DC, Stitt TN, Radziejewski C, Bruno J, Ryan TE, Gies DR, Shah S, Mattsson L, Burden SJ, DiStefano PS, Valenzuela DM, DeChiara TM, Yancopoulos GD. Agrin acts via a MuSK receptor complex. Cell. 1996;85:513–523. doi: 10.1016/s0092-8674(00)81252-0. [DOI] [PubMed] [Google Scholar]
- 25.Granés F, Garcia R, Casaroli-Marano RP, Castel S, Rocomora N, Reina M, Ureña JM, Vilaró S. Syndecan-2 induces filopodia by active cdc42Hs. Exp Cell Res. 1999;248:439–456. doi: 10.1006/excr.1999.4437. [DOI] [PubMed] [Google Scholar]
- 26.Grinnell AD. Dynamics of nerve-muscle interaction in developing and mature neuromuscular junctions. Physiol Rev. 1995;75:789–824. doi: 10.1152/physrev.1995.75.4.789. [DOI] [PubMed] [Google Scholar]
- 27.Grumet M, Rutishauser U, Edelman GM. Neural cell adhesion molecule is on embryonic muscle cells and mediates adhesion to nerve cells in vitro. Nature. 1982;295:693–695. doi: 10.1038/295693a0. [DOI] [PubMed] [Google Scholar]
- 28.Hall A. Rho GTPases and the actin cytoskeleton. Science. 1998;279:509–514. doi: 10.1126/science.279.5350.509. [DOI] [PubMed] [Google Scholar]
- 29.Hall ZW, Sanes JR. Synaptic structure and development: the neuromuscular junction. Cell. 1993;72 [Suppl]:99–121. doi: 10.1016/s0092-8674(05)80031-5. [DOI] [PubMed] [Google Scholar]
- 30.James DW, Tresman RL. An electron-microscopic study of the de novo formation of neuromuscular junctions in tissue culture. Z Zellforsch Mikrosk Anat. 1969;100:126–140. doi: 10.1007/BF00343826. [DOI] [PubMed] [Google Scholar]
- 31.Kelly AM, Zacks SI. The fine structure of motor endplate morphogenesis. J Cell Biol. 1969;42:154–169. doi: 10.1083/jcb.42.1.154. [DOI] [PMC free article] [PubMed] [Google Scholar]
- 32.Kleiman RJ, Reichardt LF. Testing the agrin hypothesis. Cell. 1996;85:461–464. doi: 10.1016/s0092-8674(00)81245-3. [DOI] [PubMed] [Google Scholar]
- 33.Kullberg RW, Lentz TL, Cohen MW. Development of the myotomal neuromuscular junction in Xenopus laevis: an electrophysiological and fine-structural study. Dev Biol. 1977;60:101–129. doi: 10.1016/0012-1606(77)90113-0. [DOI] [PubMed] [Google Scholar]
- 34.Landmesser L, Dahm L, Schultz K, Rutishauser U. Distinct roles for adhesion molecules during innervation of embryonic chick muscle. Dev Biol. 1988;130:645–670. doi: 10.1016/0012-1606(88)90358-2. [DOI] [PubMed] [Google Scholar]
- 35.Ma J, Lugo B, Shah S, Godfrey EW, Daniels MP. Synaptic localization and axonal targeting of agrin secreted by ventral spinal cord neurons in culture. J Neurobiol. 2000;43:338–351. doi: 10.1002/1097-4695(20000615)43:4<338::aid-neu3>3.0.co;2-g. [DOI] [PubMed] [Google Scholar]
- 36.Martin PT, Sanes JR. Integrins mediate adhesion to agrin and modulate agrin signaling. Development. 1997;124:3909–3917. doi: 10.1242/dev.124.19.3909. [DOI] [PubMed] [Google Scholar]
- 37.McMahan UJ. The agrin hypothesis. Cold Spring Harb Symp Quant Biol. 1990;55:407–418. doi: 10.1101/sqb.1990.055.01.041. [DOI] [PubMed] [Google Scholar]
- 38.Nakajima Y, Kidokoro Y, Klier FG. The development of functional neuromuscular junctions in vitro: An ultrastructural and physiological study. Dev Biol. 1980;77:52–72. doi: 10.1016/0012-1606(80)90456-x. [DOI] [PubMed] [Google Scholar]
- 39.Neumann FR, Bittcher G, Annies M, Schumacher B, Kroger S, Ruegg MA. An alternative amino-terminus expressed in the central nervous system converts agrin to a type II transmembrane protein. Mol Cell Neurosci. 2001;17:208–225. doi: 10.1006/mcne.2000.0932. [DOI] [PubMed] [Google Scholar]
- 40.Olek AJ, Pudimat PA, Daniels MP. Direct observation of the rapid aggregation of acetylcholine receptors on identified cultured myotubes after exposure to embryonic brain extract. Cell. 1983;34:255–264. doi: 10.1016/0092-8674(83)90156-3. [DOI] [PubMed] [Google Scholar]
- 41.Olek AJ, Ling A, Daniels MP. Development of ultrastructural specializations during the formation of acetylcholine receptor aggregates on cultured myotubes. J Neurosci. 1986;6:487–497. doi: 10.1523/JNEUROSCI.06-02-00487.1986. [DOI] [PMC free article] [PubMed] [Google Scholar]
- 42.Peng HB, Baker LP, Chen Q. Induction of synaptic development in cultured muscle cells by basic fibroblast growth factor. Neuron. 1991;6:237–246. doi: 10.1016/0896-6273(91)90359-8. [DOI] [PubMed] [Google Scholar]
- 43.Peng HB, Ali AA, Dai Z, Daggett DF, Raulo E, Rauvala H. The role of heparin-binding growth-associated molecule (HB-GAM) in the postsynaptic induction in cultured muscle cells. J Neurosci. 1995;15:3027–3038. doi: 10.1523/JNEUROSCI.15-04-03027.1995. [DOI] [PMC free article] [PubMed] [Google Scholar]
- 44.Rafuse VF, Polo-Parada L, Landmesser LT. Structural and functional alterations of neuromuscular junctions in NCAM-deficient mice. J Neurosci. 2000;20:6529–6539. doi: 10.1523/JNEUROSCI.20-17-06529.2000. [DOI] [PMC free article] [PubMed] [Google Scholar]
- 45.Ridley AJ. Membrane ruffling and signal transduction. Bioessays. 1994;16:321–327. doi: 10.1002/bies.950160506. [DOI] [PubMed] [Google Scholar]
- 46.Ridley AJ. Rho family proteins and regulation of the actin cytoskeleton. Prog Mol Subcell Biol. 1999;22:1–22. doi: 10.1007/978-3-642-58591-3_1. [DOI] [PubMed] [Google Scholar]
- 47.Ritzenthaler S, Suzuki E, Chiba A. Postsynaptic filopodia in muscle cells interact with innervating motoneuron axons. Nat Neurosci. 2000;3:1012–1017. doi: 10.1038/79833. [DOI] [PubMed] [Google Scholar]
- 48.Role LW, Roufa DG, Fischbach GD. The distribution of acetylcholine receptor clusters and sites of transmitter release along chick ciliary ganglion neurite-myotube contacts in culture. J Cell Biol. 1987;104:371–379. doi: 10.1083/jcb.104.2.371. [DOI] [PMC free article] [PubMed] [Google Scholar]
- 49.Ruechoeft ML, Ohnuma S, McNeill L, Holt CE, Harris WA. The neuronal architecture of Xenopus retinal ganglion cells is sculpted by rho-family GTPases in vivo. J Neurosci. 1999;19:8454–8463. doi: 10.1523/JNEUROSCI.19-19-08454.1999. [DOI] [PMC free article] [PubMed] [Google Scholar]
- 50.Rutishauser U, Grumet M, Edelman GM. Neural cell adhesion molecule mediates initial interactions between spinal cord neurons and muscle cells in culture. J Cell Biol. 1983;97:145–152. doi: 10.1083/jcb.97.1.145. [DOI] [PMC free article] [PubMed] [Google Scholar]
- 51.Sanes JR, Lichtman JW. Development of the vertebrate neuromuscular junction. Annu Rev Neurosci. 1999;22:389–442. doi: 10.1146/annurev.neuro.22.1.389. [DOI] [PubMed] [Google Scholar]
- 52.Shimada Y, Fischman DA. Scanning electron microscopy of nerve-muscle contacts in embryonic cell culture. Dev Biol. 1975;43:42–61. doi: 10.1016/0012-1606(75)90130-x. [DOI] [PubMed] [Google Scholar]
- 53.Steinbach JH. Developmental changes in acteylcholine receptor aggregates at rat skeletal neuromuscular junctions. Dev Biol. 1981;84:267–276. doi: 10.1016/0012-1606(81)90394-8. [DOI] [PubMed] [Google Scholar]
- 54.Suzuki E, Rose D, Chiba A. The ultrastructural interactions of identified pre- and postsynaptic cells during synaptic target recognition in Drosophila embryos. J Neurobiol. 2000;43:448–459. doi: 10.1002/(sici)1097-4695(200003)42:4<448::aid-neu6>3.0.co;2-h. [DOI] [PubMed] [Google Scholar]
- 55.Threadgill R, Bobb K, Ghosh A. Regulation of dendritic growth and remodeling by Rho, Rac, and Cdc42. Neuron. 1997;19:625–634. doi: 10.1016/s0896-6273(00)80376-1. [DOI] [PubMed] [Google Scholar]
- 56.Valenzuela DM, Stitt TN, DiStefano PS, Rojas E, Mattsson K, Compton DL, Nunez L, Park JS, Stark JL, Gies DR, Thomas S, Le Beau MM, Fernald AA, Copeland NG, Jenkins NA, Burden SJ, Glass DJ, Yancopoulos GD. Receptor tyrosine kinase specific for the skeletal muscle lineage: expression in embryonic muscle, at the neuromuscular junction, and after injury. Neuron. 1995;15:573–584. doi: 10.1016/0896-6273(95)90146-9. [DOI] [PubMed] [Google Scholar]
- 57.Walton MK, Schaffner AE, Barker JL. Sodium channels, GABAa receptors, and glutamate receptors develop sequentially on embryonic rat spinal cord cells. J Neurosci. 1993;13:2068–2084. doi: 10.1523/JNEUROSCI.13-05-02068.1993. [DOI] [PMC free article] [PubMed] [Google Scholar]
- 58.Weston C, Yee B, Hod E, Prives J. Agrin-induced acetylcholine receptor clustering is mediated by the small guanine triphosphatases Rac and Cdc42. J Cell Biol. 2000;150:205–212. doi: 10.1083/jcb.150.1.205. [DOI] [PMC free article] [PubMed] [Google Scholar]
- 59.Wong WT, Faulkner-Jones BE, Sanes J, Wong ROL. Rapid dendritic remodeling in the developing retina: dependence on neurotransmission and reciprocal regulation by Rac and Rho. J Neurosci. 2000;20:5024–5036. doi: 10.1523/JNEUROSCI.20-13-05024.2000. [DOI] [PMC free article] [PubMed] [Google Scholar]
- 60.Ziv NE, Smith SJ. Evidence for a role of dendritic filopodia in synaptogenesis and spine formation. Neuron. 1996;17:91–102. doi: 10.1016/s0896-6273(00)80283-4. [DOI] [PubMed] [Google Scholar]