Abstract
The mammalian basal ganglia–thalamocortical pathway is important for motor control, motor learning, and cognitive functions. It contains parallel, closed loops, at least some of which are organized topographically and in a modular manner. Songbirds have a circuit specialized for vocal learning, the anterior forebrain pathway (AFP), forming a basal ganglia loop with only three stations: the pallial (“cortex-like”) lateral magnocellular nucleus of the anterior neostriatum (lMAN), the basal ganglia structure area X, and the medial portion of the dorsolateral thalamic nucleus (DLM). Several properties of this pathway resemble those of its mammalian counterpart, but it is unknown whether all projections in the loop are topographically organized, and if so, whether topography is maintained through the entire loop. After small single- or dual-tracer injections into area X and/or the lMAN of adult zebra finches, we found that the area X to DLM projection is topographically organized, and we confirmed the topography for all other AFP projections. Quantitative analysis suggests maintained topography throughout the loop. To test this directly, we injected different tracers into corresponding areas in lMAN and area X. We found somata retrogradely labeled from lMAN and terminals anterogradely labeled from area X occupying the same region of DLM. Many labeled somata were tightly surrounded by tracer-labeled terminals, indicating the microscopically closed nature of the AFP loop. Thus, like mammals, birds have at least one closed, topographic loop traversing the basal ganglia, thalamus, and pallium. Each such loop could serve as a computational unit for motor or cognitive functions.
Keywords: basal ganglia, thalamus, songbird, birdsong, topography, zebra finch, vocal learning
The mammalian basal ganglia–thalamocortical pathway is important for motor control, motor learning, and cognitive functions. This pathway contains parallel, closed loops, with different cortical areas connecting to different basal ganglia regions; these basal ganglia regions connect to different thalamic regions, which ultimately project to the general cortical region of origin (Alexander et al., 1986). In addition, each loop can maintain topographic (e.g., somatotopic) organization (Alexander and Crutcher, 1990; Parent and Hazrati, 1995). These connections can also have a discontinuous, modular (Graybiel, 1990;Gerfen, 1992) organization of the topography. A difficulty in demonstrating the closed nature of these loops, the presence of at least four stages, was surmounted by use of trans-synaptic virus tracing (Hoover and Strick, 1999; Kelly and Strick, 1999).
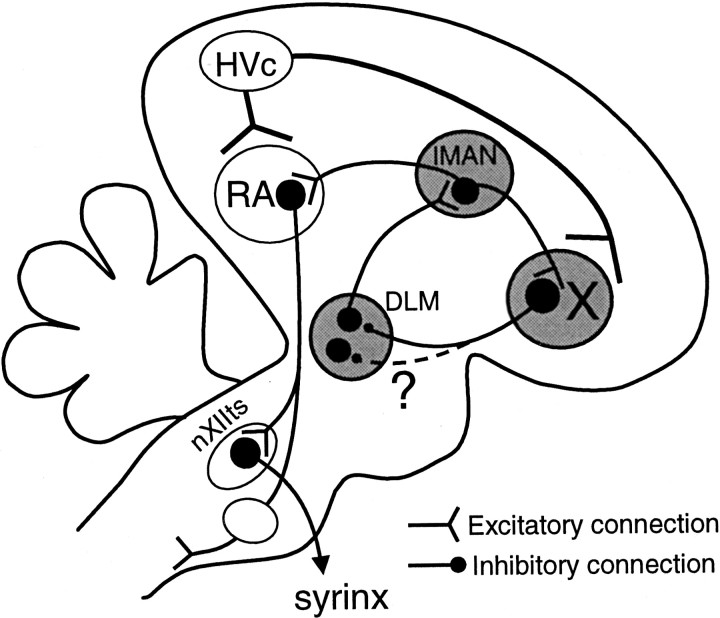
Tetrapod vertebrates share a homologous basal ganglia pathway (Reiner et al., 1998). Songbirds possess a specialization of this pathway, termed the anterior forebrain pathway (AFP), which is essential for song learning and plasticity but not for direct song production (Bottjer et al., 1984; Sohrabji et al., 1990; Scharff and Nottebohm, 1991; Brainard and Doupe, 2000). It consists of three nuclei connected in a loop: the basal ganglia nucleus area X, the medial portion of the dorsolateral thalamic nucleus (DLM), and the lateral magnocellular nucleus of the anterior neostriatum (lMAN) (Fig.1). Note that the avian neostriatum is not the homolog of the mammalian neostriatum, but rather is of pallial origin, like the cortex, claustrum, and portions of the amygdala. This loop is closed in the macroscopic sense (i.e., the projections form a recursive loop). An additional input to area X is from the song nucleus HVc, and an additional output of lMAN is to the premotor robust nucleus of the archistriatum (RA). Area X shares many neurochemical, anatomical, developmental, and physiological features with the mammalian basal ganglia (for review, see Bottjer and Johnson, 1997; Luo and Perkel, 1999b; Perkel and Farries, 2000). Area X provides a strong GABAergic, inhibitory projection to the DLM, in which most neurons have intrinsic properties almost identical to those of the mammalian thalamocortical neurons (Luo and Perkel, 1999a,b). These results strongly suggest that the AFP is an avian corticobasal ganglia–thalamocortical pathway specialized for vocal learning.
Fig. 1.
Highly simplified schematic view of the song system in the sagittal plane. The primary motor pathway essential for song production includes HVc, RA, and the hypoglossal nucleus nXIIts (large open ellipses). The AFP is essential for song learning but not for direct song production. It includes three serially connected nuclei: area X in the basal ganglia area LPO, the thalamic nucleus DLM, and the pallial nucleus lMAN (large shaded ellipses). The HVc → area X projection is nontopographic. Within the AFP, the lMAN → area X and lMAN → RA projections are topographically organized. The DLM → lMAN projection is also topographic in the mediolateral direction. We examined whether the area X → DLM projection is topographic and also whether small areas in the AFP are interconnected to form closed or open loops (dashed line and question mark).
Like the projections in the mammalian corticobasal ganglia–thalamocortical pathway, the lMAN → area X and DLM → lMAN projections within the AFP are topographic (Johnson et al., 1995; Vates and Nottebohm, 1995; Iyengar et al., 1999). However, it remains unknown whether the area X → DLM projection is topographic and, if so, whether the projections through the loop remain in register, and thus whether the loop is microscopically closed. We have used single- or dual-tracer injections into area X and lMAN and have used quantitative analysis to examine this issue. We find that each projection of the AFP is topographically organized and that the loop is microscopically closed. This organizational similarity between avian and mammalian basal ganglia supports the hypothesis of conserved mechanisms of parallel information processing by these structures.
MATERIALS AND METHODS
Thirty-two adult male zebra finches (Taeniopygia guttata, >120 d after hatching) were used for this study. All surgical procedures were performed according to a protocol approved by the University of Pennsylvania Institutional Animal Care and Use Committee.
Tracer injection and histology. Surgery procedures and tracer injections were similar to those described previously (Luo and Perkel, 1999a). Briefly, animals were deeply anesthetized with sodium pentobarbital (40 mg/kg body weight) and then mounted in a stereotaxic apparatus. Skin over the scalp was cut midsagittally, and a small craniotomy was made in the skull over the desired targets. A stereotaxic injection was made by lowering a glass pipette into the target according to predetermined stereotaxic coordinates. Neural tracers used in this study were bidirectionally transported dextran amines (DAs) dissolved in 0.02 m phosphate buffer (PB). They included 4% fluorescein dextran amine (FDA) (3 or 10 kDa), 10% tetramethylrhodamine (TMR)-DA (3 or 10 kDa), 10% Texas Red dextran amine, or 4% biotinylated dextran amine (BDA) (10 kDa) (all from Molecular Probes, Eugene, OR). Two glass pipettes with a tip diameter of 10–30 μm were glued together with light-sensitive glue (3M Dental Products, St. Paul, MN). The tips of the pipettes were separated by 200–400 μm for injection within the same nucleus or 1.0 mm in the dorsoventral direction, and by 200 μm in the mediolateral direction to inject both lMAN and area X. Different tracers were loaded into each pipette and injected iontophoretically into the target area with periodic (7 sec on–off cycle) currents (3–10 μA; Midgard Transkinetics, Canton, MA). After a survival time of 3–4 d, animals were overdosed with sodium pentobarbital (250 mg/kg) and perfused transcardially with saline followed by 4% formaldehyde in 0.1 m PB.
After overnight post-fixation in 4% formaldehyde in 0.1 mPB and cryoprotection in 30% sucrose in 0.1 m PB, each brain hemisphere was cut into 60-μm-thick parasagittal sections using a freezing microtome. For BDA-injected brains, labeling was visualized with either Cy3- or Cy5-conjugated streptavidin (Jackson ImmunoResearch, West Grove, PA). Sections were then mounted with Vectashield mounting medium (Vector Laboratories, Burlingame, CA), coverslipped, and sealed with nail polish.
Microscopy. Fluorescent labeling was examined using confocal microscopy (Leica TCS NT, Heidelberg, Germany). For tissues labeled with different fluorophores (fluorescein–rhodamine or fluorescein–Cy5), the gain for each color channel was carefully controlled to prevent cross talk across channels. For dual labeling with FDA and TMR-DA, cross talk from the fluorescein channel to the rhodamine channel in some cases was difficult to eliminate with the optimal filter sets for fluorescein and rhodamine, respectively. In these cases, the TMR-DA labeling was thus collected with an optical filter of higher wavelength, which reduced the signal strength but also completely eliminated cross talk. Because the signal strength of the TMR-DA labeling was high (Fig. 2), it is unlikely that we missed some of the tracer-labeled materials because of the change of filter set. For each region of interest, multiple optical sections were collected and then projected into a single plane for presentation.
Fig. 2.
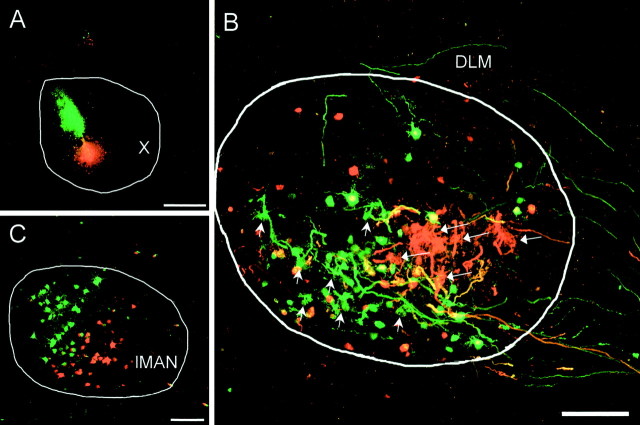
Separate clusters of labeling in DLM and lMAN revealed by dual-tracer injections into area X. A, Injection sites in area X. Green represents FDA;red represents TMR-DA. B, Anterograde terminal labeling in DLM for each of the tracers was primarily separate. Short arrows point to greenterminals; long arrows point tored terminals. Many somata were also retrogradely labeled, presumably because their axons passed through area X en route to DLM. C, Retrogradely labeled somata in lMAN were also primarily separate. Scale bars: A, 400 μm;B, 200 μm; C, 50 μm. For this and all other figures, dorsal is up and anterior is to theright.
Because it was important to determine the exact location of labeling in each nucleus for the study of topographic mapping, we took great care in delineating the nucleus border. We first identified the nuclei of interest by their location, shape, and surrounding landmarks. Previous work with Nissl-stained sections indicated that the borders of the nuclei could be accurately outlined using the elevated background fluorescence resulting from tracer injection and/or autofluorescence compared with the areas surrounding these nuclei. To ensure consistent orientation of the nuclei across different sections and hemispheres, the microscope stage was adjusted under epifluorescence so that the anterior of each nucleus was to the right.
Quantification. To combine and compare data from injections in different animals, we described and analyzed the location of each injection site and the center of labeling in area X, lMAN, and DLM quantitatively in the parasagittal plane. We initially found one or a few sections containing the largest area of labeling around the injection site, located the center of the nucleus, and measured the diameter of the nucleus in the anteroposterior and dorsoventral directions. A normalized coordinate system was assigned to the nucleus so that the center was at (0, 0), the anterior edge was at (1, 0), and the dorsal edge was at (0, 1). The coordinate for the center of the injection site was then measured. Because the labeling seemed to concentrate in a few sagittal sections and was consistent across several parasagittal sections (Johnson et al., 1995; Iyengar et al., 1999), we chose one or a few sections with maximal labeling in each nucleus to represent the labeling in that nucleus. The center of the nucleus was determined, and the diameter was measured along each axis. This provided a normalized coordinate system for the nucleus. The coordinates of each labeled terminal or soma in the normalized nucleus were identified. The center of the labeling was calculated as the ordered pair (mean of all x coordinates, mean of ally coordinates). When applicable, the normalized coordinates of the center were averaged across sections. Because the labeling did not seem to be normally distributed, especially when the injection sites were very small, we chose not to report the SD of the labeling coordinates.
Each connection was represented by two sets of coordinates, one for the injection site (xs,ys) and one for labeling (xd, yd). ForN injections into the same nucleus, we collectedN sets of coordinates. For each injection i(1 ≤ i ≤ N), the coordinates for injection sites were (xsi,ysi); those for labeling were (xdi, ydi). The distance, in normalized coordinates, between the injection site and the center of labeling for this injection was calculated as and serves to indicate whether the coordinates of the injection site matched those of its corresponding labeling. Smaller values of this distance indicate a better match, with 0 as a perfect match. For each connection, the distance values for all hemispheres injected were averaged.
If a connection is highly topographic but twisted in the parasagittal plane, the average distance could be misleadingly high. In such a case, recalculating the average distance value after rotating one nucleus by an appropriate amount could reveal more precise topographic organization. To search for the rotation angle giving the best match between the injection sites and center of labeling, the coordinate of either the injection site or labeling was rotated through 360° in 1° steps, and the average distance was calculated for each step. The angle at which the average distance was minimal was then identified. To be consistent, we rotated the coordinates of the target nucleus for each projection. This means that for the lMAN → area X projection, the area X coordinates were rotated; for area X → DLM projection, the DLM coordinates were rotated.
To examine whether the topographic organization of a connection was statistically significant, we randomly shuffled the coordinates of either the injection sites or labeling centers of each projection target 200 times. For each shuffling, the coordinates were rotated 1° per step for 360°, and the minimal average distance was calculated. The mean and SD of these 200 minimal average distance values from randomly shuffled coordinates were calculated and compared with the minimal average distance of unshuffled coordinates. Topographic organization was deemed significant only when the experimentally determined minimal distance was substantially (2 × SD) less than the mean of the average distance calculated from the randomly shuffled coordinates.
RESULTS
Topography of the area X → DLM and lMAN → area X projections
Because no bilateral connections are known to exist within the AFP (Bottjer et al., 1989; Johnson et al., 1995; Vates and Nottebohm, 1995), tracers were usually injected bilaterally into area X and the spatial organization of the area X → DLM and lMAN → area X projections was examined in each hemisphere. A total of 30 tracer injections were made into area X in 20 hemispheres from 13 animals. Primarily separate dual-tracer injections were successful in nine hemispheres from six animals.
After tracer injections into area X, retrogradely labeled somata were reliably observed in the HVc (n = 25 of 30), lMAN (n = 26 of 30), and area ventralis of Tsai (AVT) (n = 21 of 30). Scattered retrogradely labeled somata were also frequently observed in DLM, likely because the axons of these neurons passed the injection site en route to lMAN (Bottjer et al., 1989). Anterogradely labeled terminals were reliably observed in DLM (n = 30 of 30) (Bottjer et al., 1989). In many cases (n = 18 of 30), tracer-labeled terminals were observed in RA, likely because the retrogradely labeled neurons in lMAN also project to RA (Vates and Nottebohm, 1995). In addition to these well documented nuclei that connect with area X, labeling in a few other areas was also observed and will be described below.
The anterogradely labeled terminals in DLM had a characteristic claw-like morphology and in many cases formed baskets surrounding a small area that was approximately the size of a DLM soma (Okuhata and Saito, 1987; Luo and Perkel, 1999a). The number of labeled terminals from a single small injection in area X was low, and most of these terminals were clustered into a small area within DLM limited within a few (two to four) parasagittal sections. Dual-tracer injections into separate areas within area X (Fig. 2A) labeled largely separate clusters of terminals within the same sagittal sections in DLM (n = 6 of 9) (Fig.2B). In some cases, however, the absolute separation of terminals was compromised when one or both injection sites were in the posteroventral part of area X, possibly labeling terminals whose axons passed through the injection site (n = 3 of 9). Dual-tracer injections also retrogradely labeled somata in largely separate areas in lMAN (Fig. 2C). When one injection site in area X was dorsal to the other the segregation of soma labeling in lMAN was not absolute, possibly because of label taken up by fibers of passage.
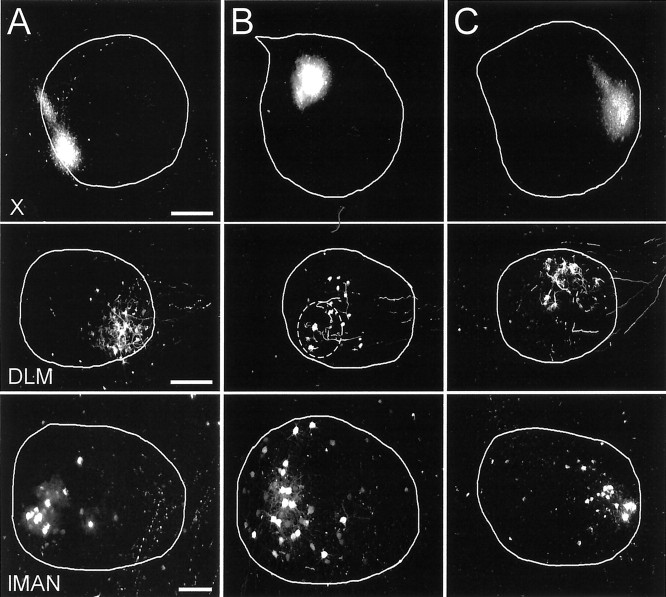
The location of the anterograde labeling in DLM appeared to be rotated from the location of each injection site in area X. For example, a small tracer injection into posterior and slightly ventral area X labeled terminals in anteroventral DLM (Fig.3A). An injection into dorsal area X labeled terminals in posterior DLM (Fig. 3B). An injection into anterior area X labeled terminals in anterodorsal DLM (Fig. 3C). Relative to the center of the nucleus, the center of terminal labeling in DLM therefore seemed to twist counterclockwise (ccw) compared with the injection sites in area X when viewed in our standard orientation, with dorsal up and anterior to the right. The retrograde labeling in lMAN, however, had a rectilinear relationship with the injection sites in area X, with little apparent rotation. A posterior injection in area X labeled somata in posterior lMAN (Fig.3A) and an anterior injection in area X labeled anterior lMAN (Fig. 3C). The orderly mapping was also observed in the dorsoventral direction, although injections in dorsal area X in many cases led to labeling in lMAN centered more ventral in lMAN relative to the injection site, most likely because of fibers of passage (Fig.3B).
Fig. 3.
Spatial relationships for the X → DLM and lMAN → area X projections demonstrated by three single-tracer injections into different small regions of area X.A, Small tracer injection in posteroventral area X (top) labeled terminals in anteroventral DLM (middle) and somata in ventroposterior lMAN (bottom). B, Small tracer injection in dorsal and slightly posterior area X (top) labeled terminals in ventroposterior DLM (middle) and somata in slightly posterior lMAN (bottom). The dashed circle in the DLM shows the area that includes all of the anterogradely labeled terminals from this injection site. Many retrogradely labeled somata were outside of thecircle. The injection site was in dorsal area X and may have the confounding effect of fibers of passage and thus may have labeled some somata in ventral lMAN. C, Tracer injection in anterior area X (top) labeled terminals in dorsal and slightly anterior DLM (middle) and somata in anterior lMAN (bottom). Scale bars:Top, 400 μm; middle, 200 μm;bottom, 100 μm.
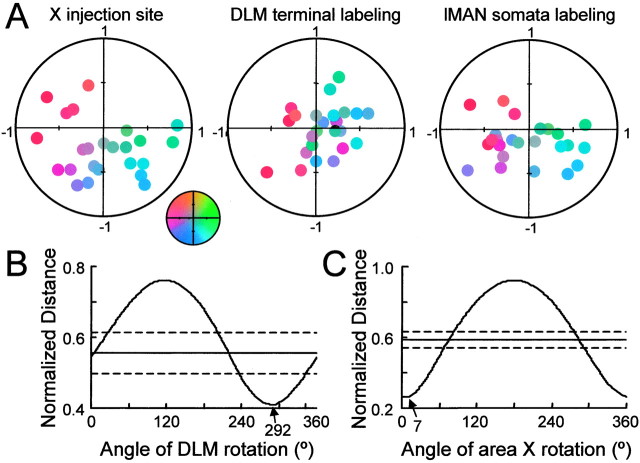
As an initial attempt to quantify the spatial mapping of the area X → DLM and lMAN → area X projections, we compared the locations of the injection site and the center of labeling in lMAN and DLM for all area X injections. The positions of the injection sites were determined in a normalized coordinate system (Fig.4A), as were the centers of anterograde labeling in area X (Fig. 4B) and those of retrograde labeling in lMAN (Fig. 4C). For each projection, we calculated the “distance” in normalized coordinates between the injection site and the center of labeling (see Materials and Methods). The values of this distance for all of the injections were averaged, and the average normalized distance was used as an index of the difference between the positions of injection and the center of the resultant labeling. Without any rotation, the average distance between the coordinates of the area X injection site and those of the DLM labeling was 0.56, corresponding to 28% of the diameter of DLM. The distance between injection sites and lMAN labeling was 0.27, or 14% of the diameter of lMAN. From experiments such as those shown in Figure 3, we suspected that the area X → DLM projection may undergo a rotation in the parasagittal plane. To examine this rotation, we rotated, in 1° steps, the axes of the target nucleus for each projection, and we recalculated the average normalized distance at each step (Fig. 4B). The minimum of this distance was 0.42 at 292° for the area X → DLM projection and 0.26 at 7° for the lMAN 224 area X projection. To determine whether these distance values were significantly less than expected from random projections, we randomly shuffled the injection site and labeling coordinates and calculated the minimum distance for each of 200 combinations of shuffled values. The mean and SD of the minimum distances from 200 shuffled values were calculated. The minimum distance values for the area X → DLM projection and lMAN → X projection were both more than twice the SD below the mean distance calculated from shuffled data (Fig. 4B,C). The position of labeling for these two projections was thus not likely the result of random distribution.
Fig. 4.
Summary data from injections in area X, indicating that the pattern of anterograde labeling in DLM is rotated ∼70° ccw from the injection site in area X, whereas the pattern of lMAN labeling was not rotated. A, Color-coded location of injection sites and labeling in normalized area X, DLM, and lMAN. For area X, the anterior → posterior direction has coordinates from (1, 0) to (−1, 0), and the dorsal → ventral direction is from (0, 1) to (0, −1). Each injection site was assigned a unique color based on its coordinates. The inset shows the color map used to code injection sites in this figure and in Figure 5. The coordinates of DLM and lMAN are normalized in a similar manner.Small circles with specific coordinates in these nuclei represent the centers of the labeling as determined by averaging the coordinates of each labeled soma or terminal. The color of thecircle indicating labeling indicates the location of the injection site in area X. B, Average Euclidean distance between the injection site and corresponding labeling based on the normalized coordinates, as a function of the rotation angle. Minimal average distance indicates optimal matching. Optimal matching for the area X → DLM projection occurs when the coordinates of DLM are rotated 292° cw and that for the lMAN → area X projection occurs when the coordinates of area X are rotated 7° cw. This indicates that the terminals of area X projections are rotated 68° ccw from their somata. The solid horizontal line indicates the mean minimal distance from injection sites to the labeling centers using shuffled data (see Materials and Methods). Dashed linesindicate ±2 SDs of the minimal distances away from the mean of the minimal distance.
The minimal average distance for the area X → DLM projection was larger than that for the lMAN → area X projection. Although this may reflect a degradation of mapping accuracy for the area X → DLM projection, it might also result from a greater confounding effect of fibers of passage, because a number of the injection sites in our study were in posteroventral area X. The accuracy of the mapping for both projections, especially for the area X → DLM projection, may therefore be underestimated.
Topography of the DLM → lMAN projection
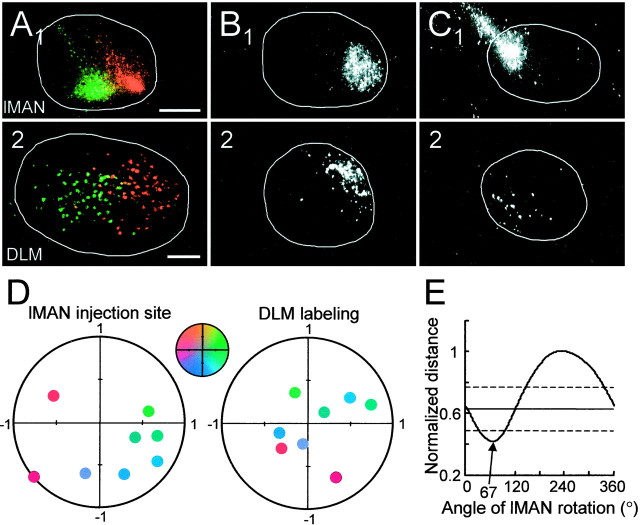
Tracers were injected into lMAN in six hemispheres from four animals. In two hemispheres, dual tracers were injected into areas segregated in the anteroposterior direction within the same sagittal plane. In all cases, tracer injection into lMAN retrogradely labeled somata in DLM that were usually clustered in a small portion of the thalamic nucleus. In both cases of dual-tracer injection into lMAN, the injection sites were separated. Retrogradely labeled somata in DLM were also well separated, although a small amount of overlap was seen in one case (Fig.5A1,A2). The spatial relationship between the injection site and retrograde labeling appeared to involve some rotation, with the center of labeling rotated ccw from the injection site. This is best illustrated by single-tracer injections near the edge of the nucleus. An injection in the anterior edge of lMAN retrogradely labeled somata in the anterodorsal DLM (Fig.5B1,B2), with the center of labeling rotated ∼60° ccw from the injection site. Similarly, an injection into posterodorsal lMAN retrogradely labeled somata in the posteroventral DLM (Fig.5C1,C2).
Fig. 5.
The DLM → lMAN projection is topographic in the sagittal plane, with the retrograde labeling rotated ∼67° ccw from its injection site. A1,B1, andC1 are injection sites in lMAN.A2,B2, andC2 show the corresponding retrograde labeling in DLM. A1, Dual-tracer injection into primarily separate areas in lMAN.A2, Primarily separate retrograde labeling in DLM. B1, A single-tracer injection into anterior lMAN. B2, Retrograde labeling in anterodorsal DLM.C1, Single-tracer injection into posterodorsal lMAN. C2, Retrograde labeling in posteroventral DLM. D, Locations of injection sites in lMAN (same color map as in Fig. 4) and the center of corresponding labeling in DLM. E, Optimal matching of the injection site and labeling occurs when the coordinates of lMAN are rotated 67° cw. The solid horizontal line indicates the mean of the minimal distance after the coordinates of the labeling were randomly shuffled. Dashed lines indicate ±2 SDs away from the mean. Scale bars: A1,B1,B2,C1,C2, 200 μm;A2, 100 μm.
As with the area X injections, normalized coordinates of injection sites in lMAN and labeling centers in DLM were measured and the distance between the injection sites and labeling was calculated (Fig.5D). The average distance for all injection sites was then calculated while the axes of lMAN coordinates were rotated through 360° in 1° steps. The minimal average distance occurred when the axes of lMAN were rotated 67° clockwise (cw) (Fig. 5E). This distance was >2 SDs below the mean distance for 200 trials of randomly shuffled coordinates of labeling in DLM.
Evidence that the AFP is microscopically closed
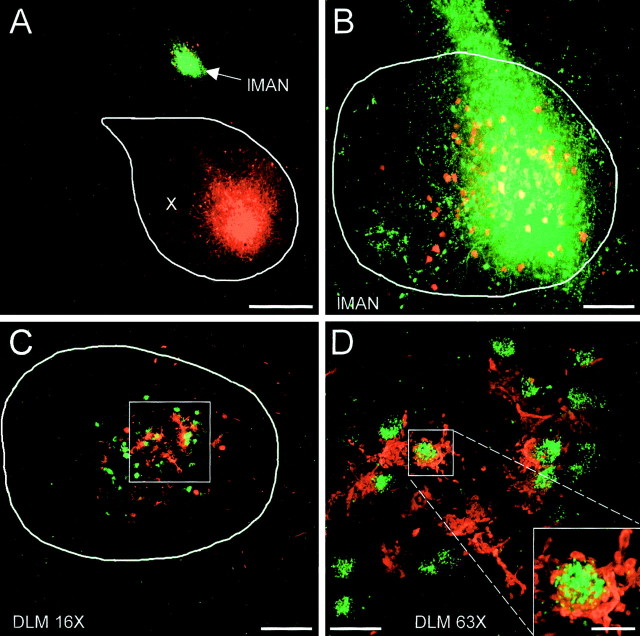
Based on tracer injections into area X and lMAN, the spatial relationships of these three projections suggested that the loop within the AFP is microscopically closed, (i.e., that cells in a given portion of lMAN receive inputs from a portion of DLM receiving inputs from a portion of area X to which that original portion of lMAN projects). Projection neurons in a small area in area X project their terminals to a small area in DLM that is rotated ∼68° ccw from the position of the somata. The DLM neurons in the terminal fields of the area X projection neurons will then project their terminals to a small area in lMAN that is rotated ∼67° cw from their somata in DLM. The spatial relationship for the lMAN → area X projection has little apparent rotation in the sagittal plane, which means that lMAN neurons in the terminal fields of the DLM neurons will in turn project their terminals to the original portion of area X, thus forming a closed loop. This connection pattern could be illustrated more directly by examples in which corresponding areas in area X and lMAN were injected. Injection into the anterior part of area X anterogradely labeled terminals in the dorsal anterior portion of DLM and retrogradely labeled somata in the anterior lMAN (Fig. 3C). Meanwhile, injection into the anterior lMAN retrogradely labeled somata in the dorsal anterior portion of DLM (Fig. 5A, red, and Fig.5C), which largely overlapped with the terminal area in Figure 3C. Based on these injections into anterior area X and those into anterior lMAN, it is likely that anterior area X, the dorsal anterior portion of DLM, and anterior lMAN formed a closed loop.
Direct evidence for maintained topography throughout the AFP came from one experiment in which FDA was injected into lMAN and BDA was injected into the corresponding region of area X (Fig.6). The BDA injection site was located in the central and slightly anteroventral part of area X (Fig.6A). The FDA injection site in lMAN was located in a similar portion of lMAN and 200 μm more lateral to the area X injection site (Fig. 6B). The retrogradely labeled somata from the area X injection primarily overlapped the injection site in lMAN (Fig. 6B), although in more medial sections some retrogradely labeled somata were more dorsal to the FDA injection site (Fig. 6A). In DLM, the retrogradely labeled somata from the FDA injection into lMAN largely overlapped the anterogradely labeled terminals from the area X injection (Fig.6C). Viewed at higher magnification, the anterogradely labeled terminals formed baskets that were characteristic of the projection neurons. Many of these baskets tightly surrounded the FDA-labeled somata from lMAN injection (Fig. 6D).
Fig. 6.
Dual-tracer injection into lMAN and area X indicates closed loops within the AFP. A, Injection sites in area X (red) and in lMAN (green). B, Higher-power view of lMAN showing yellow (double-labeled) somata retrogradely labeled after an injection in X, colocalized with the injection site in lMAN. The red somata adjacent to the injection site are retrogradely labeled from area X but did not take up dye from the lMAN injection. C, Tracer labeling in DLM. The retrogradely labeled somata from the lMAN injection (green) and the anterogradely labeled terminals from the area X injection (red) were largely colocalized. D, Higher-power view of the area indicated by the box inC. Many retrogradely labeled somata were tightly surrounded by the anterogradely labeled terminals. Theinset shows one example of a soma encircled by a terminal. Terminals in area X were not well labeled in this case. Scale bars: A, 400 μm; B, C, 100 μm; D, 25 μm; D,inset, 10 μm.
Topography and nontopography for other projections in the AFP
Topographic organization of the lMAN → RA projection was confirmed by both tracer injections into lMAN and into area X. In four of eight injections into lMAN, we observed well labeled terminals in RA and area X. Other injections failed to label terminals anterogradely in either RA or area X, possibly because of problems in tracer preparation or transport. In all four cases in which terminals were well labeled anterogradely from small tracer injections into lMAN, these terminals were dense and clustered into a small area in RA (Fig.7A). In some lateral sections, however, the label was sparser and more diffusely distributed throughout RA, possibly reflecting the fact that the axons of lMAN neurons enter RA from its lateral aspect (Johnson et al., 1995). Tracer injection into area X retrogradely labeled lMAN neurons, which in turn anterogradely labeled terminals in RA (n = 19 of 30) through their axonal collaterals (Vates and Nottebohm, 1995). In such cases, clustering of terminals within a small area in RA was also observed after small area X injections (Fig. 7B,C). The spatial relationship for the lMAN → RA projection is similar to that reported by Vates and Nottebohm (1995) in the sagittal plane. Briefly, posterior lMAN neurons project to dorsal RA (Fig. 7A,B), and anterior lMAN neurons project to ventral RA (Fig. 7C). Ventral lMAN neurons project to more anterior RA (Fig. 7A), and dorsal lMAN neurons project to posterior RA (data not shown).
Fig. 7.
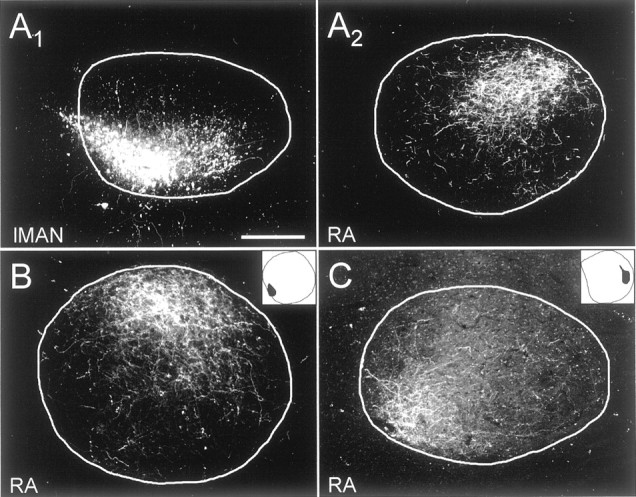
The topography of the lMAN → RA projection was confirmed by injecting tracers into area X or lMAN.A1, Tracer was injected into posteroventral lMAN. A2, Anterogradely labeled terminals in anterodorsal RA. B, Injection into the posterior and slightly ventral region of area X (inset) retrogradely labeled somata in posteroventral lMAN, which in turn anterogradely labeled terminals in dorsal RA. This is the same injection as in Figure 3, left panels. C, Tracer injection into anterior area X (inset) labeled terminals in posteroventral RA. This is the same injection as in Figure 3, right panels. Scale bar: A–C, 200 μm.
The reported nontopographic organization of the projections from HVc to area X (Bottjer et al., 1989) and from the midbrain dopaminergic area AVT–nucleus tegmenti pedunculo-pontinus, pars compacta (TPc) to area X (Lewis et al., 1981) was confirmed. Small injections into area X reliably labeled somata throughout the HVc (n = 23 of 30) and AVT–TPc (n = 19 of 30). Tracer injections into separate portions of area X generated completely intermingled retrograde labeling in these two nuclei. Many retrogradely labeled somata in HVc or AVT–TPc were double labeled (Fig.8A,B), indicating a substantial degree of divergence in these projections. In some cases only a small number of somata in these nuclei were weakly labeled, possibly because of the long range of these two projections and relatively short survival time after the injections.
Fig. 8.
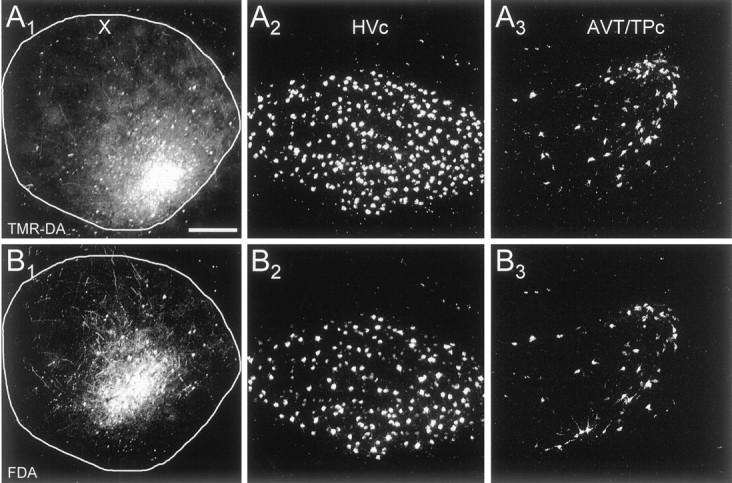
Absence of topography in the HVc → area X and AVT → area X projections. A, TMR-DA injection in area X and labeling in HVc and AVT–TPc. B, FDA injection and labeling within the same sections as in A. In both structures retrogradely labeled cells are widely distributed throughout the nucleus and many cells are double labeled.
Lack of widespread intranuclear connections in the AFP
We did not observe widespread labeling within the injected nuclei after small tracer injections into area X or lMAN (see injection sites shown in Figs. 2-7). Area X injections usually retrogradely labeled somata in areas dorsal and anterior to the injection sites. These somata were large, and some well-filled neurons had morphological features resembling those of the area X neurons projecting to DLM (Bottjer et al., 1989; Luo and Perkel, 1999a), suggesting they were DLM-projecting neurons retrogradely labeled because their axons passed through the injection sites. Elevated fluorescence in the background within the entire nucleus was common, but specific labeling of terminals or somata was not observed. The lack of long-distance collateral labeling within each nucleus supported the notion that the connections within area X and lMAN are mostly local.
Of the three projections within the AFP, the area X → DLM projection was studied in the greatest detail. Area X projection neurons have axonal collaterals limited to the area covered by their dendritic arbors (Luo and Perkel, 1999a). Any area X interneurons that may form synapses on projection neurons appear to be located near the projection neuron soma, because small tracer injections into area X labeled somata only near the injection. Small injections into area X also revealed that the axons of these projection neurons did not branch in DLM until reaching their target area, at which point they broke into short axon terminals ending in baskets. The degrees of divergence and convergence in this projection thus appear very small (Luo and Perkel, 1999a,b).
DISCUSSION
In this study we found that the projection from area X to DLM is topographically organized, we confirmed and extended knowledge of the topographic organization in other AFP connections (Johnson et al., 1995; Vates and Nottebohm, 1995; Iyengar et al., 1999), and we also demonstrated that this AFP loop is microscopically closed. Our results also enhance our understanding of the spatial organization of other song-system connections, such as the topographic projection from lMAN to RA (Johnson et al., 1995; Vates and Nottebohm, 1995; Iyengar et al., 1999) and the nontopographic projections from HVc and AVT to area X. These data support the idea that avian and mammalian basal ganglia–thalamocortical loops share common organizational principles and strengthen the possibility that similar principles underlie their function.
Topography throughout the AFP
In this study, we made small tracer injections into area X. In many cases, two different tracers were injected into the same nucleus. The clustering of anterogradely labeled terminals in DLM and the separation of terminal clusters after dual-tracer injections directly demonstrate that the projection from area X → DLM is topographic in the parasagittal plane. Although we have not made a complete three-dimensional reconstruction of the labeling, the fact that many of the labeled terminals were limited to a few sections rather than extending throughout the entire mediolateral extent of DLM suggests that the topography is maintained in the mediolateral dimension as well. Together with data from previous studies in the coronal and parasagittal planes (Johnson et al., 1995; Vates and Nottebohm, 1995;Iyengar et al., 1999), our tracer injections in area X and lMAN suggest that all three projections in the AFP are topographically organized.
The exact degree of topography is difficult to determine. Although the coordinates of injection sites and those of labeling were significantly correlated, the labeling tended to be closer to the center of the nucleus than the injection sites, especially for the area X → DLM projection. Strict point-to-point connectivity clearly does not occur, and some degree of convergence and divergence must exist. Nonetheless, the lack of labeled somata or terminals in area X at sites distant from the injection in that nucleus places strong constraints on the degree of cross talk between parallel pathways. The limitations of tract tracing using bulk tracer injection, including the problems of fibers of passage and tracer deposition along the pipette track, may have contributed to the degradation of topography revealed by our tracing. More precise tracing methods such as single-cell labeling using intracellular filling or juxtacellular labeling are needed to assess more accurately the degree of topography.
Closed, topographic loop, and modular organization in the AFP
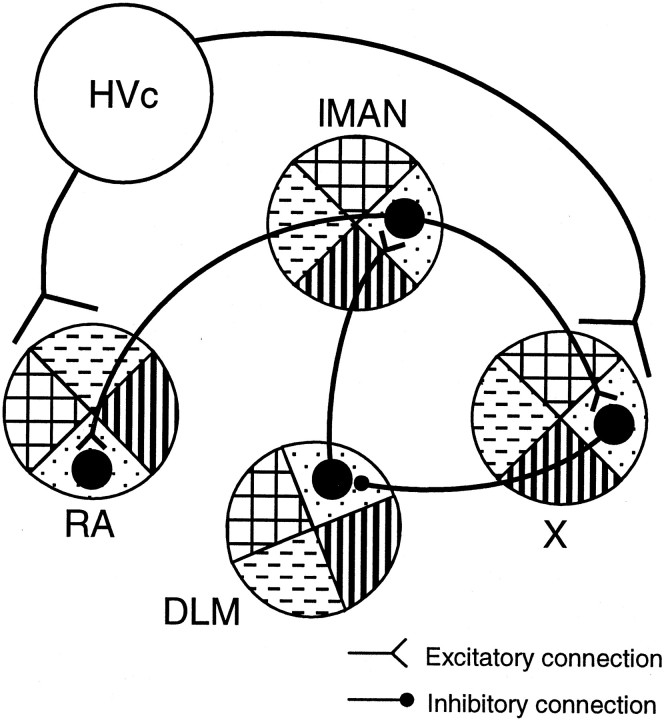
Our quantitative study of the spatial relationships of all three projections in the AFP in the sagittal plane revealed that the lMAN → area X projection is not rotated (Fig.9). In contrast, the terminals of area X projection neurons in DLM are rotated ∼70° ccw from the location of their somata in area X. The terminals of DLM projection neurons, in turn, are rotated ∼70° cw in lMAN. Although we did not analyze the lMAN → RA projection quantitatively, the terminals of lMAN projection neurons in RA seem to rotate 90° cw and then invert vertically based on the locations of the somata of these projection neurons, consistent with the observations of Vates and Nottebohm (1995).
Fig. 9.
Summary of the major results from this study. In the sagittal plane, area X projects topographically to DLM, with the terminals in DLM rotated ∼70° ccw from their injection site (rotation of filled patterns in different areas of the nuclei). The DLM → lMAN projection is also topographic, with the target of the projection in lMAN rotated ∼70° cw from the source of the projection in DLM. Topographic mapping in the sagittal plane for the lMAN → area X projection was also confirmed and found to involve little if any rotation in the sagittal plane. The spatial relationships among the three AFP nuclei suggest that corresponding areas within each nucleus are interconnected. The AFP is thus topographic throughout its projections and forms a closed loop. With the topographic output to RA, which is myotopically organized, each portion of the loop may represent a functional unit related to learning to activate a subset of muscles for vocal production.
The specific rotation by each projection in the AFP provides indirect evidence that corresponding small areas within the three nuclei might be interconnected and form a closed, topographic loop. This is more directly supported by the result in which retrogradely labeled somata were tightly surrounded by anterogradely labeled terminals in the same area in DLM after injection of different tracers into corresponding areas of lMAN and area X.
The AFP thus forms a microscopically closed loop. Subdivisions of that loop (i.e., sets of cells in area X, DLM, and lMAN that are interconnected) may function as basic computational units. For example, because RA is myotopically organized (Vicario, 1991a), the topographic output from lMAN to RA suggests that each such subdivision of the loop may be responsible for learning the control of a subset of muscles for vocal production, in a manner analogous to the somatotopic organization in some of the mammalian basal ganglia loops. It remains unclear, however, to what degree the projection from lMAN to RA really respects the borders between subsets of RA that innervate specific motor neuron pools (Vicario, 1991b). In addition, inhibitory projections across a substantial portion of RA (Spiro et al., 1999) may provide cross talk between channels. Alternatively, the organization of the AFP described here may represent functionally parallel circuits distinguished by some feature or features other than myotopic organization, resembling the situation in mammals, with parallel loops representing substantially different modalities. At least one additional parallel loop may exist, including the shell around lMAN, a region in lobus parolfactorius (LPO) surrounding area X, and a thalamic nucleus called ventromedial DLM (Johnson et al., 1995; Iyengar et al., 1999), although it is not yet clear whether the region around area X projects to ventromedial DLM. Whether the topographic organization observed in the AFP is continuous or discrete, for example corresponding to specific muscle groups, remains unknown. Recordings from AFP neurons (Hessler and Doupe, 1999) combined with electromyographic recordings of syringeal muscles (Goller and Suthers, 1996) may shed light on this issue. It will also be interesting to determine how the nontopographic inputs from HVc and AVT interact with the topographic projections throughout the AFP.
Similarities and differences between the AFP and the mammalian corticobasal ganglia–thalamocortical pathway
The main axonal connections, neurochemical organization, and physiological properties of the AFP and the mammalian corticobasal ganglia–thalamocortical pathway are very similar. If we consider area X as a combination of both striatal and pallidal elements (Bottjer, 1993; Luo and Perkel, 1999a; Farries and Perkel, 2000), it is then consistent that area X, like the mammalian basal ganglia, has pallial and midbrain input and thalamic output. The neurochemical organization of area X is overwhelmingly similar to that in the mammalian and other avian basal ganglia areas (Lewis et al., 1981; Bottjer, 1993; Casto and Ball, 1994; Grisham and Arnold, 1994; Bottjer and Alexander, 1995; Soha et al., 1995; Luo and Perkel, 1999a). Like the pallidothalamic pathway, the area X → DLM projection is GABAergic and inhibitory (Luo and Perkel, 1999a,b). The neurons in each of these nuclei of the AFP have intrinsic and synaptic properties that are very similar to those of the neurons in the corresponding station of the mammalian corticobasal ganglia–thalamocortical pathway (Livingston and Mooney, 1997; Solis and Doupe, 1997; Bottjer et al., 1998; Luo and Perkel, 1999b; Farries and Perkel, 2000). Studies of the topographic organization of the AFP suggest that, in addition to the levels of neurotransmitter and cellular properties, the detailed neuronal wiring within the AFP is also similar to that in the mammalian basal ganglia–thalamocortical pathway.
Although grossly similar to the mammalian basal ganglia–thalamocortical pathway, the AFP is an avian pathway that is specialized for vocal learning. It is not yet clear whether it has all the connections of the mammalian or even avian basal ganglia pathways. For example, area X has not been reported to provide strong projections to midbrain dopaminergic areas. In addition, it is not clear whether the avian homolog of the subthalamic nucleus, the anterior nucleus of the ansa lenticularis (Jiao et al., 2000), receives an input from area X, but such a possibility remains open. Whether area X receives input from the thalamus also requires additional testing.
In conclusion, our neural tracing data from injections into area X and lMAN indicate that the entire AFP is organized topographically, in a manner similar to that of the mammalian basal ganglia–thalamocortical pathway. Most importantly, corresponding small areas in each nucleus of the AFP seem to be interconnected so that the AFP forms a closed loop, each of the three projections in the loop is topographically organized, and these projections are in register. These data provide direct support for the hypothesis that parallel loops form part of the essential neural architecture underlying signal processing in the corticobasal ganglia–thalamocortical pathways of birds and mammals. It will be interesting to determine in mammals the degree of cellular precision in these topographic projections.
Footnotes
This work was supported by National Institutes of Health Grant MH 56646 and by National Science Foundation Grant IBN 9817889 (D.J.P.). We thank Drs. M. P. Nusbaum and R. J. Balice-Gordon for helpful comments on this manuscript.
Correspondence should be addressed to David J. Perkel, Departments of Zoology and Otolaryngology, University of Washington, Box 356515, 1959 Northeast Pacific Street, Seattle, WA 98195-6515. E-mail:perkel@u.washington.edu.
M. Luo's present address: Department of Neurobiology, Duke University, Howard Hughes Medical Institute, Durham, NC 27710.
REFERENCES
- 1.Alexander GE, Crutcher MD. Functional architecture of basal ganglia circuits: neural substrates of parallel processing. Trends Neurosci. 1990;13:266–271. doi: 10.1016/0166-2236(90)90107-l. [DOI] [PubMed] [Google Scholar]
- 2.Alexander GE, DeLong MR, Strick PL. Parallel organization of functionally segregated circuits linking basal ganglia and cortex. Annu Rev Neurosci. 1986;9:357–381. doi: 10.1146/annurev.ne.09.030186.002041. [DOI] [PubMed] [Google Scholar]
- 3.Bottjer SW. The distribution of tyrosine hydroxylase immunoreactivity in the brains of male and female zebra finches. J Neurobiol. 1993;24:51–69. doi: 10.1002/neu.480240105. [DOI] [PubMed] [Google Scholar]
- 4.Bottjer SW, Alexander G. Localization of met-enkephalin and vasoactive intestinal polypeptide in the brains of male zebra finches. Brain Behav Evol. 1995;45:153–177. doi: 10.1159/000113547. [DOI] [PubMed] [Google Scholar]
- 5.Bottjer SW, Johnson F. Circuits, hormones, and learning: vocal behavior in songbirds. J Neurobiol. 1997;33:602–618. doi: 10.1002/(sici)1097-4695(19971105)33:5<602::aid-neu8>3.0.co;2-8. [DOI] [PubMed] [Google Scholar]
- 6.Bottjer SW, Miesner EA, Arnold AP. Forebrain lesions disrupt development but not maintenance of song in passerine birds. Science. 1984;224:901–903. doi: 10.1126/science.6719123. [DOI] [PubMed] [Google Scholar]
- 7.Bottjer SW, Halsema KA, Brown SA, Miesner EA. Axonal connections of a forebrain nucleus involved with vocal learning in zebra finches. J Comp Neurol. 1989;279:312–326. doi: 10.1002/cne.902790211. [DOI] [PubMed] [Google Scholar]
- 8.Bottjer SW, Brady JD, Walsh JP. Intrinsic and synaptic properties of neurons in the vocal-control nucleus lMAN from in vitro slice preparations of juvenile and adult zebra finches. J Neurobiol. 1998;37:642–658. [PubMed] [Google Scholar]
- 9.Brainard MS, Doupe AJ. Interruption of a basal ganglia-forebrain circuit prevents plasticity of learned vocalizations. Nature. 2000;404:762–766. doi: 10.1038/35008083. [DOI] [PubMed] [Google Scholar]
- 10.Casto JM, Ball GF. Characterization and localization of D1 dopamine receptors in the sexually dimorphic vocal control nucleus, area X, and the basal ganglia of European starlings. J Neurobiol. 1994;25:767–780. doi: 10.1002/neu.480250703. [DOI] [PubMed] [Google Scholar]
- 11.Farries MA, Perkel DJ. Electrophysiological properties of avian basal ganglia neurons recorded in vitro. J Neurophysiol. 2000;84:2502–2513. doi: 10.1152/jn.2000.84.5.2502. [DOI] [PubMed] [Google Scholar]
- 12.Gerfen CR. The neostriatal mosaic: multiple levels of compartmental organization. Trends Neurosci. 1992;15:133–139. doi: 10.1016/0166-2236(92)90355-c. [DOI] [PubMed] [Google Scholar]
- 13.Goller F, Suthers RA. Role of syringeal muscles in controlling the phonology of bird song. J Neurophysiol. 1996;76:287–300. doi: 10.1152/jn.1996.76.1.287. [DOI] [PubMed] [Google Scholar]
- 14.Graybiel AM. Neurotransmitters and neuromodulators in the basal ganglia. Trends Neurosci. 1990;13:244–254. doi: 10.1016/0166-2236(90)90104-i. [DOI] [PubMed] [Google Scholar]
- 15.Grisham W, Arnold AP. Distribution of GABA-like immunoreactivity in the song system of the zebra finch. Brain Res. 1994;651:115–122. doi: 10.1016/0006-8993(94)90686-6. [DOI] [PubMed] [Google Scholar]
- 16.Hessler NA, Doupe AJ. Singing-related neural activity in a dorsal forebrain–basal ganglia circuit of adult zebra finches. J Neurosci. 1999;19:10461–10481. doi: 10.1523/JNEUROSCI.19-23-10461.1999. [DOI] [PMC free article] [PubMed] [Google Scholar]
- 17.Hoover JE, Strick PL. The organization of cerebellar and basal ganglia outputs to primary motor cortex as revealed by retrograde transneuronal transport of herpes simplex virus type 1. J Neurosci. 1999;19:1446–1463. doi: 10.1523/JNEUROSCI.19-04-01446.1999. [DOI] [PMC free article] [PubMed] [Google Scholar]
- 18.Iyengar S, Viswanathan SS, Bottjer SW. Development of topography within song control circuitry of zebra finches during the sensitive period for song learning. J Neurosci. 1999;19:6037–6057. doi: 10.1523/JNEUROSCI.19-14-06037.1999. [DOI] [PMC free article] [PubMed] [Google Scholar]
- 19.Jiao Y, Medina L, Veenman CL, Toledo C, Puelles L, Reiner A. Identification of the anterior nucleus of the ansa lenticularis in birds as the homolog of the mammalian subthalamic nucleus. J Neurosci. 2000;20:6998–7010. doi: 10.1523/JNEUROSCI.20-18-06998.2000. [DOI] [PMC free article] [PubMed] [Google Scholar]
- 20.Johnson F, Sablan MM, Bottjer SW. Topographic organization of a forebrain pathway involved with vocal learning in zebra finches. J Comp Neurol. 1995;358:260–278. doi: 10.1002/cne.903580208. [DOI] [PubMed] [Google Scholar]
- 21.Kelly RM, Strick PL. Retrograde transneuronal transport of rabies virus through basal ganglia–thalamocortical circuits of primates. Soc Neurosci Abstr. 1999;25:1925. [Google Scholar]
- 22.Lewis JW, Ryan SM, Butcher LL, Arnold AP. Evidence for a catecholaminergic projection to area X in the zebra finch. J Comp Neurol. 1981;196:347–354. doi: 10.1002/cne.901960212. [DOI] [PubMed] [Google Scholar]
- 23.Livingston FS, Mooney R. Development of intrinsic and synaptic properties in a forebrain nucleus essential to avian song learning. J Neurosci. 1997;17:8997–9009. doi: 10.1523/JNEUROSCI.17-23-08997.1997. [DOI] [PMC free article] [PubMed] [Google Scholar]
- 24.Luo M, Perkel DJ. Long-range GABAergic projection in a circuit essential for vocal learning. J Comp Neurol. 1999a;403:68–84. [PubMed] [Google Scholar]
- 25.Luo M, Perkel DJ. A GABAergic, strongly inhibitory projection to a thalamic nucleus in the zebra finch song system. J Neurosci. 1999b;19:6700–6711. doi: 10.1523/JNEUROSCI.19-15-06700.1999. [DOI] [PMC free article] [PubMed] [Google Scholar]
- 26.Okuhata S, Saito N. Synaptic connections of thalamo-cerebral vocal nuclei of the canary. Brain Res Bull. 1987;18:35–44. doi: 10.1016/0361-9230(87)90031-1. [DOI] [PubMed] [Google Scholar]
- 27.Parent A, Hazrati L-N. Functional anatomy of the basal ganglia. I. The cortico-basal ganglia thalamo-cortical loop. Brain Res Rev. 1995;20:91–127. doi: 10.1016/0165-0173(94)00007-c. [DOI] [PubMed] [Google Scholar]
- 28.Perkel DJ, Farries MA. Complementary “bottom-up” and “top-down” approaches to basal ganglia function. Curr Opin Neurobiol. 2000;10:725–731. doi: 10.1016/s0959-4388(00)00156-2. [DOI] [PubMed] [Google Scholar]
- 29.Reiner A, Medina L, Veenman CL. Structural and functional evolution of the basal ganglia in vertebrates. Brain Res Rev. 1998;28:235–285. doi: 10.1016/s0165-0173(98)00016-2. [DOI] [PubMed] [Google Scholar]
- 30.Scharff C, Nottebohm F. A comparative study of the behavior deficits following lesions of various parts of the zebra finch song system: implications for vocal learning. J Neurosci. 1991;11:2896–2913. doi: 10.1523/JNEUROSCI.11-09-02896.1991. [DOI] [PMC free article] [PubMed] [Google Scholar]
- 31.Soha J, Shimizu T, Doupe AJ. Development of the catecholaminergic innervation of the song system of the male zebra finch. J Neurobiol. 1995;29:473–489. doi: 10.1002/(SICI)1097-4695(199604)29:4<473::AID-NEU5>3.0.CO;2-5. [DOI] [PubMed] [Google Scholar]
- 32.Sohrabji F, Nordeen EJ, Nordeen KW. Selective impairment of song learning following lesions of a forebrain nucleus in juvenile zebra finches. Behav Neural Biol. 1990;53:51–63. doi: 10.1016/0163-1047(90)90797-a. [DOI] [PubMed] [Google Scholar]
- 33.Solis MM, Doupe AJ. Anterior forebrain neurons develop selectivity by an intermediate stage of birdsong learning. J Neurosci. 1997;17:6447–6462. doi: 10.1523/JNEUROSCI.17-16-06447.1997. [DOI] [PMC free article] [PubMed] [Google Scholar]
- 34.Spiro JE, Dalva MB, Mooney R. Long-range inhibition with the zebra finch song nucleus RA can coordinate the firing of multiple projection neurons. J Neurophysiol. 1999;81:3007–3020. doi: 10.1152/jn.1999.81.6.3007. [DOI] [PubMed] [Google Scholar]
- 35.Vates GE, Nottebohm F. Feedback circuitry within a song-learning pathway. Proc Natl Acad Sci USA. 1995;92:5139–5143. doi: 10.1073/pnas.92.11.5139. [DOI] [PMC free article] [PubMed] [Google Scholar]
- 36.Vicario DS. Neuronal mechanisms of vocal production in songbirds. Curr Opin Neurobiol. 1991a;1:595–600. doi: 10.1016/s0959-4388(05)80034-0. [DOI] [PubMed] [Google Scholar]
- 37.Vicario DS. Organization of the zebra finch song control system: II. Functional organization of outputs from nucleus robustus archistriatalis. J Comp Neurol. 1991b;309:486–494. doi: 10.1002/cne.903090405. [DOI] [PubMed] [Google Scholar]


