

Abstract
Recent studies suggest that the degree of mitochondrial dysfunction in cerebral ischemia may be an important determinant of the final extent of tissue injury. Although loss of mitochondrial membrane potential (ψm), one index of mitochondrial dysfunction, has been documented in neurons exposed to ischemic conditions, it is not yet known whether astrocytes, which are relatively resistant to ischemic injury, experience changes in ψm under similar conditions. To address this, we exposed cortical astrocytes cultured alone or with neurons to oxygen–glucose deprivation (OGD) and monitored ψm using tetramethylrhodamine ethyl ester. Both neurons and astrocytes exhibited profound loss of ψm after 45–60 min of OGD. However, although this exposure is lethal to nearly all neurons, it is hours less than that needed to kill astrocytes. Astrocyte ψmwas rescued during OGD by cyclosporin A, a permeability transition pore blocker, and GN-nitro-arginine, a nitric oxide synthase inhibitor. Loss of mitochondrial membrane potential in astrocytes was not accompanied by depolarization of the plasma membrane. Recovery of astrocyte ψmafter reintroduction of O2 and glucose occurred over a surprisingly long period (>1 hr), suggesting that OGD caused specific, reversible changes in astrocyte mitochondrial physiology beyond the simple lack of O2 and glucose. Decreased ψm was associated with a cyclosporin A-sensitive loss of cytochrome c but not with activation of caspase-3 or caspase-9. Our data suggest that astrocyte mitochondrial depolarization could be a previously unrecognized event early in ischemia and that strategies that target the mitochondrial component of ischemic injury may benefit astrocytes as well as neurons.
Keywords: tetramethylrhodamine ethyl ester, mitochondrial permeability transition pore, nitric oxide synthase, cyclosporin A, confocal microscopy, cortical cell cultures
Mitochondrial dysfunction is an early feature in nervous system ischemia. Functional studies on mitochondria isolated from ischemic brain (Sims et al., 1986; Sims, 1991) and metabolic imaging studies of brain during ischemia (Watanabe et al., 1994; Shiino et al., 1998; McCleary et al., 1999; Shadid et al., 1999) indicate that brief periods of ischemia result in transient mitochondrial respiratory defects that normalize rapidly after reperfusion (Schutz et al., 1973; Hillered et al., 1984; Sims et al., 1986). Longer periods of ischemia, however, result in a secondary, irreversible decline in mitochondrial function that occurs minutes to hours later (for review, see Siesjo et al., 1999). Although mitochondrial failure is associated with loss of mitochondrial membrane potential (ψm) in many injury conditions (Green and Reed, 1998), it is not yet known whether impaired mitochondrial respiration during cerebral ischemia is accompanied by loss of ψm, because of the lack of sensitive and specific probes for ψm in the intact brain. Suggestive evidence comes from reports by Fujimura et al. (1998), Andreyev et al. (1998), and Perez-Pinzon et al. (1999), who observed release of cytochrome c from mitochondria rapidly after reperfusion, and from a study by Krajewski et al. (1999), who observed release of caspase-9, an intramitochondrial caspase, after global ischemia. In addition, loss of ψm has been directly demonstrated in hippocampal CA1 neurons exposed to oxygen–glucose deprivation (OGD) by the use of acute brain slice preparations (Bahar et al., 2000; Quick and Dugan, 2000).
The selective vulnerability of neurons to ischemic injury has been taken as an indication that neurons experience greater metabolic deterioration than do astrocytes, which are generally spared by the same ischemic insult. Furthermore, astrocytes contain glycogen stores that might be expected to buffer metabolic insults and help maintain mitochondrial function during ischemia. Extensive data indicate that astrocytes are critically involved in a number of processes that affect neuronal survival, such as glutamate uptake, maintenance of extracellular pH and potassium, Ca2+buffering, and transfer of lactate and/or pyruvate to neurons as energy substrates (Magistretti et al., 1993; Forsyth, 1996; Vernadakis, 1996;Anderson and Swanson, 2000; Walz, 2000). A number of these astrocyte-support functions are dependent on mitochondrial membrane potential, and many of these same functions are impaired early in the ischemic period (Benveniste et al., 1984; Montgomery, 1994; Juurlink, 1997). This led us to speculate that deterioration of astrocyte mitochondrial function, specifically loss of ψm, might occur quite early in ischemia.
In the present study we found that astrocytes experience early and pronounced, but reversible, loss of mitochondrial membrane potential in response to oxygen–glucose deprivation, which does not result in astrocyte cell death. We characterized the time course and pharmacology of astrocyte mitochondrial depolarization and looked at specific biochemical events related to the loss of astrocyte ψm induced by OGD. Our data suggest that decreased ψm in astrocytes during ischemia could contribute to the cascade of events leading to ischemic cell death.
Parts of this paper have been published previously in abstract form (Reichert et al., 2000).
MATERIALS AND METHODS
Reagents. Tetramethylrhodamine ethyl ester (TMRE), 5,5′,6,6′-tetrachloro-1,1′,3,3′-tetraethylbenzimidazolocarbocyanine iodide (JC-1), rhodamine 123, bis-(1,3-dibutylbarbituric acid)trimethine oxonol [DiBAC4(3)], and propidium iodide (PI) were purchased from Molecular Probes (Eugene, OR). FK506 (tacrolimus) was purchased from Boehringer Mannheim (Indianapolis, IN), and cyclosporin A (CsA) was purchased from Sigma (St. Louis, MO) or Calbiochem (La Jolla, CA). MK-801 and 2,3-dihydroxy-6-nitro-7-sulfamoyl-benzo(F)quinaoxaline (NBQX) were obtained from Research Biochemicals (Natick, MA), andGN-nitro-arginine, oligomycin, carbonyl cyanidep-(trifluoromethoxy)phenylhydrazone (FCCP), and rotenone came from Sigma. Minimal Essential Medium without glutamine was purchased from Life Technologies (11430-022; Gaithersburg, MD). Other reagents were obtained from standard suppliers.
Cortical cell cultures. Cortical astrocyte cultures and mixed cortical neuron astrocyte cocultures were prepared as described previously (Dugan et al., 1995a). Astrocyte cultures were prepared from postnatal day 0 (P0) to P3 mouse pups by plating cortical cell suspensions on Primaria (Falcon) 75 cm2flasks or 35 mm coverslip dishes (Mat-Tek) coated previously with poly-d-lysine and laminin. Mixed neuron–astrocyte cultures were prepared from fetal (embryonic day 15) Swiss-Webster mice (Charles River Laboratories, Wilmington, MA) by plating cortical cell suspensions onto a confluent bed of astrocytes. Cultures were treated with Ara-C (10 μm) 5–6 d after plating to inhibit proliferation of oligodendroglia and microglia. Cultures were fed biweekly with growth medium (Minimal Essential Medium plus 20 mm glucose, 26.2 mm NaHCO3, 10% horse serum, and 2 mml-glutamine), until the final feeding at day 11 or 12 in vitro, when the medium was exchanged with Minimal Essential Medium supplemented with 2 mml-glutamine. Astrocytes and mixed cultures were used for experiments ∼15 d after plating.
Oxygen–glucose deprivation. Combined oxygen–glucose deprivation was performed as described previously (Goldberg and Choi, 1993). Briefly, cells were placed in an anaerobic (<0.02% O2 and 5% CO2) environmental chamber (Forma Scientific), and the culture medium was exchanged with oxygenated, glucose-containing solution (for controls) or deoxygenated, glucose-free medium (for OGD groups). TMRE (100 nm) and all treatment drugs were included with the final medium exchange, i.e., at the onset of OGD. Control cultures were sealed immediately after the final exchange to retain O2 in the culture medium by placing a lid lined with Vaseline on the culture dish. OGD dishes were left unsealed. All cultures were then placed in the 37°C incubator within the anaerobic chamber for the duration of the experiment. OGD dishes were subsequently sealed with Vaseline at the end of the deprivation period. To study the role of nitric oxide synthase (NOS) in mitochondrial depolarization, cells were pretreated withGN-nitro-arginine (1 mm) for 4 hr, and thenGN-nitro-arginine (1 mm) was reapplied at the beginning of OGD. To determine the number of neurons and astrocytes killed by exposure to oxygen–glucose deprivation, propidium iodide (50 μg/ml final concentration) was added to cultures 24 hr after OGD, and the propidium iodide-positive astrocytes and neurons were counted using confocal microscopy to differentiate the cell layers.
Fluorescence imaging of mitochondrial membrane potential. To evaluate how TMRE fluorescence responded to changes in ψm in cortical astrocytes, cultures loaded with TMRE (100 nm) were exposed to mitochondrial-depolarizing agents including the complex I inhibitor rotenone (30 μm), rotenone plus the F0F1-ATPase inhibitor oligomycin (2.5 μg/ml), and the mitochondrial uncoupler FCCP (10 μm). TMRE fluorescence [excitation λ (Ex λ) of 568 nm and emission λ (Em λ) > 590 nm] in mitochondria was visualized on a confocal microscope (Noran Odyssey) equipped with a krypton–argon laser (488 and 568 nm emission lines), using a 40×, 1.4 numerical aperture Plan Apo oil-immersion objective (Nikon). To minimize photobleaching and other free radical dye reactions, laser intensity was minimized. To allow analysis of mitochondrial membrane potential in cultures during OGD, cultures were loaded with TMRE (100 nm) at the onset of OGD, culture dishes were then sealed with Vaseline before removal from the anaerobic chamber, and TMRE fluorescence in astrocyte mitochondria was assessed. Several fields per dish were selected at random by phase-contrast optics, and then fluorescence images were captured using MetaMorph imaging and analysis software. Fluorescence images were digitized at 640 × 480 pixels. Mitochondrial TMRE fluorescence was analyzed in images after background fluorescence was subtracted, using a mask function to eliminate nonmitochondrial pixels (determined as the background fluorescence in the cell nuclei). The average mitochondrial TMRE pixel intensity for each cell was then determined. JC-1 fluorescence was evaluated at Ex λ of 488 nm and Em λ > 525 nm (monomer) and Ex λ of 488 nm and Em λ > 590 nm (J-aggregates). Rhodamine 123 settings were Ex λ of 488 nm and Em λ > 515 nm. Imaging protocols similar to that described for TMRE were used for these dyes. Astrocyte plasma membrane potential was imaged by confocal microscopy using DiBAC4(3) (1 μm; excitation λ = 488 nm; emission λ = 515 nm) at the end of OGD.
Determination of cytochrome c release. Pure astrocyte cultures were exposed to OGD for 90–120 min until mitochondrial depolarization was observed in a sister culture used solely to monitor ψm. Astrocyte mitochondria were then isolated using a modification of the method described by Almeida and Medina (1997). Purity of the mitochondrial fraction was confirmed by assaying the enrichment in cytochrome oxidase activity (data not shown). Cells were washed with PBS, pH 7.4, harvested, and centrifuged at 700 × g for 5 min. The pellet was resuspended in isolation buffer (320 mm sucrose, 10 mm Tris-HCl, pH 7.2, and 1 mm EDTA-K+) and homogenized. Homogenates were centrifuged at 1500 × gfor 5 min twice. Supernatants collected from both centrifugations were centrifuged at 17,000 × g for 10 min at 4°C. The pellet (mitochondrial fraction) was resuspended in 200–300 μl of isolation buffer. The supernatant was further centrifuged at 200,000 × g for 30 min at 4°C to remove membranes. Cytochrome c was quantified in the mitochondrial and cytoplasmic fractions using a Quantikine M cytochrome c ELISA kit from R & D systems (Minneapolis, MN). A standard curve for cytochrome c was constructed using standards included in the kit. Because we expected relatively low concentrations of cytochrome c in the cytosol and wanted to increase our sensitivity for changes in cytosolic cytochrome c, the amount of protein analyzed for cytochrome c content in the cytosolic fractions was 2.5 times that of the mitochondrial fractions. The amount of protein per sample was determined using the BCA assay system (Pierce, Rockford, IL), and the concentration of cytochrome c was expressed as micrograms per milligram of protein.
Analysis of caspase-3 and caspase-9 activity. To assay caspase-3 and caspase-9 activity after OGD, astrocyte cultures grown in 100 mm dishes were exposed to 90–120 min of OGD or control conditions and harvested; some cultures were exposed to OGD and then returned to medium containing O2 and glucose for 1 hr before harvesting. Cells were washed twice with cold PBS, and after the final wash, 5 ml of cold PBS was added to each dish, and the cells were scraped and transferred to a 15 ml centrifuge tube for each sample. To rinse the dishes, 3 ml of cold PBS was used and added to the 15 ml tubes. Tubes were centrifuged at 2500 rpm for 10 min. The PBS was discarded, and the pellet was frozen at −80°C until use. Caspase-3 activity was assayed using an EnzChek Caspase-3 Assay Kit (Molecular Probes) as per the assay kit instructions. The assay plate was incubated for 30 min at room temperature, and fluorescence from cleavage of the substrate (Z-DEVD-R110) was measured on a microplate fluorescent reader (FL600, Bio-Tek), using excitation λ = 490 nm and emission λ = 520 nm.
Caspase-9 activity was determined using a mammalian ced-3 homolog 6/Caspase-9 Fluorometric Protease Assay Kit (Chemicon, Temecula, CA) as per the manufacturer's instructions. Cells were lysed in the lysis buffer included in the kit and then incubated on ice for 10 min. Fifty microliters of each sample were added to a microtiter plate, followed by addition of 2× reaction buffer containing 10 mm DTT to each sample. Finally, Leu-Glu-(oMe)-His-Asp(oMe)-7-amino-4-trifluoromethyl coumarin substrate was added, and the plate was incubated at 37°C for 1–2 hr. Fluorescence was read on a fluorescence microplate reader, using emission λ = 400 nm and emission λ = 505 nm. Caspase-appropriate inhibitors (included with each kit) were used to allow nonspecific cleavage of the fluorescent substrates to be subtracted.
RESULTS
Oxygen–glucose deprivation results in profound loss of astrocyte mitochondrial ψ
We used the potentiometric fluorescent compound TMRE to monitor astrocyte ψm. Both tetramethylrhodamine methyl ester (TMRM) and TMRE have been used to measure ψm (Andreyev et al., 1998; Bindokas et al., 1998), but it has become clear that their fluorescence response to mitochondrial depolarization differs considerably depending on the concentration of the probe used and to some extent on the relationship of the plasma membrane and mitochondrial membrane potentials (Ward et al., 2000). We therefore set out to establish optimal conditions for the use of TMRE in cortical astrocytes. Using TMRE at 100 nm, we observed a reproducible, graded, and time-dependent decrease in fluorescence after mitochondrial depolarization produced by rotenone, rotenone plus oligomycin, or FCCP (Fig. 1). Concentrations of TMRE >100 nm demonstrated fluorescence unquenching and increased fluorescence with mitochondrial depolarization, and concentrations lower than ∼50 nm produced insufficient fluorescence to detect sensitively changes in ψm without increasing laser intensity and subsequent phototoxicity. Although Ward et al. (2000) reported unquenching-mediated increases in fluorescence for TMRM at 100 nm, we failed to observe unquenching with this concentration of TMRE, possibly reflecting greater binding of TMRE to the mitochondrial matrix (Scaduto and Grotyohann, 1999) or unquenching that was more rapid than our earliest time point with FCCP (60 sec).
Fig. 1.
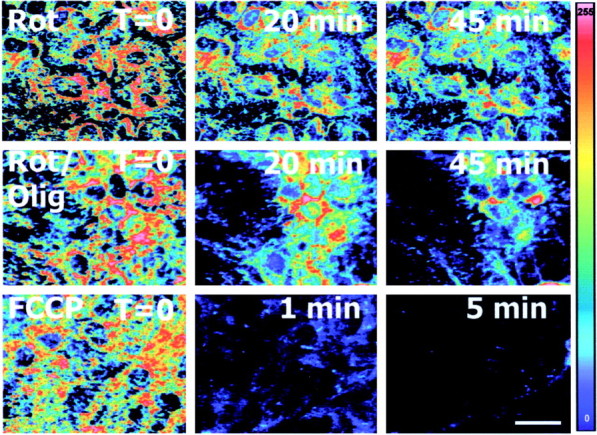
Mitochondrial depolarization results in a graded decline in TMRE fluorescence in astrocytes. Astrocytes were loaded with TMRE (100 nm) and exposed to the mitochondrial depolarizing agents rotenone (complex I inhibitor), rotenone plus oligomycin (F0F1-ATPase inhibitor), and FCCP (mitochondrial protonophore). TMRE fluorescence, reflecting mitochondrial membrane potential, was visualized by confocal microscopy. TMRE fluorescence decreased after rapid depolarization by FCCP or gradual depolarization by rotenone or rotenone plus oligomycin.Panels are pseudocolor representations of TMRE fluorescence intensity (scale on right). Scale bar, 20 μm. Olig, Oligomycin; Rot, rotenone.
We then used TMRE to evaluate ψm in cortical cultures exposed to OGD. Mixed cultures were exposed to OGD for periods ranging from 30 to 90 min in the presence of TMRE, and ψm was assessed in neurons and the underlying astrocytes using confocal microscopy. Exposure to 30 min of OGD had no effect on astrocyte or neuronal ψm, but 40–60 min of OGD produced a progressive decline in astrocyte ψm, with near-complete loss of ψm by 60 min of OGD (Fig.2A,B). Neuronal mitochondria were also uniformly depolarized by 60 min of OGD but demonstrated a more variable loss of ψmbetween 40 and 60 min of OGD, with depolarization generally, but not always, preceding the loss of ψm in astrocytes (data not shown). Using DiBAC4(3) to monitor astrocyte plasma membrane potential, we observed no change in plasma membrane potential after OGD (Fig. 3). Therefore, decreased TMRE fluorescence appears to reflect only changes in mitochondrial ψm in these experiments.
Fig. 2.

Mitochondrial membrane potential in cortical astrocytes exposed to OGD and subsequent reintroduction of oxygen and glucose. Mixed cortical cultures were exposed to OGD in the presence of the potentiometric dye TMRE. A, C, Mitochondrial ψ, as TMRE fluorescence, was evaluated in the astrocyte monolayer by confocal microscopy after 40, 50, or 60 min of OGD (A) or during recovery after reintroduction of oxygen and glucose after 60 min of OGD (C). Control cultures were maintained in 21% oxygen and 5.5 mm glucose for 60 min. B, D, The time course of mitochondrial TMRE fluorescence loss in astrocytes during OGD (B) and the recovery of mitochondrial ψ after readdition of oxygen and glucose (D) are shown. Dashed line inB indicates interpolation of TMRE fluorescence changes between 0 and 40 min. Values are mean TMRE fluorescence intensity (as % of control) ± SEM; n > 100 for all conditions from 3 or more independent experiments. *p< 0.05 by ANOVA and Tukey's post hoc analysis.E, Astrocytes were exposed to OGD (60 min) or OGD followed by reintroduction of oxygen plus glucose for an additional 60 or 120 min. Alterations in mitochondrial morphology, visualized by TMRE fluorescence, were apparent after OGD, persisted after reintroduction of O2 plus glucose for 60 min, but had resolved by 120 min after addition of O2 plus glucose. Scale bar: A, C, 20 μm. CTRL, Control; Rep, reperfusion.
Fig. 3.

Plasma membrane potential in astrocytes exposed to low K+ (1 mEq K), high K+ (30 mEq K), control, and OGD conditions (90–120 min) in the presence of DiBAC4(3) (1 μm), a plasma membrane potentiometric dye. Control cultures were maintained in 21% oxygen and 5.5 mm glucose for 90–120 min. A, DiBAC4(3) fluorescence was visualized by confocal microscopy (excitation λ = 488 nm, emission λ = 515 nm) at the end of OGD. B, There was no change in plasma membrane potential in astrocytes exposed to OGD compared with the control condition.
We confirmed OGD-induced loss of ψm with two other potentiometric dyes, JC-1 and rhodamine 123. Experiments with JC-1, a highly sensitive ratiometric probe for ψm, confirmed our observations with TMRE (data not shown). However, we found that JC-1 was less reliable than TMRE for our specific studies because, at the extremely low levels of ψm that we observed, both JC-1 aggregates and monomers are lost from mitochondria, giving artifactually high fluorescence ratios. Similar observations were made with rhodamine 123, but because of the prominent unquenching properties of this probe, we chose to use TMRE for subsequent experiments.
Loss of astrocyte ψm during OGD is blocked by inhibition of the mitochondrial permeability transition pore and NOS
We next determined the pharmacology of astrocyte mitochondrial depolarization. Cyclosporin A, an inhibitor of both calcineurin and the mitochondrial membrane permeability transition pore (mPTP), partially prevented the loss of astrocyte ψm (Table1). However, FK506 (tacrolimus), which inhibits calcineurin but not the mPTP (Connern and Halestrap, 1994), failed to rescue ψm, suggesting that activation of the mPTP contributes to the OGD-induced loss of ψm. The general nitric oxide inhibitor (GN-nitro-arginine) also partially rescued astrocyte ψm. Protection by combined treatment with CsA and the NOS inhibitor was not significantly better than that with either agent alone. No effect of CsA orGN-nitro-arginine on astrocyte ψm under control conditions was observed (Table 1). Neither the NMDA receptor antagonist MK-801 nor the general AMPA/kainate receptor antagonist NBQX affected the mitochondrial depolarization induced by OGD.
Table 1.
Pharmacology of OGD-induced loss of astrocyte mitochondrial Ψ at the end of OGD
| Condition | TMRE fluorescence Mean ± SEM (n) |
|---|---|
| Control (+O2, glc) | 100 ± 2 (376) |
| + CsA (10 μm) | 104 ± 12 (302) |
| + GN-Arg (1 mm)1-a | 91 ± 5 (30) |
| OGD | 29 ± 4 (274)1-b |
| + CsA (10 μm) | 55 ± 3 (238)1-b,1-c |
| +GN-Arg (1 mm)1-a | 64 ± 4 (187)1-b,1-c |
| + CsA +GN-Arg1-a | 76 ± 5 (73)1-c |
| + FK506 (200 ng/ml) | 31 ± 2 (49)1-b |
| + NBQX (30 μm) | 28 ± 4 (66)1-b |
| + MK (10 μm) | 34 ± 3 (39)1-b |
Cultures were exposed to OGD in the presence of the following drugs: the PTP inhibitor CsA, the calcineurin inhibitor FK506, the nitric oxide synthase inhibitorGN-nitro-arginine (GN-Arg), the NMDA antagonist MK-801 (MK), and the general AMPA/kainate receptor blocker NBQX. All treatments were initiated at the beginning of OGD, exceptGN-Arg, which was applied 24 hr before OGD (1 mm) and again at the beginning of OGD. CsA, but not FK506, partially reversed the loss of astrocyte Ψm, suggesting a role for the PTP in Ψm loss.GN-nitro-arginine also partially rescued astrocyte Ψm, and the combination of CsA andGN-Arg was slightly better than either drug alone. Values are mean TMRE fluorescence (% control) ± SEM. Groups were compared by ANOVA and Dunnett's post hocanalysis (p < 0.01). glc, Glucose.
GN-Arg (1 mm) was applied 4 hr before OGD and then reapplied at the beginning of OGD.
Significantly different from control.
Significantly different from OGD.
Recovery of astrocyte ψm after reintroduction of oxygen and glucose after OGD is a delayed process
If mitochondrial depolarization during OGD reflects the simple lack of glucose and oxygen, then readdition of the two metabolic substrates should allow rapid recovery of ψm. However, we found that when O2 and glucose were reintroduced to astrocytes after OGD, mitochondria required >1 hr to return to control levels of ψm (Fig.2C,D); mitochondrial membrane potential was still <50% of control values 30 min after “reperfusion” (readdition of O2 and glucose) and was still only 85% of controls at 1 hr. However, mitochondrial membrane potential returned to control values after an additional hour in O2 and glucose.
We also noted that the morphology of repolarized mitochondria often appeared abnormal, even 1 hr after readdition of O2 and glucose (Fig. 2E). Mitochondria were not obviously swollen, but there seemed to be a greater number of round “discrete” mitochondria with less filament-like structures and fewer intramitochondrial connections. These morphological changes also appeared to have resolved within 2–3 hr after reintroduction of O2 and glucose (Fig.2E). Taken together, these data suggest that OGD causes persistent (i.e., >1 hr) but reversible changes in astrocyte mitochondrial function and structure that are not attributable solely to lack of O2 and glucose.
Cytochrome c is lost from mitochondria during astrocyte mitochondrial depolarization
Loss of ψm has been associated with release of cytochrome c from mitochondria during the course of apoptotic cell death in many cell types (Green and Reed, 1998). However, it is unclear whether mitochondrial depolarization will lead to release of cytochrome c in cells that are not destined to die. To determine whether prolonged, but nonlethal (Fig.4), mitochondrial depolarization in astrocytes results in release of cytochrome c, we first confirmed that astrocytes cultured without neurons would undergo mitochondrial depolarization in response to OGD. We found that, although astrocytes grown in pure culture exhibited slower loss of ψm than did astrocytes cocultured with neurons (Fig. 5), the ultimate magnitude of ψm loss was similar whether astrocytes were cultured alone or with neurons. In addition, mitochondrial depolarization in pure astrocyte cultures was partially blocked by cyclosporin A (data not shown), mirroring our results in mixed cultures.
Fig. 4.

Determination of astrocyte and neuronal death after OGD in cortical cultures. Mixed cortical cultures were exposed to OGD or control conditions for 60 min and then returned to normoxic, glucose-containing solution for 24 hr (data not shown) or 48 hr. The number of dead neurons and astrocytes was determined by staining with propidium iodide, followed by confocal microscopy to allow stained cells in the astrocyte layer (left) to be differentiated from the neurons above (right). PI-positive astrocytes per well in a 24-well culture plate were 35 ± 12 astrocytes in OGD-exposed cultures and 33 ± 15 astrocytes in control cultures (from 4 to 8 wells from 3 independent replications), both of which exhibit <0.001% astrocyte death. Most neurons were dead 24 hr after OGD. Scale bar, 50 μm.
Fig. 5.
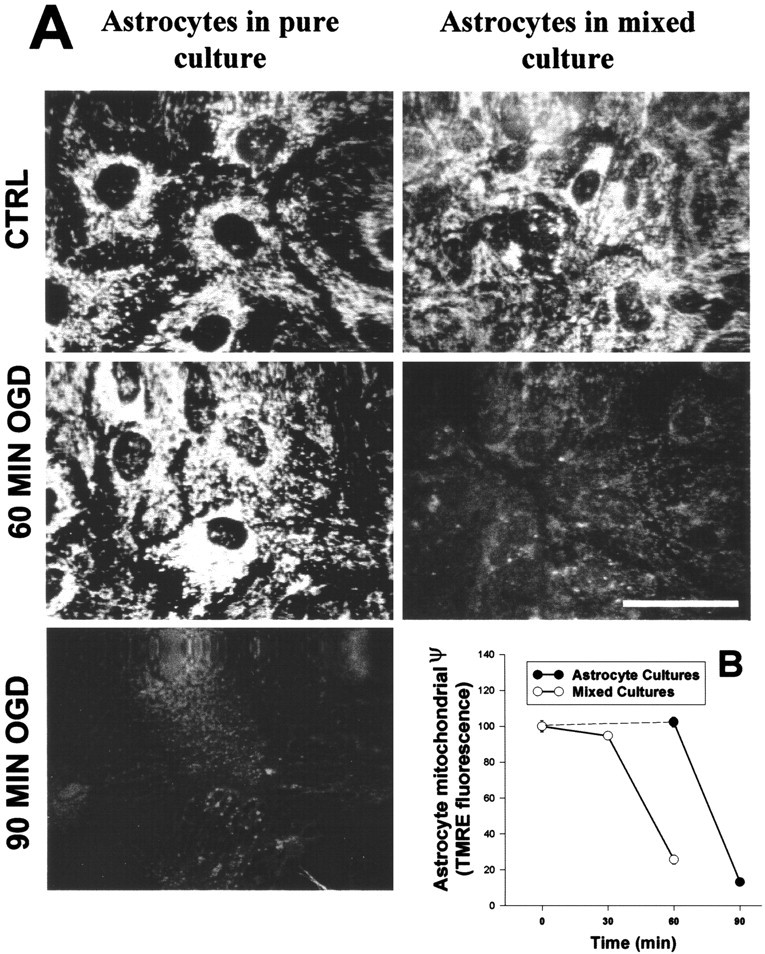
Comparison of OGD-induced mitochondrial depolarization in astrocytes cultured alone or cocultured with neurons.A, TMRE mitochondrial fluorescence was evaluated after 60 min of OGD in astrocytes cocultured with neurons (right) or after 60 and 90 min of OGD in astrocytes grown alone (left). The optical sectioning ability of the confocal allowed astrocyte mitochondrial fluorescence to be differentiated from that of the overlying neurons in mixed cultures. Astrocytes cultured alone showed delayed loss of ψm compared with astrocytes cultured with neurons. Scale bar, 20 μm. B, Quantitative analyses of mitochondrial TMRE fluorescence in the two culture types are shown. Values are mean TMRE fluorescence intensity (% of control) ± SEM; n > 50 cells from 3 independent experiments. In B, the dashed line represents interpolation of TMRE fluorescence in astrocytes between 0 and 60 min.
To determine whether prolonged mPTP-dependent loss of ψm would lead to translocation of cytochrome c in astrocytes exposed to OGD (cells that are not in the process of dying), we measured cytochrome c content in the mitochondria and cytosol. Using a “sentinel” culture loaded with TMRE to monitor ψm, we then exposed pure astrocyte cultures to OGD until ψm loss was observed. After mitochondrial depolarization was documented, astrocytes were harvested, and subcellular fractions were prepared. OGD caused a significant decrease in mitochondrial cytochrome c content that was blocked by treatment with CsA (Fig.6A). CsA did not significantly affect cytochrome c content in control cultures. Levels of cytochrome c in the cytosol at baseline were quite low, and no significant increase in cytosolic cytochrome c was observed after OGD (Fig. 6A). To determine whether cytochrome c loss from mitochondria continued to increase after reperfusion, cytochrome c was measured in astrocyte cultures that had been returned to normoxic glucose-containing medium for 1 hr after exposure to OGD for 60 min. We found that mitochondrial cytochrome c still trended toward lower values than did controls even 1 hr after readdition of O2 and glucose but showed greater variability at this time point than at the end of OGD. Regardless, these data indicate that extensive further release of mitochondrial cytochrome c after reintroduction of O2 and glucose does not occur. To observe cytochrome c release in astrocytes undergoing apoptosis, astrocytes were treated with 0.2 μmstaurosporine for 16 hr (Fig. 6B). Cytochrome c levels in mitochondria in staurosporine-treated cells were lower than those in control astrocyte cultures.
Fig. 6.

Cytochrome c loss from depolarized astrocyte mitochondria after OGD. Astrocytes were exposed to 90–120 min of OGD.A, After mitochondrial depolarization was observed, mitochondrial and cytosolic fractions were prepared and assayed for cytochrome c concentration. The left half of the graph shows cytochrome c concentration (per milligram of protein) in the mitochondrial fraction. The right half shows cytochrome c concentration in the cytosol. Values are the mean ± SEM; n = 4 independent replications for control and OGD only; 3 additional replications included CsA conditions (*p < 0.05, significantly different from control, and **p < 0.05, significantly different from OGD, by ANOVA and Tukey's post hoc analysis).B, Apoptosis in astrocyte cultures was initiated by staurosporine at 0.2 μm. Cytochrome c was measured as nanograms per milligram of protein as stated above. Mitochondrial cytochrome c levels are lower in staurosporine-treated cells.
Caspase-9 and caspase-3 are not activated despite cytochrome c release in astrocytes after OGD
Historically, release of cytochrome c from mitochondria has been associated with activation of caspase-9 and caspase-3 in in vitro, cell culture, and in vivo systems (for review, see Green and Reed, 1998). To determine whether loss of cytochrome c would activate caspase-3 or caspase-9 in cells not proceeding toward death, we assayed the activity of these two caspases in OGD-exposed astrocytes using fluorogenic substrates. No activation of either caspase was observed in astrocytes after exposure to OGD (Fig.7). Activity levels in astrocytes exposed to OGD showed a nonsignificant (p = 0.09) trend toward lower values, whereas we easily detected increased caspase-3 and caspase-9 activity in astrocyte cultures induced to undergo apoptosis by treatment with staurosporine (Fig. 7). To determine whether caspase-3 activation might be delayed after cytochrome c was released during OGD, we measured caspase-3 activity 1 and 2 hr after reperfusion but found no increase in caspase-3 activity at these later time points either (data not shown). Thus, although exposure to OGD results in release of cytochrome c from astrocyte mitochondria, activation of caspase-3 and caspase-9 is not initiated.
Fig. 7.

Activity of caspase-3 and caspase-9 in astrocytes exposed to OGD. Astrocytes were exposed to 90–120 min of OGD until mitochondrial depolarization was confirmed, and then astrocytes were harvested and assayed for caspase-9 (A) or caspase-3 (B) activity (% control) using fluorogenic substrates. No activation of either caspase was observed in astrocytes exposed to OGD. In contrast, caspase-3 and caspase-9 activation was easily observed in astrocytes undergoing apoptosis initiated by staurosporine at 0.2 μm. Values are the mean ± SEM. Error bars for astrocytes exposed to staurosporine and Boc-Asp(oMe)-CH2F (BAF) inA and B are not visible.Stauro, staurosporine.
DISCUSSION
This paper describes three novel findings. First, astrocytes exposed to a relatively brief period of oxygen–glucose deprivation experience profound and prolonged mitochondrial depolarization that is not associated with subsequent cell death. Neurons appear to accelerate this process. To our knowledge, this is one of a handful of reports indicating that nontransformed cells can experience an extended duration of mitochondrial depolarization without overt injury or death. We also found that loss of astrocyte ψm during OGD was mediated, in part, by opening of the mPTP and by NOS activity, providing the first direct evidence that the mPTP may contribute to astrocyte mitochondrial dysfunction under conditions of energy deprivation, suggesting that neuroprotection observed with CsA in CNS ischemia might reflect actions on astrocytes as well as neurons. Finally, we demonstrate that mitochondrial depolarization is accompanied by loss of cytochrome c from mitochondria without subsequent activation of caspase-3 and caspase-9. These data support the idea that astrocyte mitochondrial dysfunction may be an early feature of ischemia, despite the relative invulnerability of astrocytes to ischemic injury.
Using OGD in cortical cell cultures to model many of the metabolic aspects of ischemia, we found that astrocytes and neurons experience early mitochondrial depolarization, beginning 45 min after the onset of OGD and progressing to near-complete depolarization by 60 min of OGD. This 15–20 min period corresponds to the time window during which extracellular glutamate levels begin to rise and irreversible neuronal injury is initiated in this model (Goldberg and Choi, 1993; Bruno et al., 1994). However, injury to cortical neurons exposed to OGD is excitotoxic and mediated via NMDA receptors (Goldberg and Choi, 1993), and NMDA receptor activation can cause loss of ψm in the absence of OGD (Dugan et al., 1995b;Nieminen et al., 1996; Schinder et al., 1996; White and Reynolds, 1996). Mitochondrial depolarization in neurons during OGD may simply reflect this excitotoxic component of injury. In contrast, astrocytes are not injured by this duration of OGD; astrocyte death is not initiated until OGD is extended to 4 hr (Goldberg and Choi, 1993).
Mitochondrial depolarization in astrocytes precedes substantial loss of ATP. As reported previously, ATP levels were still 70% of control levels in cortical cultures exposed to 60 min of OGD (Bruno et al., 1994). Most of this ATP loss was likely to reflect energy depletion in neurons, rather than astrocytes, because neurons experienced collapse of their plasma membrane potential by 60 min of OGD, whereas astrocytes maintain their plasma membrane potential and tolerate an additional 2–3 hr of OGD without injury. Moreover, in the absence of OGD, astrocytes are clearly capable of using ATP to maintain ψm, running the F0F1-ATPase “in reverse” to support ψm. Inhibition of electron entry via complex I by rotenone caused only a minimal decrease in astrocyte ψm (Fig.1), whereas coapplication of rotenone and the F0F1-ATPase inhibitor oligomycin resulted in pronounced mitochondrial depolarization. Why astrocytes fail to use this compensatory mechanism during OGD is unclear, but taken together, these data raise the question of why astrocytes experience such early mitochondrial depolarization during OGD and whether neurons might, in fact, signal to astrocytes to initiate mitochondrial depolarization. This idea is supported by a growing body of literature describing extensive communication between neurons and astrocytes (Kimelberg and Norenberg, 1989; Magistretti et al., 1993; Giaume and McCarthy, 1996) and by our observation that astrocytes exposed to OGD in the absence of neurons required nearly twice as long to experience loss of ψm. Further studies will explore the possibility that communication between neurons and astrocytes is involved in early changes in astrocyte mitochondrial function during OGD.
Loss of astrocyte ψm during OGD involved the mPTP, a voltage-gated channel that allows molecules and ions with a mass of <1500 Da to pass through the mitochondrial membrane. Activation of the mPTP can lead to mitochondrial depolarization and in certain cell types to release of cytochrome c from mitochondria (Halestrap et al., 2000). Assembly of the mPTP is triggered by several stimuli, including fatty acids, accumulation of mitochondrial calcium, and oxidative stress, events that occur during ischemia–reperfusion injury. In astrocytes exposed to OGD, ψm was partly rescued by cyclosporin A. Inhibition of NOS also helped to maintain ψm during OGD, implicating NO/peroxynitrite in astrocyte mitochondrial depolarization. Cortical astrocytes have little inducible NOS (iNOS) expression at baseline, although they can be stimulated to express iNOS by cytokines (Hewett et al., 1994). Mitochondrial NOS (Giulivi et al., 1998) in astrocytes has not been definitively established because of the lack of specific probes for this nitric oxide-generating system. Both nitric oxide and peroxynitrite can inhibit mitochondrial metabolism and respiration at a number of points in the metabolic machinery (Brown and Borutaite, 1999). However, the combination ofGN-nitro-arginine and CsA was not significantly more effective than either agent alone, suggesting that peroxynitrite may be acting via opening of the mPTP to cause astrocyte mitochondrial depolarization (Scarlett et al., 1996). Additional processes, such as activation of mitochondrial-uncoupling proteins, may contribute to mitochondrial depolarization. Involvement of glutamate receptor-mediated calcium entry and direct uncoupling by Ca2+ are unlikely because the AMPA/kainate receptor antagonist NBQX had no effect on ψmloss.
Numerous studies have shown that mitochondrial depolarization is linked to translocation of cytochrome c from mitochondria to the cytosol (seeGreen and Reed, 1998). However, this association is not universal (Bossy-Wetzel et al., 1998; Krohn et al., 1999) and has been studied primarily in cells undergoing apoptotic death. Activation of the mPTP can also initiate release of cytochrome c from mitochondria (Halestrap et al., 2000). We observed a 20% loss of cytochrome c from mitochondria at the end of OGD that was partly blocked by CsA, suggesting involvement of the mPTP. Release of cytochrome c was not accompanied by activation of either caspase-9 or caspase-3, suggesting that cytochrome c was blocked from activating procaspase-9. Surprisingly, loss of cytochrome c from mitochondria was not accompanied by significant accumulation in the cytoplasm. We speculate that this reflects rapid modification and/or degradation of cytochrome c after its release, as has been proposed previously (Neame et al., 1998; Putcha et al., 2000). In the latter study, release of cytochrome c was sufficient to activate caspase-3 but did not result in a detectable increase in cytoplasmic cytochrome c at any time point. The mechanism(s) by which cytochrome c is cleared from the cytosol after release from mitochondria remains to be determined. Studies on purified cytochrome c have shown that the oxidation state of the cytochrome (Wang and Kallenbach, 1998) and the interaction of the protein with anionic lipids (deJhong et al., 1995) can enhance its susceptibility to proteolysis, but whether either of these factors contributes to removal of cytochrome c from the cytoplasm will need to be established. Regardless, determining how cells terminate such potentially proapoptotic signals is likely to be an important area for future study.
Loss of mitochondrial ψm during OGD produced persistent but reversible changes in astrocyte mitochondrial structure and function. Although ψm eventually recovered to control levels, normalization required more than an hour, suggesting persistent inhibition of the electron transport chain or loss of critical metabolic intermediates, such as adenine nucleotides (Sims, 1991). Ultrastructural changes in mitochondria including swelling and a decrease in the syncytial nature of astrocyte mitochondria were observed after OGD plus reperfusion and required ∼2 hr to reverse. These ultrastructural changes after OGD plus reperfusion may correspond to the mitochondrial swelling and matrix alterations reported in early postischemic brain by electron microscopy (Petito and Babiak, 1982), suggesting that derangements in mitochondrial function during ischemia may occur in both astrocytes and neurons.
Depolarization of astrocyte mitochondria during OGD might have both beneficial and harmful effects on neuronal survival. Short-term loss of ψm would allow astrocytes to shift use of glycogen and glucose temporarily away from aerobic metabolism to glycolysis, increasing the amount of lactate available for delivery to metabolically impaired neurons. This might be tolerated for as long as astrocyte glycogen stores were available. However, prolonged loss of ψm in astrocytes might be expected to have injury-promoting effects during CNS ischemia. Astrocytes are involved in the normal maintenance of brain homeostasis, including several energy-dependent functions necessary for normal neuronal activity, e.g., regulation of extracellular K+, pH, and osmolality, export of metabolic intermediates, and rapid uptake of neurotransmitters (Kimelberg and Norenberg, 1989; Magistretti et al., 1993; Walz, 2000). The ability of astrocytes to maintain these functions may, in fact, be a critical determinant of neuronal survival after ischemia (Juurlink, 1997; Stanimirovic et al., 1997; Aschner et al., 1999; Marrif and Juurlink, 1999). Loss of ψm and eventual energy failure in astrocytes might lead to an inability to provide these critical support functions during ischemia, thus exacerbating ischemic injury to neurons.
In summary, our data suggest that astrocyte mitochondrial dysfunction may be a relatively unexplored but important early step in the cascade of events involved in ischemic injury. In light of recent studies showing neuroprotection by CsA in in vivo models of ischemia (Siesjo et al., 1999), our data indicate that astrocytes, in addition to neurons, might be therapeutic targets of CsA neuroprotection. In addition, in agreement with studies suggesting that astrocytes may be as vulnerable as neurons to ischemic injury in certain brain regions, we speculate that astrocyte mitochondrial depolarization might contribute to astrocyte death during ischemia. Finally, astrocytes exposed to OGD may provide a model system in which to study aspects of mitochondrial dysfunction that are not specifically involved in cell death.
Footnotes
This work was supported by National Institutes of Health Grant NS 32636 (L.L.D.).
S.A.R. and J.S.K.-H. contributed equally to this work.
Correspondence should be addressed to Dr. Laura L. Dugan, Department of Neurology, 660 South Euclid Avenue (Box 8111), Washington University School of Medicine, St. Louis, MO 63110. E-mail:duganl@neuro.wustl.edu.
REFERENCES
- 1.Almeida A, Medina JM. Isolation and characterization of tightly coupled mitochondria from neurons and astrocytes in primary culture. Brain Res. 1997;764:167–172. doi: 10.1016/s0006-8993(97)00453-8. [DOI] [PubMed] [Google Scholar]
- 2.Anderson CM, Swanson RA. Astrocyte glutamate transport: review of properties, regulation, and physiological functions. Glia. 2000;32:1–14. [PubMed] [Google Scholar]
- 3.Andreyev AY, Fahy B, Fiskum G. Cytochrome c release from brain mitochondria is independent of the mitochondrial permeability transition. FEBS Lett. 1998;439:373–376. doi: 10.1016/s0014-5793(98)01394-5. [DOI] [PubMed] [Google Scholar]
- 4.Aschner M, Allen JW, Kimelberg HK, LoPachin RM, Streit WJ. Glial cells in neurotoxicity development. Annu Rev Pharmacol Toxicol. 1999;39:151–173. doi: 10.1146/annurev.pharmtox.39.1.151. [DOI] [PubMed] [Google Scholar]
- 5.Bahar S, Fayuk D, Somjen GG, Aitken PG, Turner DA. Mitochondrial and intrinsic optical signals imaged during hypoxia and spreading depression in rat hippocampal slices. J Neurophysiol. 2000;84:311–324. doi: 10.1152/jn.2000.84.1.311. [DOI] [PubMed] [Google Scholar]
- 6.Benveniste H, Drejer J, Schousboe A, Diemer NH. Elevation of the extracellular concentrations of glutamate and aspartate in rat hippocampus during transient cerebral ischemia monitored by intracerebral microdialysis. J Neurochem. 1984;43:1369–1374. doi: 10.1111/j.1471-4159.1984.tb05396.x. [DOI] [PubMed] [Google Scholar]
- 7.Bindokas VP, Lee CC, Colmers WF, Miller RJ. Changes in mitochondrial function resulting from synaptic activity in the rat hippocampal slice. J Neurosci. 1998;18:4570–4587. doi: 10.1523/JNEUROSCI.18-12-04570.1998. [DOI] [PMC free article] [PubMed] [Google Scholar]
- 8.Bossy-Wetzel E, Newmeyer DD, Green DR. Mitochondrial cytochrome c release in apoptosis occurs upstream of DEVD-specific caspase activation and independently of mitochondrial transmembrane depolarization. EMBO J. 1998;17:37–49. doi: 10.1093/emboj/17.1.37. [DOI] [PMC free article] [PubMed] [Google Scholar]
- 9.Brown GC, Borutaite V. Nitric oxide, cytochrome c and mitochondria. Biochem Soc Symp. 1999;66:17–25. doi: 10.1042/bss0660017. [DOI] [PubMed] [Google Scholar]
- 10.Bruno VMG, Goldberg MP, Dugan LL, Giffard RG, Choi DW. The effect of hypothermia on oxygen-glucose deprivation and excitatory amino acid induced injury in cortical cultures. J Neurochem. 1994;63:1398–1406. doi: 10.1046/j.1471-4159.1994.63041398.x. [DOI] [PubMed] [Google Scholar]
- 11.Connern CP, Halestrap AP. Recruitment of mitochondrial cyclophilin to the mitochondrial inner membrane under conditions of oxidative stress that enhance the opening of a calcium-sensitive non-specific channel. Biochem J. 1994;302:321–324. doi: 10.1042/bj3020321. [DOI] [PMC free article] [PubMed] [Google Scholar]
- 12.deJhong HH, Ritsema T, Killian JA. Lipid specificity for membrane mediated partial unfolding of cytochrome c. FEBS Lett. 1995;360:255–260. doi: 10.1016/0014-5793(95)00115-p. [DOI] [PubMed] [Google Scholar]
- 13.Dugan LL, Bruno VMG, Amagasu SM, Giffard RG. Glia modulate the response of murine cortical neurons to excitotoxicity: glia exacerbate AMPA neurotoxicity. J Neurosci. 1995a;15:4545–4555. doi: 10.1523/JNEUROSCI.15-06-04545.1995. [DOI] [PMC free article] [PubMed] [Google Scholar]
- 14.Dugan LL, Sensi SL, Canzoniero LMT, Handran SD, Rothman SM, Lin T-S, Goldberg MP, Choi DW. Mitochondrial production of reactive oxygen species in cortical neurons following exposure to N-methyl-d-aspartate. J Neurosci. 1995b;15:6377–6388. doi: 10.1523/JNEUROSCI.15-10-06377.1995. [DOI] [PMC free article] [PubMed] [Google Scholar]
- 15.Forsyth RJ. Astrocytes and the delivery of glucose from plasma to neurons. Neurochem Int. 1996;28:231–241. doi: 10.1016/0197-0186(95)00094-1. [DOI] [PubMed] [Google Scholar]
- 16.Fujimura M, Morita-Fujimura Y, Murakami K, Kawase M, Chan PH. Cytosolic redistribution of cytochrome c after transient focal cerebral ischemia in rats. J Cereb Blood Flow Metab. 1998;18:1239–1247. doi: 10.1097/00004647-199811000-00010. [DOI] [PubMed] [Google Scholar]
- 17.Giaume C, McCarthy KD. Control of gap-junctional communication in astrocytic networks. Trends Neurosci. 1996;19:319–325. doi: 10.1016/0166-2236(96)10046-1. [DOI] [PubMed] [Google Scholar]
- 18.Giulivi C, Poderoso JJ, Boveris A. Production of nitric oxide by mitochondria. J Biol Chem. 1998;273:11038–11043. doi: 10.1074/jbc.273.18.11038. [DOI] [PubMed] [Google Scholar]
- 19.Goldberg MP, Choi DW. Combined oxygen and glucose deprivation in cortical culture: calcium-dependent and calcium-independent mechanisms of neuronal injury. J Neurosci. 1993;13:3510–3524. doi: 10.1523/JNEUROSCI.13-08-03510.1993. [DOI] [PMC free article] [PubMed] [Google Scholar]
- 20.Green DR, Reed JC. Mitochondria and apoptosis. Science. 1998;281:1309–1312. doi: 10.1126/science.281.5381.1309. [DOI] [PubMed] [Google Scholar]
- 21.Halestrap AP, Doran E, Gillespie JP, O'Toole A. Mitochondria and cell death. Biochem Soc Trans. 2000;28:170–177. doi: 10.1042/bst0280170. [DOI] [PubMed] [Google Scholar]
- 22.Hewett SJ, Csernansky CA, Choi DW. Selective potentiation of NMDA-induced neuronal injury following induction of astrocytic iNOS. Neuron. 1994;13:487–494. doi: 10.1016/0896-6273(94)90362-x. [DOI] [PubMed] [Google Scholar]
- 23.Hillered L, Siesjo BK, Arfors KE. Mitochondrial response to transient forebrain ischemia and recirculation in the rat. J Cereb Blood Flow Metab. 1984;4:438–446. doi: 10.1038/jcbfm.1984.63. [DOI] [PubMed] [Google Scholar]
- 24.Juurlink BH. Response of glial cells to ischemia: roles of reactive oxygen species and glutathione. Neurosci Biobehav Rev. 1997;21:151–166. doi: 10.1016/s0149-7634(96)00005-x. [DOI] [PubMed] [Google Scholar]
- 25. Kimelberg HK, Norenberg MD. Astrocytes. Sci Am 260 1989. 66 72, 74, 76. [DOI] [PubMed] [Google Scholar]
- 26.Krajewski S, Krajewska M, Ellerby LM, Welsh K, Xie Z, Deveraux QL, Salvesen GS, Bredesen DE, Rosenthal RE, Fiskum G, Reed JC. Release of caspase-9 from mitochondria during neuronal apoptosis and cerebral ischemia. Proc Natl Acad Sci USA. 1999;96:5752–5757. doi: 10.1073/pnas.96.10.5752. [DOI] [PMC free article] [PubMed] [Google Scholar]
- 27.Krohn AJ, Wahlbrink T, Prehn JH. Mitochondrial depolarization is not required for neuronal apoptosis. J Neurosci. 1999;19:7394–7404. doi: 10.1523/JNEUROSCI.19-17-07394.1999. [DOI] [PMC free article] [PubMed] [Google Scholar]
- 28.Magistretti PJ, Sorg O, Yu N, Martin JL, Pellerin L. Neurotransmitters regulate energy metabolism in astrocytes: implications for the metabolic trafficking between neural cells. Dev Neurosci. 1993;15:306–312. doi: 10.1159/000111349. [DOI] [PubMed] [Google Scholar]
- 29.Marrif H, Juurlink BH. Astrocytes respond to hypoxia by increasing glycolytic capacity. J Neurosci Res. 1999;57:255–260. doi: 10.1002/(SICI)1097-4547(19990715)57:2<255::AID-JNR11>3.0.CO;2-6. [DOI] [PubMed] [Google Scholar]
- 30.McCleary AJ, Gower S, McGoldrick JP, Berridge J, Gough MJ. Does hypothermia prevent cerebral ischaemia during cardiopulmonary bypass? Cardiovasc Surg. 1999;7:425–431. doi: 10.1016/s0967-2109(98)00166-5. [DOI] [PubMed] [Google Scholar]
- 31.Montgomery DL. Astrocytes: form, functions, and roles in disease. Vet Pathol. 1994;31:145–167. doi: 10.1177/030098589403100201. [DOI] [PubMed] [Google Scholar]
- 32.Neame SJ, Rubin LL, Philpott KL. Blocking cytochrome c activity within intact neurons inhibits apoptosis. J Cell Biol. 1998;142:1583–1593. doi: 10.1083/jcb.142.6.1583. [DOI] [PMC free article] [PubMed] [Google Scholar]
- 33.Nieminen AL, Petrie TG, Lemasters JJ, Selman WR. Cyclosporin A delays mitochondrial depolarization induced by N-methyl-d-aspartate in cortical neurons: evidence of the mitochondrial permeability transition. Neuroscience. 1996;75:993–997. doi: 10.1016/0306-4522(96)00378-8. [DOI] [PubMed] [Google Scholar]
- 34.Perez-Pinzon MA, Xu GP, Born J, Lorenzo J, Busto R, Rosenthal M, Sick TJ. Cytochrome C is released from mitochondria into the cytosol after cerebral anoxia or ischemia. J Cereb Blood Flow Metab. 1999;19:39–43. doi: 10.1097/00004647-199901000-00004. [DOI] [PubMed] [Google Scholar]
- 35.Petito CK, Babiak T. Early proliferative changes in astrocytes in postischemic noninfarcted rat brain. Ann Neurol. 1982;11:510–518. doi: 10.1002/ana.410110511. [DOI] [PubMed] [Google Scholar]
- 36.Putcha GV, Deshmukh M, Johnson EM., Jr Inhibition of apoptotic signaling cascades causes loss of trophic factor dependence during neuronal maturation. J Cell Biol. 2000;149:1011–1018. doi: 10.1083/jcb.149.5.1011. [DOI] [PMC free article] [PubMed] [Google Scholar]
- 37.Quick KL, Dugan LL. Characterization of mitochondrial membrane potential alterations in an acute slice model of hypoxia-ischemia. J Neurotrauma. 2000;17:941. [Google Scholar]
- 38.Reichert SA, Kim-Han JS, Dugan LL. Astrocytes tolerate prolonged loss of mitochondrial membrane potential induced by oxygen-glucose deprivation. J Neurotrauma. 2000;17:962. [Google Scholar]
- 39.Scaduto RC, Jr, Grotyohann LW. Measurement of mitochondrial membrane potential using fluorescent rhodamine derivatives. Biophys J. 1999;76:469–477. doi: 10.1016/S0006-3495(99)77214-0. [DOI] [PMC free article] [PubMed] [Google Scholar]
- 40.Scarlett JL, Packer MA, Porteous CM, Murphy MP. Alterations to glutathione and nicotinamide nucleotides during the mitochondrial permeability transition induced by peroxynitrite. Biochem Pharmacol. 1996;52:1047–1055. doi: 10.1016/0006-2952(96)99426-5. [DOI] [PubMed] [Google Scholar]
- 41.Schinder AF, Olson EC, Spitzer NC, Montal M. Mitochondrial dysfunction is a primary event in glutamate neurotoxicity. J Neurosci. 1996;16:6125–6133. doi: 10.1523/JNEUROSCI.16-19-06125.1996. [DOI] [PMC free article] [PubMed] [Google Scholar]
- 42.Schutz H, Silverstein PR, Vapalahti M, Bruce DA, Mela L, Langfitt TW. Brain mitochondrial function after ischemia and hypoxia. II. Normotensive systemic hypoxemia. Arch Neurol. 1973;29:417–419. doi: 10.1001/archneur.1973.00490300079010. [DOI] [PubMed] [Google Scholar]
- 43.Shadid M, Hiltermann L, Monteiro L, Fontijn J, Van Bel F. Near infrared spectroscopy-measured changes in cerebral blood volume and cytochrome aa3 in newborn lambs exposed to hypoxia and hypercapnia, and ischemia: a comparison with changes in brain perfusion and O2 metabolism. Early Hum Dev. 1999;55:169–182. doi: 10.1016/s0378-3782(99)00024-9. [DOI] [PubMed] [Google Scholar]
- 44.Shiino A, Matsuda M, Handa J, Chance B. Poor recovery of mitochondrial redox state in CA1 after transient forebrain ischemia in gerbils. Stroke. 1998;29:2421–2424. doi: 10.1161/01.str.29.11.2421. [DOI] [PubMed] [Google Scholar]
- 45.Siesjo BK, Elmer E, Janelidze S, Keep M, Kristian T, Ouyang YB, Uchino H. Role and mechanisms of secondary mitochondrial failure. Acta Neurochir Suppl (Wien) 1999;73:7–13. doi: 10.1007/978-3-7091-6391-7_2. [DOI] [PubMed] [Google Scholar]
- 46.Sims NR. Selective impairment of respiration in mitochondria isolated from brain subregions following transient forebrain ischemia in the rat. J Neurochem. 1991;56:1836–1844. doi: 10.1111/j.1471-4159.1991.tb03438.x. [DOI] [PubMed] [Google Scholar]
- 47.Sims NR, Finegan JM, Blass JP. Effects of postdecapitative ischemia on mitochondrial respiration in brain tissue homogenates. J Neurochem. 1986;47:506–511. doi: 10.1111/j.1471-4159.1986.tb04530.x. [DOI] [PubMed] [Google Scholar]
- 48.Stanimirovic DB, Ball R, Durkin JP. Glutamate uptake and Na,K-ATPase activity in rat astrocyte cultures exposed to ischemia. Acta Neurochir Suppl (Wien) 1997;70:1–3. doi: 10.1007/978-3-7091-6837-0_1. [DOI] [PubMed] [Google Scholar]
- 49.Vernadakis A. Glia-neuron intercommunications and synaptic plasticity. Prog Neurobiol. 1996;49:185–214. doi: 10.1016/s0301-0082(96)00012-3. [DOI] [PubMed] [Google Scholar]
- 50.Walz W. Role of astrocytes in the clearance of excess extracellular potassium. Neurochem Int. 2000;36:291–300. doi: 10.1016/s0197-0186(99)00137-0. [DOI] [PubMed] [Google Scholar]
- 51.Wang L, Kallenbach NR. Proteolysis as a measure of the free energy difference between cytochrome c and its derivatives. Protein Sci. 1998;7:2460–2464. doi: 10.1002/pro.5560071124. [DOI] [PMC free article] [PubMed] [Google Scholar]
- 52.Ward MW, Rego AC, Frenguelli BG, Nicholls DG. Mitochondrial membrane potential and glutamate excitotoxicity in cultured cerebellar granule cells. J Neurosci. 2000;20:7208–7219. doi: 10.1523/JNEUROSCI.20-19-07208.2000. [DOI] [PMC free article] [PubMed] [Google Scholar]
- 53.Watanabe M, Harada N, Kosaka H, Shiga T. Intravital microreflectometry of individual pial vessels and capillary region of rat. J Cereb Blood Flow Metab. 1994;14:75–84. doi: 10.1038/jcbfm.1994.12. [DOI] [PubMed] [Google Scholar]
- 54.White RJ, Reynolds IJ. Mitochondrial depolarization in glutamate-stimulated neurons: an early signal specific to excitotoxin exposure. J Neurosci. 1996;16:5688–5697. doi: 10.1523/JNEUROSCI.16-18-05688.1996. [DOI] [PMC free article] [PubMed] [Google Scholar]