

Abstract
Amphetamine (AMPH) is known to raise extracellular dopamine (DA) levels by inducing stimulation-independent DA efflux via reverse transport through the DA transporter and by inhibiting DA re-uptake. In contrast, recent studies indicate that AMPH decreases stimulation-dependent vesicular DA release. One candidate mechanism for this effect is the AMPH-mediated redistribution of DA from vesicles to the cytosol. In addition, the inhibition of stimulation-dependent release may occur because of D2 autoreceptor activation by DA that is released via reverse transport. We used the D2 receptor antagonist sulpiride and mice lacking the D2 receptor to address this issue. To evaluate carefully AMPH effects on release and uptake, we recorded stimulated DA overflow in striatal slices by using continuous amperometry and cyclic voltammetry. Recordings were fit by a random walk simulation of DA diffusion, including uptake with Michaelis–Menten kinetics, that provided estimates of DA concentration and uptake parameters. AMPH (10 μm) promoted the overflow of synaptically released DA by decreasing the apparent affinity for DA uptake (Km increase from 0.8 to 32 μm). The amount of DA released per pulse, however, was decreased by 82%. This release inhibition was prevented partly by superfusion with sulpiride (47% inhibition) and was reduced in D2 mutant mice (23% inhibition). When D2 autoreceptor activation was minimal, the combined effects of AMPH on DA release and uptake resulted in an enhanced overflow of exocytically released DA. Such enhancement of stimulation-dependent DA overflow may occur under conditions of low D2 receptor activity or expression, for example as a result of AMPH sensitization.
Keywords: dopamine, amphetamine, uptake, amperometry, cyclic voltammetry, D2 receptor, sensitization
The reinforcing properties of amphetamine (AMPH) are linked to its capacity to elevate extracellular dopamine (DA) levels. Like other psychostimulants, AMPH inhibits DA re-uptake (Parker and Cubeddu, 1988; Wieczorek and Kruk, 1994; Jones et al., 1999). In addition, AMPH and its derivatives promote nonvesicular DA efflux by reverse transport through monoamine uptake transporters (Fischer and Cho, 1979; Raiteri et al., 1979; Sulzer et al., 1993,1995; Jones et al., 1998).
In contrast to these DA-elevating actions, AMPH has been found to decrease stimulation-dependent DA release that is attributable to synaptic vesicle exocytosis (Kuhr et al., 1985; Wieczorek and Kruk, 1994; Jones et al., 1998). One mechanism by which AMPH causes decreased vesicular release has been identified. As a lipophilic weak base and a substrate for the vesicular monoamine transporter, AMPH promotes the redistribution of DA from synaptic vesicles to the cytosol by collapsing the vesicular pH gradient (Sulzer and Rayport, 1990). Thus, AMPH reduces the number of DA molecules released per vesicle (quantal size), as shown by amperometric recordings from PC12 cells (Sulzer et al., 1995), invertebrate neurons (Anderson et al., 1998), and chromaffin cells (Mundorf et al., 1999).
In addition, AMPH may inhibit vesicular release by activating D2 autoreceptors indirectly (Herdon et al., 1987; Palij et al., 1990;Kennedy et al., 1992; Cragg and Greenfield, 1997; L'hirondel et al., 1998) after reverse transport of DA (Wieczorek and Kruk, 1994; Iravani and Kruk, 1995). D2 autoreceptor activation regulates potassium channels (Uchimura et al., 1986; Lacey et al., 1987) and voltage-dependent calcium channels (Cardozo and Bean, 1995), which in turn regulate the probability of exocytic DA release.
Despite these indications for an inhibitory action of AMPH on exocytic DA release, in vivo and in vitro studies on DA overflow (the result of DA release and re-uptake) reported that AMPH can enhance stimulation-dependent DA overflow (Gonon, 1988; Dugast et al., 1994; Iravani and Kruk, 1995). Additionally, after drug sensitization, an enhancement of calcium-dependent DA overflow in response to AMPH was found (Pierce and Kalivas, 1997b).
These inconsistent findings may be attributable to a difficulty in distinguishing between the effects on DA release and uptake. Enhanced DA overflow may result from increased DA release, or decreased uptake, or a combination of both. In the present study we therefore used two electrochemical methods (Michael and Wightman, 1999), amperometry and cyclic voltammetry (CV), to estimate carefully the effects of AMPH on stimulated DA release and re-uptake in striatal slices. A random walk simulation of DA diffusion that was corrected for uptake according to Michaelis–Menten kinetics provided estimates of DA release and uptake parameters before and after AMPH superfusion for both recording methods. The role of D2 autoreceptors in the response to AMPH was studied in wild-type mice in the presence of the D2/D3 antagonist sulpiride and in mice lacking the D2 receptor [D2 knock-out (KO) mice]. The data indicate that the activity of D2 autoreceptors has an important impact on the effectiveness of AMPH in promoting stimulation-dependent DA overflow.
MATERIALS AND METHODS
Animals and striatal slice preparation. We used D2 receptor KO mice and their wild-type littermates (Jung et al., 1999). These animals had either a C57BL/6×129Sv mixed genetic or a congenic C57BL/6 background. There were no differences with respect to DA release and re-uptake between the two different genetic backgrounds (data not shown).
Mice were anesthetized with ketamine/xylazine and decapitated. Striatal brain slices were cut on a vibratome at 300 μm thickness. Recordings were obtained from the second to fourth frontal slice of caudate putamen [bregma, +1.54 to +0.62 mm (Franklin and Paxinos, 1997); see Fig. 1a]. Slices were allowed to recover for 1 hr in a holding chamber in oxygenated artificial CSF (aCSF) at room temperature and then were placed in a recording chamber and superfused (1 ml/min) with aCSF [containing (in mm): 125 NaCl, 2.5 KCl, 26 NaHCO3, 2.4 CaCl2, 1.3 MgSO4, 0.3 KH2PO4, and 10 glucose] at 36°C. Nomifensine and (−)-sulpiride were obtained from Research Biochemicals (Natick, MA). (+)-Amphetamine sulfate was obtained from Sigma (St. Louis, MO).
Fig. 1.

DA overflow in response to single-pulse stimulation, recorded with the same electrode at the same site by using CV and amperometry. a, The recording area in the mouse rostral, striatal slices is indicated by the stippledarea. aca, Anterior commissure, anterior;cc, corpus callosum; cp, caudate putamen.b, CV subtraction voltammograms for a calibration in 5 μm DA (top trace) and for the peak of the DA signal recording in c (bottom trace). Calibration of the electrode before and after the recording is provided for identification of the measured substance and conversion of the current into DA concentration. c, For CV, a triangular voltage wave was applied at 10 Hz. The current trace was sampled at the voltage that yielded the maximal oxidation current for DA (seeb). In this example, the time at signal peak was 180 msec, and the time at half-height (t1/2) was 490 msec.d, For amperometry, a constant voltage of +400 mV was applied. The time at signal peak was 30 msec, and thet1/2 was 225 msec. The thin lines in c and d are CV and amperometry simulations, respectively.
Electrochemical recordings. Disk carbon fiber electrodes of 5 μm diameter with a freshly cut surface, prepared according toKawagoe et al. (1992), were placed into the ventral caudate putamen ∼50 μm into the slice. For cyclic voltammetry, a triangular voltage wave (−400 to +1000 mV at 300 V/sec vs Ag/AgCl) was applied to the electrode every 100 msec with a waveform generator (model 39, Wavetek, Norwich, Norfolk, UK). Current was recorded with an Axopatch 200B amplifier (Axon Instruments, Foster City, CA) with a low-pass Bessel filter setting at 10 kHz, digitized at 25 kHz (Instrunet board, GW Instruments, Somerville, MA), and acquired with the Superscope II program (GW Instruments). For amperometry, a constant voltage of +400 mV was applied via the Axopatch 200B. Amperometric traces were filtered with a digital-hamming filter (125 Hz cutoff frequency). The striatal slices were stimulated with a bipolar-stimulating electrode placed at ∼100 μm distance from the recording electrode. Single-pulse stimulations (400 μA, 1 msec) were generated by an Iso-Flex stimulus isolator triggered by a Master-8 pulse generator (AMPI, Jerusalem, Israel).
Electrode calibration. Background-subtracted cyclic voltammograms served to identify the released substance. It was possible to differentiate among DA, serotonin, and ascorbic acid. HPLC analysis of homogenates of the mouse caudate putamen area from which we recorded showed that serotonin and norepinephrine levels were extremely low. With CV, our electrodes were ∼20 times more sensitive to DA than dihydroxyphenylacetic acid. CV also was used for electrode calibration. Consistent calibration in the amperometric mode was difficult to obtain. The response of the electrodes depended on the flow rate of the DA solution: a higher flow rate resulted in a larger current. This is consistent with the concept of a diffusion layer around the electrode (Kawagoe and Wightman, 1994). Therefore, amperometric calibration is expected to underestimate the sensitivity of the electrode. With a flow rate of 100 μl/sec, the current for a 10 μm dopamine solution was ∼10 pA. The magnitude of the electrode response was similar when the solutions contained 400 μm ascorbic acid. The response time of the electrodes, tested with a Picospritzer (General Valve, Fairfield, NJ), was ∼10 msec (time from start of puff to maximal response). In the amperometric mode the electrodes were ∼50-fold more sensitive to DA than to ascorbate.
Simulation model. We used a one-dimensional random walk model (finite difference) of diffusion (Berg, 1983; Sulzer and Pothos, 2000) that incorporated a function for DA uptake according to Michaelis–Menten kinetics. A more detailed description of the simulation, including a tutorial and examples for CV and amperometry random walk spreadsheets (Microsoft Excel), can be found on our laboratory web page: http://www.columbia.edu/∼ds43/. Once at the site, click on “Downloads, lab notes, and tutorials.”
In short, the random walk simulation consisted of a spreadsheet in which the columns represented distance bins, and the rows represented time bins, with the center column representing the electrode surface. For a population of molecules diffusing in one dimension (x), one-half moves to the right and one-half to the left column during a single time step. Therefore, in the spreadsheet the DA concentration of a bin in row t(x + 1) was equal to the average of the two bins in the neighboring columns in rowt(x).
The only difference between CV and amperometry simulations was the modeling of the electrode surface. For CV, a triangular voltage scan is applied to the electrode so that DA is oxidized and the oxidation product is re-reduced. In contrast, with constant-voltage amperometry, DA is oxidized, i.e., “consumed,” by the applied positive voltage at the electrode. The electrode surface therefore was modeled as “reflecting” for CV, i.e., molecules that encounter the surface diffuse away from the surface during the subsequent time step. For amperometry the electrode surface was modeled as “consuming,” i.e., molecules that encounter the surface are “destroyed” (oxidized) and do not contribute to diffusion in the subsequent time step. Note that these assumptions are a simplification of the real situation. In CV, not all of the DA–quinone is reduced back to DA, as indicated by the asymmetry of subtraction voltammograms. Therefore, the model is likely to underestimate the initial DA concentration. Another consideration with CV is that adsorption of DA to the electrode occurs between scans when the electrode is held at a negative potential (Bath et al., 2000). Depending on the scan frequency, adsorption can result in a distorted time course of the DA signal. In this case re-uptake would be underestimated somewhat. In the amperometric mode, adsorption does not occur, and it is assumed that DA is consumed at the electrode surface. However, in the presence of antioxidants, such as ascorbic acid, DA regeneration may occur, as has been suggested by the similarity between continuous amperometry and differential pulse amperometry recordingsin vivo (Benoit-Marand et al., 2000). Therefore, this assumption of the simulation model may need to be modified, depending on the recording situation.
A consuming electrode surface was modeled so that the bins in the columns next to the electrode at t(x + 1) received one-half of the molecules from their other neighbor column at t(x) and none from the electrode surface column. For a reflecting electrode surface the same rules applied for the columns next to the electrode as for the other columns, i.e., a bin in rowt(x + 1) was equal to the average of the two bins in the neighboring columns in rowt(x).
Essential to the simulation of the recordings was a “dead space” representing the space surrounding the electrode in which no release occurred [see also the “compartment model” of Cheng et al. (1979)and of Gonon et al. (2000)], i.e., the initial DA concentration in several columns next to the electrode was set to zero. This appears reasonable because the 5 μm carbon fiber is surrounded by a glass pipette, and presumably there is some tissue damage in the immediate vicinity of the electrode.
The modeling of the edge of the spreadsheet had little effect on the resulting shape of the signal for “release areas” of the size used here (radius of 50 μm). We chose to model the edge as follows: bins at t(x + 1) in the outermost column of the spreadsheet received one-half of the molecules from their only neighbor att(x).
The time bins (rows) were calculated from the equation of kinetic motion: t =x2/2D, using the apparent diffusion coefficient D for DA in the brain of 2.7 × 10⁻⁶cm2/sec (Tao and Nicholson, 1996). After each diffusion time step the DA concentration was corrected for DA uptake by the Michaelis–Menten equation:
with [DA] as the DA concentration,Vmax as the maximal uptake rate, andKm as the apparent affinity. It should be noted that the model would indicate a shift inVmax rather than inKm (i.e., noncompetitive inhibition) for a (hypothetical) competitive transport inhibitor with a dissociation rate below 1/sec (the duration of the evoked DA overflow). Therefore, other experimental evidence on the action of transport inhibitors is needed.
We developed a subprogram in the Mini Analysis Program (Synaptosoft) that ran a random walk simulation as described above, in either amperometric or CV mode. Fixed parameters were the diffusion coefficient, the size of the column bins, and the number of columns (size of the release area).
For CV, smaller bin sizes resulted in better simulations, but for bin sizes <0.5 μm, little change in the simulated signal shapes was noticed. In amperometric simulations the number of dopamine molecules that encounter the electrode can be estimated, but not the dopamine concentration. The amplitude of the simulated signal depends in this case on the selected bin size. Therefore, amperometric recordings were scaled according to the simulation with one chosen bin size. The initial parameters for release and uptake were obtained from CV recordings from the same site, and the amperometric simulation with those parameters (bin size 0.5 μm) yielded a scaling factor for the amperometric recordings.
The size of the release area affected the tail of the signal, and for most simulations we chose a radius of 50 μm, the approximate half-distance between the poles of the stimulation electrode. The radius was increased to 100 μm for simulation of DA overflow in the presence of nomifensine and AMPH.
The four variable parameters in the simulation were the initial DA concentration, the maximal uptake rateVmax, the apparent affinityKm, and the dead space around the electrode. The subprogram used a simplex algorithm to perform a nonlinear regression to find a best fit to an actual recording trace. The values of the variables were varied to minimize the squared vertical distances for each point between a simulated curve and a recording trace. R2 values were computed to estimate how closely the simulations fit the data.R2 was computed from the sum of the squares of the distances of the points from the best-fit simulation. The results were normalized to the sum of the square of the distances of the points from a horizontal line through the mean of all values. R2 is therefore a fraction between 0 and 1 and has no units. WhenR2 is close to 0, the best-fit curve fits the data no better than a horizontal line through the mean of all values. When R2 equals 1, all points lie exactly on the trace.
RESULTS
Comparison of cyclic voltammetry and amperometry recordings of DA overflow
We recorded DA overflow that followed single-pulse electrical stimulation in mouse striatal slices (Fig.1a), using two electrochemical methods, CV and amperometry. Background-subtracted voltammograms (Fig.1b) that were obtained with CV were used to identify the released substance and for calibration. DA signals obtained by the two recording methods with the same electrode at the same site are shown in Figure 1, c and d.
The differences in signal kinetics of the CV and amperometric recording are readily apparent. In the CV recording, the rise time of the signal (time from stimulation to signal peak) was 180 msec, and the width of the signal at half-height (t1/2) was 490 msec. The signal recorded with amperometry displayed much faster kinetics, with a rise time of 30 msec and at1/2 of 225 msec. The average rise time of eight such experiments was 40 ± 6 msec (average ± SEM) for amperometry and 250 ± 19 msec for CV. Thet1/2 was 118 ± 5 msec for amperometry and 378 ± 33 msec for CV. These recordings were performed ∼2–15 min after the insertion of the electrode into the slice. Generally, the kinetics of the signals slowed over the first 30 min of recording, possibly because of tissue damage and/or adsorption of protein or other material to the electrode.
Striatal DA overflow that followed stimulation is determined by a combination of release, uptake, and diffusion. To identify a set of parameters for DA release and uptake that fit the data obtained with both recording modes, we designed a random walk simulation of DA diffusion corrected for DA uptake according to Michaelis–Menten kinetics. For CV simulations, the electrode was modeled as a reflecting surface, and for amperometry simulations the electrode was modeled as a consuming surface (see Materials and Methods). Four parameters were estimated to yield best fits to recorded traces: the dead space or distance between the electrode surface and the closest release site, the initial DA concentration, the maximal uptake rateVmax, and the apparent affinityKm. The solid lines in Figure 1,c and d, are CV and amperometry simulations, respectively, with the following parameters: dead space, 5 μm; initial DA concentration, 2.36 μm;Vmax, 3.16 μm/sec; andKm, 0.3 μm. Table 1 gives the average values ± SEM for the four parameters from simulations of 21 CV recordings and 16 amperometric recordings.
Table 1.
Parameter estimates from CV and amperometry recordings
| CV | Amperometry | Average of CV and amperometry | |
|---|---|---|---|
| Dead space (μm) | 6.31 ± 0.41 | 6.09 ± 0.51 | 6.22 ± 0.32 |
| Initial [DA] (μm) | 2.73 ± 0.19 | 3.18 ± 0.38 | 2.93 ± 0.20 |
| Vmax(μm/sec) | 4.74 ± 0.26 | 5.05 ± 0.36 | 4.88 ± 0.21 |
| Km (μm) | 0.89 ± 0.16 | 0.61 ± 0.08 | 0.77 ± 0.10 |
| R2 | 0.94 ± 0.01 | 0.97 ± 0.01 |
Parameter estimates (average ± SEM) from CV recordings (n = 21 slices) and amperometry recordings (n = 16 slices) for the dead space radius (distance between the electrode and the closest release site), the initial DA concentration ([DA]), the maximal uptake rateVmax, and the apparent affinityKm. The dimensionless R2values (0–1) evaluate the fit of the simulation to the data.
Effects of DA uptake blockade on DA signal amplitudes recorded with CV and amperometry
To distinguish between AMPH effects on DA release and uptake, we found that the comparison of CV and amperometry recordings proved to be helpful. This is shown in Figure2, a and b, for which the simulation was used to predict signal changes in response to either increased initial DA concentration or increased apparent affinity Km. Then the prediction from the simulation was compared with experimental data, using the uptake blocker nomifensine (Figs. 2c, 3).
Fig. 2.

Simulated changes of signal amplitudes for increased initial DA concentration (a) and decreased apparent affinity of uptake (b). Shown are experimental changes of recorded signal peak amplitudes in response to the uptake blocker nomifensine (c).a, Normalized signal peak amplitude is plotted versus initial DA concentration for CV (white circles) and amperometry (black triangles) simulations (amplitude = 1 for 1 μm DA).Vmax was 4.9 μm/sec;Km was 0.8 μm.b, Change in simulated signal peak amplitude for increased Km (amplitude = 1;Km = 1 μm, with initial DA concentration of 2.9 μm andVmax of 4.9 μm/sec).c, Effects of the uptake blocker nomifensine (10 μm) on peak amplitudes of stimulated DA overflow recorded with CV (white circles; n = 5) and amperometry (black triangles; n = 5). Normalized peak amplitudes (average ± SEM) are plotted versus the time of superfusion with nomifensine. DA overflow was stimulated once per minute.
Fig. 3.

Simulation of the nomifensine effect.a, Examples of CV recordings (top) and amperometry recordings (bottom) before and after 10 min of superfusion with nomifensine. The thin lines are the corresponding simulations. b, Bar graph of the parameters (average ± SEM) forVmax, the maximal uptake rate (μm/sec); Km, the apparent affinity (μm); and initial [DA], the initial DA concentration (μm) estimated by simulations of CV (left) and amperometry recordings (right).
Figure 2a shows the relationship between signal amplitude and increasing initial DA concentration for CV and amperometry simulations (amplitude normalized to 1 for 1 μmDA). The parameters (dead space, Vmax, and Km) for this simulation were taken from Table 1. The relative increase of signal amplitude with increasing initial DA concentrations was larger for CV simulations than for amperometry simulations, indicating that using the peak amplitude of CV recordings as a measure leads to an overestimation of changes in release.
In Figure 2b, simulated signal amplitudes are plotted versus increasing Km values, with the amplitudes normalized to 1 for a Kmvalue of 1 μm. The simulation predicted that an increase in Km attributable to the blockade of re-uptake would result in a substantial increase in signal amplitudes recorded with CV but in only a moderate increase for amperometric recordings. We tested this prediction by superfusing slices with the DA transporter blocker nomifensine (Fig.2c). Striatal slices were stimulated once per minute. Once stable responses were obtained, the superfusion was switched to nomifensine (10 μm) for 20 min. As predicted by the simulation, the maximal amplitude of DA signals increased only for CV recordings. On average, peak amplitude increased twofold in CV recordings (n = 5) and only 1.1-fold in amperometric recordings (n = 5).
Figure 3a shows examples of CV and amperometric recordings with their respective simulations before and after 10 min of nomifensine superfusion. The estimated parameters for DA release and uptake derived from signal simulations are shown in Figure 3b. Note that the parameters derived from CV and amperometric signals are very similar. Nomifensine (10 μm) decreased the apparent affinity, increasing the Km from 0.8 to 11 μm. Better fits were obtained for the amperometry data (average R2 = 0.99) than for the CV data (averageR2 = 0.96).
In summary, experimental data and simulations indicated that maximal signal amplitudes recorded by CV are dependent on both DA release and re-uptake, whereas maximal signal amplitudes recorded by amperometry are mostly dependent on release.
Effects of AMPH on stimulation-dependent DA overflow
To examine AMPH effects on stimulated DA overflow, we superfused striatal slices with 10 μm AMPH for 30 min. This concentration was chosen to compare the results with other in vitro studies (Sulzer et al., 1995; Anderson et al., 1998; Jones et al., 1998). For reference, striatal AMPH concentrations between 2.5 and 5 μm have been reported for AMPH dosage that produced behavioral effects in rats (Clausing et al., 1995). In three experiments with 1 μm AMPH, responses similar in magnitude to 10 μm AMPH were found, except that the effects were delayed (data not shown).
DA overflow was evoked by a single pulse per minute. Once a stable response was obtained, superfusion was switched to AMPH. The three last recordings of evoked DA overflow before the switch served as controls. Figure 4a shows a typical CV recording of such an experiment. There was an overall increase in the baseline, attributable to DA (see background-subtracted voltammogram in the inset), that peaked 19 min after the onset of AMPH superfusion. In a recent report by Jones et al. (1998), this increase was shown to be attributable to the reverse transport of DA.
Fig. 4.

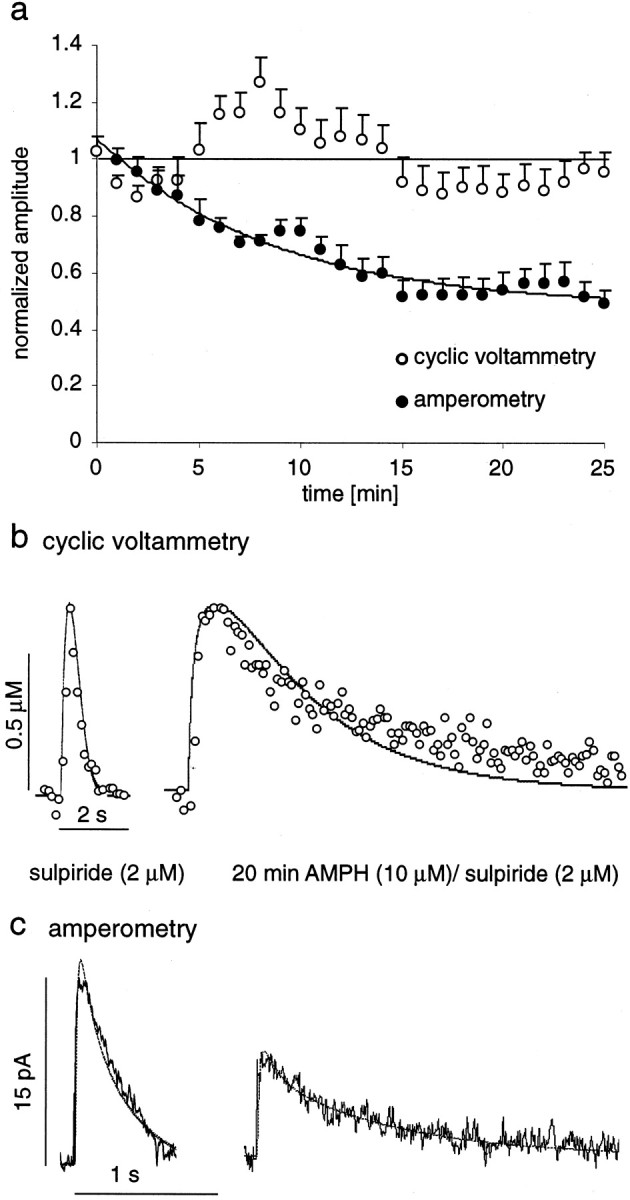
Effects of AMPH on stimulated DA overflow recorded with CV and amperometry. a, CV recording of DA overflow elicited by single-pulse stimulation (1/min) during 30 min of AMPH (10 μm) superfusion. The slow rise in baseline that peaks at 19 min is attributable to DA (see subtraction voltammogram, left inset). Stimulated DA overflow decreased in amplitude and increased in t1/2 (right inset). b, Decrease of normalized maximal signal amplitudes (average ± SEM) during 20 min of AMPH (10 μm) superfusion in amperometric recordings (black circles; n = 5) and in CV recordings (white circles; n = 10). Thelines are single exponential fits, with a time constant for CV of 3 min and a time constant for amperometry of 1.7 min.c, Increase in normalizedt1/2 for amperometric (black circles) and CV recordings (white circles) during AMPH superfusion (up to 25 min). d, Examples of CV recordings before and after 20 min of AMPH superfusion with simulations (thin lines). The bar graphs atbottom show the estimated parameters for controls and after 15–20 min of superfusion with AMPH. e, Same as ind for amperometric recordings.
AMPH affected stimulation-dependent DA overflow in two ways: it decreased the maximal signal amplitude (Fig. 4b) and increased the t1/2 (Fig.4c) for both CV (n = 10) and amperometric recordings (n = 5). Thet1/2 was increased 3.4-fold in amperometric recordings and 7.6-fold in CV recordings, indicating that AMPH blocked DA re-uptake. Maximal signal amplitudes recorded with CV were decreased by 60% and, in amperometric recordings, by 75% (at 20–25 min of AMPH exposure). Figure 4, d and e, shows examples of DA signals recorded before and after 25 min of AMPH superfusion with CV (Fig. 4d) and amperometry (Fig.4e) and their respective simulations. The bar graphs below the recording traces indicate the average parameters for the best fits.Vmax was decreased slightly, to 80% in CV and to 75% in amperometry recordings. The apparent affinityKm was estimated to be 24 and 39 μm, respectively. The initial DA concentration was reduced to 17 ± 3% of control levels according to CV simulations and to 18 ± 4% according to amperometry simulations.
As seen in Figure 4a, the induction of the reverse transport of DA can distort the signal shape. For the simulation, the signals were selected only from portions of the recordings with a relatively stable baseline. The average R2values, with 0.79 for CV and 0.87 for amperometry, were relatively low. This was attributable to the decreased signal-to-noise ratio after AMPH exposure and the very long-lasting signal tails.
The role of D2 autoreceptor activation in the effects of AMPH on stimulated DA overflow
The previous experiments indicated that AMPH reduced stimulated DA release by ∼82%. This response could be attributable to a redistribution of DA from synaptic vesicles to the cytosol and/or decreased release probability attributable to D2 autoreceptor activation. It has been shown previously that activation of axon terminal autoreceptors effectively inhibits DA release. The D2 receptor agonist quinpirole reduced DA overflow amplitudes between 73% (Kennedy et al., 1992) and 100% (Wieczorek and Kruk, 1995) in striatal slice preparations. We confirmed those findings under our experimental conditions, because 1 μm quinpirole decreased signal amplitudes by 85% (data not shown).
To elucidate the role of D2 autoreceptor activation in the effects of AMPH on vesicular release, we repeated the above experiments in the presence of the D2 receptor antagonist (−)-sulpiride. Slices were superfused with sulpiride (2 μm) for at least 10 min before AMPH (10 μm)/sulpiride (2 μm) superfusion. The efficacy of this sulpiride exposure to antagonize D2 receptor-mediated release inhibition was confirmed by using trains of five pulse stimulations with 500 msec intervals. The sulpiride superfusion resulted in increased signal amplitudes from the second to the fifth stimulation pulse (data not shown).
Figure 5a shows the decrease in maximal signal amplitude recorded with both CV and amperometry in response to AMPH in the presence of sulpiride (each n = 6). In CV recordings, the amplitudes were decreased by only 5% after 20–25 min of superfusion. In contrast, with amperometry the amplitudes were decreased by 40%. Representative recording traces and their simulations are shown in Figure 5, b and c. CV and amperometry simulations resulted in similar parameter changes. CV simulations yielded a Km of 36 ± 6 μm, and amperometry simulations yielded aKm of 40 ± 6 μm. The initial DA concentration was reduced to 52 ± 9.8% of control levels according to CV and to 54 ± 9.5% according to amperometry. AverageR2 values of the fits were 0.74 for CV and 0.84 for amperometry. Thus, AMPH reduced vesicular release by only ∼47% in the presence of sulpiride (10 μm) compared with ∼82% in the absence of the drug. If we assume a complete inhibition of D2 autoreceptor activation by sulpiride, D2 autoreceptor activation accounted for ∼35% of the inhibitory effects of AMPH on vesicular release. The remaining 47% of inhibition was presumably attributable to the redistribution of vesicular DA to the cytosol, if a third unknown inhibitory mechanism is not involved.
Fig. 5.
Effect of AMPH (10 μm) in the presence of the D2 receptor antagonist sulpiride (2 μm) on DA overflow amplitudes recorded with CV and amperometry.a, Normalized maximal signal amplitudes (average ± SEM) are plotted for 25 min of AMPH/sulpiride superfusion, recorded with amperometry (blackcircles;n = 6) and CV (white circles;n = 6). The horizontal line crosses at 1 for reference, and the line that follows the amperometric data is a single exponential fit (time constant, 4.3 min).b, Examples of CV recordings in sulpiride and after 25 min of AMPH/sulpiride superfusion with simulations of the data (thin lines). c, The same as inb for amperometric recordings.
AMPH effects on stimulation-dependent DA overflow in D2 receptor KO mice
To confirm the role of D2 autoreceptor activation in AMPH effects, we examined striatal slices from mice lacking the D2 receptor. Application of the D2/D3 receptor agonist quinpirole (1 μm), which blocked stimulated release in slices from wild-type mice by 85%, had no effect on stimulated DA overflow in slices from KO mice (data not shown). This suggested that the D2 receptor is the only autoreceptor that controls axon terminal DA release under these conditions.
Overall DA content in striatal slices from wild-type and D2 KO mice was identical as measured by HPLC-EC (data not shown). However, DA overflow in response to single-pulse stimulations recorded with CV had a smaller maximal amplitude in the KO mice (initial DA concentration, 1.4 μm ± 0.13; n = 5) than in the wild types (2.7 μm; see Table 1).
Figure 6a shows the normalized maximal amplitudes of evoked DA overflow recorded in slices of D2 KO mice by using CV during 29 min of AMPH superfusion (n = 5). The data from wild-type mice (controls and with 10 μm sulpiride) are plotted for comparison. In the D2 receptor KO mice, AMPH increased the maximal amplitude of evoked DA overflow (175% after 25–30 min). Simulations (examples in Fig.6b) estimated that this was attributable to an increase of the Km value from 0.97 ± 0.08 to 21.3 ± 1.3 μm and a decrease of the initial DA concentration to 77% of controls. Thus, AMPH inhibited vesicular release in D2 KO mice by 23%, to a lesser extent than in sulpiride-treated wild types (47%). Table2 lists the estimated effects of AMPH on the initial DA concentration in both experimental groups. Averaging all experiments yielded an estimate for Kmof 32 μm in the presence of 10 μm AMPH.
Fig. 6.

Effect of AMPH (10 μm) on DA overflow amplitudes in striatal slices of D2 receptor KO mice (D2−/−) recorded with CV. a, Normalized maximal signal amplitudes (average ± SEM) are plotted for 29 min of AMPH superfusion of slices from D2 KO mice (black circles; n = 5) and slices from wild types (WT) with (white squares) and without (white circles) 2 μm sulpiride (data from Figs. 4, 5). b, Example of CV recordings from a D2 KO mouse before and after 25 min of AMPH superfusion (white circles) with simulation of the data (thin lines).
Table 2.
Estimated inhibitory effects of AMPH
| Contribution to total inhibition of 82% | D2 receptor activity (%) | Redistribution of vesicular DA (%) |
|---|---|---|
| Sulpiride (2 μm) in wild-types | 35 | 47 |
| D2 receptor KO | 59 | 23 |
Estimated inhibitory effects of AMPH on the initial DA concentration attributable to D2 autoreceptor activation and redistribution of vesicular DA, from experiments on wild-type mice with the D2 antagonist sulpiride (2 μm) and on D2 KO mice.
DISCUSSION
Although various aspects of the effects of AMPH on vesicular DA release and reuptake have been investigated in detail (Sulzer et al., 1993, 1995; Wieczorek and Kruk, 1994; Iravani and Kruk, 1995; Anderson et al., 1998; Jones et al., 1998, 1999), the present study provides the first integrative evaluation of the effects of AMPH on stimulation-dependent DA overflow in the striatum. Three mechanisms are responsible for AMPH effects on stimulation-dependent DA overflow. (1) In wild-type mice, experiments with D2 receptor antagonists suggested that vesicular DA stores were reduced by 47%. Data from D2 KO mice indicated a reduction by 23%. This reduction is most likely attributable to depletion of vesicular DA. (2) AMPH activates release-regulating D2 autoreceptors indirectly via induction of the reverse transport of DA. Autoreceptor-mediated DA release inhibition in combination with the redistribution of vesicular DA resulted in an 82% inhibition of exocytic DA release. (3) AMPH promotes DA overflow by blocking DA re-uptake. The apparent increase of the Michaelis–Menten constant Km for uptake was from 0.8 μm (control) to 32 μm(with 10 μm AMPH).
Methodological considerations
We used two electrochemical recording methods with concomitant advantages and limitations. With the use of CV it is possible to identify the measured species. Moreover, as monoamines are regenerated, DA levels are not altered by the recording itself, and accurate DA uptake parameters may be obtained (Wightman and Zimmerman, 1990). However, CV is somewhat destructive as indicated by asymmetric subtraction voltammograms. In addition, DA adsorption to the electrode may occur between scans (Bath et al., 2000). The assumption that CV can be modeled by a reflecting electrode surface is therefore a simplification. In amperometry, adsorption should not play a role, and it offers a far better time resolution (Dugast et al., 1994; Michael and Wightman, 1999). However, the destructive nature of the recording (consuming electrode) may depend on the presence of ascorbate, which may differ in in vivo (Benoit-Marand et al., 2000) andin vitro conditions (Brahma et al., 2000).
Simulations of CV recordings of DA overflow based on Michaelis–Menten kinetics were introduced by Wightman and colleagues (Wightman et al., 1988; Wightman and Zimmerman, 1990; Kawagoe et al., 1992; Jones et al., 1995a). In the present study we could not use this model because it does not describe amperometric recordings. Moreover, the model included a function to account for diffusion through a Nafion coat of the electrode to describe the rise-time of DA overflow. However, we found a similar rise-time for uncoated electrodes. In our simulation, we accounted for the delay by assuming a dead space around the electrode. This concept of a dead volume was introduced by Cheng et al. (1979) to explain very slow changes in chronoamperometric recordings. With the random walk simulation, which modeled the surface of the electrode as either reflecting or consuming, both modes of recording were fit by identical parameters. The dead space radius was 6 μm. The Km was 0.8 μm, a value that lies between the estimates derived from mouse synaptosome preparations (0.21 μm;Ross, 1991) and homogenized striatal tissue (0.98 μm;Batchelor and Schenk, 1998). The values obtained for Vmax (4.9 μm/sec) and the initial DA concentration (2.9 μm) are comparable with values estimated in earlier studies (Garris and Wightman, 1994; Jones et al., 1995a,b,1999).
Changes in uptake kinetics affected maximal signal amplitudes recorded by CV more than those recorded by amperometry. The combination of the two methods therefore helps to distinguish the effects on DA release and uptake. After exposure to the uptake blocker nomifensine (10 μm), both CV and amperometric recordings were fit by an apparent Km change from 0.8 to 11 μm. ApparentKm values previously reported for nomifensine in the caudate putamen range from 6 μm (Wightman and Zimmerman, 1990; Nicholson, 1995) to 13 μm (Jones et al., 1995a) and 20 μm (Jones et al., 1995b). Although all reports agree that uptake inhibition increases thet1/2 of DA overflow, some studies found an increase in signal amplitude with CV recordings (Palij et al., 1990; Wieczorek and Kruk, 1994; this study), whereas others did not (Jones et al., 1995a,b). The simulation model predicts that CV signal amplitude changes in response to uptake blockade are more pronounced for lower initial DA concentrations. This may explain the divergent findings, because the amount of DA released per pulse depends on the recording area and stimulation strength.
Amphetamine effects on vesicular DA release
Our data indicate that AMPH inhibits vesicular DA release in part by activation of D2 autoreceptors via induction of the reverse transport of DA. Another mechanism by which AMPH decreases vesicular release is the redistribution of vesicular DA to the cytosol (Sulzer and Rayport, 1990). Assuming that there is no other inhibitory mechanism involved, the data from striatal slices of wild-type animals in the presence of sulpiride suggested that D2 receptor activation contributed 35% to the total reduction (82%) of stimulated DA release by AMPH, whereas the data from D2 KO mice suggested a contribution of 59%. This might indicate that 2 μm sulpiride does not block D2 receptors completely in the presence of AMPH. Alternatively, the difference could be attributable to altered DAergic transmission in D2 KO mice. Although overall striatal DA tissue content as determined by HPLC is unaltered in these animals (Jung et al., 1999), stimulated DA release was smaller in the KO mice. However, this point needs further study, because only a small number of animals was investigated.
A role for D2 receptors in the inhibitory action of AMPH on vesicular release has been suggested previously. Wieczorek and Kruk (1994) reported that 1 μm AMPH reduced CV signal amplitudes by ∼80%. This inhibition was prevented in part by 1 μm sulpiride, resulting in only 30% inhibition. Those results are comparable with the data shown here. In contrast, Jones et al. (1998) found a complete suppression of stimulated DA signals by AMPH, which was not prevented by sulpiride, although sulpiride caused a delay in the time course of the suppression. A possible explanation for these discrepancies might be a variable density of D2 autoreceptors in subregions of the caudate putamen. Our study suggests that, at least in certain areas, D2 autoreceptors play a prominent role in mediating the inhibition of vesicular release by AMPH.
A more direct way to determine the contribution of decreased release probability by D2 autoreceptor activation and AMPH-mediated decrease of vesicular DA stores would be to record quantal release from nigrostriatal terminals. Unfortunately, this has proven to be difficult, and only on rare occasions, immediately after inserting the electrode into the slice, have we observed presumed quantal events for a brief time. The only successful quantal recordings in slices to date have been obtained from cell bodies in midbrain slices (Jaffe et al., 1998). However, there are estimates of the effects of AMPH on quantal size from other preparations. AMPH (10 μm) reduced quantal size in PC12 cells by 52% (Sulzer et al., 1995) and in Planorbis DAergic neurons by 23% (Anderson et al., 1998). Our estimates are within this range: a 23% reduction according to the data from D2 KO mice and a 47% reduction according to experiments with the D2 receptor antagonist sulpiride. Depletion by AMPH may vary for different vesicle populations, depending on factors including volume, pH gradient, DA concentration gradient, and the state of vesicular monoamine transporters.
Amphetamine effects on DA uptake
AMPH acts as a DA uptake blocker (Parker and Cubeddu, 1988), promoting DA overflow from release sites. We found an apparent decrease in the transporter affinity, with Kmvalues increasing from 0.8 to ∼32 μm after 20 min of AMPH (10 μm) superfusion. An increase inKm to 9 μm was reported by Jones et al. (1999). Our CV data show that the inhibition of uptake counteracts the inhibitory effects of AMPH on vesicular release, thus resulting in DA overflow of smaller amplitude but longer duration. Therefore, not only stimulation-independent DA efflux but also stimulation-dependent DA release can contribute to elevated DA levels in response to AMPH. This effect becomes especially apparent in the absence of D2 autoreceptor activation, when release is decreased only by depletion of DA from vesicles. A transiently decreased activity of D2 autoreceptors has been reported in some models of drug sensitization. Our data indicate that the reported enhanced DA overflow in response to AMPH that followed sensitization could indeed result from D2 autoreceptor downregulation (White and Wolf, 1991; Wolf et al., 1993; Pierce et al., 1995; Muscat et al., 1996; Pierce and Kalivas, 1997a).
In summary, we found that, in addition to its well known ability to release DA by reverse transport, AMPH also promotes DA overflow after its synaptic release. The activation of D2 autoreceptors inhibits subsequent synaptic DA overflow that is induced by AMPH, suggesting a role for D2 autoreceptors in the efficacy of the drug. In combination with the redistribution of vesicular DA, these multiple effects of AMPH must be taken into account to arrive at a more thorough understanding of the manner by which this drug disturbs catecholaminergic neurotransmission.
Footnotes
This work was supported by National Alliance for Research on Schizophrenia and Depression, National Institute on Drug Abuse Grants 10154 and 07418, by a Udall Parkinson's Disease Center of Excellence Award, and by the Parkinson's Disease Foundation. We are grateful to Drs. Sara R. Jones and Margaret E. Rice for helpful advice on cyclic voltammetry; to Drs. Charles Nicholson, Margaret E. Rice, and R. Mark Wightman for discussions of simulation models; and to Drs. Marina Wolf and Peter Kalivas for discussions on sensitization. We thank Drs. Emmanuel Pothos and Kristin Larsen for a critical reading of an earlier version of this manuscript.
Correspondence should be addressed to Dr. David Sulzer, Department of Neurology, Columbia University, 650 West 168th Street, New York, NY 10032. E-mail: ds43@columbia.edu.
REFERENCES
- 1.Anderson BB, Chen G, Gutman DA, Ewing AG. Dopamine levels of two classes of vesicles are differentially depleted by amphetamine. Brain Res. 1998;788:294–301. doi: 10.1016/s0006-8993(98)00040-7. [DOI] [PubMed] [Google Scholar]
- 2.Batchelor M, Schenk JO. Protein kinase A activity may kinetically upregulate the striatal transporter for dopamine. J Neurosci. 1998;18:10304–10309. doi: 10.1523/JNEUROSCI.18-24-10304.1998. [DOI] [PMC free article] [PubMed] [Google Scholar]
- 3.Bath BD, Michael DJ, Trafton BJ, Joseph JD, Runnels PL, Wightman RM. Subsecond adsorption and desorption of dopamine at carbon-fiber microelectrodes. Anal Chem. 2000;72:5994–6002. doi: 10.1021/ac000849y. [DOI] [PubMed] [Google Scholar]
- 4.Benoit-Marand M, Jaber M, Gonon F. Release and elimination of dopamine in vivo in mice lacking the dopamine transporter: functional consequences. Eur J Neurosci. 2000;12:2985–2992. doi: 10.1046/j.1460-9568.2000.00155.x. [DOI] [PubMed] [Google Scholar]
- 5.Berg HC. Random walks in biology. Princeton UP; Princeton, NJ: 1983. [Google Scholar]
- 6.Brahma B, Forman RE, Stewart EE, Nicholson C, Rice ME. Ascorbate inhibits edema in brain slices. Neurochemistry. 2000;74:1263–1270. doi: 10.1046/j.1471-4159.2000.741263.x. [DOI] [PubMed] [Google Scholar]
- 7.Cardozo DL, Bean BP. Voltage-dependent calcium channels in rat midbrain dopamine neurons: modulation by dopamine and GABAB receptors. J Neurophysiol. 1995;74:1137–1148. doi: 10.1152/jn.1995.74.3.1137. [DOI] [PubMed] [Google Scholar]
- 8.Cheng HY, Schenk JO, Huff R, Adams RN. In vivo electrochemistry: behavior of micro electrodes in brain tissue. J Electroanal Chem. 1979;100:23–31. [Google Scholar]
- 9.Clausing P, Gough B, Holson RR, Slikker W, Jr, Bowyer JF. Amphetamine levels in brain microdialysate, caudate/putamen, substantia nigra, and plasma after dosage that produces either behavioral or neurotoxic effects. J Pharmacol Exp Ther. 1995;274:614–621. [PubMed] [Google Scholar]
- 10.Cragg SJ, Greenfield SA. Differential autoreceptor control of somatodendritic and axon terminal dopamine release in substantia nigra, ventral tegmental area, and striatum. J Neurosci. 1997;17:5738–5746. doi: 10.1523/JNEUROSCI.17-15-05738.1997. [DOI] [PMC free article] [PubMed] [Google Scholar]
- 11.Dugast C, Suaud-Chagny MF, Gonon F. Continuous in vivo monitoring of evoked dopamine release in the rat nucleus accumbens by amperometry. Neuroscience. 1994;62:647–654. doi: 10.1016/0306-4522(94)90466-9. [DOI] [PubMed] [Google Scholar]
- 12.Fischer JF, Cho AK. Chemical release of dopamine from striatal homogenates: evidence for an exchange diffusion model. J Pharmacol Exp Ther. 1979;208:203–209. [PubMed] [Google Scholar]
- 13.Franklin KBJ, Paxinos G. The mouse brain in stereotaxic coordinates. Academic; San Diego: 1997. [Google Scholar]
- 14.Garris PA, Wightman RM. Different kinetics govern dopaminergic transmission in the amygdala, prefrontal cortex, and striatum: an in vivo voltammetric study. J Neurosci. 1994;14:442–450. doi: 10.1523/JNEUROSCI.14-01-00442.1994. [DOI] [PMC free article] [PubMed] [Google Scholar]
- 15.Gonon FG. Nonlinear relationship between impulse flow and dopamine released by rat midbrain dopaminergic neurons as studied by in vivo electrochemistry. Neuroscience. 1988;24:19–28. doi: 10.1016/0306-4522(88)90307-7. [DOI] [PubMed] [Google Scholar]
- 16.Gonon FG, Burie JB, Jaber M, Benoit-Marand M, Dumartin B, Bloch B. Geometry and kinetics of dopaminergic transmission in the rat striatum and in mice lacking the dopamine transporter. Prog Brain Res. 2000;125:291–302. doi: 10.1016/S0079-6123(00)25018-8. [DOI] [PubMed] [Google Scholar]
- 17.Herdon H, Strupish J, Nahorski SR. Endogenous dopamine release from rat striatal slices and its regulation by D2 autoreceptors: effects of uptake inhibitors and synthesis inhibition. Eur J Pharmacol. 1987;138:69–76. doi: 10.1016/0014-2999(87)90338-4. [DOI] [PubMed] [Google Scholar]
- 18.Iravani MM, Kruk ZL. Effects of amphetamine on carrier-mediated and electrically stimulated dopamine release in slices of rat caudate putamen and nucleus accumbens. J Neurochem. 1995;64:1161–1168. doi: 10.1046/j.1471-4159.1995.64031161.x. [DOI] [PubMed] [Google Scholar]
- 19.Jaffe EH, Marty A, Schulte A, Chow RH. Extrasynaptic vesicular transmitter release from the somata of substantia nigra neurons in rat midbrain slices. J Neurosci. 1998;18:3548–3553. doi: 10.1523/JNEUROSCI.18-10-03548.1998. [DOI] [PMC free article] [PubMed] [Google Scholar]
- 20.Jones SR, Garris PA, Kilts CD, Wightman RM. Comparison of dopamine uptake in the basolateral amygdaloid nucleus, caudate-putamen, and nucleus accumbens of the rat. J Neurochem. 1995a;64:2581–2589. doi: 10.1046/j.1471-4159.1995.64062581.x. [DOI] [PubMed] [Google Scholar]
- 21.Jones SR, Garris PA, Wightman RM. Different effects of cocaine and nomifensine on dopamine uptake in the caudate-putamen and nucleus accumbens. J Pharmacol Exp Ther. 1995b;274:396–403. [PubMed] [Google Scholar]
- 22.Jones SR, Gaindetdinov RR, Wightman RM, Caron MG. Mechanisms of amphetamine action revealed in mice lacking the dopamine transporter. J Neurosci. 1998;18:1979–1986. doi: 10.1523/JNEUROSCI.18-06-01979.1998. [DOI] [PMC free article] [PubMed] [Google Scholar]
- 23.Jones SR, Joseph JD, Barak LS, Caron MG, Wightman RM. Dopamine neuronal transport kinetics and effects of amphetamine. J Neurochem. 1999;73:2406–2414. doi: 10.1046/j.1471-4159.1999.0732406.x. [DOI] [PubMed] [Google Scholar]
- 24.Jung M-Y, Skryabin BV, Arai M, Abbondanzo S, Fu D, Brosius J, Robakis NK, Polites HG, Pintar JE, Schmauss C. Potentiation of the D2 mutant motor phenotype in mice lacking dopamine D2 and D3 receptors. Neuroscience. 1999;91:911–924. doi: 10.1016/s0306-4522(98)00705-2. [DOI] [PubMed] [Google Scholar]
- 25.Kawagoe KT, Wightman RM. Characterization of amperometry for in vivo measurement of dopamine dynamics in the rat brain. Talanta. 1994;41:865–874. doi: 10.1016/0039-9140(94)e0064-x. [DOI] [PubMed] [Google Scholar]
- 26.Kawagoe KT, Garris PA, Wiedemann DJ, Wightman RM. Regulation of transient dopamine concentration gradients in the microenvironment surrounding nerve terminals in the rat striatum. Neuroscience. 1992;51:55–64. doi: 10.1016/0306-4522(92)90470-m. [DOI] [PubMed] [Google Scholar]
- 27.Kennedy RT, Jones SR, Wightman RM. Dynamic observation of dopamine autoreceptor effects in rat striatal slices. J Neurochem. 1992;59:449–455. doi: 10.1111/j.1471-4159.1992.tb09391.x. [DOI] [PubMed] [Google Scholar]
- 28.Kuhr WG, Ewing AG, Wightman RM. Amphetamine attenuates the stimulated release of dopamine in vivo. J Pharmacol Exp Ther. 1985;232:388–394. [PubMed] [Google Scholar]
- 29.Lacey MG, Mercuri NB, North RA. Dopamine acts on D2 receptors to increase potassium conductance in neurones of the rat substantia nigra zona compacta. J Physiol (Lond) 1987;392:397–416. doi: 10.1113/jphysiol.1987.sp016787. [DOI] [PMC free article] [PubMed] [Google Scholar]
- 30.L'hirondel M, Cheramy A, Godeheu G, Artaud F, Saiardi A, Borrelli E, Glowinski J. Lack of autoreceptor-mediated inhibitory control of dopamine release in striatal synaptosomes of D2 receptor-deficient mice. Brain Res. 1998;792:253–262. doi: 10.1016/s0006-8993(98)00146-2. [DOI] [PubMed] [Google Scholar]
- 31.Michael DJ, Wightman RM. Electrochemical monitoring of biogenic amine neurotransmission in real time. J Pharm Biomed Anal. 1999;19:33–46. doi: 10.1016/s0731-7085(98)00145-9. [DOI] [PubMed] [Google Scholar]
- 32.Mundorf ML, Hochstetler SE, Wightman RM. Amine weak bases disrupt vesicular storage and promote exocytosis in chromaffin cells. J Neurochem. 1999;73:2397–2405. doi: 10.1046/j.1471-4159.1999.0732397.x. [DOI] [PubMed] [Google Scholar]
- 33.Muscat R, Iravani MM, Kruk ZL. The role of ventral tegmental dopamine neurons in locomotor sensitization following quinpirole or (+)-amphetamine: ex vivo voltammetric evidence. Neuroscience. 1996;75:1175–1184. doi: 10.1016/0306-4522(96)00389-2. [DOI] [PubMed] [Google Scholar]
- 34.Nicholson C. Interaction between diffusion and Michaelis–Menten uptake of dopamine after iontophoresis in striatum. Biophys J. 1995;68:1699–1715. doi: 10.1016/S0006-3495(95)80348-6. [DOI] [PMC free article] [PubMed] [Google Scholar]
- 35.Palij P, Bull DR, Sheehan MJ, Millar J, Stamford J, Kruk ZL, Humphrey PP. Presynaptic regulation of dopamine release in corpus striatum monitored in vitro in real time by fast cyclic voltammetry. Brain Res. 1990;509:172–174. doi: 10.1016/0006-8993(90)90329-a. [DOI] [PubMed] [Google Scholar]
- 36.Parker EM, Cubeddu LX. Comparative effects of amphetamine, phenylethylamine, and related drugs on dopamine efflux, dopamine uptake, and mazindol binding. J Pharmacol Exp Ther. 1988;245:199–210. [PubMed] [Google Scholar]
- 37.Pierce RC, Kalivas PW. A circuitry model of the expression of behavioral sensitization to amphetamine-like psychostimulants. Brain Res Brain Res Rev. 1997a;25:192–216. doi: 10.1016/s0165-0173(97)00021-0. [DOI] [PubMed] [Google Scholar]
- 38.Pierce RC, Kalivas PW. Repeated cocaine modifies the mechanism by which amphetamine releases dopamine. J Neurosci. 1997b;17:3254–3261. doi: 10.1523/JNEUROSCI.17-09-03254.1997. [DOI] [PMC free article] [PubMed] [Google Scholar]
- 39.Pierce RC, Duffy P, Kalivas PW. Sensitization to cocaine and dopamine autoreceptor subsensitivity in the nucleus accumbens. Synapse. 1995;20:33–36. doi: 10.1002/syn.890200106. [DOI] [PubMed] [Google Scholar]
- 40.Raiteri M, Cerrito F, Cervoni AM, Levi G. Dopamine can be released by two mechanisms differentially affected by the dopamine transport inhibitor nomifensine. J Pharmacol Exp Ther. 1979;208:195–202. [PubMed] [Google Scholar]
- 41.Ross SB. Synaptic concentration of dopamine in the mouse striatum in relationship to the kinetic properties of the dopamine receptors and uptake mechanism. J Neurochem. 1991;56:22–29. doi: 10.1111/j.1471-4159.1991.tb02557.x. [DOI] [PubMed] [Google Scholar]
- 42.Sulzer D, Pothos EN. Presynaptic mechanisms that regulate quantal size. Rev Neurosci. 2000;11:159–212. doi: 10.1515/revneuro.2000.11.2-3.159. [DOI] [PubMed] [Google Scholar]
- 43.Sulzer D, Rayport S. Amphetamine and other psychostimulants reduce pH gradients in midbrain dopaminergic neurons and chromaffin granules: a mechanism of action. Neuron. 1990;5:797–808. doi: 10.1016/0896-6273(90)90339-h. [DOI] [PubMed] [Google Scholar]
- 44.Sulzer D, Maidment NT, Rayport S. Amphetamine and other weak bases act to promote reverse transport of dopamine in ventral midbrain neurons. J Neurochem. 1993;60:527–535. doi: 10.1111/j.1471-4159.1993.tb03181.x. [DOI] [PubMed] [Google Scholar]
- 45.Sulzer D, Chen TK, Lau YY, Kristensen H, Rayport S, Ewing A. Amphetamine redistributes dopamine from synaptic vesicles to the cytosol and promotes reverse transport. J Neurosci. 1995;15:4102–4108. doi: 10.1523/JNEUROSCI.15-05-04102.1995. [DOI] [PMC free article] [PubMed] [Google Scholar]
- 46.Tao L, Nicholson C. Diffusion of albumins in rat cortical slices and relevance to volume transmission. Neuroscience. 1996;75:839–847. doi: 10.1016/0306-4522(96)00303-x. [DOI] [PubMed] [Google Scholar]
- 47.Uchimura N, Higashi H, Nishi S. Hyperpolarizing and depolarizing actions of dopamine via D1 and D2 receptors on nucleus accumbens neurons. Brain Res. 1986;375:368–372. doi: 10.1016/0006-8993(86)90760-2. [DOI] [PubMed] [Google Scholar]
- 48.White FJ, Wolf ME. Psychomotor stimulants. In: Pratt JA, editor. The biological basis of drug tolerance and dependence. Academic; San Diego: 1991. pp. 153–197. [Google Scholar]
- 49.Wieczorek WJ, Kruk ZL. Differential action of (+)-amphetamine on electrically evoked dopamine overflow in rat brain slices containing corpus striatum and nucleus accumbens. Br J Pharmacol. 1994;111:829–836. doi: 10.1111/j.1476-5381.1994.tb14813.x. [DOI] [PMC free article] [PubMed] [Google Scholar]
- 50.Wieczorek WJ, Kruk ZL. Influences of neuronal uptake and D2 autoreceptors on regulation of extracellular dopamine in the core, shell, and rostral pole of the rat nucleus accumbens. Brain Res. 1995;699:171–182. doi: 10.1016/0006-8993(95)00894-v. [DOI] [PubMed] [Google Scholar]
- 51.Wightman RM, Zimmerman JB. Control of dopamine extracellular concentration in rat striatum by impulse flow and uptake. Brain Res Brain Res Rev. 1990;15:135–144. doi: 10.1016/0165-0173(90)90015-g. [DOI] [PubMed] [Google Scholar]
- 52.Wightman RM, Amatore C, Engstrom RC, Hale PD, Kristensen EW, Kuhr WG, May JL. Real-time characterization of dopamine overflow and uptake in the rat striatum. Neuroscience. 1988;25:513–523. doi: 10.1016/0306-4522(88)90255-2. [DOI] [PubMed] [Google Scholar]
- 53.Wolf ME, White FJ, Nassar R, Brooderson RJ, Khansa MR. Differential development of autoreceptor subsensitivity and enhanced dopamine release during amphetamine sensitization. J Pharmacol Exp Ther. 1993;264:249–255. [PubMed] [Google Scholar]