

Abstract
The prognostic value of immune cell infiltration within the tumor microenvironment (TME) has been extensively investigated via histological and genomic approaches. Based on the positive prognostic value of T cell infiltration, Immunoscore has been developed and validated for predicting risk of recurrence for colorectal cancer (CRC). Also, association between a consensus T helper 1 (Th-1) immune response and favorable clinical outcomes has been observed across multiple cancer types. Here, we reanalyzed public genomic data sets from The Cancer Genome Atlas (TCGA) and NCBI Gene Expression Omnibus (NCBI-GEO) and performed multispectral immunohistochemistry (IHC) on a cohort of colorectal tumors. We identified and characterized a risk group, representing approximately 10% of CRC patients, with high intratumoral CD8+ T cell infiltration, but poor prognosis. These tumors included both microsatellite instable (MSI) and stable (MSS) phenotypes and had a high density of tumor-associated macrophages (TAMs) that expressed CD274 (programmed death-ligand 1 [PD-L1]), TGF-β activation, and an immune overdrive signature characterized by the overexpression of immune response and checkpoint genes. Our findings illustrate that CRC patients may have poor prognosis despite high CD8+ T cell infiltration and provide CD274 as a simple biomarker for identifying these patients.
Keywords: Immunology, Oncology
Keywords: Cancer, Macrophages, T cells
Introduction
Since the seminal report on association between infiltrating cytotoxic and memory T cells with decreased lymphatic invasion and improved patient outcome in colorectal cancer (CRC) (1), the prognostic value of immune cell infiltration within the tumor microenvironment (TME) has become well established across many human cancer types over the past decade (2–5). Early findings, based on immunohistochemistry (IHC) assays, demonstrated that such T cell infiltrates can serve as an independent predictor for better disease-free and overall survival (OS) outcomes (6), including in early stage CRC patients (7). These observations led to development of the Immunoscore — a composite score of central and marginal T cell infiltration as an independent prognostic marker for CRC (8). Direct comparison has shown superior prognostic power for Immunoscore over tumor-node-metastasis (TNM) staging, supporting the integration of immune scoring into routine staging of CRC patients (9). Recently, a large international validation effort demonstrated the reliable performance of Immunoscore (mean of density percentiles of CD3+ and cytotoxic CD8+ T cells in the tumor and in the invasive margin) for estimating CRC patients’ risk of recurrence (10).
However, the cancer immune response is complex; contexture and organization of immune infiltrates can be highly heterogeneous among tumors even for the same cancer type (11). In parallel with histological studies, investigations into different cancer types using genomics approaches have reported a consensus T helper 1 (Th-1) immune response to be associated with favorable clinical outcomes (12). The molecular signatures underlying the Th-1 phenotype include upregulation of proinflammatory genes involved in Th-1 signaling, chemokines, and effector function. Also, correlations have been observed between expression of Th-1 signature genes and other immune-regulatory genes, e.g., CD274 (commonly known as programmed death-ligand 1 (PD-L1) or B7-H1) (13, 14), suggesting a counterbalancing mechanism between immunostimulatory and immunosuppressive mechanisms (15, 16). Nonetheless, further evaluation of patients’ prognosis beyond the contribution from T cell infiltration in CRC remains limited.
In this study, we reanalyzed public data sets from The Cancer Genome Atlas (TCGA) and the NCBI Gene Expression Omnibus (NCBI-GEO) with the focus on immune genes. We identified a risk population showing high CD8A coupled with intense CD274 gene expression among CRC patients, which is associated with poor prognosis and absent in melanoma. Notably, this poor-risk population showed significant enrichment in CRC tumors having microsatellite instability (MSI) status, a phenotype known to associate with high levels of CD8+ T cell infiltration (17–23) and normally a lower risk of relapse (24–26). To confirm these findings, we validated a cohort of 71 patients diagnosed with stage III CRC using multicolor histology. Furthermore, we investigated this newly characterized immune overdrive colorectal subgroup vis-a-vis immune cell characteristics and gene expression profile in comparison with defined consensus molecular subtypes (CMSs) (27). Finally, we discuss the therapeutic implications for this high-risk population.
Results
Observation of a subpopulation of CRC with high CD8+ T cell infiltration and poor outcome.
In melanoma, stratification of TME based on tumor-infiltrating lymphocytes (TILs) and CD274 expression by IHC is prognostic and can predict response to checkpoint blockade immunotherapies (28, 29). However, analogous analysis has not been systematically established for other cancer types. To gain further insight into these IHC-based studies of melanoma and compare the immune contextures of melanoma versus CRC, we reanalyzed public genomic data sets. We started with TCGA RNA-Seq data, which followed consistent RNA extraction and analysis protocols across cancer types to avoid potential variation introduced by different tissues of origin and IHC-based assays across studies. Figure 1A shows the scatter plot of CD8A and CD274 expression in melanoma. We applied the optimal cut-off in CD8A and CD274 gene expression (shown in Supplemental Figure 1 and Supplemental Figure 2, A and B; supplemental material available online with this article; https://doi.org/10.1172/JCI127046DS1) to best dichotomize patients into risk populations (blue lines in Figure 1A) and subsequently defined 4 groups, denoted as group I (CD8AloCD274lo), group II (CD8AloCD274hi), group III (CD8AhiCD274lo), and group IV (CD8AhiCD274hi). Consistently with melanoma IHC studies described in the literature, group IV showed the most favorable prognosis while group I showed the worst OS outcomes (Figure 1B). These 2 groups accounted for the majority (75%) of patients due to the observed correlation between CD8A and CD274 expression (shown in Figure 1A; r = 0.71), compared with 79% IHC-determined TIL+PD-L1+ and TIL–PD-L1– (29).
Figure 1. Comparison of TME stratification based on CD8A and CD274 gene expression between TCGA melanoma and CRC.

Scatter plots of log2-transformed CD8A and CD274 gene expression values are shown (A and C) for melanoma (n = 459) and CRC (n = 599), respectively. A linear regression line is plotted with the gray shaded region showing the 95% confidence interval. Pearson’s correlation coefficient r and P values are given at the bottom. MSI (black triangles) and MSS (gray circles) statuses are labeled for CRC samples. Median values of CD8A and CD274 expression are indicated with dashed gray lines. log-rank statistics were applied to identify the optimal cut-off for transforming the continuous variable of gene expression into categorical high- and low-expression groups in a survfit model. The test score at each candidate cut-off across the log-transformed gene expression values was plotted. The highest test score (indicated with a blue arrow) was applied for best separating patients into 4 different risk groups (using solid blue lines; named groups I to IV). To compare risk groups between melanoma and CRC, we also applied a secondary peak of test scores (red arrow with an asterisk, which revealed a reverse pattern of survival in CRC as shown in Supplemental Figure 2) for CD274 stratification (indicated with a solid red line instead of a blue line; named groups I, II, III* and IV*). Each stratified risk group is labeled with its population fraction in percentages. Kaplan-Meier survival curves for the 4 risk groups are plotted for melanoma (B) and CRC (D and E). The log-rank test P values are shown for each plot.
In contrast to melanoma, CRC showed a very different, multiple-peak pattern based on log-rank tests across CD8A and CD274 expression (Supplemental Figure 1C and Supplemental Figure 2C). Although dichotomizing patients using the highest peak (42.07 percentile for CD8A and 28.54 percentile for CD274) agreed with the general understanding that the high-expression group was associated with a favorable prognosis (Supplemental Figure 1D and Supplemental Figure 2D), the bimodal distribution with opposite survival pattern revealed a second population of high-risk subjects at the higher expression end (Supplemental Figure 1E and Supplemental Figure 2E). Since the majority of samples with the expression level above the secondary CD274 peak were within the CD8Ahi group, we applied this secondary cut-off (indicated with red line in Figure 1C; 83.14 percentile) for stratifying a new CD8AhiCD274hi* population as group IV* (denoted with an asterisk for the higher cut-off for CD274 expression). This yielded reverse survival trends as melanoma (Figure 1D). While group I (CD8AloCD274lo) still showed unfavorable outcomes as in melanoma, group IV* (CD8AhiCD274hi*; accounted for 16.5% of total population) now showed unfavorable outcomes despite having high levels of CD8A (Figure 1E). Group III* (CD8AhiCD274lo*) showed the most favorable outcomes in CRC, with the majority of these samples having high CD8A without intense CD274 expression. To further demonstrate the absence of a poor risk group IV* in melanoma, we applied the same CRC cut-off (based on CD274 percentile) to a TCGA melanoma CD8Ahi population. As shown in Supplemental Figure 3, clinical outcome of this virtual group IV* remains the most favorable.
Identification and validation of the CRC risk subpopulation with additional cohorts.
To validate the existence of this CD8AhiCD274hi* risk population in CRC, we assembled additional cohorts and established a validation approach applicable to all cohorts. Figure 2 shows that bimodal distribution of log-rank test scores showing opposite CD274 prognostic behaviors is dependent on CD8A gene expression levels. We applied the commonly used median value (near the optimal CD8A cut-off) to define CD8Ahi and CD8Alo populations, followed by OS analysis based on optimal cut-off of CD274 expression independently determined in each population (Figure 2, B and D). The optimal cut-offs determined in CD8Ahi and CD8Alo populations are close to the previously observed bimodal distribution peaks (compared with Figure 2A). Intriguingly, CD274 expression levels serve as a prognostic marker with opposite outcomes for the CD8Ahi and CD8Alo groups (Figure 2, C and E). Therefore, we adopted this approach to identify the poor outcome group IV* from the CD8Ahi population and to validate in additional cohorts. Figure 3, A–C, show the OS comparison among the 2 CD8Ahi groups (group IV* and III* for CD274hi* and CD274lo*) and the CD8Alo population (group I+II) in the TCGA data set. In both analyses, considering either all patients (stage I to IV) or patients diagnosed at stage II and III, group IV* showed poor outcomes despite high CD8+ T cell infiltration.
Figure 2. Prognostic significance of CD274 is dependent on CD8A gene expression levels in CRC.

The log-rank test score at each candidate cut-off across the log-transformed CD274 gene expression values was plotted (A). A bimodal score distribution was observed, and 2 cut-offs (indicated with blue and red arrows) were tested for dichotomizing the patients for survival analysis (as shown in Figure 1 and Supplemental Figure 2). Scatter plots of log2-transformed CD8A and CD274 gene expression values are shown for TCGA data set (B and D). Median value of CD8A expression was applied to test prognostic significance of CD274 expression in CD8Alo (B) and CD8Ahi (D) populations (n = 299 and 300, respectively; boxed by blue lines). Kaplan-Meier survival curves are plotted (C and E) for the risk groups stratified by optimal CD274 cut-offs shown (B and D). THe log-rank test P values are shown for each plot.
Figure 3. Validation of the CRC risk subpopulation using NCBI-GEO data set.

Scatter plots of log2-transformed CD8A and CD274 gene expression values are shown for TCGA (A) and NCBI-GEO GSE39582 (D) data sets, with risk groups indicated (group I+II as CD8Alo, III* and IV* as CD8Ahi dichotomized by CD274 expression as shown in Figure 2). For OS analysis, Kaplan-Meier survival curves for the 3 risk groups are plotted for TCGA stages I to IV (B) (n = 599) and TCGA stages II to III samples (C) (n = 391), NCBI-GEO GSE39582 stages I to IV (E) (n = 557) and GSE39582 stages II to III samples (F) (n = 461). The log-rank test P values are shown for each plot.
We then employed additional independent data sets to validate the existence of group IV*. The first validation cohort was GSE39582 from the NCBI-GEO data repository. This data set included CRC patients across clinical stages with information on both OS and relapse-free survival (RFS) outcomes, along with microarray-derived gene expression profiles of corresponding tumors. Based on OS analysis (Figure 3, D–F), we employed the same approach to identify group IV* and validated that this group has poor OS outcomes. Based on RFS analysis using the identical cohort, initial investigation taking the same approach also revealed that group IV* had a higher risk of relapse compared with group III* (Supplemental Figure 4, A and B). To further strengthen the RFS investigation, we conducted a metaanalysis based on additional data sets (detailed in Methods) focusing on stage II or III CRC patients. As shown in Supplemental Figure 4, C and D, group IV* consistently showed less favorable outcomes compared with other risk groups.
Using a Cox regression model, association between survival and clinicopathologic variables in TCGA and NCBI-GEO data sets were analyzed for stage II and III patients (Supplemental Table 1). In a multivariate analysis, group IV* (CD8AhiPD-L1hi*) remains an independent prognostic variable for TCGA OS, NCBI-GEO GSE39582 OS, and NCBI-GEO metaanalysis RFS analysis (Table 1), with hazard ratios against group III* (CD8AhiCD274lo*) of 3.27 (1.53~7.00, P = 0.0023) for TCGA (OS), 2.08 (1.13~3.84, P = 0.019) for NCBI-GEO GSE39582 (OS), and 1.69 (1.08~2.64, P = 0.021) for NCBI-GEO meta-analysis (RFS).
Table 1. Multivariable survival model.

To further validate these genomic findings, we collected 71 stage III CRC patients from the City of Hope tumor registry. We utilized high-dimensional (4 to 7 colors) IHC staining with multispectral image analysis (PerkinElmer Vectra) of archival CRC tumors from our City of Hope cohort to crossvalidate genomic findings. An initial staining panel was developed to visualize CD8, PDCD1 (PD-1), CD274, and KRT20 (CK20) simultaneously on the same tissue slide. PDCD1 colocalized on CD8+ T cells, and CD274 was mainly present on KRT20– (nontumor) cells (Figure 4A and Supplemental Figure 5A). To further delineate the cell-type source of CD274 expression, a second multicolor IHC panel was developed that included CD274, CD68, and KRT20. Out of these 71 primary tumors, 5 samples were observed to have CD274 expression on KRT20+ (tumor) cells. For these 5 samples, only 5%–8% of CD274+ cells were observed with KRT20 coexpression, while over 90% of CD274+ cells were observed with CD68 coexpression. In the remaining 66 samples, CD274 expression was observed exclusively on CD68+ cells. Thus, CD274 expression was almost entirely observed on CD68+ tumor-associated macrophages (TAMs) within CRC tumors (Supplemental Figure 5B). To validate the combined impact of CD8 and CD274 on patients’ clinical outcomes, we applied the same TCGA data-defined stratification. As shown in Figure 4B, low CD8+ T cells were predictive of disease relapse, with the majority of relapse events observed in CD8lo Group I+II. Favorable prognosis was again observed with group III* patients. Importantly, all 7 patients with group IV* profiles (10% of this cohort) relapsed. In addition, group IV* had the highest density of CD68+ TAMs compared with the other groups (Figure 4C). Furthermore, the high density of infiltrated CD68+ TAMs in group IV* was a result of CD68+CD274 coexpressed cells (Figure 4, D and E), but not CD68+CD274 negative cells (Figure 4F). Overall, group IV* had the highest levels of CD274+ TAMs (Supplemental Figure 5C).
Figure 4. Histological analysis of archival CRC tumors.

(A) Representative multiplex fluorescent image of a stage III colorectal tumor using a panel of markers including CD8, PD-1, CD274, KRT20 (CK20), and DAPI on FFPE tumor specimen in a City of Hope cohort (n = 71). Original magnification, ×200. (B) Scatter plot of log2-transformed CD8 and CD274 (Stroma) cell density (cells/mm2) across the entire cohort. Median values of CD8 and CD274 cell density are indicated with solid blue and dashed gray lines, respectively, along with relapse and MMR status. CD68+ TAM infiltration and the CD274 expression among CRC risk groups were quantified using a second panel of markers, including CD68 (representative images shown in Supplemental Figure 4). Standard boxplots (horizontal lines at the 25th percentile, the median, and the 75th percentile) are applied to visualize the distribution of log2-transformed cell density (cells/mm2) of (C) CD68+ macrophages, (E) CD274+CD68+ macrophages, and (F) CD274–CD68+ macrophages across the 3 observed risk groups. Fraction of CD68+ macrophages with CD274 expression for samples across the 3 observed risk groups is compared in D. MMR-deficient (black triangles) and -proficient (gray circles) samples are labeled. Statistical P values between groups were determined by Welch’s t tests after Bonferroni’s correction for multiple comparisons. ***P < 0.001; **P < 0.01; *P < 0.05.
Consistent with our IHC observations, both TCGA and NCBI-GEO GSE39582 data sets showed that CD68 expression in group IV* (CD8AhiCD274hi*) was significantly higher than in the other 2 groups (Supplemental Figure 6, E and F; illustration focuses on stage II and III samples from this point). This analysis also revealed a strong positive correlation between CD274 and CD68 genes, but a negative correlation between CD274 and KRT20 genes (Supplemental Figure 7). We also found a strong positive correlation between CD8A and PDCD1 genes, supporting our IHC observations that CD274 expression was mainly from macrophages rather than cancer cells. In addition, we examined the expression of IFNG, which was reported as the most potent inducer of CD274 expression in various cancer types, within TME (30). As shown in Supplemental Figure 8, A–H, the IFNG gene was highly expressed in group IV*, as were genes involved in downstream signaling after IFN-γ binding, exemplified by JAK2, STAT1, and IRF1. In contrast, 2 recently identified posttranslational regulators of CD274, CMTM4 and CMTM6 (31), were either negatively correlated with CD8A expression levels or not different between the groups (Supplemental Figure 8, I–L).
Enrichment in MSI tumors.
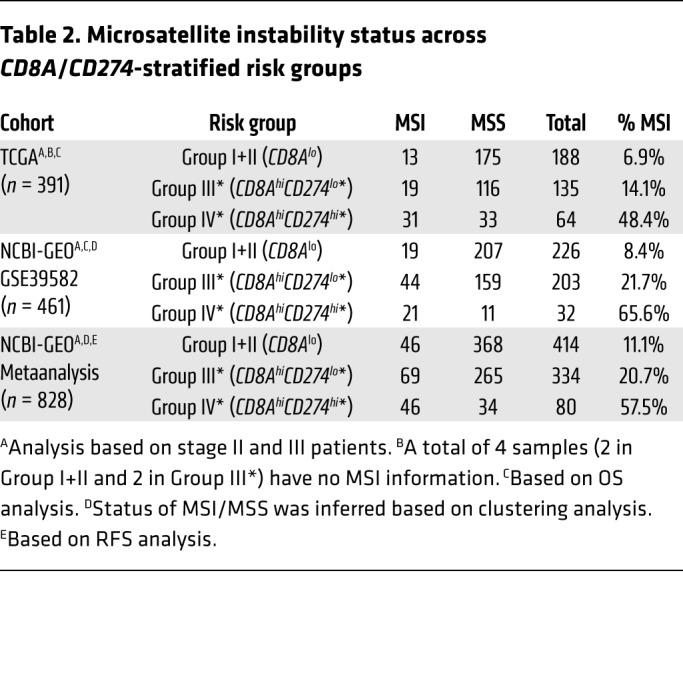
Based on the multivariable survival model across our investigated data sets, there was no significant association for MSI status (Table 1), which is known to associate with lymphocytic infiltrate and good prognosis (32). To reconcile the generally lower-risk profile of MSI tumors with CD274 expression, we further investigated the MSI status across the investigated data sets. As shown in Table 2 (also visualized in Figure 1C and Figure 3A using triangles for TCGA data set), the 2 CD8Ahi groups IV* and III* showed a higher fraction of MSI samples (in combination, a total of 25.1%, 27.7%, and 27.8% in TCGA, NCBI-GEO GSE39582, and NCBI-GEO metaanalysis, respectively), compared with group I (6.9%, 8.4% and 11.1%). The higher MSI proportion was particularly remarkable for group IV* (48.4%, 65.6%, and 57.5% in TCGA, NCBI-GEO GSE39582, and NCBI-GEO metaanalysis, respectively), given the normally low-risk profile of MSI. Similarly, despite the smaller sample size in our City of Hope data set, over half of the group IV* patients (4 of 7; 57%) were MSI (mismatch-repair [MMR] deficient).
Table 2. Microsatellite instability status across CD8A/CD274-stratified risk groups.
Immune characteristics of the CD8hiCD274hi* risk group.
Strong correlation of RNA expression among a set of Th-1 immune response genes with other immune-regulatory markers, including CD8A and CD274, has been demonstrated in multiple cancer types (exemplified in Bedognetti et al.; ref. 12). The coactivation of these proinflammatory and regulatory genes has been shown to associate with favorable outcomes. To investigate the counterbalancing mechanisms in CRC beyond CD8A and CD274, we first examined the expression correlation among 20 Th-1 immune response and regulatory genes and compared it with the expression correlation among the same gene set in melanoma (Supplemental Figure 9, A and B). Such correlation was also observed for the majority of these signature genes across the TCGA samples applied to this study (mean Spearman’s correlation coefficient 0.59 or 0.63 with exclusion of 3 genes showing relatively lower correlation). Supplemental Figure 9C shows a heatmap for the coexpression of Th-1 signature genes for the risk groups stratified by CD8A and CD274 using TCGA data. Although these genes individually expressed at different levels, group IV* samples, regardless of MSI status, showed the highest overall expression across the gene set. We then expanded the gene list of interest to a well-annotated panel of immune-related genes (NanoString nCounter PanCancer Immune Profiling Panel). Supplemental Figure 9D illustrates the expression pattern across a total of 625 genes, including cell-type specific, immune response, and checkpoint genes. A similar coexpression pattern across the risk groups was again observed, extending beyond the Th-1 signature genes.
To further investigate the relative proportions of immune infiltrates in group IV* tumors, we employed 2 different deconvolution methods, CIBERSORT (33) and TIMER (34), using TCGA data. As these 2 methods were developed for inferring numbers of different immune subsets using different algorithms (35, 36), we aggregated relevant CIBERSORT results into the same 6 major cell types from TIMER: B cells, CD4+ T cells, CD8+ T cells, macrophages, dendritic cells, and neutrophils. We observed similar patterns showing that all 6 major cell-type infiltrates were highly enriched in group IV* (Supplemental Figure 10). We also examined the expression of markers commonly used for identifying immune cell types, e.g., CD19 and MS4A1 (CD20) for B cells; CD3D, CD3E, and CD4 for T cells; CD163 and CD68 for macrophages; ITGAX (CD11c), CD209, and HLA-DRB1 for dendritic cells; FCGR3A (CD16), FCGR2A (CD32), and CSF3R (CD114) for neutrophils; and FOXP3 for regulatory T cells. As exemplified in Supplemental Figure 6, these markers were all highly upregulated in group IV* samples in both TCGA and NCBI-GEO GSE39582 data sets. Notably, total immune infiltrates estimated by CIBERSORT (sum of all 22 inferred immune subsets) in both data sets were highest in group IV* (Figure 5, A and B). In contrast to total immune infiltrates, group IV* had relatively lower levels of cancer cells (based on KRT20 expression) than group I+II or III* (Figure 5, C and D).
Figure 5. Comparisons of total immune infiltrates and expression levels of cancer cell and representative checkpoint markers across the CRC OS risk groups in TCGA and NCBI-GEO GSE39582 stage II and III samples.

Standard boxplots (horizontal lines at the 25th percentile, the median, and the 75th percentile) are applied to visualize total immune infiltrates and overall gene expression of cancer cells and representative checkpoint markers for each risk group, with MSI (black triangles) and MSS (gray circles) samples labeled. Total immune infiltrates estimated by the tumor deconvolution algorithm CIBERSORT (sum of absolute scores across 22 immune cell types) are shown in panels A and B. KRT20 is applied to represent CRC cells (C and D), and CTLA4 represents immune checkpoint genes (E and F). Statistical P values between groups were determined by Welch’s t tests after Bonferroni’s correction for multiple comparisons: ***P < 0.001, **P < 0.01, *P < 0.05. (A, C, and E) TCGA, n = 391; (B, D, and F) NCBI-GEO GSE39582, n = 461.
To further reconcile why group IV* has poor outcome despite high CD8+ T cell infiltration, we analyzed the expression of representative checkpoint genes, as they are known to associate with T cell dysfunction (37) and may act to limit antitumor immune responses (38). Group IV* had the highest expression of all checkpoint genes we examined, exemplified by CTLA4 (Figure 5, E and F), CD274, HAVCR2 (TIM-3), TNFRSF9 (4-1BB or CD137), LAG3, TIGIT, and ICOS (Supplemental Figure 11). Moreover, recent studies proposed that elevation of transforming growth factor TGF-β signaling is the primary mechanism of immune evasion (39–41). As shown in Figure 6A, TGF-β–encoding genes (as the average of TGFB1, TGFB2, and TGFB3) were highly expressed in group IV* irrespective of their MSI status. Also, a recent pan-cancer study identified a set of 30 upregulated extracellular matrix genes in cancer (referred to as C-ECM genes) which significantly associated with poor prognosis (42). Figure 6B demonstrates elevated expression of these genes in group IV*.
Figure 6. Expression of TGF-β–encoding and C-ECM signature genes and the distribution of CMSs across the CRC OS risk groups in TCGA stage II and III samples.

Standard boxplots (horizontal lines at the 25th percentile, the median, and the 75th percentile) are applied to visualize the expression levels of (A) TGF-β–encoding genes (log2-transformed averages of TGFB1, TGFB2, TGFB3 genes) and (B) C-ECM genes (log2-transformed average of 30 upregulated signature genes). Median expression value is indicated with a dashed line. Statistical P values between groups were determined by Welch’s t tests after Bonferroni’s correction for multiple comparisons: ***P < 0.001. (C) Fractions of CMS subtypes (CMS1, MSI immune; CMS2, canonical; CMS3, metabolic; CMS4, mesenchymal) in each of our stratified risk groups. (D) Kaplan-Meier survival curves for CMS1 patients further separated into CD8Ahi risk groups III* and IV*. (A–C) TCGA, n = 301; (D) TCGA CMS1, n = 48.
Together, these results demonstrate that all major immune cell types and checkpoint genes are overrepresented in group IV* CRC tumors regardless of MSI status, reflecting an immune overdrive phenotype. Furthermore, TGF-β–encoding genes are upregulated, reflecting the immunosuppressive nature of group IV*.
Finally, our risk group stratification is distinct from the recent CMS classification of CRC tumors (27). Figure 6C shows comparison between CMS classification and our CD8A/CD274-stratified risk groups: group IV* largely overlaps with CMS1 (referred to as MSI immune subtype; featuring immune infiltration and activation) and CMS4 (mesenchymal; stromal infiltration and TGF-β activation) subtypes (47.5% and 36.1% respectively; for a total of 83.6%). Furthermore, CD8A/CD274 can further stratify CMS1 into different risk groups (Figure 6D): group IV* CMS1 patients carried a 3.8-fold higher OS risk over group III* CMS1 patients. Similar patterns were also validated in the NCBI-GEO GSE39582 data set (Supplemental Figure 12). This demonstrates that CD8A/CD274 stratification has additional and independent prognostic implications beyond CMS classification.
Discussion
The profound resources of genomic data in the public domain have provided unique opportunities to further our understanding of the molecular features of different cancers (43). Recently, Iglesia et al. evaluated the expression of immune signature gene sets and OS using TCGA data across 11 cancer types (44). Although high expression of T and B cell signatures predicted improved OS in many cancer types, there was no statistically significant association observed with CRC. This represents a paradox given recent findings from the consensus Immunoscore for CRC, which stratifies patients prognostically by intratumoral and invasive T cell infiltration (10). Our observation, also based on TCGA data and validated in additional data sets, provides a potential explanation for this apparent paradox, since the overall immune gene expression in both group IV* (CD8AhiCD274hi*) and group I+II (CD8Alo) risk groups was associated with worse outcomes compared with those of group III* (CD8AhiCD274lo*) group.
It is important to note that our analysis does not contradict — but rather extends — the Immunoscore. The majority of CRC tumors with high CD8+ T cell infiltration still have favorable outcomes. However, our findings reveal that CRC tumors with concurrent high CD274 gene expression may be mislabeled as indicating good prognosis by simply following the Immunoscore classification, which is based solely on CD3 and CD8 (Supplemental Figure 6, C and D, for CD3E gene and similar observations for CD3D, CD3G, and CD8B genes; data not shown). As such, our results illustrate that not all CRC tumors with high T cell infiltration have good clinical outcome, and further refinement on Immunoscore as a prognostic marker can be made by including the CD8/CD274 signature.
The clinical significance of CD274 expression within primary CRC tumors, independent of immune checkpoint blockade therapy, has not been established. CD274 quantitative expression patterns and associated prognosis often vary across studies due to technical variation and different analysis criteria, e.g., IHC assay–associated positivity for high and low expression. For example, the cut-off for CD274 expression in Lee et al. (45), Koganemaru et al. (46), and Huang et al. (47) was based on IHC assay (using 5% of CD274-positive cells as the criteria for low or high) while Dunne et al. (48) utilized hierarchical clustering to identify the high CD274 population. In our genomic data analysis, although applying the most optimal cut-off to dichotomize either CD8A or CD274 expression could reveal favorable outcomes for the high-expression group (as shown in Figure 1, Supplemental Figure 1, and Supplemental Figure 2), we further defined a negative prognostic value with the focus on group IV* (CD8AhiCD274hi*), accounting for approximately 10% of CRC patients. We believe that any discrepancy between our analysis and these other reports may be predominantly due to a higher cut-off defining our CD274hi* subgroup (approximately highest 10% of the population) and our combinational analysis of CD274 and CD8A expression. The reproducibility of our findings across multiple data sets and using different methodologies (histology and genomics) adds validity to our findings.
Consistent with other reports, we also found an association between MSI and CD8AhiCD274hi* status (16, 49). This is not surprising, given an increased antigenicity of these hypermutated tumors, which drives neoantigen-specific CD8+ T cell infiltration and compensatory upregulation of immune checkpoints (16). However, we consistently found a poor prognosis for the MSI-enriched CD8AhiCD274hi* subpopulation across all independent data sets. These findings shed important insight into current clinical dogma that all MSI-H tumors carry a good prognosis and low risk of relapse (17, 20, 22, 24–26). Our data reveal that MSI tumors may be further stratified based on CD8A and CD274 expression. Beyond risk stratification, our analysis showed that group IV* tumors have an immune overdrive phenotype, as exemplified by high levels of all immune cells and immune checkpoints, along with lower levels of cancer cells. Furthermore, these tumors have an immunosuppressive phenotype with high expression of TGF-β and ECM genes.
Metastatic CRC patients with MSI tumors benefit from treatments targeting PD-1/PD-L1 (50, 51). Our results suggest that nonmetastatic stage II and III patients with group IV* MSI tumors are particularly prone to relapse and may be more appropriate for adjuvant strategies. PD-1/PD-L1 blockade is currently being investigated in combination with chemotherapy in a large intergroup study (ATOMIC trial) in stage III patients with MSI-H tumors. Our results suggest that patients with the highest CD274 expression levels may be at higher risk of relapse and would indeed benefit from immunotherapy. Future analysis of the ATOMIC trial results based on a composite score of CD8 and CD274 may help confirm whether PD-1/PD-L1 targeting should be limited to our group IV* population. In addition, our findings raise concern regarding the potential undertreatment of a fraction of stage II disease patients with MSI-H tumors (group IV*). The selection of this potentially high-risk group for additional PD-1/PD-L1 blockade studies may be important in the future, especially if our prognostic signature is validated in additional studies. In addition to PD-1/PD-L1 targeting, our results also suggest that combination of checkpoint blockade with targeting macrophages (52) or TGF-β pathway (39) may be suitable for group IV* patients. Importantly, similar strategies could also be effective for patients with microsatellite stable (MSS) group IV* tumors, even though MSS tumors are generally not thought to respond to immune checkpoint therapy. While prior studies failed to show a benefit from PDCD1 (PD-1) targeting in CD274-positive MSS stage IV CRC, such studies implemented a low cut-off for CD274 positivity and did not include lymphocytic infiltration as an inclusion factor (53). High levels of CD8+ T cell infiltration and high expression of CD274 are common characteristic of MSI-H CRC tumors associated with response to PD-1/PD-L1 inhibition (16, 54). A proof-of-principle pilot clinical trial of PD-1/PD-L1 inhibitors in selected MSS group IV* patients may be warranted and would confirm this hypothesis. Given the relatively low prevalence of group IV* within stage IV MSS patients (Supplemental Table 2), such studies would require a collaboration among multiple institutes with the implementation of a CD8/CD274 prescreening strategy using a higher cut-off more in line with our results.
A limitation of our study is the retrospective nature of our analysis from public databases (TCGA and NCBI-GEO) and archival tumor samples from a single institute (City of Hope). However, the strength of this study is that different methodologies (reanalysis of public genomic data sets and IHC with quantitative image analysis) yielded consistent reproducibility of our findings across different data sets. Using different methodologies in different patient populations is likely to overcome potential biases and add confidence to our findings. While intriguing and hypothesis generating, our study requires further validation with a standardized CD274 and CD8 assay in a large prospective patient population.
In conclusion, our data provide compelling evidence that a subset of CRC patients exists with high immune infiltration, but poor clinical outcome: combined evaluation of CD8+ T cell infiltration and CD274 expression is a strong predictor of disease recurrence and OS in CRC patients. Furthermore, this can be readily implemented via IHC staining of 2 markers — as opposed to CMS classification that requires gene expression profiling. Patients with group IV* (CD8hiCD274hi*) tumors, irrespective of MSI status, may benefit from more aggressive monitoring and treatment.
Methods
Patients.
This study employed multiple patient cohorts for discovery and validation. The melanoma and CRC discovery cohorts were based on data from the TCGA Research Network (http://cancergenome.nih.gov/). A total of 459 melanoma and 599 primary colon or rectum tumors (391 stage II or III) having both gene expression (level 3 RNA-Seq data by either Illumina GA or HiSeq platforms) and OS data were recruited to this study. The clinical information was updated from the standardized TCGA Pan-Cancer Clinical Data Resource (55) with the removal of patients having a follow-up time or time to death of less than or equal to 0 days. For validation, we first applied a cohort from NCBI-GEO, GSE39582 (n = 557; 461 stage II or III). CRC patients across clinical stages with available information of both OS and RFS outcomes were included in our analyses. The second validation cohort was a metaanalysis based on additional NCBI-GEO studies, including GSE39582, GSE14333, GSE17538, GSE31595. A total of 828 stage II or III samples having RFS data (OS data incomplete for all data sets) were recruited to this analysis. Patient characteristics for these data sets are summarized in Supplemental Table 3. The third validation cohort, colon cancer cases with primary tumor resection between 1989 and 2014, was identified through the City of Hope Comprehensive Cancer Center tumor registry. A total of 71 stage III colon cancer patients, including 35 cases with recurrent disease and 36 cases with 5-year disease-free survival, were selected for the analysis. Primary tumors from this cohort were profiled by multispectral fluorescent IHC for key immune biomarkers.
Gene expression data analysis.
For the TCGA data set, RNA-Seq expression data for human melanoma (SKCM), colon (COAD) and rectal (READ) cancer patients were downloaded from the TCGA data portal. RNA-Seq by Expectation-Maximization (RSEM) expression values were applied to this study. Correlation plots among the proinflammatory and immune-regulatory genes displaying an active Th-1 phenotype were generated by R package corrplot (version 0.84; https://github.com/taiyun/corrplot).
For NCBI-GEO GSE39582 microarray data, series matrix file was downloaded for the gene expression measures. For the NCBI-GEO stage II and III metaanalysis, CEL files of Affymetrix Human Genome U133plus2 Array were downloaded. The 828 samples, along with an additional 155 samples for MSI status analysis (GSE13294), were converted to background-adjusted, quantile-normalized, and log-transformed expression values using the robust multiarray average (RMA) algorithm (56) in the Bioconductor package affy (57) (version 1.52.0). Batch effect was further adjusted using Combat function in the Bioconductor package sva (58) (version 3.22.0). Gene expression data from probes 205758_at (CD8A), 223834_at (CD274), 213953_at (KRT20), and 236341_at (CTLA4) were applied to the presentation in the main figures of this study.
To estimate the abundances of immune infiltrates in TME using gene expression data, we first employed CIBERSORT (33) (https://cibersort.stanford.edu/) using the provided LM22 signature genes file (22 immune cell types) with both relative and absolute modes. For TCGA RNA-Seq data, the quantile normalization setting was disabled, as suggested by the authors. For NCBI-GEO microarray data, multiple probes for a single gene were collapsed and then merged by gene identifier using the collapseRows function in the R package WGCNA prior to the analysis (59). We also compared the TCGA deconvolution analysis with published estimates by another algorithm, TIMER (34).
Multispectral fluorescent IHC.
Formalin-fixed, paraffin-embedded (FFPE) specimens from the City of Hope cohort were cut into 3 μm sections, mounted on glass slides, and stained with 2 multispectral IHC biomarker panels. The first panel included CD8 (Biocare; clone: SP16, catalog: CRM311C, lot: 031115), PDCD1 (PD-1) (Biocare; clone: NAT105, catalog: ACI3137CK, lot: 042216), CD274 (SpringBio; clone: SP142, catalog: M4420, lot: 1609091), KRT20 (CK20) (Dako; clone: KS20.8, catalog: M701929-2, lot: M7019), and DAPI (PerkinElmer). The second panel included CD68 (Biocare; clone: kp1, catalog: CM033B, lot: 100708), PD-L1, CK20, and DAPI. Biomarker staining, image acquiring and image analysis were done as previously reported (50, 60). Briefly, sections were first deparaffinized and subjected to antigen retrieval. Heat-induced epitope retrieval was performed in Envision FLEX Target Retrieval Solution (K8004/5, Agilent) using a microwave oven. Antibody diluent (S3022, Agilent) was applied to minimize nonspecific background staining. Slides were then serially stained with primary antibodies and horseradish peroxidase–conjugated secondary antibodies (MACH2 HRP-Polymer, Biocare), followed by using Opal Multicolor IHC kits (PerkinElmer) for immunofluorescence labeling. Serial staining was performed repetitively by stripping off previous primary/secondary antibodies via microwave treatment. After staining the final marker, nuclei were stained with DAPI and the slides were mounted with ProLong Gold Antifade Mountant (P36930, Thermo Fisher). All slides were scanned using the Vectra 3.0 automated quantitative pathology imaging system (PerkinElmer) to detect and measure the expression of biomarkers. All fields containing both tumor and stroma were captured with a ×20 Olympus lens objective. Images were analyzed using inForm®Cell Analysis software (PerkinElmer), which trains machine-learning algorithms to segment the images into tissue areas of cancerous cells and stromal cells, to segment individual cells by DAPI counterstaining, and to accurately identify and quantify the phenotypes of those cells in all high-power fields within the entire tissue section.
Analysis of DNA MMR status.
For FFPE specimens from the City of Hope cohort, IHC for DNA MMR proteins was performed as previously described (61). The rabbit anti-human MLH1 monoclonal antibody (Abcam; clone EPR3894, catalog ab92312), mouse anti-human MSH2 monoclonal antibody (Biocare; clone FE11, catalog SKU219), mouse anti-human MSH6 monoclonal antibody (Biocare; clone BC/44, catalog SKU265), and mouse anti-human PMS2 monoclonal antibody (Biocare; clone A16-4, catalog SKU344) were used for MMR protein staining. MMR status was reported as MMR proficient (presence of nuclear expression of all MMR proteins in tumor cell) or MMR deficient (absence of nuclear expression of any MMR protein) (Supplemental Figure 13).
For TCGA data set, patient MSI information was retrieved from clinical data files. We defined MSI-high as MSI and combined MSI-low and MSS as MSS for this analysis. For the NCBI-GEO data set, the MSI status was determined by hierarchical clustering using a panel of 543 signature genes deferentially expressed between MSI and MSS groups (62). The clustering analysis was shown using a heatmap (Supplemental Figure 14). We applied 155 samples with known MSI information (downloaded from GSE13294, including 78 MSI and 77 MSS) as our control samples for the identification of MSI and MSS clusters. As a result, 161 of the 828 samples clustered with known MSI samples, accounting for 19.4% of the cohort.
Statistics.
CD8A and PD-L1 gene expression were chosen for investigation from the 20 correlated genes (Bedognetti et al.; ref. 12). We used log-rank statistics to identify the optimal expression cut-off for each gene with regard to the associated hazard of death or relapse events in a survfit model (63), using the cutp function of the R package survMisc (version 0.5.5; https://CRAN.R-project.org/package=survMisc). The cut-off with the highest log-rank test score was selected for best separating patients into high- and low-expression groups with different risks. Upon observing a bimodal distribution of marginal log-rank statistics for CRC, but not melanoma, CD274 expression value at a secondary mode was used to identify a second set of high-risk subjects. Kaplan-Meier curves were used to estimate and display overall and RFS. Cox proportional hazards regression models were used when covariates were jointly modeled. Both univariate and multivariate Cox proportional hazards regression models were applied to estimate the hazard ratios and confidence intervals. The analysis was conducted using survival packages in R (version 2.42.3; https://CRAN.R-project.org/package=survival). A P value of 0.05 was applied as the cut-off for determining statistical significance.
Study approval.
The study using the City of Hope cohort was conducted under an IRB-approved protocol (IRB15058).
Author contributions
MF, CO, CW, PPL conceived the study. CO collected and analyzed public data sets. MF, MC, MS contributed to clinical sample identification. CW, TYT, and MCG carried out the IHC experiments and analysis. CO and JAL conducted statistical analysis. MF, CO, and PPL wrote the manuscript with input from CW and JAL. MF and CO share the first-author position based on the equal significance of their individual contributions. The order is alphabetical by last names.
Supplementary Material
Acknowledgments
The results discussed here are in part based upon data generated by the TCGA Research Network (http://cancergenome.nih.gov/). Tissue samples applied in this work were provided by the City of Hope Biospecimen Repository, which is funded in part by the National Cancer Institute (NCI). This work was funded by an NCI Cancer Center Support Grant Pilot Project Award. Research reported in this publication included work performed at the Biostatistics Core and Immuno-Oncology Core supported by the NCI (NIH) under award number P30CA33572. The content is solely the responsibility of the authors and does not necessarily represent the official views of the NIH.
Version 1. 09/16/2019
Electronic publication
Version 2. 09/17/2019
Typographical error corrected in Figure 1A
Version 3. 10/01/2019
Print issue publication
Footnotes
Conflict of interest: The authors have declared that no conflict of interest exists.
Copyright: © 2019, American Society for Clinical Investigation.
Reference information: J Clin Invest. 2019;129(10):4464–4476.https://doi.org/10.1172/JCI127046.
Contributor Information
Marwan Fakih, Email: mfakih@coh.org.
Ching Ouyang, Email: couyang@coh.org.
Chongkai Wang, Email: chowang@coh.org.
May Cho, Email: maycho@ucdavis.edu.
Marvin Sy, Email: marvincsy@gmail.com.
References
- 1.Pagès F, et al. Effector memory T cells, early metastasis, and survival in colorectal cancer. N Engl J Med. 2005;353(25):2654–2666. doi: 10.1056/NEJMoa051424. [DOI] [PubMed] [Google Scholar]
- 2.Jochems C, Schlom J. Tumor-infiltrating immune cells and prognosis: the potential link between conventional cancer therapy and immunity. Exp Biol Med (Maywood) 2011;236(5):567–579. doi: 10.1258/ebm.2011.011007. [DOI] [PMC free article] [PubMed] [Google Scholar]
- 3.Fridman WH, Pagès F, Sautès-Fridman C, Galon J. The immune contexture in human tumours: impact on clinical outcome. Nat Rev Cancer. 2012;12(4):298–306. doi: 10.1038/nrc3245. [DOI] [PubMed] [Google Scholar]
- 4.Galon J, Angell HK, Bedognetti D, Marincola FM. The continuum of cancer immunosurveillance: prognostic, predictive, and mechanistic signatures. Immunity. 2013;39(1):11–26. doi: 10.1016/j.immuni.2013.07.008. [DOI] [PubMed] [Google Scholar]
- 5.Norton SE, Ward-Hartstonge KA, Taylor ES, Kemp RA. Immune cell interplay in colorectal cancer prognosis. World J Gastrointest Oncol. 2015;7(10):221–232. doi: 10.4251/wjgo.v7.i10.221. [DOI] [PMC free article] [PubMed] [Google Scholar]
- 6.Galon J, et al. Type, density, and location of immune cells within human colorectal tumors predict clinical outcome. Science. 2006;313(5795):1960–1964. doi: 10.1126/science.1129139. [DOI] [PubMed] [Google Scholar]
- 7.Pagès F, et al. In situ cytotoxic and memory T cells predict outcome in patients with early-stage colorectal cancer. J Clin Oncol. 2009;27(35):5944–5951. doi: 10.1200/JCO.2008.19.6147. [DOI] [PubMed] [Google Scholar]
- 8.Galon J, et al. The immune score as a new possible approach for the classification of cancer. J Transl Med. 2012;10:1. doi: 10.1186/1479-5876-10-1. [DOI] [PMC free article] [PubMed] [Google Scholar]
- 9.Galon J, et al. Towards the introduction of the ‘Immunoscore’ in the classification of malignant tumours. J Pathol. 2014;232(2):199–209. doi: 10.1002/path.4287. [DOI] [PMC free article] [PubMed] [Google Scholar]
- 10.Pagès F, et al. International validation of the consensus Immunoscore for the classification of colon cancer: a prognostic and accuracy study. Lancet. 2018;391(10135):2128–2139. doi: 10.1016/S0140-6736(18)30789-X. [DOI] [PubMed] [Google Scholar]
- 11.Angell H, Galon J. From the immune contexture to the Immunoscore: the role of prognostic and predictive immune markers in cancer. Curr Opin Immunol. 2013;25(2):261–267. doi: 10.1016/j.coi.2013.03.004. [DOI] [PubMed] [Google Scholar]
- 12.Bedognetti D, Hendrickx W, Ceccarelli M, Miller LD, Seliger B. Disentangling the relationship between tumor genetic programs and immune responsiveness. Curr Opin Immunol. 2016;39:150–158. doi: 10.1016/j.coi.2016.02.001. [DOI] [PubMed] [Google Scholar]
- 13.Ohigashi Y, et al. Clinical significance of programmed death-1 ligand-1 and programmed death-1 ligand-2 expression in human esophageal cancer. Clin Cancer Res. 2005;11(8):2947–2953. doi: 10.1158/1078-0432.CCR-04-1469. [DOI] [PubMed] [Google Scholar]
- 14.Thompson RH, et al. Tumor B7-H1 is associated with poor prognosis in renal cell carcinoma patients with long-term follow-up. Cancer Res. 2006;66(7):3381–3385. doi: 10.1158/0008-5472.CAN-05-4303. [DOI] [PubMed] [Google Scholar]
- 15.Bindea G, Mlecnik B, Angell HK, Galon J. The immune landscape of human tumors: Implications for cancer immunotherapy. Oncoimmunology. 2014;3(1):e27456. doi: 10.4161/onci.27456. [DOI] [PMC free article] [PubMed] [Google Scholar]
- 16.Llosa NJ, et al. The vigorous immune microenvironment of microsatellite instable colon cancer is balanced by multiple counter-inhibitory checkpoints. Cancer Discov. 2015;5(1):43–51. doi: 10.1158/2159-8290.CD-14-0863. [DOI] [PMC free article] [PubMed] [Google Scholar]
- 17.Thibodeau SN, Bren G, Schaid D. Microsatellite instability in cancer of the proximal colon. Science. 1993;260(5109):816–819. doi: 10.1126/science.8484122. [DOI] [PubMed] [Google Scholar]
- 18.Kim H, Jen J, Vogelstein B, Hamilton SR. Clinical and pathological characteristics of sporadic colorectal carcinomas with DNA replication errors in microsatellite sequences. Am J Pathol. 1994;145(1):148–156. [PMC free article] [PubMed] [Google Scholar]
- 19.Dolcetti R, et al. High prevalence of activated intraepithelial cytotoxic T lymphocytes and increased neoplastic cell apoptosis in colorectal carcinomas with microsatellite instability. Am J Pathol. 1999;154(6):1805–1813. doi: 10.1016/S0002-9440(10)65436-3. [DOI] [PMC free article] [PubMed] [Google Scholar]
- 20.Gryfe R, et al. Tumor microsatellite instability and clinical outcome in young patients with colorectal cancer. N Engl J Med. 2000;342(2):69–77. doi: 10.1056/NEJM200001133420201. [DOI] [PubMed] [Google Scholar]
- 21.Smyrk TC, Watson P, Kaul K, Lynch HT. Tumor-infiltrating lymphocytes are a marker for microsatellite instability in colorectal carcinoma. Cancer. 2001;91(12):2417–2422. doi: 10.1002/1097-0142(20010615)91:12<2417::AID-CNCR1276>3.0.CO;2-U. [DOI] [PubMed] [Google Scholar]
- 22.Popat S, Hubner R, Houlston RS. Systematic review of microsatellite instability and colorectal cancer prognosis. J Clin Oncol. 2005;23(3):609–618. doi: 10.1200/JCO.2005.01.086. [DOI] [PubMed] [Google Scholar]
- 23.Maby P, Galon J, Latouche JB. Frameshift mutations, neoantigens and tumor-specific CD8(+) T cells in microsatellite unstable colorectal cancers. Oncoimmunology. 2016;5(5):e1115943. doi: 10.1080/2162402X.2015.1115943. [DOI] [PMC free article] [PubMed] [Google Scholar]
- 24.Lanza G, Gafà R, Santini A, Maestri I, Guerzoni L, Cavazzini L. Immunohistochemical test for MLH1 and MSH2 expression predicts clinical outcome in stage II and III colorectal cancer patients. J Clin Oncol. 2006;24(15):2359–2367. doi: 10.1200/JCO.2005.03.2433. [DOI] [PubMed] [Google Scholar]
- 25.Ribic CM, et al. Tumor microsatellite-instability status as a predictor of benefit from fluorouracil-based adjuvant chemotherapy for colon cancer. N Engl J Med. 2003;349(3):247–257. doi: 10.1056/NEJMoa022289. [DOI] [PMC free article] [PubMed] [Google Scholar]
- 26.Sargent DJ, et al. Defective mismatch repair as a predictive marker for lack of efficacy of fluorouracil-based adjuvant therapy in colon cancer. J Clin Oncol. 2010;28(20):3219–3226. doi: 10.1200/JCO.2009.27.1825. [DOI] [PMC free article] [PubMed] [Google Scholar]
- 27.Guinney J, et al. The consensus molecular subtypes of colorectal cancer. Nat Med. 2015;21(11):1350–1356. doi: 10.1038/nm.3967. [DOI] [PMC free article] [PubMed] [Google Scholar]
- 28.Taube JM, et al. Colocalization of inflammatory response with B7-h1 expression in human melanocytic lesions supports an adaptive resistance mechanism of immune escape. Sci Transl Med. 2012;4(127):127ra37. doi: 10.1126/scitranslmed.3003689. [DOI] [PMC free article] [PubMed] [Google Scholar]
- 29.Teng MW, Ngiow SF, Ribas A, Smyth MJ. Classifying cancers based on T-cell infiltration and PD-L1. Cancer Res. 2015;75(11):2139–2145. doi: 10.1158/0008-5472.CAN-15-0255. [DOI] [PMC free article] [PubMed] [Google Scholar]
- 30.Sun C, Mezzadra R, Schumacher TN. Regulation and Function of the PD-L1 Checkpoint. Immunity. 2018;48(3):434–452. doi: 10.1016/j.immuni.2018.03.014. [DOI] [PMC free article] [PubMed] [Google Scholar]
- 31.Mezzadra R, et al. Identification of CMTM6 and CMTM4 as PD-L1 protein regulators. Nature. 2017;549(7670):106–110. doi: 10.1038/nature23669. [DOI] [PMC free article] [PubMed] [Google Scholar]
- 32.Vilar E, Gruber SB. Microsatellite instability in colorectal cancer-the stable evidence. Nat Rev Clin Oncol. 2010;7(3):153–162. doi: 10.1038/nrclinonc.2009.237. [DOI] [PMC free article] [PubMed] [Google Scholar]
- 33.Newman AM, et al. Robust enumeration of cell subsets from tissue expression profiles. Nat Methods. 2015;12(5):453–457. doi: 10.1038/nmeth.3337. [DOI] [PMC free article] [PubMed] [Google Scholar]
- 34.Li B, et al. Comprehensive analyses of tumor immunity: implications for cancer immunotherapy. Genome Biol. 2016;17(1):174. doi: 10.1186/s13059-016-1028-7. [DOI] [PMC free article] [PubMed] [Google Scholar]
- 35.Li B, Liu JS, Liu XS. Revisit linear regression-based deconvolution methods for tumor gene expression data. Genome Biol. 2017;18(1):127. doi: 10.1186/s13059-017-1256-5. [DOI] [PMC free article] [PubMed] [Google Scholar]
- 36.Newman AM, Gentles AJ, Liu CL, Diehn M, Alizadeh AA. Data normalization considerations for digital tumor dissection. Genome Biol. 2017;18(1):128. doi: 10.1186/s13059-017-1257-4. [DOI] [PMC free article] [PubMed] [Google Scholar]
- 37.Thommen DS, Schumacher TN. T cell dysfunction in cancer. Cancer Cell. 2018;33(4):547–562. doi: 10.1016/j.ccell.2018.03.012. [DOI] [PMC free article] [PubMed] [Google Scholar]
- 38.Koyama S, et al. Adaptive resistance to therapeutic PD-1 blockade is associated with upregulation of alternative immune checkpoints. Nat Commun. 2016;7:10501. doi: 10.1038/ncomms10501. [DOI] [PMC free article] [PubMed] [Google Scholar]
- 39.Colak S, Ten Dijke P. Targeting TGF-β signaling in cancer. Trends Cancer. 2017;3(1):56–71. doi: 10.1016/j.trecan.2016.11.008. [DOI] [PubMed] [Google Scholar]
- 40.Mariathasan S, et al. TGFβ attenuates tumour response to PD-L1 blockade by contributing to exclusion of T cells. Nature. 2018;554(7693):544–548. doi: 10.1038/nature25501. [DOI] [PMC free article] [PubMed] [Google Scholar]
- 41.Tauriello DVF, et al. TGFβ drives immune evasion in genetically reconstituted colon cancer metastasis. Nature. 2018;554(7693):538–543. doi: 10.1038/nature25492. [DOI] [PubMed] [Google Scholar]
- 42.Chakravarthy A, Khan L, Bensler NP, Bose P, De Carvalho DD. TGF-β-associated extracellular matrix genes link cancer-associated fibroblasts to immune evasion and immunotherapy failure. Nat Commun. 2018;9(1):4692. doi: 10.1038/s41467-018-06654-8. [DOI] [PMC free article] [PubMed] [Google Scholar]
- 43.Roszik J, Subbiah V. Mining public databases for precision oncology. Trends Cancer. 2018;4(7):463–465. doi: 10.1016/j.trecan.2018.04.008. [DOI] [PubMed] [Google Scholar]
- 44.Iglesia MD, Parker JS, Hoadley KA, Serody JS, Perou CM, Vincent BG. Genomic analysis of immune cell infiltrates across 11 tumor types. J Natl Cancer Inst. 2016;108(11):djw144. doi: 10.1093/jnci/djw144. [DOI] [PMC free article] [PubMed] [Google Scholar]
- 45.Lee KS, et al. Prognostic implication of CD274 (PD-L1) protein expression in tumor-infiltrating immune cells for microsatellite unstable and stable colorectal cancer. Cancer Immunol Immunother. 2017;66(7):927–939. doi: 10.1007/s00262-017-1999-6. [DOI] [PMC free article] [PubMed] [Google Scholar]
- 46.Koganemaru S, et al. Prognostic value of programmed death-ligand 1 expression in patients with stage III colorectal cancer. Cancer Sci. 2017;108(5):853–858. doi: 10.1111/cas.13229. [DOI] [PMC free article] [PubMed] [Google Scholar]
- 47.Huang CY, et al. Clinical significance of programmed death 1 ligand-1 (CD274/PD-L1) and intra-tumoral CD8+ T-cell infiltration in stage II-III colorectal cancer. Sci Rep. 2018;8(1):15658. doi: 10.1038/s41598-018-33927-5. [DOI] [PMC free article] [PubMed] [Google Scholar]
- 48.Dunne PD, et al. Immune-derived PD-L1 gene expression defines a subgroup of stage II/III colorectal cancer patients with favorable prognosis who may be harmed by adjuvant chemotherapy. Cancer Immunol Res. 2016;4(7):582–591. doi: 10.1158/2326-6066.CIR-15-0302. [DOI] [PubMed] [Google Scholar]
- 49.Inaguma S, Lasota J, Wang Z, Felisiak-Golabek A, Ikeda H, Miettinen M. Clinicopathologic profile, immunophenotype, and genotype of CD274 (PD-L1)-positive colorectal carcinomas. Mod Pathol. 2017;30(2):278–285. doi: 10.1038/modpathol.2016.185. [DOI] [PMC free article] [PubMed] [Google Scholar]
- 50.Feng Z, et al. Multispectral imaging of formalin-fixed tissue predicts ability to generate tumor-infiltrating lymphocytes from melanoma. J Immunother Cancer. 2015;3:47. doi: 10.1186/s40425-015-0091-z. [DOI] [PMC free article] [PubMed] [Google Scholar]
- 51.Overman MJ, et al. Nivolumab in patients with DNA mismatch repair deficient/microsatellite instability high metastatic colorectal cancer: Update from CheckMate 142. J Clin Oncol. 2017;35(4_suppl):519. doi: 10.1200/JCO.2017.35.4_suppl.519. [DOI] [PMC free article] [PubMed] [Google Scholar]
- 52.Mantovani A, Marchesi F, Malesci A, Laghi L, Allavena P. Tumour-associated macrophages as treatment targets in oncology. Nat Rev Clin Oncol. 2017;14(7):399–416. doi: 10.1038/nrclinonc.2016.217. [DOI] [PMC free article] [PubMed] [Google Scholar]
- 53.O’Neil BH, et al. Safety and antitumor activity of the anti-PD-1 antibody pembrolizumab in patients with advanced colorectal carcinoma. PLoS ONE. 2017;12(12):e0189848. doi: 10.1371/journal.pone.0189848. [DOI] [PMC free article] [PubMed] [Google Scholar]
- 54.Le DT, et al. PD-1 Blockade in tumors with mismatch-repair deficiency. N Engl J Med. 2015;372(26):2509–2520. doi: 10.1056/NEJMoa1500596. [DOI] [PMC free article] [PubMed] [Google Scholar]
- 55.Liu J, et al. An Integrated TCGA Pan-Cancer Clinical Data Resource to Drive High-Quality Survival Outcome Analytics. Cell. 2018;173(2):400–416.e11. doi: 10.1016/j.cell.2018.02.052. [DOI] [PMC free article] [PubMed] [Google Scholar]
- 56.Irizarry RA, et al. Exploration, normalization, and summaries of high density oligonucleotide array probe level data. Biostatistics. 2003;4(2):249–264. doi: 10.1093/biostatistics/4.2.249. [DOI] [PubMed] [Google Scholar]
- 57.Gautier L, Cope L, Bolstad BM, Irizarry RA. affy--analysis of Affymetrix GeneChip data at the probe level. Bioinformatics. 2004;20(3):307–315. doi: 10.1093/bioinformatics/btg405. [DOI] [PubMed] [Google Scholar]
- 58.Leek JT, Johnson WE, Parker HS, Jaffe AE, Storey JD. The sva package for removing batch effects and other unwanted variation in high-throughput experiments. Bioinformatics. 2012;28(6):882–883. doi: 10.1093/bioinformatics/bts034. [DOI] [PMC free article] [PubMed] [Google Scholar]
- 59.Miller JA, et al. Strategies for aggregating gene expression data: the collapseRows R function. BMC Bioinformatics. 2011;12:322. doi: 10.1186/1471-2105-12-322. [DOI] [PMC free article] [PubMed] [Google Scholar]
- 60.Gong J, Wang C, Lee PP, Chu P, Fakih M. Response to PD-1 blockade in microsatellite stable metastatic colorectal cancer harboring a POLE mutation. J Natl Compr Canc Netw. 2017;15(2):142–147. doi: 10.6004/jnccn.2017.0016. [DOI] [PubMed] [Google Scholar]
- 61.Kheirelseid EA, et al. Mismatch repair protein expression in colorectal cancer. J Gastrointest Oncol. 2013;4(4):397–408. doi: 10.3978/j.issn.2078-6891.2013.021. [DOI] [PMC free article] [PubMed] [Google Scholar]
- 62.Banerjea A, et al. Colorectal cancers with microsatellite instability display mRNA expression signatures characteristic of increased immunogenicity. Mol Cancer. 2004;3:21. doi: 10.1186/1476-4598-3-21. [DOI] [PMC free article] [PubMed] [Google Scholar]
- 63. Mandrekar JN, Mandrekar SJ, Cha SS. Cutpoint determination methods in survival analysis using SAS. Paper presented at the 28th SAS Users Group International Conference (SUGI). March 30–April 2, 2003; Seattle, WA. https://support.sas.com/resources/papers/proceedings/proceedings/sugi28/261-28.pdf Accessed August 1, 2019.
Associated Data
This section collects any data citations, data availability statements, or supplementary materials included in this article.