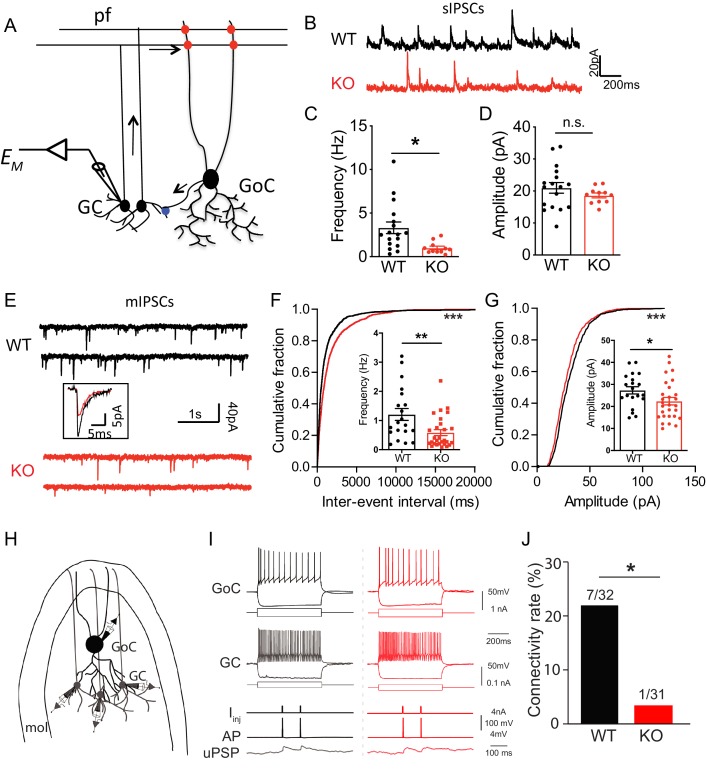
Figure 6. Loss of Nxph4 reduced inhibition onto cerebellar granule cells.
(A) A simplified diagram illustrating the inhibitory circuit of cerebellar granular layer and single-cell recording experimental design. GC: granule cells; GoC: Golgi Cells; pf: parallel fibers. Arrows indicate the direction of information flow. (B) Representative traces of spontaneous IPSC recorded from the WT and KO cerebellar granule cells. (C–D) Statistical analysis of sIPSC frequency (C, Mann-Whitney U test) and amplitude (D, t-test) (n = 11–17 cells from 4 WT and 4 KO mice). (E) Representative traces of miniature IPSCs recorded from the WT and KO cerebellar granule cells. Insect is the averaged traces. (F–G) Statistical analysis of mIPSC frequency (F, Mann-Whitney U test) and amplitude (G, t-test). Cumulative probability plots were analyzed by Kolmogorov-Smirnov test (n = 20–28 cells; 6–7 mice). (H) Multi-channel recording configuration. A GoC was first identified and recorded in the granular layer, and then nearby GCs were sequentially recorded to test the connectivity in GOC->GC while inducing action potentials in the GoC. mol: molecular layer. (I) Samples of connected GoC->GC pairs in WT and KO, showing their firing patterns and unitary GABAergic postsynaptic poetntials (uPSP). The recordings were performed in the presence of AMPA and NMDA receptor antagonists to only detect GABAergic synaptic transmission. Given the high-chloride internal solution being used, GABAergic synaptic potentials were depolarized at the resting membrane potentials. Iinj: injected current; AP: action potential. (J) The connectivity rate (GoC->GC) was significantly lower in KO compared with WT (4 WT and 3 KO mice). Chi-square test. Data are presented as mean ± SEM. n.s., not significant; *p<0.05; ***p<0.001.
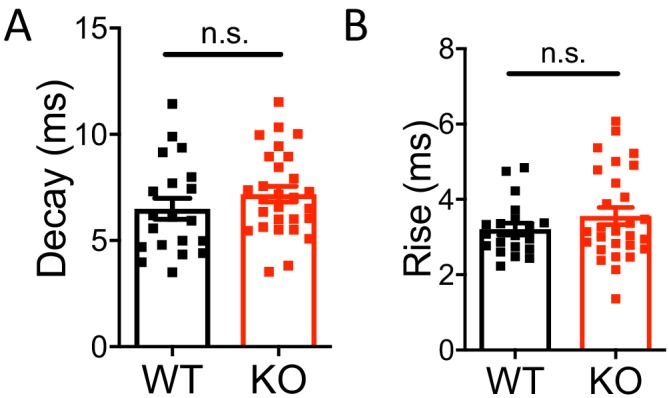
Figure 6—figure supplement 1. Miniature IPSC decay and rise time were not affected in Nxph4 KO mice.


