

See Gordon and Tijms (doi:10.1093/brain/awz278) for a scientific commentary on this article.
Jack et al. examine relationships between the bivariate distribution of β-amyloid and tau on PET and established neurocognitive clinical syndromes. Amyloidosis appears to be required for high levels of 3R/4R tau deposition. Whereas abnormal amyloid PET is compatible with normal cognition, highly abnormal tau PET is not.
Keywords: amyloid PET, tau PET, Alzheimer’s disease, dementia with Lewy bodies, frontotemporal dementia
Abstract
Large phenotypically diverse research cohorts with both amyloid and tau PET have only recently come into existence. Our objective was to determine relationships between the bivariate distribution of amyloid-β and tau on PET and established clinical syndromes that are relevant to cognitive ageing and dementia. All individuals in this study were enrolled in the Mayo Clinic Study of Aging, a longitudinal population-based study of cognitive ageing, or the Mayo Alzheimer Disease Research Center, a longitudinal study of individuals recruited from clinical practice. We studied 1343 participants who had amyloid PET and tau PET from 2 April 2015 to 3 May 2019, and met criteria for membership in one of five clinical diagnostic groups: cognitively unimpaired, mild cognitive impairment, frontotemporal dementia, probable dementia with Lewy bodies, and Alzheimer clinical syndrome. We examined these clinical groups in relation to the bivariate distribution of amyloid and tau PET values. Individuals were grouped into amyloid (A)/tau (T) quadrants based on previously established abnormality cut points of standardized uptake value ratio 1.48 (A) and 1.33 (T). Individual participants largely fell into one of three amyloid/tau quadrants: low amyloid and low tau (A−T−), high amyloid and low tau (A+T−), or high amyloid and high tau (A+T+). Seventy per cent of cognitively unimpaired and 74% of FTD participants fell into the A−T− quadrant. Participants with mild cognitive impairment spanned the A−T− (42%), A+T− (28%), and A+T+ (27%) quadrants. Probable dementia with Lewy body participants spanned the A−T− (38%) and A+T− (44%) quadrants. Most (89%) participants with Alzheimer clinical syndrome fell into the A+T+ quadrant. These data support several conclusions. First, among 1343 participants, abnormal tau PET rarely occurred in the absence of abnormal amyloid PET, but the reverse was common. Thus, with rare exceptions, amyloidosis appears to be required for high levels of 3R/4R tau deposition. Second, abnormal amyloid PET is compatible with normal cognition but highly abnormal tau PET is not. These two conclusions support a dynamic biomarker model in which Alzheimer’s disease is characterized first by the appearance of amyloidosis and later by tauopathy, with tauopathy being the proteinopathy associated with clinical symptoms. Third, bivariate amyloid and tau PET relationships differed across clinical groups and thus have a role for clarifying the aetiologies underlying neurocognitive clinical syndromes.
See Gordon and Tijms (doi:10.1093/brain/awz278) for a scientific commentary on this article.
Introduction
The first successful amyloid PET ligand was reported 15 years ago (Klunk et al., 2004), and over the past decade and a half investigators in the ageing and dementia field have thoroughly examined relationships between amyloid PET and various clinical presentations (Rabinovici et al., 2008; Nordberg et al., 2013; Villemagne et al., 2013; Ossenkoppele et al., 2015; Bilgel et al., 2018; Buckley et al., 2018; Gordon et al., 2018; Jansen et al., 2018; Lim et al., 2018; Lopez et al., 2018; Leuzy et al., 2019; Timmers et al., 2019). More recently, relationships between tau PET and various clinical presentations have also been reported (Cho et al., 2016b; Johnson et al., 2016; Ossenkoppele et al., 2016, 2018; Scholl et al., 2016; Chiotis et al., 2018; Maass et al., 2018; Gordon et al., 2019; Sperling et al., 2019). Because tau PET was only recently introduced into the academic community (Chien et al., 2013), very large phenotypically diverse research cohorts with both amyloid and tau PET have only recently come into existence. Our main objective was to determine relationships between the bivariate distribution of amyloid-β and tau on PET and established clinical syndromes relevant to cognitive ageing and dementia: cognitively unimpaired, mild cognitive impairment (MCI), frontotemporal dementia (FTD), probable dementia with Lewy bodies (DLB), and Alzheimer clinical syndrome (AlzCS).
Materials and methods
Enrolment and clinical characterization
This study was approved by the Mayo Clinic and Olmsted Medical Center Institutional Review Boards. Written informed consent was obtained from all participants and in the case of persons with cognitive impairment sufficient to interfere with capacity, from a close family member.
All individuals in this study were enrolled in one of two studies. The Mayo Clinic Study of Aging (MCSA) is a longitudinal population-based study of cognitive ageing among a stratified random sample of a geographically- defined population (Roberts et al., 2008). Residents of Olmsted County, Minnesota, USA aged 30–89 years old were enumerated using the medical records-linkage system of the Rochester Epidemiology Project (St Sauver et al., 2012). From this sampling frame, individuals were randomly selected by 10-year age and sex strata such that males and females were represented equally. All individuals without a medical contraindication were invited to participate in imaging studies. The Mayo Alzheimer Disease Research Center (ADRC) is a longitudinal research study of individuals recruited from clinical practice.
Evaluations included a medical history review and interview with the participant and a study partner, a neurological examination by a physician; and a neuropsychological examination (Roberts et al., 2008). Participants were assigned a diagnosis of cognitively unimpaired (defined as not MCI or dementia), MCI (Petersen, 2004), or dementia (American Psychiatric Association, 1994) using established criteria. Among individuals with dementia, syndromic diagnoses followed established criteria for FTD syndromes (Gorno-Tempini et al., 2011; Rascovsky et al., 2011), probable DLB (McKeith et al., 2017), and AlzCS (McKhann et al., 1984, 2011; Jack et al., 2018). The AlzCS group included individuals with a classic amnestic phenotype who would meet clinical criteria for probable Alzheimer’s disease (McKhann et al., 1984, 2011), as well as established atypical Alzheimer’s disease phenotypes (i.e. language, visuospatial, and dysexecutive) (Wolk et al., 2012; Jones et al., 2017). Clinical diagnoses were always made blinded to PET results in the MCSA; however, this was not always the case for ADRC participants.
The study sample consisted of 1343 participants who met the following criteria (Supplementary Fig. 1). For inclusion an individual must have been a participant in the MCSA or ADRC, had amyloid PET, tau PET, and MRI (MR is used for PET quantification) from 2 April 2015 to 3 May 2019, and have met criteria above for membership in one of the five clinical diagnostic groups described above. We excluded individuals who: (i) were cognitively impaired but did not meet established criteria for one of the five syndromic diagnostic groups above; (ii) could not be confidently labelled either cognitively impaired or unimpaired; (iii) had imaging studies that were inadequate for technical reasons; and (iv) were members of families with known mutations. We used data from the first imaging session for individuals with serial imaging.
Imaging methods
Amyloid PET imaging was performed with Pittsburgh Compound B (PIB) (Klunk et al., 2004) and tau PET with flortaucipir (Chien et al., 2013). Amyloid and tau PET standardized uptake value ratios (SUVRs) were formed by normalizing composite multi-region target regions of interest to the cerebellar crus grey matter (Jack et al., 2017). The amyloid PET target meta-region of interest included the prefrontal, orbitofrontal, parietal, temporal, anterior and posterior cingulate, and the precuneus (Jack et al., 2017). The tau PET target meta-region of interest used in our primary analysis included the amygdala, entorhinal cortex, fusiform, parahippocampal, and inferior temporal and middle temporal gyri (Jack et al., 2017). As a post hoc sensitivity analysis, we examined three alternative tau PET reporter regions of interest highlighted in recent publications (Cho et al., 2016a; Johnson et al., 2016; Scholl et al., 2016; Maass et al., 2017; Mishra et al., 2017; Pontecorvo et al., 2017a; Lowe et al., 2018). They were: (i) entorhinal cortex; (ii) inferior temporal gyrus; and (ii) a lateral parietal meta-region of interest composed of the angular, supramarginal, and inferior parietal regions of interest. PET data were not partial volume corrected. MRI was performed at 3 T and was used in the PET data processing pipeline, described in previous work (Schwarz et al., 2019).
Statistical methods
Our main objective was to determine relationships between the bivariate distribution of amyloid-β and tau on PET and established clinical syndromes. To clearly illustrate this, the bivariate distribution of tau and amyloid PET SUVR values over the study sample was segmented into quadrants using cut points based on previously published research (Jack et al., 2017). The amyloid PET cut point was the SUVR value 1.48 (centiloid 22; Klunk et al., 2015), beyond which rates of amyloid PET reliably increased (Jack et al., 2017). The cut point for tau PET (SUVR 1.33) was the value that most accurately discriminated between cognitively impaired individuals with abnormal amyloid and age-matched cognitively unimpaired individuals with normal amyloid (Jack et al., 2017). Previously, we have described both lenient and conservative (i.e. labels fewer people abnormal) cut points for tau PET (Jack et al., 2017) and used the latter here because the questions pertain to aetiological diagnoses in impaired individuals.
In addition to the above, a cluster analysis of the amyloid and tau PET SUVR values was performed using a model-based clustering approach (Banfield and Raftery, 1993; Scrucca et al., 2016). The model treats the data as a mixture of Gaussian densities; it estimates the optimal number of clusters along with the centre and shape of each cluster by optimizing the Bayesian information criterion. An additional ‘diffuse’ cluster was added to the model that covers the entire range of amyloid and tau values, this serves to make the primary results resistant to any outlier points by assigning them to the random background (Banfield and Raftery, 1993).
Data availability
The Mayo Clinic Study of Aging and Alzheimers Disease Research Center make data available to qualified researchers upon reasonable request.
Results
Study participants
The majority of individuals in this study were cognitively unimpaired and most of these were participants in the MCSA (Table 1). MCI participants were split approximately evenly between the MCSA and ADRC. Nearly all individuals with dementia were participants in the ADRC. The probable DLB group had the highest proportion of males and the AlzCS group had the highest proportion of APOE ɛ4 carriers. Within the FTD group, 14 (61%) were diagnosed as behavioural variant FTD, seven (30%) as semantic dementia, one (4%) as progressive non-fluent aphasia, and one (4%) as progressive associative agnosia (Gorno-Tempini et al., 2011; Rascovsky et al., 2011).
Table 1.
Demographic characteristics of study participants
| Characteristic | CU | MCI | AlzCS | DLB | FTD |
|---|---|---|---|---|---|
| Number of subjects | 976 | 182 | 123 | 39 | 23 |
| Study, n (%) | |||||
| MCSA | 903 (93) | 92 (51) | 8 (7) | 3 (8) | 0 (0) |
| ADRCa | 73 (7) | 90 (49) | 115 (93) | 36 (92) | 23 (100) |
| Age, years | |||||
| Median (IQR) | 68 (57, 77) | 74 (67, 81) | 69 (61, 77) | 70 (66, 77) | 65 (58, 69) |
| Min, Max | 30, 98 | 44, 94 | 52, 89 | 51, 88 | 49, 73 |
| Male sex, n (%) | 526 (54) | 117 (64) | 51 (41) | 31 (79) | 14 (61) |
| Education, years | |||||
| Median (IQR) | 16 (13, 17) | 16 (12, 18) | 16 (12, 16) | 15 (14, 18) | 16 (15, 18) |
| Min, Max | 6, 20 | 0, 24 | 8, 25 | 7, 20 | 12, 21 |
| APOE ɛ4 carrier, n (%) | 258 (28) | 66 (39) | 74 (69) | 12 (44) | 5 (29) |
| Short Test of Mental Status score | |||||
| Median (IQR) | 37 (35, 38) | 33 (30, 35) | 24 (19, 29) | 29 (24, 32) | 27 (23, 32) |
| Min, Max | 26, 38 | 22, 38 | 4, 36 | 8, 35 | 20, 36 |
| Amyloid PET | |||||
| SUVR | |||||
| Median (IQR) | 1.38 (1.31, 1.51) | 1.53 (1.36, 2.25) | 2.47 (2.20, 2.71) | 1.68 (1.37, 2.32) | 1.36 (1.26, 1.45) |
| Min, Max | 1.10, 3.63 | 1.15, 3.41 | 1.28, 3.41 | 1.25, 3.00 | 1.16, 2.16 |
| Centiloid | |||||
| Median (IQR) | 13 (6, 24) | 26 (11, 90) | 110 (86, 131) | 39 (12, 96) | 11 (2, 19) |
| Min, Max | −13, 212 | −8, 193 | 4, 193 | 1, 157 | −7, 82 |
| n (%) abnormalb | 282 (29) | 101 (55) | 119 (97) | 23 (59) | 4 (17) |
| Tau PET, SUVR | |||||
| Median (IQR) | 1.18 (1.12, 1.23) | 1.25 (1.18, 1.38) | 1.97 (1.60, 2.29) | 1.25 (1.17, 1.31) | 1.23 (1.20, 1.31) |
| Min, Max | 0.87, 1.75 | 0.91, 2.49 | 1.09, 3.27 | 1.05, 2.22 | 1.10, 1.40 |
| n (%) abnormalc | 54 (6) | 55 (30) | 109 (89) | 7 (18) | 4 (17) |
CU = cognitively unimpaired.
aADRC includes 12 participants co-enrolled in the Advancing Research and Treatment for Frontotemporal Lobar Degeneration Project 1 Study (one MCI, two AlzCS, nine FTD).
bAmyloid PET abnormality is defined as ≥1.48 SUVR.
cTau PET abnormality is defined as ≥1.33 SUVR.
Primary analysis: clinical diagnostic groups within the bivariate amyloid and tau PET distribution
Figure 1 shows the bivariate amyloid and tau PET distribution with individual points colour-coded to represent the five clinical diagnostic groups. Despite a positive rank correlation between amyloid and tau PET overall (rho = 0.57, P < 0.001), rather than showing a prototypical ellipsoid bivariate relationship, few individuals were present in the upper left region. The marginal histograms for amyloid and tau in Fig. 1 illustrate that the distribution of amyloid PET values in the ADRC were bimodal, while in the MCSA they were unimodal with a long right tail even when plotted on log scale. The distribution of tau PET values in the ADRC was unimodal with a long right tail but was unimodal and roughly Gaussian in the MCSA.
Figure 1.

Amyloid and tau PET distributions by clinical group overall and within study. Scatter plots of tau PET SUVR versus amyloid PET SUVR among all individuals combined (A) and separately among individuals in the MCSA (B) and ADRC (C). Tau PET and amyloid PET values are in SUVR units but the data is plotted on log scale, which accounts for the uneven spacing. Points are coloured by clinical diagnosis. Histograms in the margins show the distributions of tau PET SUVR (right) and amyloid PET SUVR (top). Axis labels on the top represent amyloid PET values on a centiloid scale.
In Fig. 2A we illustrate results of our clustering procedure based on a three-cluster model with data points coloured to indicate cluster. Black data points were identified as not consistent with any of the three clusters. Ellipses represent the centre 50% of data for each cluster distribution. Three clusters were chosen as optimal based on Bayesian information criterion of −969, −1338, −1405, −1401, and −1367 for one, two, three, four, and five clusters, respectively. We also superimpose previously established amyloid and tau PET cut points that segregate the bivariate distribution into four quadrants: normal amyloid and normal tau (A−T−), abnormal amyloid and normal tau (A+T−), abnormal amyloid and abnormal tau (A+T+), and normal amyloid and abnormal tau (A−T+). The clustering also suggested a quadrant-based interpretation that is similar to the cut point based quadrants. For both methods few individuals were in the upper left quadrant.
Figure 2.

Amyloid and tau PET clusters. Scatterplot of tau PET SUVR versus amyloid PET SUVR with points coloured according to the three-cluster classification from a bivariate mixture model (A). Points shown in black represent individuals who were inconsistent with one of the three clusters. The vertical and horizontal lines represent the cut points of 1.48 SUVR for amyloid PET and 1.33 SUVR for tau PET. The ellipses show the centre 50% of the data for the three cluster distributions with a black star indicating the bivariate mean from the clustering. In B, these ellipses are shown along with a square for each clinical diagnosis group representing the bivariate median (centroid) of the tau and amyloid distributions. Tau PET and amyloid PET values are in SUVR units but the data is plotted on log scale, which accounts for the uneven spacing. Axis labels on the top represent amyloid PET values on a centiloid scale.
The cluster ellipses and standard cut points are shown again in Fig. 2B with the bivariate medians (centroids) of the clinical groups added. The centroids of the cognitively unimpaired and FTD groups were located in the A−T− quadrant and within what we call the low-low cluster ellipse. The AlzCS centroid was in the A+T+ quadrant and what we call the high-high cluster ellipse. The probable DLB centroid fell in the A+T− quadrant and within what we call the high-low cluster ellipse. The MCI centroid was on the border between the A−T− and A+T− quadrants and situated between the ellipses for the low-low and high-low clusters.
Figure 3 shows the proportion of individuals in each of the five clinical groups that fall into the cut point based and cluster based quadrants. Using established cut points (Jack et al., 2017) most cognitively unimpaired individuals fell into either the A−T− (70%) or A+T− (25%) quadrants, but a few were in the A+T+ (4%) and A−T+ (1%) quadrants. Among MCI, 42% were in the A−T− quadrant, 28% in the A+T− quadrant, 27% in the A+T+ quadrant, and only 3% in the A−T+ quadrant. The large majority of AlzCS individuals were in the A+T+ quadrant (89%) but a few were in the A−T− (3%) and A+T− (8%) quadrants. Probable DLB individuals were generally in either the A−T− (38%) or A+T− (44%) quadrants, while the majority of the FTD individuals were in the A−T− quadrant (74%) (Supplementary Table 1). These patterns were similar for the cluster-based quadrants.
Figure 3.
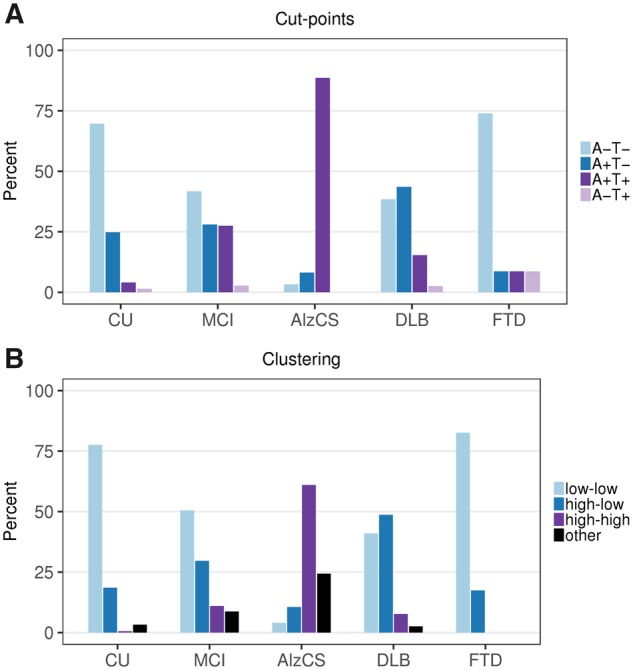
Amyloid and tau PET groups within clinical diagnosis. Per cent of individuals in each quadrant (A) or cluster (B) within each clinical diagnostic group. (A) Percentages according to amyloid and tau PET groupings based on the established cut points of 1.48 SUVR for amyloid PET and 1.33 SUVR for tau PET. (B) Percentages according to the bivariate mixture model clusters. These are labelled according to amyloid (low or high) and tau (low or high). Those individuals whose values were inconsistent with one of the three clusters were labelled as other.
Secondary analysis: bivariate amyloid and tau PET distribution by age among unimpaired, MCI, and AlzCS individuals
In Fig. 4 we illustrate the bivariate amyloid and tau PET distribution by age restricted to cognitively unimpaired, MCI and AlzCS participants. In the MCSA, nearly all (97%) individuals under 60 years of age were A−T− while those above 60 fell in each of the A−T− (55%), A+T− (35%), and A+T+ (9%) quadrants. In contrast, younger individuals were more equally present in both the A−T− (46%) and A+T+ (49%) quadrants in the ADRC.
Figure 4.

Scatter plots of tau PET SUVR versus amyloid PET SUVR by age groups among cognitively unimpaired (CU), MCI, and AlzCS individuals. MCSA individuals are shown in the left column and ADRC individuals in the right column. The vertical and horizontal lines represent the cut points of 1.48 SUVR for amyloid PET and 1.33 SUVR for tau PET. Points are coloured by clinical diagnosis. Tau PET and amyloid PET values are in SUVR units but the data is plotted on a log scale, which accounts for the uneven spacing. Axis labels on the top of the columns represent amyloid PET values on a centiloid scale.
Post hoc sensitivity analyses
In Supplementary Fig. 2 we illustrate correlations between different tau PET reporter regions of interest. The temporal meta-region of interest used in the primary analysis was highly correlated with the entorhinal cortex (rho = 0.86), inferior temporal (rho = 0.99), and lateral parietal (rho = 0.91) regions of interest. The entorhinal cortex had a ceiling effect relative to the other regions of interest. Figure 5 illustrates the bivariate amyloid and tau PET to clinical diagnostic group relationships for these three alternative tau PET regions of interest. Except for the ceiling effect in the entorhinal cortex, the bivariate distributions were similar to that of the temporal meta-region of interest.
Figure 5.

Scatter plots of tau PET SUVR versus amyloid PET SUVR among all individuals combined and separately among individuals in the MCSA and ADRC for three alternative tau PET regions of interest. Points are coloured by clinical diagnosis. Histograms in the margins show the distributions of tau PET SUVR (right) and amyloid PET SUVR (top). Axis labels on the top of each plot represent amyloid PET values on a centiloid scale. Tau PET and amyloid PET values are in SUVR units but the data is plotted on a log scale, which accounts for the uneven spacing.
Discussion
The clinical diagnoses in this sample were based on well-defined syndromic presentations. Each syndrome in turn is linked with an expected aetiology. For example, the expected aetiology in probable DLB is α-synuclein pathology, and in AlzCS it is Alzheimer’s disease. Patient management decisions are driven by the aetiologies that physicians suspect underlie specific syndromic presentations (Pontecorvo et al., 2017b; de Wilde et al., 2018; Rabinovici et al., 2019). However, a clinical syndrome is often an imperfect indicator of underlying aetiology (Beach et al., 2012; Jagust et al., 2019). Our data illustrate that the combination of amyloid and tau PET provides useful information about the aetiology underlying various common neurocognitive syndromes at the individual patient level.
The A+T+ biomarker profile identifies Alzheimer’s disease in vivo in the NIA-AA research framework (Jack et al., 2018) and about 9 in 10 AlzCS participants in this study were A+T+. The 8% (Supplementary Table 1) of AlzCS participants who were A+T− would be labelled Alzheimer pathological change in the NIA-AA research framework (Jack et al., 2018). Low levels of Alzheimer’s disease tauopathy that lie below the tau PET detection threshold could account for a portion of the symptoms in A+T− individuals (Knopman et al., 2019). However, the dementia is likely due, at least in part, to one or more ageing-related non-Alzheimer disorders, e.g. TDP-43 (recently labelled LATE disease; Nelson et al., 2019) with or without hippocampal sclerosis, α-synuclein deposits, argyrophilic grain disease, or cerebrovascular disease (particularly microscopic cerebral infarctions) (Schneider et al., 2007; Sonnen et al., 2007; Nelson et al., 2011; Kawas et al., 2015; Botha et al., 2018a, b; Petersen, 2018). In A−T− individuals diagnosed clinically as AlzCS, symptoms are almost certainly due to one or more of the aforementioned non-Alzheimer disorders.
Probable DLB participants were distributed between the A−T− and A+T− quadrants (Fig. 3). The A−T− individuals likely represent more pure α-synuclein pathology while the A+T− individuals represent α-synuclein pathology plus Alzheimer pathological change (Walker et al., 2015; Irwin et al., 2017; Coughlin et al., 2019). Because α-synuclein pathology and Alzheimer’s disease often coexist, patients may present with overlapping clinical features (Walker et al., 2015). The combination of amyloid and tau PET may aid the clinician by indicating the status of a patient within the Alzheimer continuum and thereby informing on aetiologies underlying symptoms. Many probable DLB patients also meet neuropathological criteria for Alzheimer’s disease at autopsy (Walker et al., 2015; Irwin et al., 2017) and therefore a higher number of A+T+ probable DLB patients might have been expected in our study. However, flortaucipir retention is greater in AlzCS than in probable DLB in most areas of the brain (Gomperts et al., 2016; Kantarci et al., 2017) and when tau is present in pathologically confirmed DLB, the pathological burden is usually lower than it is in Alzheimer’s disease (Walker et al., 2015; Coughlin et al., 2019). We used a conservative cut point for tau PET (Jack et al., 2017) here, and the tau burden in mildly affected probable DLB (median Short Test of Mental Status score 29, Table 1) patients may have fallen below this cut point.
Most FTD participants were A−T−, which was anticipated as these individuals are not considered to lie in the Alzheimer continuum (Fig. 3). Four, however, had high amyloid PET levels. All four were over age 60 and may have had fronto-temporal lobar degeneration plus Alzheimer continuum pathology (Jack et al., 2018). Discrimination between fronto-temporal lobar degeneration and Alzheimer’s disease on clinical grounds can occasionally be difficult and this distinction may be aided by joint amyloid and tau PET. Flortaucipir was developed to bind to the 3R/4R form of pathological tau that characterizes Alzheimer’s disease (Chien et al., 2013; Lowe et al., 2016; Lemoine et al., 2017; Marquie et al., 2017). If a tau PET ligand is developed that is sensitive to the tau deposits in primary tauopathies, then many patients in the FTD spectrum would likely exhibit an A−T+ biomarker profile when imaged with such a ligand.
MCI participants were distributed across the A−T−, A+T−, and A+T+ quadrants (Fig. 3). This reflects the aetiological heterogeneity of the MCI syndrome (Markesbery et al., 2006). A+T+ and A+T− individuals are considered to lie within the Alzheimer continuum (Jack et al., 2018) and aetiologies underlying cognitive impairment in these participants are likely similar to those discussed above for AlzCS individuals (Forsberg et al., 2010). A−T− MCI participants may have non-Alzheimer neuropathology or non-degenerative causes for impairment (e.g. sleep disorders, depression, cerebrovascular disease) (Wisse et al., 2015; Landau et al., 2016) and the A−T− biomarker profile suggests excluding Alzheimer’s disease as a likely aetiology. The potential value of these biomarkers in patient management is evident. Physicians may be likely to prescribe Alzheimer’s disease medications for an A+T+ MCI patient, but unlikely to prescribe these medications for a patient with the same syndromic presentation but who is A−T− (Pontecorvo et al., 2017b; Rabinovici et al., 2019).
Among cognitively unimpaired participants, 70% were A−T− and 25% were A+T−. While some cognitively unimpaired individuals had amyloid PET values in the same range as AlzCS, none had tau PET values in the AlzCS range. Further, the few cognitively unimpaired individuals with tau PET values above the tau PET cut point had values that were close to the normal/abnormal cut point (Fig. 4). This suggests that high levels of amyloid are compatible with unimpaired cognitive status while high levels of tau are not, a finding that is consistent with prior evidence that cognitive impairment in Alzheimer’s disease is more closely linked to tau than amyloid-β (Arriagada et al., 1992; Gomez-Isla et al., 1997; Bennett et al., 2004; Nelson et al., 2012; Ossenkoppele et al., 2016).
Which biomarker abnormality appears first, amyloid versus tau, has been a source of controversy in the Alzheimer field. Because earlier events can cause later events but not the reverse, temporal ordering of biomarkers has likewise been linked to discussion of cause and effect. Our data are cross-sectional and cannot prove specific claims about temporal evolution of biomarkers or cause and effect; however, the prevalence of various amyloid and tau profiles in this large series of participants can inform on the ‘plausibility’ of different possible temporal evolution patterns. Every individual begins life cognitively unimpaired and A−T− (lower left quadrant) and the large majority of AlzCS individuals are A+T+ (upper right quadrant) (Figs 3 and 4). Therefore every A+T+ AlzCS individual had to follow one of the following transition pathways: (i) A−T− to A+T− to A+T+; (ii) A−T− to A−T+ to A+T+; or (iii) from A−T− directly to A+T+. The near absence of individuals in the A−T+ quadrant, along with the observation that all tau PET values in that quadrant lie close to the cut point, makes the second pathway very unlikely. The clear gap in data points along the middle of the 45° diagonal line makes the last option unlikely as well. The placement of clinical group centroids on the tau versus amyloid plot (Fig. 2B) couples the well-established clinical progression of cognitively unimpaired to MCI to AlzCS with a parallel pathway from A−T− to A+T− to A+T+. Finally, Fig. 4 illustrates the bivariate amyloid and tau PET distribution for different ages among cognitively unimpaired, MCI, and AlzCS participants. The clear trend is progression from A−T− to A+T− with age in many participants, with some individuals reaching A+T+. In aggregate these data lead to the conclusion that the typical pathway within the Alzheimer aetiological continuum from cognitively unimpaired to MCI to AlzCS is likely paralleled by transitions from A−T− to A+T− to A+T+. When combined with the evidence suggesting that high levels of amyloid are compatible with unimpaired cognitive status while high levels of tau are not, our data supports the position that within the Alzheimer continuum it is the transition from A+T− to A+T+ that is associated with onset of severe cognitive symptoms. Our data along with that from other studies (Arriagada et al., 1992; Ingelsson et al., 2004; Bateman et al., 2012; Benzinger et al., 2013; Xiong et al., 2016; Leal et al., 2018; Hanseeuw et al., 2019) support a dynamic biomarker model (Jack et al., 2010, 2013) in which amyloidosis promotes or is permissive for the spread of tauopathy and it is the latter proteinopathy that is associated with cognitive symptoms.
The distributions of tau PET values using different reporter regions of interest were highly correlated, particularly the temporal meta-region of interest and the inferior temporal region of interest (Supplementary Fig. 2). Aside from the tau PET ceiling effect in the entorhinal cortex, the bivariate distribution was not greatly different using the entorhinal cortex compared to that seen with other tau reporter regions of interest (Fig. 5), which would imply that the typical progression from A−T− to A+T− to A+T+ is a generalizable conclusion across different choices of tau reporter region of interest.
An important caveat to the conclusion above is that autopsy data show that medial temporal tauopathy likely precedes neocortical amyloidosis in most people (Braak et al., 2011). Medial/basal temporal lobe tauopathy with no or minimal amyloidosis has been labelled primary age-related tauopathy (Crary et al., 2014), a neuropathological entity attributed to ageing that is distinct from Alzheimer’s disease (Hyman et al., 2012). It is unclear how well flortaucipir or any currently available tau PET ligand captures low levels of tau pathology in primary age-related tauopathy.
This study has several strengths. First, the large number of participants (n = 1343) in this sample lends credibility to the conclusion that a fundamental feature of the biology of Alzheimer’s disease is that amyloidosis is required for extensive 3R/4R tauopathy. Second, all participants were well characterized clinically by the same group of physicians, neuropsychologists, and study coordinators and variability was further reduced by using the same set of magnetic resonance and PET scanners and identical image analysis pipelines. Third, we examined both population-based and clinic-based samples. Population-based samples capture relationships between clinical presentation and imaging that exist commonly in community dwelling individuals, but will not capture more uncommon clinical presentations. In contrast, our clinic-based sample captures less common clinical presentations. When combined, we were able to study the full spectrum of the bivariate amyloid and tau distribution.
This study has several limitations. First, in vivo imaging has fundamental limits in detection sensitivity in comparison to direct examination of tissue at autopsy. Sub-threshold levels of both amyloid (Leal et al., 2018) and tau may be clinically relevant. We cannot know in any individual whether or not subthreshold levels of either proteinopathy are present. Second, the findings are specific for the two PET tracers used and could differ somewhat with different amyloid and tau PET tracers. Third, cut points for amyloid PET have been validated against neuropathology (Murray et al., 2015; La Joie et al., 2019). However, because of its more recent development far less autopsy-imaging validation exists for tau PET. Questions about which areas of the brain should be measured and what constitute valid or useful cut points are still under investigation (Cho et al., 2016a; Johnson et al., 2016; Scholl et al., 2016; Villemagne et al., 2016; Maass et al., 2017; Mishra et al., 2017; Pontecorvo et al., 2017a; Lowe et al., 2018). However, the continuous bivariate amyloid and tau PET distributions (Figs 1, 2, 4 and 5) circumvent the limitations of cut points and illustrate that the primary conclusion that very high tau is not seen in the absence of amyloid would not change with different cut points. Fourth, while clinical diagnoses were all made blinded to PET results in the MCSA, this was not always the case for participants in the ADRC (given its clinic-based nature). However, all participants met rigorously defined, established clinical diagnostic criteria that do not require imaging/biomarker information. Fifth, many individuals presenting to the ADRC with AlzCS (a referral clinic sample) are not representative of AlzCS in the community. The former tend to have a younger age of onset and higher levels of neocortical tau uptake (Ossenkoppele et al., 2016; Lowe et al., 2018). Sixth, perhaps the most significant limitation, is one shared by all research in this field. Currently available biomarkers that are disease-specific do not fully capture the neuropathological complexity of the ageing brain. Non-Alzheimer pathologies, for which no biomarkers presently exist, are highly prevalent in older individuals (most often co-morbidly), and exert significant effects on cognition (Schneider et al., 2007; Sonnen et al., 2007; Nelson et al., 2011; Kawas et al., 2015; Botha et al., 2018a, b; Petersen, 2018). A major need in the field is the development of either imaging or biofluid biomarkers for these common non-Alzheimer neuropathological entities.
Supplementary Material
Acknowledgements
We thank AVID Radiopharmaceuticals, Inc., for their support in supplying AV-1451 (flortaucipir) precursor, chemistry production advice and oversight, and FDA regulatory cross-filing permission and documentation needed for this work.
Glossary
Abbreviations
- ADRC
Mayo Alzheimer Disease Research Center
- AlzCS
Alzheimer clinical syndrome
- DLB
dementia with Lewy bodies
- FTD
frontotemporal dementia
- MCI
mild cognitive impairment
- MCSA
Mayo Clinic Study of Aging
- SUVR
standardized uptake value ratio
Funding
Study funding was provided by the National Institutes of Health, R37 AG011378, RO1 AG041851, R01 AG056366, R01 NS097495, U01 AG06786, R01 AG034676, P50 AG016574; Alexander Family Professorship of Alzheimer’s Disease Research; Alzheimer’s Association; The GHR Foundation. The funding organizations/sponsors had no role in design and conduct of the study; collection, management, analysis, and interpretation of the data; preparation, review, or approval of the manuscript; and decision to submit the manuscript for publication.
Competing interests
C.R.J. serves as a consultant for Lily and serves on an independent data monitoring board for Roche but he receives no personal compensation from any commercial entity; receives funding from the NIH and the Alexander Family Alzheimer’s Disease Research Professorship of the Mayo Clinic. D.S.K. serves on a Data Safety Monitoring Board for the DIAN study; is an investigator in clinical trials sponsored by Biogen, Lilly Pharmaceuticals, and the University of Southern California; and receives research support from the NIH/NIA. D.T.J. receives funding from the NIH and the Minnesota Partnership for Biotechnology and Medical Genomics. T.J.F. receives support from the Mayo Clinic Dorothy and Harry T. Mangurian Jr. Lewy Body Dementia Program and NIH. B.B.B. has served as an investigator for a clinical trial sponsored by Biogen. He receives royalties from the publication of a book entitled Behavioral Neurology Of Dementia (Cambridge Medicine, 2009, 2017). He serves on the Scientific Advisory Board of the Tau Consortium. He receives research support from the NIH, the Mayo Clinic Dorothy and Harry T. Mangurian Jr. Lewy Body Dementia Program, and the Little Family Foundation. K.K. serves on the data safety monitoring board for Takeda Global Research and Development Center, Inc.; receives research support from Avid Radioparmaceuticals and Eli Lilly, and receives funding from NIH and Alzheimer’s Drug Discovery Foundation. V.J.L. consults for Bayer Schering Pharma, Piramal Life Sciences, and Merck Research, and receives research support from GE Healthcare, Siemens Molecular Imaging, AVID Radiopharmaceuticals, and the NIH (NIA, NCI). M.M.M. receives research support from the NIH and unrestricted research grants from Biogen and Lundbeck. P.V., J.A.F., J. G-R. and C.G.S. receive funding from the NIH. M.L.S. at the time of manuscript submission, owned shares of the following medical related stocks, unrelated to the current work: Align Technology, Inc., LHC Group, Inc., Mesa Laboratories, Inc., Natus Medical Incorporated, Varex Imaging Corporation. Within the past 3 years, he has owned the following medical related stocks, unrelated to the current work: CRISPR Therapeutics, Gilead Sciences, Inc., Globus Medical Inc., Inovio Biomedical Corp., Ionis Pharmaceuticals, Johnson & Johnson, Medtronic, Inc., Parexel International Corporation. R.C.P. consults for Roche, Inc.; Merck, Inc.; Genentech, Inc.; Biogen, Inc.; Eisai, Inc. and GE Healthcare and receives royalties from Oxford University Press for Mild Cognitive Impairment H.J.W., H.B., S.D.W., T.M.T., J.L.G., and M.M.M. report no competing interests.
References
- American Psychiatric Association. Diagnostic and statistical manual of mental disorders, DSM-IV. 4th edn. Washington, DC: American Psychiatric Association; 1994. [Google Scholar]
- Arriagada PV, Growdon JH, Hedley-Whyte ET, Hyman BT. Neurofibrillary tangles but not senile plaques parallel duration and severity of Alzheimer’s disease. Neurology 1992; 42 (3 Pt 1): 631–9. [DOI] [PubMed] [Google Scholar]
- Banfield JD, Raftery AE. Model-based Gaussian and non-Gaussian clustering. Biometrics 1993; 49: 803–21. [Google Scholar]
- Bateman RJ, Xiong C, Benzinger TL, Fagan AM, Goate A, Fox NC et al. Clinical and biomarker changes in dominantly inherited Alzheimer’s disease. N Engl J Med 2012; 367: 795–804. [DOI] [PMC free article] [PubMed] [Google Scholar]
- Beach TG, Monsell SE, Phillips LE, Kukull W. Accuracy of the clinical diagnosis of Alzheimer disease at National Institute on Aging Alzheimer Disease Centers, 2005–2010. J Neuropathol Exp Neurol 2012; 71: 266–73. [DOI] [PMC free article] [PubMed] [Google Scholar]
- Bennett DA, Schneider JA, Wilson RS, Bienias JL, Arnold SE. Neurofibrillary tangles mediate the association of amyloid load with clinical Alzheimer disease and level of cognitive function. Arch Neurol 2004; 61: 378–84. [DOI] [PubMed] [Google Scholar]
- Benzinger TL, Blazey T, Jack CR Jr, Koeppe RA, Su Y, Xiong C et al. Regional variability of imaging biomarkers in autosomal dominant Alzheimer’s disease. Proc Natl Acad Sci USA 2013; 110: E4502–9. [DOI] [PMC free article] [PubMed] [Google Scholar]
- Bilgel M, An Y, Helphrey J, Elkins W, Gomez G, Wong DF et al. Effects of amyloid pathology and neurodegeneration on cognitive change in cognitively normal adults. Brain 2018; 141: 2475–85. [DOI] [PMC free article] [PubMed] [Google Scholar]
- Botha H, Mantyh WG, Graff-Radford J, Machulda MM, Przybelski SA, Wiste HJ et al. Tau-negative amnestic dementia masquerading as Alzheimer disease dementia. Neurology 2018a; 90: e940–6. [DOI] [PMC free article] [PubMed] [Google Scholar]
- Botha H, Mantyh WG, Murray ME, Knopman DS, Przybelski SA, Wiste HJ et al. FDG-PET in tau-negative amnestic dementia resembles that of autopsy-proven hippocampal sclerosis. Brain 2018b; 141: 1201–17. [DOI] [PMC free article] [PubMed] [Google Scholar]
- Braak H, Thal DR, Ghebremedhin E, Del Tredici K. Stages of the pathologic process in Alzheimer disease: age categories from 1 to 100 years. J Neuropathol Exp Neurol 2011; 70: 960–9. [DOI] [PubMed] [Google Scholar]
- Buckley RF, Mormino EC, Amariglio RE, Properzi MJ, Rabin JS, Lim YY et al. Sex, amyloid, and APOE ɛ4 and risk of cognitive decline in preclinical Alzheimer’s disease: findings from three well-characterized cohorts. Alzheimer’s Dement 2018; 14: 1193–203. [DOI] [PMC free article] [PubMed] [Google Scholar]
- Chien DT, Bahri S, Szardenings AK, Walsh JC, Mu F, Su MY et al. Early clinical PET imaging results with the novel PHF-tau radioligand [F-18]-T807. J Alzheimers Dis 2013; 34: 457–68. [DOI] [PubMed] [Google Scholar]
- Chiotis K, Saint-Aubert L, Rodriguez-Vieitez E, Leuzy A, Almkvist O, Savitcheva I et al. Longitudinal changes of tau PET imaging in relation to hypometabolism in prodromal and Alzheimer’s disease dementia. Mol Psychiatry 2018; 23: 1666–73. [DOI] [PubMed] [Google Scholar]
- Cho H, Choi JY, Hwang MS, Kim YJ, Lee HM, Lee HS et al. In vivo cortical spreading pattern of tau and amyloid in the Alzheimer disease spectrum. Ann Neurol 2016a; 80: 247–58. [DOI] [PubMed] [Google Scholar]
- Cho H, Choi JY, Hwang MS, Lee JH, Kim YJ, Lee HM et al. Tau PET in Alzheimer disease and mild cognitive impairment. Neurology 2016b; 87: 375–83. [DOI] [PubMed] [Google Scholar]
- Coughlin D, Xie SX, Liang M, Williams A, Peterson C, Weintraub D et al. Cognitive and pathological influences of tau pathology in Lewy body disorders. Ann Neurol 2019; 85: 259–71. [DOI] [PMC free article] [PubMed] [Google Scholar]
- Crary JF, Trojanowski JQ, Schneider JA, Abisambra JF, Abner EL, Alafuzoff I et al. Primary age-related tauopathy (PART): a common pathology associated with human aging. Acta Neuropathol 2014; 128: 755–66. [DOI] [PMC free article] [PubMed] [Google Scholar]
- de Wilde A, van der Flier WM, Pelkmans W, Bouwman F, Verwer J, Groot C et al. Association of amyloid positron emission tomography with changes in diagnosis and patient treatment in an unselected memory clinic cohort: the ABIDE project. JAMA Neurol 2018; 75: 1062–70. [DOI] [PMC free article] [PubMed] [Google Scholar]
- Forsberg A, Almkvist O, Engler H, Wall A, Langstrom B, Nordberg A. High PIB retention in Alzheimer’s disease is an early event with complex relationship with CSF biomarkers and functional parameters. Curr Alzheimer Res 2010; 7: 56–66. [DOI] [PubMed] [Google Scholar]
- Gomez-Isla T, Hollister R, West H, Mui S, Growdon JH, Petersen RC et al. Neuronal loss correlates with but exceeds neurofibrillary tangles in Alzheimer’s disease. Ann Neurol 1997; 41: 17–24. [DOI] [PubMed] [Google Scholar]
- Gomperts SN, Locascio JJ, Makaretz SJ, Schultz A, Caso C, Vasdev N et al. Tau positron emission tomographic imaging in the Lewy body diseases. JAMA Neurol 2016; 73: 1334–41. [DOI] [PMC free article] [PubMed] [Google Scholar]
- Gordon BA, Blazey TM, Christensen J, Dincer A, Flores S, Keefe S et al. Tau PET in autosomal dominant Alzheimer’s disease: relationship with cognition, dementia and other biomarkers. Brain 2019; 142: 1063–76. [DOI] [PMC free article] [PubMed] [Google Scholar]
- Gordon BA, Blazey TM, Su Y, Hari-Raj A, Dincer A, Flores S et al. Spatial patterns of neuroimaging biomarker change in individuals from families with autosomal dominant Alzheimer’s disease: a longitudinal study. Lancet Neurol 2018; 17: 241–50. [DOI] [PMC free article] [PubMed] [Google Scholar]
- Gorno-Tempini ML, Hillis AE, Weintraub S, Kertesz A, Mendez M, Cappa SF et al. Classification of primary progressive aphasia and its variants. Neurology 2011; 76: 1006–14. [DOI] [PMC free article] [PubMed] [Google Scholar]
- Hanseeuw BJ, Betensky RA, Jacobs HIL, Schultz AP, Sepulcre J, Becker JA et al. Association of amyloid and tau with cognition in preclinical Alzheimer disease: a longitudinal study. JAMA Neurol 2019; 76: 915–24. [DOI] [PMC free article] [PubMed] [Google Scholar]
- Hyman BT, Phelps CH, Beach TG, Bigio EH, Cairns NJ, Carrillo MC et al. National Institute on Aging-Alzheimer’s Association guidelines for the neuropathologic assessment of Alzheimer’s disease. Alzheimers Dement 2012; 8: 1–13. [DOI] [PMC free article] [PubMed] [Google Scholar]
- Ingelsson M, Fukumoto H, Newell KL, Growdon JH, Hedley-Whyte ET, Frosch MP et al. Early Abeta accumulation and progressive synaptic loss, gliosis, and tangle formation in AD brain. Neurology 2004; 62: 925–31. [DOI] [PubMed] [Google Scholar]
- Irwin DJ, Grossman M, Weintraub D, Hurtig HI, Duda JE, Xie SX et al. Neuropathological and genetic correlates of survival and dementia onset in synucleinopathies: a retrospective analysis. Lancet Neurol 2017; 16: 55–65. [DOI] [PMC free article] [PubMed] [Google Scholar]
- Jack CR Jr, Bennett DA, Blennow K, Carrillo MC, Dunn B, Haeberlein SB et al. NIA-AA research framework: toward a biological definition of Alzheimer’s disease. Alzheimers Dement 2018; 14: 535–62. [DOI] [PMC free article] [PubMed] [Google Scholar]
- Jack CR Jr, Knopman DS, Jagust WJ, Petersen RC, Weiner MW, Aisen PS et al. Tracking pathophysiological processes in Alzheimer’s disease: an updated hypothetical model of dynamic biomarkers. Lancet Neurol 2013; 12: 207–16. [DOI] [PMC free article] [PubMed] [Google Scholar]
- Jack CR Jr, Knopman DS, Jagust WJ, Shaw LM, Aisen PS, Weiner MW et al. Hypothetical model of dynamic biomarkers of the Alzheimer’s pathological cascade. Lancet Neurol 2010; 9: 119–28. [DOI] [PMC free article] [PubMed] [Google Scholar]
- Jack CR, Wiste HJ, Weigand SD, Therneau TM, Lowe VJ, Knopman DS et al. Defining imaging biomarker cut points for brain aging and Alzheimer’s disease. Alzheimers Dement 2017; 13: 205–16. [DOI] [PMC free article] [PubMed] [Google Scholar]
- Jagust W, Jack CR Jr, Bennett DA, Blennow K, Haeberlein SB, Holtzman DM et al. “Alzheimer’s disease” is neither “Alzheimer’s clinical syndrome” nor “dementia”. Alzheimer’s Dement 2019; 15: 153–7. [DOI] [PubMed] [Google Scholar]
- Jansen WJ, Ossenkoppele R, Tijms BM, Fagan AM, Hansson O, Klunk WE et al. Association of cerebral amyloid-beta aggregation with cognitive functioning in persons without dementia. JAMA Psychiatry 2018; 75: 84–95. [DOI] [PMC free article] [PubMed] [Google Scholar]
- Johnson KA, Shultz A, Betensky RA, Becker JA, Sepulcre J, Rentz DM et al. Tau positron emission tomographic imaging in aging and early Alzheimer’s disease. Ann Neurol 2016; 79: 110–9. [DOI] [PMC free article] [PubMed] [Google Scholar]
- Jones DT, Graff-Radford J, Lowe VJ, Wiste HJ, Gunter JL, Senjem ML et al. Tau, amyloid, and cascading network failure across the Alzheimer’s disease spectrum. Cortex 2017; 97: 143–59. [DOI] [PMC free article] [PubMed] [Google Scholar]
- Kantarci K, Lowe VJ, Boeve BF, Senjem ML, Tosakulwong N, Lesnick TG et al. AV-1451 tau and beta-amyloid positron emission tomography imaging in dementia with Lewy bodies. Annu Neurol 2017; 81: 58–67. [DOI] [PMC free article] [PubMed] [Google Scholar]
- Kawas CH, Kim RC, Sonnen JA, Bullain SS, Trieu T, Corrada MM. Multiple pathologies are common and related to dementia in the oldest-old: the 90+ study. Neurology 2015; 85: 535–42. [DOI] [PMC free article] [PubMed] [Google Scholar]
- Klunk WE, Engler H, Nordberg A, Wang Y, Blomqvist G, Holt DP et al. Imaging brain amyloid in Alzheimer’s disease with Pittsburgh Compound-B. Ann Neurol 2004; 55: 306–19. [DOI] [PubMed] [Google Scholar]
- Klunk WE, Koeppe RA, Price JC, Benzinger T, Devous M, Jagust W et al. The centiloid project: standardizing quantitative amyloid plaque estimation by PET. Alzheimer’s Dement 2015; 11: 1–15. [DOI] [PMC free article] [PubMed] [Google Scholar]
- Knopman DS, Lundt ES, Therneau TM, Vemuri P, Lowe VJ, Kantarci K et al. Entorhinal cortex tau, amyloid-beta, cortical thickness and memory performance in non-demented subjects. Brain 2019. [DOI] [PMC free article] [PubMed] [Google Scholar]
- La Joie R, Ayakta N, Seeley WW, Borys E, Boxer AL, DeCarli C et al. Multisite study of the relationships between antemortem [(11)C]PIB-PET Centiloid values and postmortem measures of Alzheimer’s disease neuropathology. Alzheimers Dement 2019; 15: 205–16. [DOI] [PMC free article] [PubMed] [Google Scholar]
- Landau SM, Horng A, Fero A, Jagust WJ. Amyloid negativity in patients with clinically diagnosed Alzheimer disease and MCI. Neurology 2016; 86: 1377–85. [DOI] [PMC free article] [PubMed] [Google Scholar]
- Leal SL, Lockhart SN, Maass A, Bell RK, Jagust WJ. Subthreshold amyloid predicts tau deposition in aging. J Neurosci 2018; 38: 4482–9. [DOI] [PMC free article] [PubMed] [Google Scholar]
- Lemoine L, Gillberg PG, Svedberg M, Stepanov V, Jia Z, Huang J et al. Comparative binding properties of the tau PET tracers THK5117, THK5351, PBB3, and T807 in postmortem Alzheimer brains. Alzheimers Res Ther 2017; 9: 96. [DOI] [PMC free article] [PubMed] [Google Scholar]
- Leuzy A, Savitcheva I, Chiotis K, Lilja J, Andersen P, Bogdanovic N et al. Clinical impact of [(18)F]flutemetamol PET among memory clinic patients with an unclear diagnosis. Eur J Nucl Med Mol Imaging 2019; 46: 1276–86. [DOI] [PMC free article] [PubMed] [Google Scholar]
- Lim YY, Kalinowski P, Pietrzak RH, Laws SM, Burnham SC, Ames D et al. Association of beta-amyloid and apolipoprotein E epsilon4 with memory decline in preclinical Alzheimer disease. JAMA Neurol 2018; 75: 488–94. [DOI] [PMC free article] [PubMed] [Google Scholar]
- Lopez OL, Becker JT, Chang Y, Klunk WE, Mathis C, Price J et al. Amyloid deposition and brain structure as long-term predictors of MCI, dementia, and mortality. Neurology 2018; 90: e1920–8. [DOI] [PMC free article] [PubMed] [Google Scholar]
- Lowe VJ, Curran G, Fang P, Liesinger AM, Josephs KA, Parisi JE et al. An autoradiographic evaluation of AV-1451 tau PET in dementia. Acta Neuropathol Commun 2016; 4: 58. [DOI] [PMC free article] [PubMed] [Google Scholar]
- Lowe VJ, Wiste HJ, Senjem ML, Weigand SD, Therneau TM, Boeve BF et al. Widespread brain tau and its association with ageing, Braak stage and Alzheimer’s dementia. Brain 2018; 141: 271–87. [DOI] [PMC free article] [PubMed] [Google Scholar]
- Maass A, Landau S, Baker SL, Horng A, Lockhart SN, La Joie R et al. Comparison of multiple tau-PET measures as biomarkers in aging and Alzheimer’s disease. Neuroimage 2017; 157: 448–63. [DOI] [PMC free article] [PubMed] [Google Scholar]
- Maass A, Lockhart SN, Harrison TM, Bell RK, Mellinger T, Swinnerton K et al. Entorhinal tau pathology, episodic memory decline, and neurodegeneration in aging. J Neurosci 2018; 38: 530–43. [DOI] [PMC free article] [PubMed] [Google Scholar]
- Markesbery WR, Schmitt FA, Kryscio RJ, Davis DG, Smith CD, Wekstein DR. Neuropathologic substrate of mild cognitive impairment. Arch Neurol 2006; 63: 38–46. [DOI] [PubMed] [Google Scholar]
- Marquie M, Siao Tick Chong M, Anton-Fernandez A, Verwer EE, Saez-Calveras N, Meltzer AC et al. [F-18]-AV-1451 binding correlates with postmortem neurofibrillary tangle Braak staging. Acta Neuropathol 2017; 134: 619–28. [DOI] [PMC free article] [PubMed] [Google Scholar]
- McKeith IG, Boeve BF, Dickson DW, Halliday G, Taylor JP, Weintraub D et al. Diagnosis and management of dementia with Lewy bodies: Fourth consensus report of the DLB Consortium. Neurology 2017; 89: 88–100. [DOI] [PMC free article] [PubMed] [Google Scholar]
- McKhann G, Drachman D, Folstein M, Katzman R, Price D, Stadlan EM. Clinical diagnosis of Alzheimer’s disease: report of the NINCDS-ADRDA Work Group under the auspices of Department of Health and Human Services Task Force on Alzheimer’s Disease. Neurology 1984; 34: 939–44. [DOI] [PubMed] [Google Scholar]
- McKhann GM, Knopman DS, Chertkow H, Hyman BT, Jack CR Jr, Kawas CH et al. The diagnosis of dementia due to Alzheimer’s disease: Recommendations from the National Institute on Aging and the Alzheimer’s Assocation Workgroup. Alzheimers Dement 2011; 7: 263–9. [DOI] [PMC free article] [PubMed] [Google Scholar]
- Mishra S, Gordon BA, Su Y, Christensen J, Friedrichsen K, Jackson K et al. AV-1451 PET imaging of tau pathology in preclinical Alzheimer disease: defining a summary measure. Neuroimage 2017; 161: 171–8. [DOI] [PMC free article] [PubMed] [Google Scholar]
- Murray ME, Lowe VJ, Graff-Radford NR, Liesinger AM, Cannon A, Przybelski SA et al. Clinicopathologic and 11C-Pittsburgh compound B implications of Thal amyloid phase across the Alzheimer’s disease spectrum. Brain 2015; 138 (Pt 5): 1370–81. [DOI] [PMC free article] [PubMed] [Google Scholar]
- Nelson PT, Alafuzoff I, Bigio EH, Bouras C, Braak H, Cairns NJ et al. Correlation of Alzheimer disease neuropathologic changes with cognitive status: a review of the literature. J Neuropathol Exp Neurol 2012; 71: 362–81. [DOI] [PMC free article] [PubMed] [Google Scholar]
- Nelson PT, Dickson DW, Trojanowski JQ, Jack CR, Boyle PA, Arfanakis K et al. Limbic-predominant age-related TDP-43 encephalopathy (LATE): consensus working group report. Brain 2019; 142: 1503–27. [DOI] [PMC free article] [PubMed] [Google Scholar]
- Nelson PT, Head E, Schmitt FA, Davis PR, Neltner JH, Jicha GA et al. Alzheimer’s disease is not “brain aging”: neuropathological, genetic, and epidemiological human studies. Acta Neuropathol 2011; 121: 571–87. [DOI] [PMC free article] [PubMed] [Google Scholar]
- Nordberg A, Carter SF, Rinne J, Drzezga A, Brooks DJ, Vandenberghe R et al. A European multicentre PET study of fibrillar amyloid in Alzheimer’s disease. Eur J Nucl Med Mol Imaging 2013; 40: 104–14. [DOI] [PMC free article] [PubMed] [Google Scholar]
- Ossenkoppele R, Jansen WJ, Rabinovici GD, Knol DL, van der Flier WM, van Berckel BN, et al. Prevalence of amyloid pet positivity in dementia syndromes: a meta-analysis. JAMA 2015; 313: 1939–49. [DOI] [PMC free article] [PubMed] [Google Scholar]
- Ossenkoppele R, Rabinovici GD, Smith R, Cho H, Schöll M, Strandberg O. et al. Discriminative accuracy of F18 flortaucipir positron emission tomography for Alzheimer disease vs other neurodegenerative disorders. JAMA 2018; 320: 1151–62. [DOI] [PMC free article] [PubMed] [Google Scholar]
- Ossenkoppele R, Schonhaut DR, Scholl M, Lockhart SN, Ayakta N, Baker SL et al. Tau PET patterns mirror clinical and neuroanatomical variability in Alzheimer’s disease. Brain 2016; 139 (Pt 5): 1551–67. [DOI] [PMC free article] [PubMed] [Google Scholar]
- Petersen RC. Mild cognitive impairment as a diagnostic entity. J Intern Med 2004; 256: 183–94. [DOI] [PubMed] [Google Scholar]
- Petersen RC. How early can we diagnose Alzheimer disease (and is it sufficient)? The 2017 Wartenberg lecture. Neurology 2018; 91: 395–402. [DOI] [PMC free article] [PubMed] [Google Scholar]
- Pontecorvo MJ, Devous MD Sr, Navitsky M, Lu M, Salloway S, Schaerf FW et al. Relationships between flortaucipir PET tau binding and amyloid burden, clinical diagnosis, age and cognition. Brain 2017a; 140: 748–63. [DOI] [PMC free article] [PubMed] [Google Scholar]
- Pontecorvo MJ, Siderowf A, Dubois B, Doraiswamy PM, Frisoni GB, Grundman M et al. Effectiveness of florbetapir PET imaging in changing patient management. Dement Geriatr Cogn Disord 2017b; 44: 129–43. [DOI] [PMC free article] [PubMed] [Google Scholar]
- Rabinovici GD, Gatsonis C, Apgar C, Chaudhary K, Gareen I, Hanna L et al. Association of amyloid positron emission tomography with subsequent change in clinical management among medicare beneficiaries with mild cognitive impairment or dementia. JAMA 2019; 321: 1286–94. [DOI] [PMC free article] [PubMed] [Google Scholar]
- Rabinovici GD, Jagust WJ, Furst AJ, Ogar JM, Racine CA, Mormino EC et al. Abeta amyloid and glucose metabolism in three variants of primary progressive aphasia. Ann Neurol 2008; 64: 388–401. [DOI] [PMC free article] [PubMed] [Google Scholar]
- Rascovsky K, Hodges JR, Knopman D, Mendez MF, Kramer JH, Neuhaus J et al. Sensitivity of revised diagnostic criteria for the behavioural variant of frontotemporal dementia. Brain 2011; 134 (Pt 9): 2456–77. [DOI] [PMC free article] [PubMed] [Google Scholar]
- Roberts RO, Geda YE, Knopman DS, Cha RH, Pankratz VS, Boeve BF et al. The Mayo Clinic Study of Aging: design and sampling, participation, baseline measures and sample characteristics. Neuroepidemiology 2008; 30: 58–69. [DOI] [PMC free article] [PubMed] [Google Scholar]
- Schneider JA, Arvanitakis Z, Bang W, Bennett DA. Mixed brain pathologies account for most dementia cases in community-dwelling older persons. Neurology 2007; 69: 2197–204. [DOI] [PubMed] [Google Scholar]
- Scholl M, Lockhart SN, Schonhaut DR, O’Neil JP, Janabi M, Ossenkoppele R et al. PET imaging of tau deposition in the aging human brain. Neuron 2016; 89: 971–82. [DOI] [PMC free article] [PubMed] [Google Scholar]
- Schwarz CG, Gunter JL, Lowe VJ, Weigand S, Vemuri P, Senjem ML et al. A comparison of partial volume correction techniques for measuring change in serial amyloid PET SUVR. J Alzheimers Dis 2019; 67: 181–95. [DOI] [PMC free article] [PubMed] [Google Scholar]
- Scrucca L, Fop M, Murphy TB, Raftery AE. mclust 5: clustering, classification and density estimation using gaussian finite mixture models. R J 2016; 8: 289–317. [PMC free article] [PubMed] [Google Scholar]
- Sonnen JA, Larson EB, Crane PK, Haneuse S, Li G, Schellenberg GD et al. Pathological correlates of dementia in a longitudinal, population-based sample of aging. Ann Neurol 2007; 62: 406–13. [DOI] [PubMed] [Google Scholar]
- Sperling RA, Mormino EC, Schultz AP, Betensky RA, Papp KV, Amariglio RE et al. The impact of amyloid-beta and tau on prospective cognitive decline in older individuals. Ann Neurol 2019; 85: 181–93. [DOI] [PMC free article] [PubMed] [Google Scholar]
- St Sauver JL, Grossardt BR, Leibson CL, Yawn BP, Melton LJ, Rocca WA. Generalizability of epidemiological findings and public health decisions: an illustration from the Rochester Epidemiology Project. Mayo Clin Proc 2012; 87: 151–60. [DOI] [PMC free article] [PubMed] [Google Scholar]
- Timmers T, Ossenkoppele R, Verfaillie SCJ, van der Weijden CWJ, Slot RER, Wesselman LMP et al. Amyloid PET and cognitive decline in cognitively normal individuals: the SCIENCe project. Neurobiol Aging 2019; 79: 50–8. [DOI] [PubMed] [Google Scholar]
- Villemagne VL, Burnham S, Bourgeat P, Brown B, Ellis KA, Salvado O et al. Amyloid beta deposition, neurodegeneration, and cognitive decline in sporadic Alzheimer’s disease: a prospective cohort study. Lancet Neurol 2013; 12: 357–67. [DOI] [PubMed] [Google Scholar]
- Villemagne VL, Dore V, Bourgeat P, Cummins TL, Pejoska S, Mulligan RS et al. The tau MeTeR scale for the generation of continuous and categorical measures of tau deposits in the brain: results from 18F-AV1451 and 18F-THK5351 tau imaging studies. Alzheimer’s Dement 2016; 12: 244.26218444 [Google Scholar]
- Walker L, McAleese KE, Thomas AJ, Johnson M, Martin-Ruiz C, Parker C et al. Neuropathologically mixed Alzheimer’s and Lewy body disease: burden of pathological protein aggregates differs between clinical phenotypes. Acta Neuropathol 2015; 129: 729–48. [DOI] [PubMed] [Google Scholar]
- Wisse LE, Butala N, Das SR, Davatzikos C, Dickerson BC, Vaishnavi SN et al. Suspected non-AD pathology in mild cognitive impairment. Neurobiol Aging 2015; 36: 3152–62. [DOI] [PMC free article] [PubMed] [Google Scholar]
- Wolk DA, Price JC, Madeira C, Saxton JA, Snitz BE, Lopez OL et al. Amyloid imaging in dementias with atypical presentation. Alzheimers Dement 2012; 8: 389–98. [DOI] [PMC free article] [PubMed] [Google Scholar]
- Xiong C, Jasielec MS, Weng H, Fagan AM, Benzinger TL, Head D et al. Longitudinal relationships among biomarkers for Alzheimer disease in the Adult Children Study. Neurology 2016; 86: 1499–506. [DOI] [PMC free article] [PubMed] [Google Scholar]
Associated Data
This section collects any data citations, data availability statements, or supplementary materials included in this article.
Supplementary Materials
Data Availability Statement
The Mayo Clinic Study of Aging and Alzheimers Disease Research Center make data available to qualified researchers upon reasonable request.