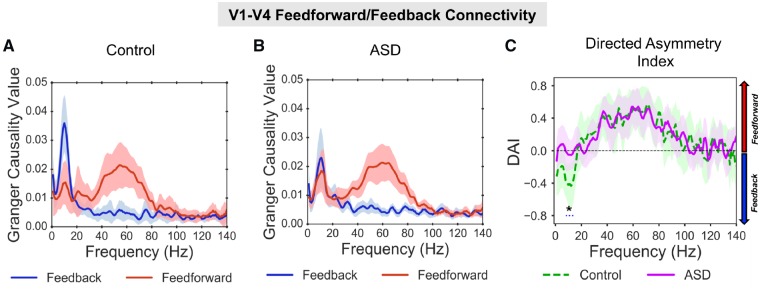
Figure 2.
V1-V4 feedforward/feedback connectivity. (A) For the control group there was a peak in Granger causality values, in the gamma-band (40–80 Hz, red line) for V1-to-V4 feedforward connectivity, and a peak in Granger causality values in the alpha band (8–13 Hz, blue line) for V4-to-V1 feedback connectivity. (B) For the ASD group there was also a peak in Granger causality values in the gamma-band for V1-to-V4 feedforward connectivity; however, there was a smaller peak in Granger causality in the alpha-band for V4-to-V1 feedback connectivity. For comparisons with surrogate data per group, see Supplementary Fig. 3. (C) The difference between feedforward and feedback connectivity was quantified as the DAI. The difference in DAI between control (dashed, green line) and ASD (solid, purple line) was significant (P = 0.036), with lower DAI values (P = 0.036) between 8–14 Hz for the control group, suggesting reduced V4-to-V1 feedback connectivity in autism. The shaded area around each Granger causality line indicates 95% confidence intervals.

