

Abstract
We describe a novel method of adaptively controlling epileptic seizure-like events in hippocampal brain slices using electric fields. Extracellular neuronal activity is continuously recorded during field application through differential extracellular recording techniques, and the applied electric field strength is continuously updated using a computer-controlled proportional feedback algorithm. This approach appears capable of sustained amelioration of seizure events in this preparation when used with negative feedback. Seizures can be induced or enhanced by using fields of opposite polarity through positive feedback. In negative feedback mode, such findings may offer a novel technology for seizure control. In positive feedback mode, adaptively applied electric fields may offer a more physiological means of neural modulation for prosthetic purposes than previously possible.
Keywords: electric field, epilepsy, seizure, adaptive, control, hippocampus
Epilepsy is a dynamical disease (Belair et al., 1995); its symptoms are produced by aberrant dynamics of neuronal networks. The efficacy of attempts to suppress epileptic seizures through stimulation of sites remote from the seizure focus and independent of the seizure dynamics (cerebellum, thalamus, and vagal nerve) have been generally unimpressive (Cooper et al., 1976; Van Buren et al., 1978; Cooper and Upton, 1985; Fisher et al., 1992; Murphy et al., 1995; McLachlan, 1997). Surprisingly, very little effort has been focused on the direct dynamical control of seizures. In vitro laboratory experiments have explored the injection of electric current directly into epileptiform networks using periodic pacing (Jerger and Schiff, 1995), nonlinear control (Schiff et al., 1994), and feedback (Nakagawa and Durand, 1991; Kayyali and Durand, 1991; Warren and Durand, 1998) to control or suppress evoked and spontaneous activity. Intriguing recent clinical efforts for seizure suppression used surface (Lesser et al., 1999) and/or depth (Velasco et al., 2000) electrodes to stimulate near seizure foci. However, all of these methods used discrete perturbations to interact with a time-continuous dynamical system. Here, we use time-continuous electric fields.
Since the experiments of Rushton (1927), it has been recognized that electric fields can influence the threshold of excitability of neurons (Terzoulo and Bullock, 1956; Jefferys 1981; Bawin et al., 1986a,b). The physics of these effects has been explained well (Chan and Nicholson, 1986; Tranchina and Nicholson, 1986; Chan et al., 1988). An electric field oriented parallel to the somatic–dendritic axis of a neuron, the spike initiation zone of which is asymmetrically placed with respect to its centroid, will modulate the firing of the neuron. The pyramidal cells of the neocortex and the hippocampus individually have favorable geometry for electric field manipulation and, within a local network, are oriented with their somatic–dendritic axis parallel to each other.
The use of electric fields to modulate neuronal activity offers the prospect of minimizing the invasiveness of medical devices, a fact anticipated by Chan and Nicholson (1986). One of the technical difficulties in implementing an electric field involves simultaneously measuring neuronal activity through local field potentials while applying an external field. In recent work (Gluckman et al., 1996a,b), we addressed this problem by using differential recording techniques with measurement and reference electrodes explicitly aligned along a common isopotential of the applied electric field. This allowed us to record neuronal activity while simultaneously applying relatively large (50–100 mV/mm), time-dependent electric fields with minimal stimulus artifact.
We have shown that DC electric fields applied externally to brain tissue suppress spontaneous epileptiform activity (Gluckman et al., 1996a). However, neuronal adaptation, as well as electrode and tissue polarization, renders the effects of DC fields transient. Here we report the first demonstration of adaptively applied electric field control of seizure-like activity. During control, network activity is not completely suppressed. Instead, the network has a broad range of accessible activity, although seizure dynamics are suppressed. Furthermore, the polarization effect seen with DC fields is significantly reduced, allowing prolonged control. This methodology can also be used to interact with neuronal activities other than seizure.
MATERIALS AND METHODS
Tissue preparations. Sprague Dawley rats weighing 125–150 gm were anesthetized with diethyl ether and decapitated in accordance with a protocol approved by the George Mason University Animal Use Review Board. Hippocampal slices (400 μm thick) were prepared with a tissue chopper, cut either transversely or longitudinally with respect to the long axis of the hippocampus, and placed in an interface-type perfusion chamber at 35°C. The slices were incubated for 90 min in normal artificial CSF (ACSF) containing (in mm): 155 Na+, 136 Cl−, 3.5 K+, 1.2 Ca2+, 1.2 Mg2+, 1.25 PO42−, 24 HCO3−, 1.2 SO42−, and 10 dextrose; the perfusate was then replaced with elevated potassium ACSF (8.5 mm [K+] and 141 mm [Cl −]), and the slices were incubated for an additional 30 min. In some experiments, transverse slices were further cut to isolate just the CA1 region, and then allowed to incubate longer until seizures were observed.
Experimental apparatus and electronics. A schematic of the experimental system is shown in Figure 1. A uniform electric field was introduced by passing current between a pair of large Ag–AgCl plates embedded in the chamber floor relatively far from the slice (17 mm plate separation). We used a four-electrode technique with a separate pair of electrodes to sense the field, in addition to the pair of field-producing electrodes (Cole, 1972). This eliminated effects from the slow polarization known to occur even in “nonpolarizing” Ag–AgCl electrodes. We used field application electronics that control the current between the field plates such that the potential difference between the sensing electronics equals an input voltage signal and the potential of the plates floats with respect to signal ground (defined by a pair of Ag–AgCl plates near the chamber midline). The input voltage signal to the field electronics was computer-generated and low-pass-filtered (<30 kHz) to eliminate artifacts from the digital-to-analog conversion.
Fig. 1.

Schematic of the hippocampal slice and electrodes in the perfusion chamber (modified Haas style) as viewed from the side (middle) and above (top), with the wiring for the field feedback amplifier indicated and a block diagram of the controller. The brain slices rest on a nylon mesh just below the top surface of the perfusate of ACSF. The atmosphere above the perfusate is warmed to the bath temperature of 35°C and saturated with 95% O2/5% CO2. An electric field is imposed on the slice by a set of Ag–AgCl electrodes embedded in the floor of the chamber. The current applied between these parallel-plate field electrodes is feedback-controlled so that the potential difference between the sensing electrodes is proportional to a program voltage. An additional pair of electrodes is used as recording ground. Also shown (bottom) is the alignment of the electric field with the somatic–dendritic axis of a neuron that results in suppression. With this alignment, the electric field polarizes the neuron, leaving the transmembrane potential of the soma more negative with respect to the extracellular space. If the spike initiation zone of the neuron is near the soma, as is typical for the pyramidal cells studied here, the cell will become less excitable. Reversing the field polarity will depolarize the soma and bring the neuron closer to threshold.
Electrophysiological recordings. Synchronous neuronal population activity was monitored by measuring the extracellular potential in the cell body layer of the CA1 region. Extracellular recordings were made with paired saline-filled micropipette electrodes (1–4 MΩ) and a differential DC-coupled amplifier (Grass model P16). To produce a feedback system, measurement of neuronal activity must be performed simultaneously with the applied field. Two approaches were used to minimize the artifact from the field in the recordings. First, the micropipette electrodes were aligned as closely as possible to an isopotential of the applied field. Alignment was achieved by applying a sinusoidal field and adjusting the position of the reference electrode to minimize the field artifact. This allowed us to measure neuronal activity in the presence of relatively large (50–100 mV/mm) fields with high resolution and without saturating the recording amplifiers. Second, because some stimulus artifact persists in our measurements, we additionally restricted the frequency content of the applied field to be distinct from that of the measured activity of primary interest.
Feedback algorithm. For feedback purposes, we characterized the neuronal activity associated with seizures as the root-mean-square (RMS) of the recorded activity measured within a frequency band of 100–500 Hz, averaged over a time that varied from 0.1 to 1.5 sec. The applied field was proportional to the positive difference between this RMS activity and a threshold value. The threshold was set by an average (∼30–3000 sec) of the measured RMS power. The frequency content of the applied field was restricted to <10 Hz. For practical purposes, a maximal (saturation) field amplitude was enforced. In some applications, the output field was half-wave-rectified (i.e., when the RMS was below threshold, no field was applied). Both the gain and the threshold were set empirically. In general, optimal control was found with a moderate gain that could be estimated as ∼(50 mV/mm)/(peak recorded power of a seizure).
Field strengths are presented in units of millivolts per millimeter, with the positive field correspondingly aligned with the primary dendrite–soma axis to produce a suppressive effect, as illustrated at the bottom of Figure 1. Gains are presented in arbitrary units, with positive gain corresponding to negative feedback mode.
Analysis methods. Seizure-like events in these slices are characterized from extracellular field-potential recordings by an extended burst of high-frequency (100–350 Hz) activity accompanied by a relatively large (0.2–5 mV), low-frequency (0.01–1 Hz) negative potential shift that typically lasts many seconds. Three methods were used to characterize neuronal activity from the field-potential recordings. First, events were detected from the high-frequency activity in the field potentials. The RMS power in the frequency band 100–300 Hz was calculated from the field-potential recordings with a time constant of 0.1–0.5 sec, then analyzed with a simple threshold-crossing event detection scheme. These “RMS events” were then characterized by their average and maximum power and duration. Second, events were detected from the low-frequency deflection in the field potentials. The field-potential recordings were low-pass-filtered with a cutoff at 10 Hz, and threshold crossing was applied again. These “DC events” were characterized by their average and maximum potential shift, as well as duration. We note that, because these analyses are based on distinct or separate frequency bands, they are independent measures. Finally, spectral methods were used to characterize average frequency content of the neuronal activity during different types of stimuli.
Before each of the above-mentioned analyses, the linear component of the stimulus artifact was calculated from the cross-correlation coefficient between the field-potential recordings and the stimulus. The stimulus artifact accounted for <5% of the RMS deviations in the field-potential recordings.
RESULTS
Electric fields are known to modulate neuronal activity and even transiently suppress seizure-like activity (Gluckman et al., 1996a). Our objective in this work was to demonstrate that, when applied in a feedback fashion, control of seizure-like network behavior could be achieved for extended periods of time.
Field characteristics
Critical to performing these experiments was our ability to record neuronal activity independent of the applied time-varying electric field stimulus with minimal field stimulation artifact in the recording. We achieved this with the use of DC differential recordings from paired electrodes aligned to be on nearly the same isopotential of the applied field. We further restricted our applied field to have frequency content in a band distinct from that of the signal in which we were interested. This distinction is illustrated in Figure 2. Power spectra for recorded activity and applied field are shown for cases in which the applied field is noise (Fig. 2A) and a typical feedback signal (Fig 2B). In addition, we have postprocessed our recording to eliminate the residual artifact, which typically constitutes <5% of the RMS field-potential variations. The power spectra for the processed signals is also shown in these plots and is indistinguishable from the unprocessed signals, except at low (<3 Hz) frequencies. These results indicate that the applied field during control is not simply masking the neuronal activity in the recording process during control. Because the applied field was restricted to have frequency content <10 Hz, it only changes the character of the field-potential recordings at the lowest frequencies.
Fig. 2.

Power spectral density (PSD) for recorded activity and applied field stimulus when the stimulus was a low-frequency random signal (A) and a typical feedback control signal (B). For display purposes, the stimulus PSD was vertically scaled such that its amplitude matched that of the recorded activity PSD at low frequencies. In both cases, the stimulus PSD falls off quickly (∼f−2) for frequencies, f, above ∼4 Hz, in contrast to the neuronal activity PSDs, which have significant spectral power up to 350 Hz. Also shown are the PSDs of the recorded neuronal activity after removal of an estimate of the stimulus artifact. These signals are indistinguishable from the original recording for frequencies above ∼2 Hz. B, The raw signal lies slightly below the processed signal for low frequencies. These results indicate that the applied field is not simply masking the neuronal activity in the recording process during control. The stimulus artifact accounts for <5% of the RMS recorded signal amplitude.
Overview of control phenomena
A characteristic low-frequency negative potential shift of the tissue that is associated with these seizure-like events in vitro (Traynelis and Dingledine, 1988) is quite similar to the slow, low-frequency potential shifts observed during in vitro seizures (Wadman et al., 1992). Typical seizure-like events in these slices exhibited durations of ∼5–25 sec, inter-event intervals of order 40 sec, and low-frequency (0.01–1 Hz) potential shifts of order 0.2–5 mV. Recording-to-recording variations in the morphology and amplitude of DC deflection can be attributed to the details of the measurement electrode location with respect to both the origin of the seizure and the position of the reference electrode.
Seizure suppression
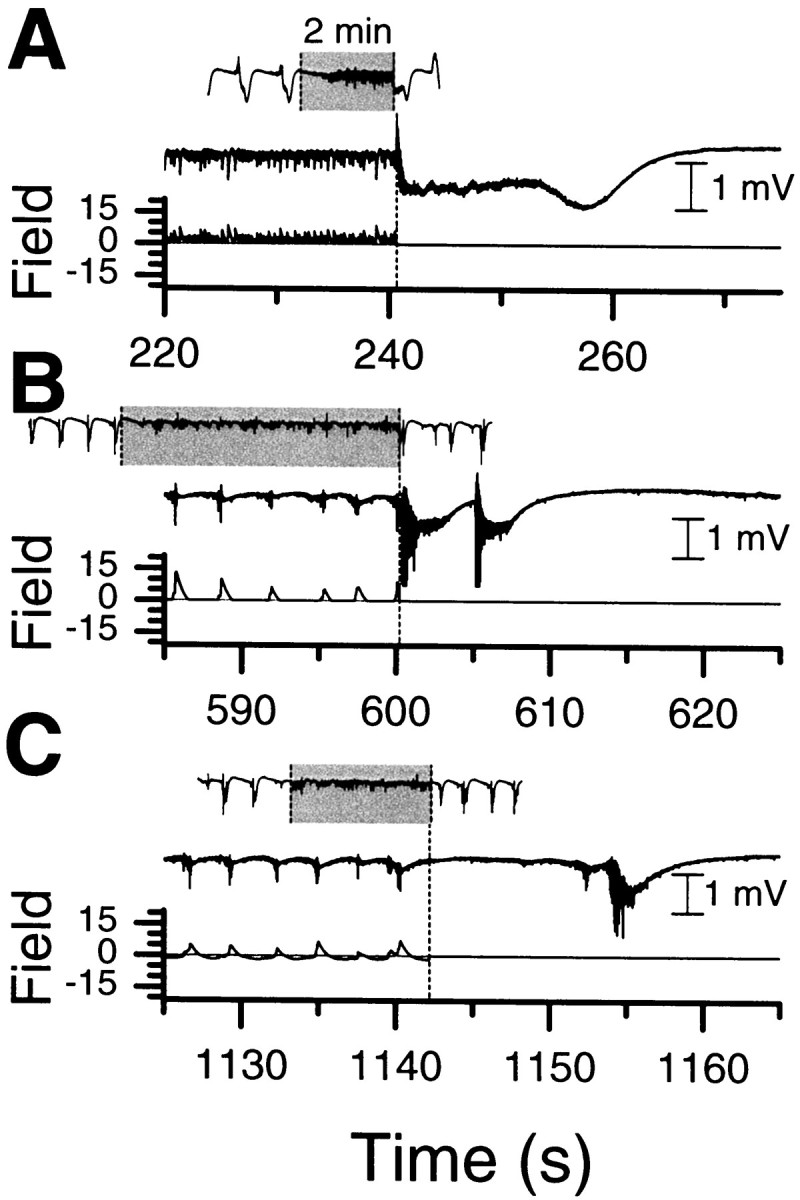
In Figure 3, A andB, we show examples that illustrate how an electric field can be used to adaptively suppress seizure-like activity within the CA1. Suppression is achieved by using negative feedback. In both cases, the high-frequency activity toward which the suppression algorithm is directed is significantly attenuated. The DC shift was completely eliminated (Fig. 3A) during suppression for some slices, whereas it was partially retained (Fig. 3B) for others. During control, some non-zero level of network activity is still observed from the field potentials (Fig.3A,B, third insets). We have documented successful suppression in 20 of 30 seizing slices with which we applied adaptive control.
Fig. 3.

Adaptive control of seizure activity using applied electric fields. In A–C, the main trace is the raw extracellular potential recording. Insets are tracings of activity, filtered to illustrate the high-frequency activity, shown at expanded scales. In each case, a dashed line is used to demarcate when control is turned on.A, B, Examples of seizure suppression from separate experiments using electric fields applied as a negative feedback parameter. Electrographic seizures are observed as an increase in high-frequency activity atop large low-frequency deflections (Traynelis and Dingledine, 1988). B, Seizures occur interspersed among frequent short network bursts (Rutecki et al., 1985). C, Example of seizure induction achieved using positive feedback.
Control can often be maintained for prolonged periods of time. To date, 16 min is the longest we have maintained control in a slice otherwise exhibiting seizures approximately every 40 sec. Because the amplitude, duration, and interval between the events slowly change over the course of 1 hr (Fig. 4), 16 min is near the limit for reliable suppression testing in this system.
Fig. 4.

Event detection results for a single 90 min recording with different electric field stimuli applied. Thebottom trace indicates feedback gain (G;left axis) or amplitude (A; right axis) of the applied stimulus. Greek letters andcolors indicate the type of stimulus: baseline (black, no letter); full-wave feedback control (red, α); half-wave-rectified feedback control (green, β); constant amplitude suppressive field (light blue, γ); low-frequency noise (dark blue, δ); suppressive half-wave-rectified low-frequency noise (orange, ε); positive feedback control (magenta, μ). Two types of event detection were used to identify synchronous neuronal activity from the recorded field potentials. RMS events were detected from variations in the RMS power in the frequency band 100–350 Hz. DC events were detected by threshold detection after low-pass filtering of the recordings at 10 Hz. The character of both types of events, as quantified by their average and maximal amplitudes as well as their duration, was visibly changed from baseline when control was applied. No events of either type were observed during the final and longest (16 min) application (α3) of full-wave control.
Seizure enhancement
Positive feedback, set by changing the sign on the gain that reverses the applied field polarity, can be used to enhance seizures or even to create seizures where none were observed previously. In Figure3C, we show an example of the characteristic population burst-firing events seen in high [K+] hippocampal slices (Rutecki et al., 1985) in the uncontrolled state. With positive feedback control, the adaptively applied field now enhances the brief network bursts into large seizure-like events with the substantial low-frequency potential shifts characteristic of seizures. We have documented seizure generation in all four non-seizing slices with which we applied positive feedback control.
Comparison of parameters: a single experiment
Detailed event-extraction results for a 90 min recording from a single experiment are shown in Figure 4. In this experiment, we compared the application of negative feedback both with and without half-wave rectification of the applied field at various gains, application of a constant amplitude suppressive field and random waveform fields, as well as positive feedback control. From this experiment, we extracted events from both the RMS power in the frequency band 100 < f < 350 Hz, which we term RMS events, and the low-frequency (f < 10 Hz) potential shifts, which we term DC events.
The type of stimulus applied is indicated in Figure 4(bottom trace) where the height of the blocks indicates either the gain (G, left axis) used in the proportional feedback routine or the amplitude (A,right axis) of the waveform applied. Both thecolors and the Greek letters indicate the type of stimulus applied, as indicated in the figure legend. Baseline recordings of 1–4 min were made between stimuli. We show in thetop plots the duration, maximum, and average deflections (DC or RMS power) of all events extracted from either the RMS power (RMS events, top trace for each pair) or low-frequency deflections (DC events) as a function of time. Values for all extracted events are plotted. For the maximum and average deflections, thegray horizontal lines correspond to the trigger threshold for defining an event. As expected, the maximum deflections are always greater than or equal to the trigger threshold. In contrast, the average deflection need not be larger than the trigger threshold. Therefore, the trigger threshold provides a logical dividing line between large and small events in the average deflection plots. In the duration plots, a horizontal line at 3 sec is plotted as a rough threshold for distinguishing seizure-like episodes from smaller burst-like events.
Feedback suppression
Negative (i.e., suppressive) feedback, indicated by a negative gain, was applied with both full-wave (α) and half-wave rectification (β). Even at the smallest gain used (α1, β1), all six types of event characteristics are distinct from the baseline activity (Fig. 4, black) for both detection schemes. At the intermediate gain used, no DC events were observed during the nonrectified control (α2), whereas only short, low-power RMS events were observed. For half-wave-rectified control at a comparable gain (β2), short, small events were observed from both the DC and the RMS event extraction. At the highest gain used for nonrectified control (α3, starting at time 3960 sec), no DC or RMS events were detected throughout the 16 min of control application.
Examples of activity for this experiment with and without control are shown in Figure 5. The top pair of traces (Fig. 5A) corresponds to the measured field potential (bottom) and applied field (top) starting 2 min before the last application of nonrectified control (α3). The baseline activity, without control, is characterized by large seizure-like events that start with a burst of high-frequency activity and are accompanied by a large low-frequency potential shift. Details of one of these events are shown in Figure 5B(trace) at an expanded scale (15 sec), high-pass filtered at 100 Hz, along with a spectrogram of the activity covering frequencies from 25 to 350 Hz. The power associated with these seizures can be observed in the spectrogram to start at high frequencies (near 120 Hz) and progress toward lower frequencies, a characteristic known as a “spectral chirp.” Similar spectral chirps have been observed to be the spectral signature of human seizures (Schiff et al., 2000). The neuronal activity after the seizure-like events in our experiments, as measured by the RMS power, is depressed across all frequencies.
Fig. 5.

Traces and spectrograms of activity with and without control for the same experiment as Figure 4. A, Activity (bottom trace) and applied field (top trace) from the final application of full-wave control (α3) from Figure 4 and the baseline preceding it.B, C, A 15-sec-long trace andspectrogram of a seizure-like event (B) and of activity during control (C) from A. The top traces in B and C are the activity, high-pass-filtered at 100 Hz. The spectrograms(B–D) are calculated in overlapping vertical frequency bins 50 Hz tall from 25–350 Hz, and in overlapping horizontal time windows 0.05 sec wide. D, Spectrogram for a longer period illustrating the contrast between baseline and controlled activity.
Expanded views for recorded neuronal activity during control are shown in Figure 5C with the same scales as Figure 5B. Although the RMS power fluctuates during control (Fig. 5C), it never approaches the level observed in baseline (Fig.5B). Note that the color scale is logarithmic. This behavior continues throughout the 16 min of this control application (Fig. 4, α3), in which the fluctuations are never large enough to trigger the RMS event detection. A spectrogram corresponding to a longer period (150 sec) crossing from baseline to control is shown in Figure 5D. Throughout the control period, the RMS power activity lacks both the characteristic highs and lows observed during noncontrolled activity. We note that this power reduction/stabilization occurs across all frequencies displayed (25–350 Hz), whereas the applied field was constrained to have frequency content below ∼10 Hz. The RMS amplitude of the applied field averaged over the full control period was ∼4.8 mV/mm and was typically much smaller than the allowed maximum of 17.5 mV/mm.
Suppression with constant field
A relatively large suppressive constant (DC) field (16.7 mV/mm) was applied, starting at time 900 sec (Fig. 4, γ). As was observed in earlier work (Gluckman et al., 1996a), this had the effect of suppressing the large seizure-like events observed with no field. However, the effect had limited duration because a large seizure-like event was observed 276 sec after initiation of the field, as shown in Figure 6A. This is in contrast to the 600 sec period of control initiated at timet = 1400 sec, during which no large events were observed (Fig. 4, α2).
Fig. 6.

Examples of activity during nonfeedback electric field stimulus for the same recording as Figure 4. For each set, thetop trace is of the recorded activity, whereas thebottom trace shows the applied field. A, Application of a constant-amplitude (DC) suppressive field (Fig. 4, γ). B, Application of a full-wave low-frequency noise field (Fig. 4, δ). C, Application of a half-wave-rectified low-frequency noise field (Fig. 4, ε). In each case, large neuronal events are observed, although the full-wave noise field did have the effect of breaking up the seizure-like events into shorter durations. The horizontal axis is time in units of seconds.
Stimulation with low-frequency noise
One hypothesis might be that any low-frequency field might elicit a similar suppressive effect on the neuronal activity. We have tested various nonadaptive periodic and random signals. Although such signals do tend to modulate neuronal activity, we have observed little effective suppressive effect on seizures. Examples of random signals were used in the experiment of Figure 4. Application δ corresponds to a full-wave (suppressive and enhancing) random field, whereas ε corresponds to a half-wave-rectified (suppressive only) random field. Each was restricted to a frequency content<1 Hz. Examples of activity from each of these applications are shown in Figure 6, B and C. The full-wave random field (Fig. 6B) did have the overall effect of breaking up the seizures in time and decreasing their duration as measured by the RMS event extraction (Fig. 4, top). However, the maximum amplitude of those events as measured in the RMS was typically larger than baseline, and comparable findings were reflected in the low-frequency deflections (DC events). The half-wave-rectified field (Fig. 6C) had little effect at either amplitude used.
Positive feedback control
We applied a positive feedback for a short duration during this experiment. During this time, two events were observed, both of which were relatively large as measured from the average and maximum deflection for both the RMS and DC detection methods (Fig. 4, μ), as compared with the baseline events nearby in time.
Statistics using power spectra
The character of the neural activity during control can be further quantified from the average power spectra. Spectra from the last control application in Figure 4 and the baseline recording after it are shown in Figure 7A. These averages were calculated by averaging the spectra of 1.64 sec (214 = 16,384 points, recorded at 10 kHz) half-overlapping windows. The SD of power as a function of frequency, which represents window-to-window power variations, is shown in Figure 7B. For both of these measures, the curve for the controlled activity (line with symbols) lies well below that of the baseline activity.
Fig. 7.

Comparison of PSD of recorded activity during control (lines with symbols) as compared with baseline (lines without symbols). The control corresponds to the final control application in Figure 4, and the baseline corresponds to the final baseline application. PSDs were calculated in overlapping 1.64 sec (214point) windows. The power averaged over the windows is shown inA, whereas the window-to-window variance of power is shown in B. For both measures, the controlled activity falls well below that of the baseline activity.
Although our objective was to suppress the seizure-like events, the control law that we used (the algorithm) was designed to limit the RMS power of recorded neural activity in a frequency band from 100 to 500 Hz. We can therefore quantify the success of this controller by investigating the statistics of the RMS power integrated over the frequency band 100–350 Hz, again for overlapping 1.63 sec windows. The power above ∼250 Hz is negligible (Fig. 5). This measure should be independent of the stimulus artifact because the power associated with the stimulus is confined to frequencies <10 Hz (Fig. 2). Normalized histograms of this integrated power are shown in Figure8A for the baseline recordings (■), during full-wave feedback control (α, ○), and during half-wave-rectified control (β, ▵) for the whole recording of Figure 4. The distributions for all three conditions are populated primarily with windows of low power. The windows with high power are of great interest because we associate high power in this frequency band with the first portion of the seizure-like events. To highlight the tails of these distributions, we compute the cumulative probability, shown in Figure 8B. This distribution,C(p), can be understood to be the fraction of windows with power > p. From it, we observe that the maximum power observed during baseline is roughly four times higher than observed during control. In addition, ∼3% of the windows during baseline activity have higher power than the maximum observed during either type of control.
Fig. 8.

Statistics of the RMS power of recorded activity in the frequency band 100-350 Hz, calculated in 1.64 sec windows, for baseline (■), full-wave control (○), and half-wave-rectified control (▵). Statistics correspond to all applications, independent of gain for the recording of Figure 4. A, The normalized histogram. B, Cumulative probability. It is clear that the baseline activity has many windows with much higher power than either type of control. These windows correspond to the first phase of the seizures. Inset, The normalized histogram of power calculated with logarithmically spaced bins, abscissa, power; ordinate, frequency) for baseline (■) and full-wave control (○). From this plot, it is observed that deviations to both high and low power are eliminated during full-wave control. The windows with extremely low power correspond to the latter phase of the seizures and the recovery times after them. C, The power variance versus average power is plotted for these three conditions. The two types of control are statistically well distinguished from that of the baseline activity.
The high-frequency burst of activity in the uncontrolled seizure-like events is usually followed by a quiet, refractory-like period. During full-wave control, the objective of the control algorithm was to maintain a target level of activity by either suppressing or exciting the network. To further illustrate the controller's efficacy, we show in Figure 8A (inset) the normalized histogram of power for baseline (■) and full-wave feedback (○,thick line) control computed with logarithmic bins (abscissa, power; ordinate, frequency). From this graph, it is clear that such excursions to low power are also curtailed during full-wave control. Half-wave-rectified control (data not shown) also decreased these excursions, but to a lesser extent.
The window-to-window variance of the integrated power is plotted versus the average power in Figure 8C for each of these conditions (baseline, control, and rectified control). We use the variance as a measure of the width of the distribution. The baseline activity is clearly differentiated statistically from both types of controlled activity using either the mean or variance as measures.
Release phenomena
The character of the activity during control varied from experiment to experiment. It depended on both variations in the network activity and our choice of parameters for the controller. In some cases (Fig. 3A), during control, the network-controller system would be in a cyclic state. The network would begin to become more excited, and then the controller would apply a field, causing the neural activity to become quiet. The field would then decrease, and the cycle would repeat. In these cases, large seizure-like events were observed nearly immediately when the controller was turned off. An example of such a seizure after release is illustrated in Figure9A for the same control run as Figure 3A. The top trace is the recorded field potential, whereas the bottom trace is the applied field. In other cases, the amount of intervention by the controller cycled on a longer time scale (of order 1 min), often reaching a point at which no field would be applied for a few seconds. In those cases, the activity when control was released depended on the phase of this cycle. If the controller was actively suppressing when shut off, then a seizure would progress (Fig. 9B). Otherwise, one would appear later, but within a few seconds of release.
Fig. 9.
Examples of network activity when control is released. In A–C, theinset is the activity for the full control period, indicated in gray, plus the baseline periods before and after. A, The trace corresponds to the same experiment as Figure 3A, with half-wave-rectified control. The network oscillates between excitation similar to seizure onset and suppression by the controller. When control is released, this activity proceeds immediately into a full seizure-like event.B, C, Traces from another experiment in which half-wave-rectified control (B) was compared with nonrectified control (C). For half-wave rectification, seizures were observed very soon (0–3 sec) after control was released, as compared with 12–18 sec for nonrectified control. The time base for eachinset is the same and is indicated in A. The inset vertical scale is half that of the main traces.
In the majority of these experiments, only half-wave-rectified control was used. This has the effect of suppressing activity only when it is above the threshold. If we use the full proportional feedback control signal (full-wave control), the effect is not only to suppress when the activity level is too high but also to excite when the activity level is too low. In the two longer experiments (two slices from two rats) in which we compared full-wave control with half-wave-rectified control with similar parameters, the network was consistently quiet on release from full-wave control for a period comparable with roughly half the baseline inter-event interval. An example of full-wave release is shown in Figure 9C for comparison with half-wave release of Figure9B in the same network. During this experiment, which was designed to contrast the network responses to these different control algorithms, we alternated solely between rectified and nonrectified control (with baseline in-between) at constant gain. The intervals between turning off control and the next event were 0.1–6 sec for rectified control (three applications) and 14–17 sec (four applications) for full signal control. Application of a Student'st test yields estimates that these distributions are different with >95% significance. Similar results were observed for the experiment of Figure 4.
Results summary
Clear suppression of the seizure-like activity compared with the baseline activity was achieved using feedback control through electric field stimulation in 20 of 30 seizing slices (4 whole transverse slices, 21 cut transverse slices, and 5 CA1 longitudinal slices; prepared from 21 rats). Half-wave control was applied in all, and full-wave control was applied in five of the successful suppression applications. We analyzed five experiments in detail, as described for the experiment of Figures 4-8. In each of those experiments, the RMS power and the power fluctuation in the frequency band 100–350 Hz during control were significantly lower than during baseline recordings, as in Figure 8C. In each experiment, there were clear differences in the character (duration, average and maximum power) of the events as extracted from the RMS power, and four of five revealed clear differences from events extracted from the DC deflections. In six experiments (six slices from six rats), we maintained control for periods of at least 5 min without breakthrough seizures before parameters were changed. In addition, we generated seizures in non-seizing slices by applying positive feedback in four experiments (four slices from four rats).
Control failure
We were not always successful in controlling seizures, and the reasons for failure appear multifactorial. Procedural and equipment problems often played a role. Specifically, failure to closely align the reference electrode on the same isopotential of the applied field as the measurement electrode played a role in at least three of the outright failures and prevented detailed analysis from at least another three experiments. The formation of large air bubbles deformed the electric field in one experiment. In three other cases, we did not find control parameters (especially the filter settings) that would suppress the seizures without responding to the background activity. This would occur, for example, when the events had very little of the high-frequency signature at seizure initiation, so the suppressive field was not applied until it was too late.
More interesting are some of the dynamical failures to control. In some cases of half-wave control, the activity level would be modulated by the field but would continue to increase until the controller would saturate at the maximum allowed field amplitude. The seizure would then be free to break through, as observed with constant field application (Fig. 6A). After these “breakthrough” seizures, the RMS activity would decrease, and the field would return to zero. Breakthrough seizures could often be eliminated by increasing the maximum field amplitude. In four of the complete failures, breakthrough seizures were observed within one typical seizure interval of initiation of control. In four of the successful experiments, breakthrough seizures were only observed after 3–7 min (3–10 seizure intervals) of control, or they appeared as relatively small events, compared with the uncontrolled activity.
In at least three of the cases for which we failed to control the activity, subsequent multiprobe measurements of activity indicated that the seizures were initiating at points distant from the point we were controlling and were propagating toward the microelectrode.
DISCUSSION
We have demonstrated adaptive electric field control of seizure-like events in neuronal networks. These population events were characterized by an increase in high-frequency activity at their onset, followed by a significant low-frequency negative shift as measured from the extracellular field potential. The control law that was used applied a suppressive field when the RMS amplitude of the measured high-frequency activity increased. This had the effect of suppressing neuronal activity at the onset of the seizures. We then used event detection from the RMS power in the frequency band 100–350 Hz and from DC deflections, along with spectral analysis, to distinguish activity during control periods from uncontrolled periods. Controlled activity revealed shorter, smaller events (if any) (Fig. 4) as well as lower average power and lower power variance (Fig. 8) than the uncontrolled activity.
Previous estimates place the sensitivity of single neurons at ∼5 mV/mm (Jefferys, 1981). In previous work (Gluckman et al., 1996a), we demonstrated suppression of network seizure-like activity in similar high-potassium hippocampal preparation as used here with DC fields in the range of 5–10 mV/mm. Recent work by Ghai et al. (2000), demonstrated suppression of seizure-like activity in a low-calcium hippocampal preparation with DC fields in the range of 1–5 mV/mm. The amplitude used in our present adaptive experiments to modulate the network dynamics ranged from a few millivolts per millimeter to as high as a few tens of millivolts per millimeter. In the long full-wave control example shown in Figure 4 (α3), the RMS field amplitude was ∼4.8 mV/mm during the16 min application, just at the lower limit of previous sensitivity estimates. Ongoing experiments in our laboratory appear to place the detection limits for single neuron and network modulation by electric fields near the 100 μV/mm range (our unpublished data). We note that the physics of neuronal polarization under an electric field dictates no real threshold for interaction other than the expected loss of effect at the thermal Johnson noise limit (Adair, 1991).
Our results are not attributable to the stimulus artifact of the applied field masking neuronal activity. First, the stimulus was restricted to frequencies well below 10 Hz. It was therefore easily distinguishable from the higher-frequency signatures used to characterize the neuronal signal for two of the three measures presented, which rely on analysis of field-potential signals >100 Hz. In addition, observation of seizures immediately on release of control, as illustrated in Figure 9A, belies the effect being artifact. The most likely explanation for these observations is that, during control, the network was oscillating between initiating a seizure-event and being suppressed by the controller. When the controller was turned off, the seizure progressed.
This release phenomenon (Fig. 9A) is also interesting in light of other recent results. Although in some models CA3 can activate or sustain seizure-like events (Traynelis and Dingledine, 1988; Borck and Jefferys, 1999), it has been shown experimentally that the burst discharges arising from CA3 can suppress the development of seizure-like events in an in vitro preparation (Barbarosie and Avoli, 1997), and that delivering periodic stimulation in similar frequency ranges as the natural burst discharge rates can similarly suppress such epileptiform events (Bragdon et al., 1992; Jerger and Schiff, 1995; Barbarosie and Avoli, 1997). Evidence is accumulating that neuronal synchronization phenomena in the hippocampus may be limited by the rate of replacement of releasable excitatory transmitter (Staley et al., 1998). Perhaps these observations of stimulus-induced seizure suppression and the release seizures seen in the present experiments when control is abruptly terminated are manifestations of the level of releasable transmitter available in these networks. Control techniques such as those presented here, especially the ability to maintain the network so close to seizure initiation, may be useful tools to probe such basic mechanisms underlying seizure generation.
Another interesting aspect of the release phenomena is the difference in response observed when half-wave-rectified control and full-wave control are applied (Fig. 9B,C). Because we observe seizures much sooner after release with the half-wave-rectified control, we infer that the network stays closer to seizure onset with half-wave-rectified control. A possible interpretation would be that the full-wave control both suppresses and excites the network to confine activity to some intermediate excitation level. Perhaps the excitation aspect of this control helps to keep the network from approaching a preseizure state much in the same way as periodic stimuli (Bragdon et al., 1992; Jerger and Schiff, 1995;Barbarosie and Avoli, 1997).
One hypothesis might be that we have either spread out the seizure activity of the network over longer periods through our intervention or even trapped the network in an excited preseizure state. However, when the average spectral power of the neuronal activity was computed, as in Figure 8C, we reliably found that the average activity level and the variations in activity level were lower than baseline.
We note that the nonrectified control is better suited for use in chronic applications. Because it provides a bipolar field, the net charge transferred between electrodes averages to zero. This prevents long-term polarization of both the stimulation electrodes and the tissue, which would be a problem with the half-wave-rectified application. On the basis of available data, we estimate that biocompatible electrodes based on iridium oxide have the capacity to apply a DC field of 5 mV/mm for 10 sec in neuronal tissue, which would be adequate for the feedback experiments described here.
We note that the electric field modulation seems completely reversible. The field interacts with the cells by polarizing the neurons and is expected to be proportional to the applied field. Therefore, when the field is turned off, this interaction should be zero. Ionic buildup in the tissue may last slightly longer, but this type of polarization is minimized in our current control algorithms, which minimize the long-term average applied field. Our measurements reveal no evidence of significant tissue polarization, and we typically observe that the network dynamics return to their baseline state when control is turned off. Although we have no evidence of functional damage caused by electric field stimulation, a proper evaluation of the safety of this technology will require histological evaluation of tissue after it is subjected to electric field modulation and feedback control for extended periods of time.
These results demonstrate that a novel approach to adaptive seizure control using externally applied electric fields is feasible. By using fields, it is not necessary to impale brain tissue with stimulating electrodes, and this has obvious advantages for minimizing the invasiveness of devices using such technology in applications. The most straightforward way to implement our results would be through nonpolarizing electrodes in the intraventricular, subdural, or epidural spaces. Adapting such technology to geometrically favorable brain (e.g., neocortex and hippocampus) for the suppression of epileptic seizures can be explored in the near future.
The symptoms of dynamical diseases of the brain also include the motor manifestations of Parkinson's disease, and it has been proposed recently that dysrhythmias of neuronal circuitry may help unify some of the diverse symptomatology of other neuronal conditions (Llinás et al., 1999). Our methodology is capable, in principle, of suppressing pathological neuronal activities in conditions other than epilepsy. On the other hand, by using positive feedback, the methodology presented here forms a novel approach to imposing function prosthetically. By sensing the ongoing background activity of neuronal circuitry (Arieli et al., 1996), adaptive electric fields may permit the modulation of network behavior in a more physiological manner than previously possible.
Footnotes
This work was supported by National Institutes of Health Grants 7K02MH01493 and 2R01MH50006 and through a Whitaker Foundation Research Grant. We thank Celia Davis for technical assistance in the preliminary stages of this research, and Joseph Francis and Theoden Netoff for continued assistance throughout this project.
Supplementary Information: A computer demonstration program with real-time samples from the experiments in this paper illustrating feedback seizure control and seizure enhancement is available as Supplementary Information, archived by the authors athttp://www.NeuralDynamics.org/Projects/FeedbackControl2000.
Correspondence should be addressed to Dr. Bruce J. Gluckman, Krasnow Institute, Mail Stop 2A1, George Mason University, Fairfax, VA 22030. E-mail: bgluckma@gmu.edu.
REFERENCES
- 1.Adair R. Constraints on biological effects of weak extremely-low-frequency electromagnetic fields. Phys Rev [A] 1991;43:1039–1048. doi: 10.1103/physreva.43.1039. [DOI] [PubMed] [Google Scholar]
- 2.Arieli A, Sterkin A, Grinvald A, Aertsen A. Dynamics of ongoing activity: explanation of the large variability in evoked cortical responses. Science. 1996;273:1868–1871. doi: 10.1126/science.273.5283.1868. [DOI] [PubMed] [Google Scholar]
- 3.Barbarosie M, Avoli M. CA3-driven hippocampal-entorhinal loop controls rather than sustains in vitro limbic seizures. J Neurosci. 1997;17:9308–9314. doi: 10.1523/JNEUROSCI.17-23-09308.1997. [DOI] [PMC free article] [PubMed] [Google Scholar]
- 4.Bawin SM, Sheppard AR, Mahoney MD, Abu-Assal M, Adey WR. Comparison between the effects of extracellular direct and sinusoidal currents on excitability in hippocampal slices. Brain Res. 1986a;362:350–354. doi: 10.1016/0006-8993(86)90461-0. [DOI] [PubMed] [Google Scholar]
- 5.Bawin SM, Abu-Assal ML, Sheppard AR, Mahoney MD, Adey WR. Long-term effects of sinusoidal extracellular electric fields in penicillin-treated rat hippocampal slices. Brain Res. 1986b;399:194–199. doi: 10.1016/0006-8993(86)90619-0. [DOI] [PubMed] [Google Scholar]
- 6.Belair J, Glass L, an der Heiden U, Milton J. Dynamical disease: mathematical analysis of human illness. American Institute of Physics Press; Woodbury, NY: 1995. [DOI] [PubMed] [Google Scholar]
- 7.Borck C, Jefferys JGR. Seizure-like events in disinhibited ventral slices of adult rat hippocampus. J Neurophysiol. 1999;82:2130–2142. doi: 10.1152/jn.1999.82.5.2130. [DOI] [PubMed] [Google Scholar]
- 8.Bragdon AC, Kojima H, Wilson WA. Suppression of interictal bursting in hippocampus unleashes seizures in entorhinal cortex: a proepileptic effect of lowering [K+]o and raising [Ca2+]o. Brain Res. 1992;590:128–135. doi: 10.1016/0006-8993(92)91088-v. [DOI] [PubMed] [Google Scholar]
- 9.Chan CY, Nicholson C. Modulation by applied electric fields of Purkinje and stellate cell activity in the isolated turtle cerebellum. J Physiol (Lond) 1986;371:89–114. doi: 10.1113/jphysiol.1986.sp015963. [DOI] [PMC free article] [PubMed] [Google Scholar]
- 10.Chan CY, Houndsgaard J, Nicholson C. Effects of electric fields on transmembrane potential and excitability of turtle cerebellar Purkinje cells in vitro. J Physiol (Lond) 1988;402:751–771. doi: 10.1113/jphysiol.1988.sp017232. [DOI] [PMC free article] [PubMed] [Google Scholar]
- 11.Cole KS. Membranes, ions and impulses. University of California; Berkeley, CA: 1972. [Google Scholar]
- 12.Cooper IS, Upton AR. Therapeutic implications of modulation of metabolism and functional activity of cerebral cortex by chronic stimulation of cerebellum and thalamus. Biol Psychiatry. 1985;20:811–813. doi: 10.1016/0006-3223(85)90164-7. [DOI] [PubMed] [Google Scholar]
- 13.Cooper IS, Amin I, Riklan M, Waltz JM, Poon TP. Chronic cerebellar stimulation in epilepsy. Arch Neurol. 1976;33:559–570. doi: 10.1001/archneur.1976.00500080037006. [DOI] [PubMed] [Google Scholar]
- 14.Fisher RS, Uematsu S, Krauss GL, Cysyk BJ, McPherson R, Lesser RP, Gordon B, Schwerdt P, Rise M. Placebo-controlled pilot study of centromedian thalamic stimulation in treatment of intractable seizures. Epilepsia. 1992;33:841–851. doi: 10.1111/j.1528-1157.1992.tb02192.x. [DOI] [PubMed] [Google Scholar]
- 15.Ghai RS, Bikson M, Durand DM. Effects of applied electric fields on low-calcium epileptiform activity in the CA1 region of rat hippocampal slices. J Neurophysiol. 2000;84:274–280. doi: 10.1152/jn.2000.84.1.274. [DOI] [PubMed] [Google Scholar]
- 16.Gluckman BJ, Neel EJ, Netoff TI, Ditto WL, Spano ML, Schiff SJ. Electric field suppression of epileptiform activity in hippocampal slices. J Neurophysiol. 1996a;76:4202–4205. doi: 10.1152/jn.1996.76.6.4202. [DOI] [PubMed] [Google Scholar]
- 17.Gluckman BJ, Netoff TI, Neel EJ, Ditto WL, Spano ML, Schiff SJ. Stochastic resonance in a neuronal network from mammalian brain. Phys Rev Lett. 1996b;77:4098–4101. doi: 10.1103/PhysRevLett.77.4098. [DOI] [PubMed] [Google Scholar]
- 18.Jefferys JGR. Influence of electric fields on the excitability of granule cells in guinea-pig hippocampal slices. J Physiol (Lond) 1981;319:143–152. doi: 10.1113/jphysiol.1981.sp013897. [DOI] [PMC free article] [PubMed] [Google Scholar]
- 19.Jerger K, Schiff SJ. Periodic pacing an in vitro epileptic focus. J Neurophysiol. 1995;73:876–879. doi: 10.1152/jn.1995.73.2.876. [DOI] [PubMed] [Google Scholar]
- 20.Kayyali H, Durand D. Effects of applied currents on epileptiform bursts in vitro. Exp Neurol. 1991;113:249–254. doi: 10.1016/0014-4886(91)90181-b. [DOI] [PubMed] [Google Scholar]
- 21.Lesser RP, Kim SH, Beyderman L, Miglioreti DL, Webber WRS, Bare M, Cysyk B, Krauss G, Gordon B. Brief bursts of pulse stimulation terminate afterdischarges caused by cortical stimulation. Neurology. 1999;53:2073–2081. doi: 10.1212/wnl.53.9.2073. [DOI] [PubMed] [Google Scholar]
- 22.Llinás RR, Ribary U, Jeanmonod D, Kronberg E, Mitra PP. Thalamocortical dysrhythmia: a neurological and neuropsychiatric syndrome characterized by magnetoencephalography. Proc Natl Acad Sci USA. 1999;96:15222–15227. doi: 10.1073/pnas.96.26.15222. [DOI] [PMC free article] [PubMed] [Google Scholar]
- 23.McLachlan RS. Vagus nerve stimulation for intractable epilepsy: a review. J Clin Neurophysiol. 1997;14:358–368. doi: 10.1097/00004691-199709000-00002. [DOI] [PubMed] [Google Scholar]
- 24.Murphy JV, Hornig G, Schallert G. Left vagal nerve stimulation in children with refractory epilepsy. Arch Neurol. 1995;52:886–889. doi: 10.1001/archneur.1995.00540330064016. [DOI] [PubMed] [Google Scholar]
- 25.Nakagawa M, Durand D. Suppression of spontaneous epileptiform activity with applied currents. Brain Res. 1991;567:241–247. doi: 10.1016/0006-8993(91)90801-2. [DOI] [PubMed] [Google Scholar]
- 26.Rushton WAH. The effect upon the threshold for nervous excitation of the length of nerve exposed, and the angle between current and nerve. J Physiol (Lond) 1927;63:357–377. doi: 10.1113/jphysiol.1927.sp002409. [DOI] [PMC free article] [PubMed] [Google Scholar]
- 27.Rutecki PA, Lebeda FJ, Johnston D. Epileptiform activity induced by changes in extracellular potassium in hippocampus. J Neurophysiol. 1985;54:1363–1374. doi: 10.1152/jn.1985.54.5.1363. [DOI] [PubMed] [Google Scholar]
- 28.Schiff SJ, Jerger K, Duong DH, Chang T, Spano ML, Ditto WL. Controlling chaos in the brain. Nature. 1994;370:615–620. doi: 10.1038/370615a0. [DOI] [PubMed] [Google Scholar]
- 29.Schiff SJ, Colella D, Hughes E, Conry J, Creekmore JW, Marshall A, Bozek-Kuzmicki M, Weinstein SL, Benke G, Gaillard WD, Jacyna GM. Brain chirps: spectrographic signatures of epileptic seizures. Clin Neurophysiol. 2000;111:953–958. doi: 10.1016/s1388-2457(00)00259-5. [DOI] [PubMed] [Google Scholar]
- 30.Staley KJ, Longacher M, Bairns JS, Yee A. Presynaptic modulation of CA3 network activity. Nat Neurosci. 1998;1:201–209. doi: 10.1038/651. [DOI] [PubMed] [Google Scholar]
- 31.Terzoulo CA, Bullock TH. Measurement of imposed voltage gradient adequate to modulate neuronal firing. Proc Natl Acad Sci USA. 1956;42:687–694. doi: 10.1073/pnas.42.9.687. [DOI] [PMC free article] [PubMed] [Google Scholar]
- 32.Tranchina D, Nicholson CA. Model for the polarization of neurons by extrinsically applied electric fields. Biophys J. 1986;50:1139–1159. doi: 10.1016/S0006-3495(86)83558-5. [DOI] [PMC free article] [PubMed] [Google Scholar]
- 33.Traynelis SF, Dingledine R. Potassium-induced spontaneous electrographic seizures in the rat hippocampal slice. J Neurophysiol. 1988;59:259–276. doi: 10.1152/jn.1988.59.1.259. [DOI] [PubMed] [Google Scholar]
- 34.Van Buren JM, Wood JH, Oakley J, Hambrecht F. Preliminary evaluation of cerebellar stimulation by double-blind stimulation and biological criteria in the treatment of epilepsy. J Neurosurg. 1978;48:407–416. doi: 10.3171/jns.1978.48.3.0407. [DOI] [PubMed] [Google Scholar]
- 35.Velasco M, Velasco F, Velasco AL, Boleaga B, Jimenez F, Brito F, Marquez I. Subacute electrical stimulation of the hippocampus blocks intractable temporal lobe seizures and paroxysmal EEG activities. Epilepsia. 2000;41:158–169. doi: 10.1111/j.1528-1157.2000.tb00135.x. [DOI] [PubMed] [Google Scholar]
- 36.Wadman WJ, Juta AJ, Kamphuis W, Somjen GG. Current source density of sustained potential shifts associated with electrographic seizures and with spreading depression in rat hippocampus. Brain Res. 1992;570:85–91. doi: 10.1016/0006-8993(92)90567-s. [DOI] [PubMed] [Google Scholar]
- 37.Warren RJ, Durand D. Effects of applied currents on spontaneous epileptiform activity induced by low calcium in the rat hippocampus. Brain Res. 1998;806:186–195. doi: 10.1016/s0006-8993(98)00723-9. [DOI] [PubMed] [Google Scholar]