Abstract
The deconvolution method has been used in the past to estimate release rates of synaptic vesicles, but it cannot be applied to synapses where nonlinear interactions of quanta occur. We have extended this method to take into account a nonlinear current component resulting from the delayed clearance of glutamate from the synaptic cleft. We applied it to the calyx of Held and verified the important assumption of constant miniature EPSC (mEPSC) size by combining deconvolution with a variant of nonstationary fluctuation analysis. We found that amplitudes of mEPSCs decreased strongly after extended synaptic activity. Cyclothiazide (CTZ), an inhibitor of glutamate receptor desensitization, eliminated this reduction, suggesting that postsynaptic receptor desensitization occurs during strong synaptic activity at the calyx of Held. Constant mEPSC sizes could be obtained in the presence of CTZ and kynurenic acid (Kyn), a low-affinity blocker of AMPA-receptor channels. CTZ and Kyn prevented postsynaptic receptor desensitization and saturation and also minimized voltage-clamp errors. Therefore, we conclude that in the presence of these drugs, release rates at the calyx of Held can be reliably estimated over a wide range of conditions. Moreover, the method presented should provide a convenient way to study the kinetics of transmitter release at other synapses.
Keywords: synaptic transmission, exocytosis, deconvolution, noise analysis, calyx of Held, desensitization
Quantitative analysis of the kinetics of transmitter release is essential for elucidating the mechanisms underlying synaptic vesicle fusion. Several methods have been developed in the past to estimate the kinetics of transmitter release from postsynaptic currents (PSCs). One useful method is to directly count the number of quanta (Katz and Miledi, 1965; Barrett and Stevens, 1972a,1972b; Issacson and Walmsley, 1995; Stevens and Wang, 1995;Borst and Sakmann, 1996). Unfortunately, this method can be used only when release rates are low. Another method involves deconvolution of the PSC with the miniature PSC (mPSC) (van der Kloot, 1988a, 1988b; Aumann and Parnas, 1991;Borges et al., 1995; Diamond and Jahr, 1995; Vorobieva et al., 1999). This method assumes that the postsynaptic current consists of a linear summation of quanta, an assumption that was experimentally verified at the neuromuscular junction (Hartzell et al., 1975;Magleby and Pallotta, 1981).
Recent studies, however, have shown that postsynaptic currents are not only shaped by the kinetics of transmitter release but are also influenced by desensitization (Trussell et al., 1993;Otis et al., 1996b) and saturation (Clements et al., 1992; Jonas et al., 1993; Tang et al., 1994) of the postsynaptic receptors. Additionally, delayed clearance of transmitter from the synaptic cleft (Barbour et al., 1994; Mennerick and Zorumski, 1995;Otis et al., 1996a) and also asynchronous quantal release (Borges et al., 1995) can cause a slow residual current. These factors must be carefully taken into account when estimating quantal release rates from postsynaptic currents.
For these reasons, the simple deconvolution method may not be an adequate tool to analyze quantal release at the calyx of Held, a giant glutamergic synapse in the rat auditory brainstem (Forsythe, 1994). Specifically, GluR-D AMPA receptor subunits with flop splice variants are expressed in the postsynaptic principal neurons. This receptor type shows strong desensitization with fast time constants (1 msec) (Geiger et al., 1995). Furthermore, EPSCs seem to be shaped at least partially by the delayed clearance of glutamate, especially when desensitization of the postsynaptic receptors is inhibited by cyclothiazide (CTZ) (Schneggenburger et al., 1999; Wu and Borst, 1999).
Therefore, to apply the deconvolution method to the calyx of Held, we first needed to estimate the size of the residual current component attributable to the delayed clearance of glutamate. We did this by developing a simple model of glutamate diffusion and then incorporated this model into the deconvolution algorithm. We then needed to verify that the mEPSC amplitudes were constant. For this purpose, we applied nonstationary noise analysis to estimate the quantal size (Haller et al., 1998; Silver et al., 1998; Oleskevich et al., 2000). We found that postsynaptic receptors were desensitized strongly during strong synaptic activity. CTZ inhibited this desensitization. However, without desensitization, postsynaptic AMPA receptors were more readily saturated, and large currents caused serious voltage-clamp errors. The additional application of kynurenic acid (Kyn), a low-affinity competitive inhibitor of glutamate receptors, reduced the size of the EPSC and prevented clamping problems, even after a strong bout of exocytosis. Variance analysis confirmed that the size of the mEPSC was constant in the presence of these two drugs. Thus, we conclude that the deconvolution method works most reliably in the presence of CTZ and Kyn.
MATERIALS AND METHODS
Deconvolution. Deconvolution has been used in a number of studies to calculate release rates, ξ(t), from the measured postsynaptic current, I(t) (Cohen et al., 1981; van der Kloot, 1988a; Aumann and Parnas, 1991). Thismethod assumes that I(t) is a linear combination of elementary signals, h·F(t), given by:
| Equation 1 |
Here, the notation of Segal et al. (1985) has been used, in which the elementary event (the mEPSC) is written as a product of an amplitude, h, and a time function, F(t). The latter is normalized to a peak amplitude of 1. As discussed above, the basic assumption of the deconvolution method (constant mEPSC amplitudes) may not be valid at the calyx of Held synapse, where glutamate is likely to build up during prolonged stimulation. In another calyx-type synapse, asynchronous current generated by such “residual glutamate” has been documented (Otis et al., 1996a). We call such current “residual current” and expect it to be particularly prominent in the presence of CTZ. As we show below, such current was observed experimentally and most likely was not mediated by asynchronous transmitter release, because there was very little associated noise. Also, the proportion of the residual current increased as the rate of exocytosis increased. These findings are consistent with reports from other experiments (Trussell et al., 1993; Mennerick and Zorumski, 1995).
Therefore, we assumed that the residual current, Ir(t), is mediated by residual glutamate in the synaptic cleft and that it can be described by a power function of the residual glutamate concentration Cr(t), according to:
| Equation 2 |
where β (the weighing factor) and n (the exponent of the power law of glutamate channel activation) are two model parameters. We formulate the residual glutamate concentration, Cr(t), based on past release, as:
| Equation 3 |
Here, c(t) is a simple diffusion type kernel (Crank, 1975) with an exponent nD, a mean diffusional distance rD, and a diffusion coefficient D given by:
| Equation 4 |
This form of the kernel can be rationalized, if we assume the glutamate contribution of a given release event to consist of two parts: first, the contribution to the local active zone, which results in the mEPSC elicited by the event, and second, the effect at all other active zones, which results in Ir(t). To calculate the mean contribution of a given event to Cr(t) at some time t after the event, we have to integrate the concentration profile created by this event over the whole synapse except for the local active zone. (More precisely, we would have to sum up the contributions from all active zones except for the local one.) If we assume (for simplicity) that the diffusion takes place in a planar infinite synaptic cleft with impermeable walls and integrate the solution for an instantaneous point source within such a structure over the whole cleft except for a central disc with radius rD, we obtain Equation4 with nD = 0. If we do the same calculation for diffusion into an open semi-infinite space (i.e., assuming that the presynaptic compartment does not present a significant barrier for diffusion orthogonal to the postsynaptic surface), the solution is Equation 4 with nD = 0.5. The decay of the residual glutamate may be even faster, if active glutamate uptake mechanisms contribute significantly. This would result in apparent nD >0.5. Because we do not know the exact geometry and the contribution of glutamate uptake mechanisms, we consider nD, as well as rD, D (Eq. 4) and the parameters β and n of Equation 2 as free parameters, which must be determined empirically from fits to the data (see below). Unless n is equal to 1, the total current will be a nonlinear function of the release process. This will prohibit ordinary deconvolution. We therefore split the total current I(t) into a sum of residual current and current induced by direct release. We assume that Equation 1 adequately describes the current induced by direct release and thus calculate the total current to be:
| Equation 5 |
A complication in this approach may be seen in the fact that both the convolution integral in Equation 5 and Ir(t) (which itself contains a convolution integral) depend on ξ(t), which is the function to be found by deconvolution. However, the diffusional kernel in Equation 3 is a function rising from zero with some delay. At any new time point, t, the integral (Eq. 3) can be readily calculated from values of ξ(t′) where t′ < t. This observation suggests a simple way to deconvolve the following function point-by-point:
| Equation 6 |
Cohen et al. (1981) showed previously that a signal y(t), composed of simple exponentially decaying mEPSCs, can be deconvolved by calculating:
| Equation 7 |
where τ is the decay time constant of the mEPSC and the subscript m denotes the assumption of a monoexponential decay. This equation is valid for instantaneously rising mEPSCs. It can be derived and generalized to the case of double exponentially decaying mEPSCs as shown in Appendix , where the numerical algorithm of deconvolution used in this work is explained in detail.
To estimate the release rate, ξ(t), parameters of the glutamate diffusion model, h, and F(t) must be known. F(t) was obtained by sampling mEPSCs in the presence of 100 μm CTZ. In four cells, the mean amplitude of the mEPSC was 29.8 ± 2.03 pA (mean ± SEM). The decay phase of the mEPSC could be fit by two exponentials with time constants of 2.38 ± 0.59 msec (relative amplitude 48.7 ± 4.8%) and 11.43 ± 1.99 msec. The time course of mEPSCs, especially during the slow decay phase, was highly variable among mEPSCs (Wu and Borst, 1999; our unpublished observations). For deconvolution, we assumed that mEPSCs decayed either biexponentially with time constants similar to those observed or monoexponentially with a time constant of 2–3 msec. In the latter case, the slow decay of the mEPSC was considered to be part of the residual current. Then, the parameter rD in Equation 4 had to be selected smaller, and the contribution of the residual current to the total current was larger than in the former case. Very similar estimates of the release rates were obtained for both the experimental data (as shown in Results) and simulations (E. Neher, unpublished observations) regardless of the assumption applied. In the absence of CTZ, we assumed that the mEPSC had a mean amplitude of 30 pA and decayed monoexponentially with a time constant of ∼1 msec. These settings were similar to experimental findings of Borst and Sakmann (1996) and Schneggenburger et al. (1999). In the presence of CTZ and Kyn (1 mm), we were not able to sample mEPSCs, because they were too small to be detected reliably. Therefore, we assumed that mEPSC amplitudes in the presence of Kyn decreased by the same factor as EPSC amplitudes. We determined this factor to be 0.50 ± 0.01 (n = 4 cell pairs) but found that the macroscopic EPSCs decayed slightly faster in the presence of Kyn.
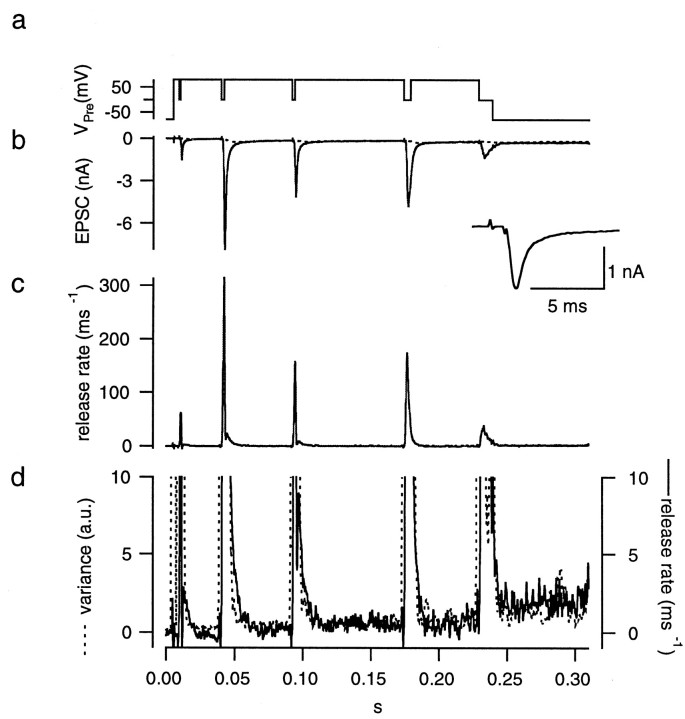
Parameters of the glutamate diffusion model were determined as follows (see Figs. 6, 9, 12, 15). We depolarized the presynaptic terminal for 4 msec to +80 mV, where there was almost no Ca2+influx. Then, the terminal was repolarized to 0 mV for several short periods (1–5 msec) to elicit several episodes of transient Ca2+ influx into the presynaptic terminal. By changing the duration of the pulses, EPSCs of various amplitudes and durations could be evoked. We will refer to this protocol as “fitting protocol” and the corresponding EPSC as “fitting EPSC.” EPSCs, evoked by current inflow, decayed rapidly each time the terminal voltage was returned to +80 mV. Variance analysis (see below) indicated that there was very little release during pauses between the influx episodes such that current between depolarizing episodes can be considered as a sum of the decaying mEPSCs (from the immediately preceding release) and the residual current. Once mEPSCs have decayed, the remaining measured postsynaptic current is residual current and can be used for the fitting procedure.
Fig. 6.
Protocol for setting the parameters of the glutamate diffusion model (the “fitting protocol”). The presynaptic terminal was depolarized from −80 mV to +80 mV (a). The presynaptic holding potential was repetitively repolarized to 0 mV several times for short periods (1–5 msec) to evoke EPSCs (b) rapidly. At the end of the protocol, the terminal was held at 0 mV for 10 msec to completely deplete the RRP of synaptic vesicles. The inset shows the EPSC evoked by the first stimulus. Parameters of the glutamate diffusion model were set such that the decay phases of the EPSCs could be explained by the residual current (b, dotted line). After subtracting the residual current component from the total postsynaptic current, the release rate (c) was calculated by deconvolving the remaining current with the mEPSC. Variance (d, dotted line) was calculated after bandpass filtering the postsynaptic current and smoothed by a gliding window of 3 msec. It is superimposed on the plot of the release rate (d, solid line). Axes of both traces were adjusted such that traces are expected to superimpose for h′ = 1 rel.u.
Fig. 9.
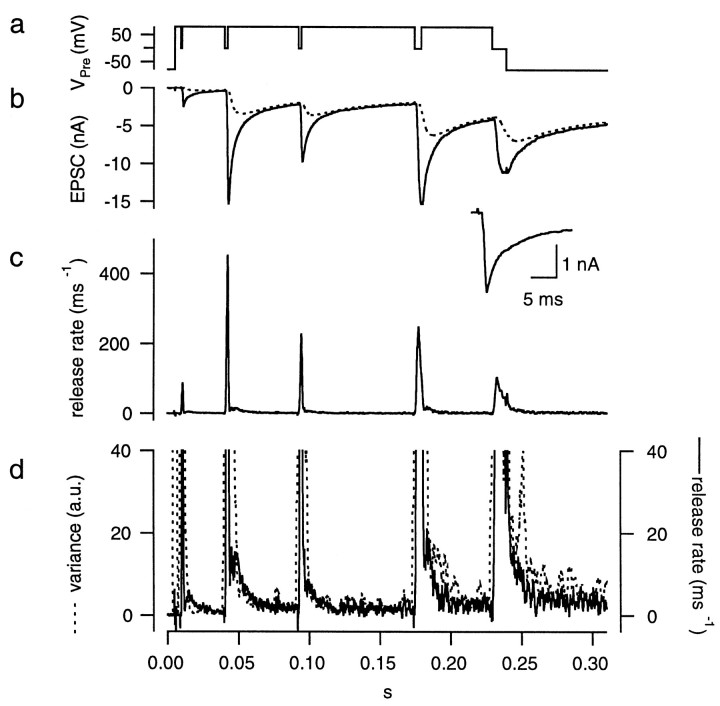
Protocol used for setting parameters of the glutamate diffusion model in the presence of CTZ. The protocols and calculations were performed as described in Figure 6 except that 100 μm CTZ was present. A monoexponential decay was assumed for the mEPSC.
Fig. 12.
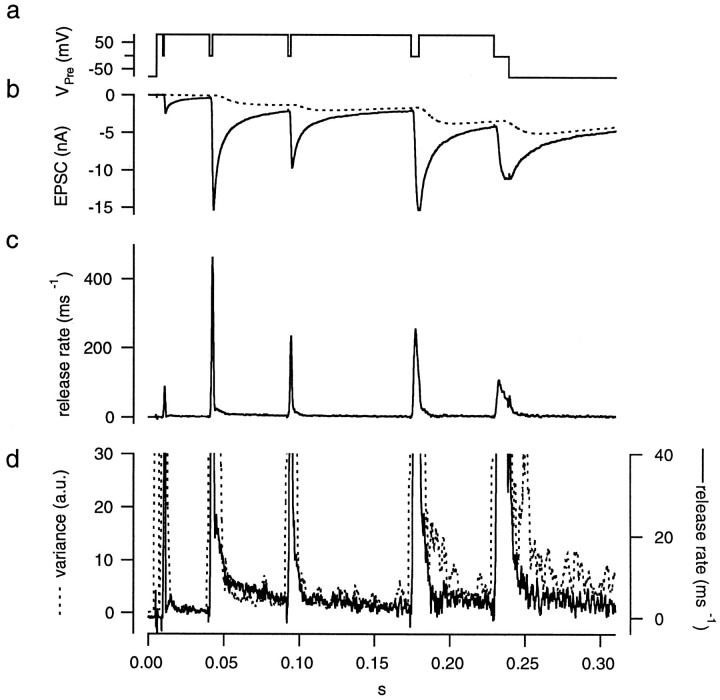
Protocol used for setting the parameters of the glutamate diffusion model, assuming a biexponential decay of the mEPSC. The protocols and calculations are as described in Figure 6 using the cell pair shown in Figure 9. Decay time constants of the mEPSC were 3 msec (50% of the total) and 10 msec.
Fig. 15.
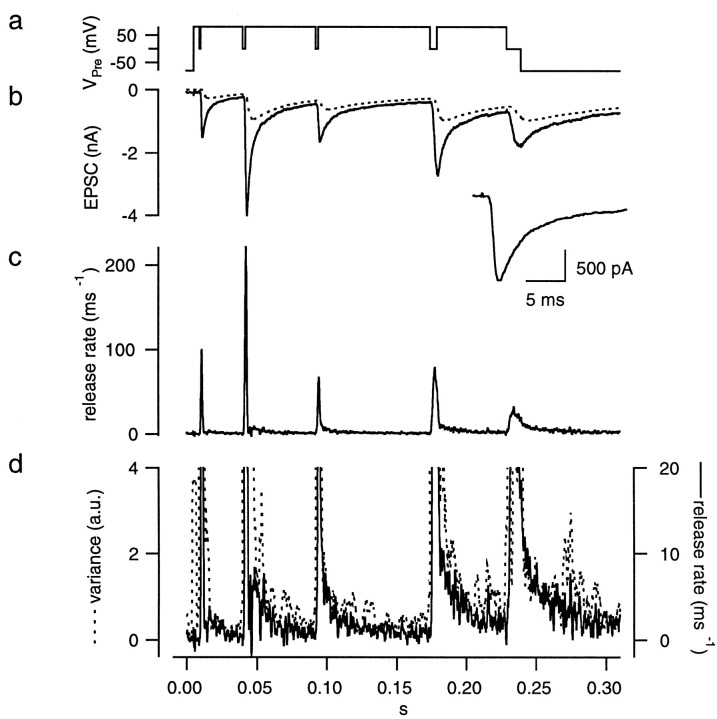
Protocol for setting parameters of the glutamate diffusion model in the presence of CTZ and Kyn. The protocols and calculations were performed in the presence of 100 μm CTZ and 1 mm Kyn as described in Figure 6. For the plots of release rates in c, we assumed that Kyn decreased mEPSCs amplitudes to 50% and therefore scaled the values by a factor of 2. Such a correction was not applied to traces of release rate, other than those under Kyn.
We designed the fitting protocol so that different sections of the resulting postsynaptic current are particularly sensitive to one or the other parameters of the model. Thus, the first episode of Ca2+ current inflow was chosen to be very short, such that the resulting EPSC resembled a scaled version of a mEPSC. This allowed a confirmation or fine adjustment of the mEPSC decay time constant(s) by the criterion that the deconvolution rate should return to zero immediately after the stimulus. The residual current was small after the first pulse, because of its nonlinear nature. The next stimulation episode was chosen to be larger, such that it elicited larger currents and also a sizeable residual current (at least in the presence of CTZ; see Fig. 9b). A good fit to the EPSC decay after this episode depended critically on the setting of rD (Eq. 4), which determines the speed of the rise of Ir(t). The late decay that follows subsequent strong stimuli was used to adjust the remaining parameters. In practice, we performed deconvolutions of a given fitting EPSC repetitively starting with a complete trial set of parameters (including those of the mEPSC). We judged the quality of fits from a display of Ir and from the outcome of the resulting deconvolution rate ξ(t) and applied corrections to parameters by trial and error to optimize the fit. The criterion for optimization was that ξ(t) should be close to zero between stimulation episodes. Whenever the variance between release episodes was larger than that of expected AMPA-channel noise, the fitting target for ξ(t) was adjusted to match the release rate expected for the extra noise (see below). This procedure will be detailed by the examples presented in Results.
Once parameters had been determined for a given synapse, the same parameters were used for other traces within the same cell pair. When using monoexponential mEPSCs, typical parameters of the glutamate diffusion model were n (the exponent of the power law of glutamate channel activation) = 1.2, rD(the diffusion distance) = 0.8 μm, nD(the exponent of the diffusion law) = 0.8–0.9, and D (the diffusion coefficient of the transmitter) = 30 μm2/sec.
Of course, this model is very simplified. For example, the power law of channel activation might be influenced not only by the kinetics of glutamate receptors but also by the densities and locations of receptors at postsynaptic membranes. The synapse, in reality, has complicated geometrical arrangements of release sites and postsynaptic receptors, and the resulting structures may differ among active zones (Walmsley et al., 1998). However, as described below, this simple model fits quite well a wide range of EPSCs. The fitting procedure might be readily extended to cover an even wider range of EPSCs, by modeling a full dose–response curve of AMPA receptors. However, we chose not to increase the number of parameters at the present time and chose to explore the range of conditions under which the above formulation is valid.
Noise analysis. To verify the new form of deconvolution (Eq.6) and to test mEPSCs amplitudes under the experimental conditions examined, noise analysis was introduced. Because it is very difficult to achieve a stationary state, especially during the EPSC, simple stationary noise analysis (Katz and Miledi, 1972) could not be applied. Thus, we had to extend variance analysis to the nonstationary case. Ensemble noise analysis is a useful method for analyzing nonstationary data (Sigworth, 1980) and has already been applied to the analysis of the transmitter release process (Silver et al., 1998; Oleskevich et al., 2000). This method, however, requires a large number of traces with very similar statistical properties. Unfortunately, obtaining such data is difficult in the case of paired recordings at the calyx of Held, because series resistances of both the presynaptic and postsynaptic recordings usually deteriorate during experiments. For this reason, we modified nonstationary variance analysis such that it requires a reduced number of traces. This method can also be viewed as an extension of the analysis used by Haller et al. (1998).
Assuming that the observed EPSC, I(t), is a stationary process that consists of a linear summation of uniformly sized mEPSCs, F(t), with an amplitude of h and rate ξ(t), we obtain the mean EPSC, I, from Campbell's theorem (Rice, 1944; Segal et al., 1985):
| Equation 8 |
where 〈ξ(t)〉 is the mean rate. Its variance, var, is given by:
| Equation 9 |
if the duration of the mEPSC is short relative to the analysis interval. Then, the value obtained by dividing the variance by the mean current should be proportional to the square of the averaged amplitude of the mEPSC (Katz and Miledi, 1972; Haller et al., 1998).
In the nonstationary case, the expectation value of the power spectral density S(f) can be expressed as (Rice, 1944):
| Equation 10 |
where n(t) is the number of release-ready vesicles,F̃(f) is the Fourier transform of the mEPSC,p̃(f) is the Fourier transform of the probability function p(t), which together with n(t) is defined so that n(t)p(t) is the mean number of occurrences of the mEPSC between the time interval of t and t + Δt. This equation shows that S(f) is affected by both p̃(f) and F̃(f). However, this Equation also shows that S(f) can be dominated byF̃(f) within a certain frequency range in whichp̃(f) makes only a small contribution. This situation can be achieved by controlling the presynaptic holding potential and adjusting it such that release rate changes slowly compared with the time course of the mEPSC. Then, S(f) is proportional to the mean rate of occurrence of events. By choosing an appropriate spectral window, information on the relative size of the mEPSC can be obtained by taking the ratio of S(f) (or variance within that spectral window) over the release rate, in analogy to Equations 9 and 10. The high-pass filtering applied in this analysis eliminates trends and other nonstationarities, and it has the additional advantage of shortening the underlying elementary event, satisfying a prerequisite of Campbell's theorem. Furthermore, narrowing the width of the elementary event compared with the averaging interval improves the signal-to-noise ratio of the variance estimate (see below). Instrumental and AMPA-receptor channel noise dominate at higher frequencies compared with the contribution from quantal release. The signal was therefore low-pass-filtered to reduce the noise not directly associated with quantal release.
In this study, differentiation was used to high-pass filter the signals because this method can be easily implemented in the Igor program (Wavemetrics, Lake Oswego, OR), and it yields coefficients of variation (CV) of the variance estimates that compare favorably with other filter methods tested (our unpublished observations). The CV of variance is also influenced by the amplitude distribution of the mEPSCs (Katz and Miledi, 1972) and, in principle, can be improved by averaging over data stretches as long as possible. Unfortunately, the amplitude distribution of mEPSCs is relatively broad at the calyx of Held (Schneggenburger et al., 1999). The relationship between the sampling length and the CV of variance was examined by simulations and is shown in Results. For low-pass filtering, the “box-smooth function” of Igor with a window of 0.3 msec was used. Finally, variance was calculated and smoothed by using a gliding window of 3 msec length. In experiments, we repeated a given protocol 5–10 times and averaged the variance records. Alternatively, consecutive traces were subtracted from one another before filtering. This subtraction was done to eliminate long-term trends (Sigworth, 1980,1981), if necessary. Variance values were divided by 2 in such cases to account for the subtraction procedure.
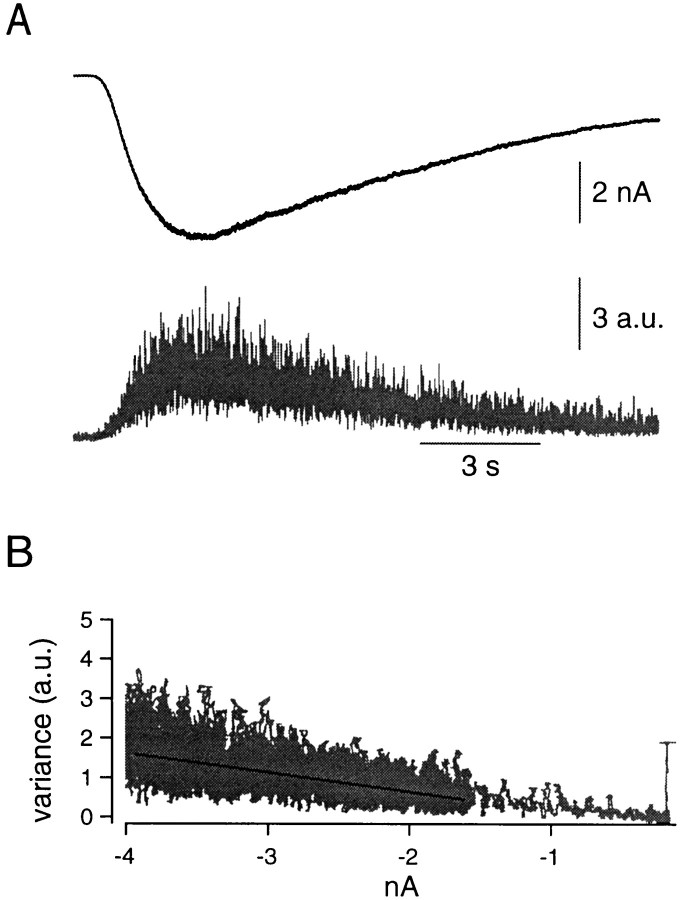
Current fluctuations are caused not only by quantal release but also by AMPA-receptor channel noise. To estimate this noise, the postsynaptic cell was voltage-clamped at −80 mV. In the presence of CTZ (100 μm), S-AMPA (100 μm) was applied locally from a glass pipette (Fig. 1). The AMPA-evoked current was bandpass-filtered using the same filtering protocol (high-pass filtering by differentiation followed by low-pass filtering) as used for noise analysis. Then, variance was calculated and smoothed by a gliding window. Variance was plotted against the mean of the unfiltered current (Fig. 1B). The slope of a linear fit was estimated by linear regression and should be a measure of the amplitude of the filtered waveform of single-channel currents. We will call this an effective single-channel current amplitude i′. To correct for the variance arising from channel noise, Vc, we assumed that channel noise and mEPSC-induced noise are statistically independent. Therefore, the contribution of Vc was calculated by forming the product of the EPSC and the apparent single-channel current and simply subtracting this value from the total variance. Of course, this calculation is simplified, especially considering that the kinetics of AMPA receptors is most likely much more complex (Jonas et al., 1993; Rosenmund et al., 1998). However, this effective channel amplitude was found to adequately explain the variance associated with the late decay phase of EPSCs, where there is very little quantal release. It may be argued that channel variance contributed by mEPSCs is already represented in the amplitude distribution of mEPSCs and therefore should not be subtracted. If this were the case, an appropriate correction for Vcwould be to subtract the product of i′ and Ir(t). However, simulations demonstrated (our unpublished observations) that the difference between the two options is small and that the correction applied here yields results that are indistinguishable (at the given level of resolution) from the correct one.
Fig. 1.
Estimation of the AMPA-receptor channel noise. A, The postsynaptic principal neuron was whole-cell-clamped at −80 mV. Extracellular solution contained CTZ (100 μm), and S-AMPA (100 μm) was applied to the cell locally by a puffer pipette, and the induced current was recorded (top). After bandpass filtering, we calculated the variance and smoothed it by a gliding window (bottom). B, Variance was plotted against the amplitude of the (unfiltered) AMPA-induced current. From this relationship, an apparent single-channel AMPA current was estimated by linear regression. See Figure 2 for the definition of variance units.
To estimate the mEPSC size, the variance after correcting for Vc was divided by the release rate that had been estimated by deconvolution. Because the variance is proportional to the release rate and to the square of the mEPSC size (Eq. 9), this ratio should be proportional to the square of the mEPSC size. However, it is seen from Equation 7 that the release rate ξ is itself a function of the mEPSC amplitude. Thus we have to combine Equations 9 and 7, to see that:
| Equation 11 |
where ξ"(t) is the product of h and ξ(t), which is the immediate output of the deconvolution routine (see Appendix and Eq. 7). We will refer to this ratio as the mEPSC size estimated from variance and mean rate. However, because the data have been filtered, this estimate does not represent the actual amplitude of the mEPSCs (h in Eqs. 8 and 9) but rather a filtered version, the amplitude of which we designate h′. We established the relationship between h and h′ by performing simulations under conditions identical to those used experimentally. For simplicity, the simulated value of h′ was defined to be equal to 1 relative amplitude unit (rel.u.). We therefore divided the experimentally obtained values of h′ by the value obtained from simulations to obtain the values of the experimental h′ in terms of rel.u.
When estimating relative errors in this analysis, one has to appreciate that h′ is a ratio and that relative errors in both the numerator (variance) and denominator (rate) may contribute additively to the total relative errors. Systematic errors in variance may originate from erroneous estimation of channel variance, such as from an incorrect estimate of i′. Another important source of error relates to series resistance. Any series resistance error will be very serious because it contributes to the variance estimate according to its square and will strongly attenuate high-frequency components of the signal. We found that Rs > 8 MΩ cannot be tolerated, even if series resistance compensation is applied. Systematic errors in rate (as estimated from deconvolution) are most likely to originate from y/τ in Equation 7. Two cases should then be distinguished. For sections of records in which ‖dy/dt‖ > ‖y/τ‖, the relative error is given by (Δy/τ)/(dy/dt), where Δy is the systematic error in the current (as it appears in Eq. 6) that might result from inaccurate estimation of Ir(t). This error should be relatively small [given ‖dy/dt‖ > ‖y/τ‖ and that Ir(t) changes with some delay and more slowly than y(t)]. However, for more or less stationary records (‖dy/dt‖ ≤ ‖y/τ‖), the relative error is given by Δy/y, which means that the estimate of ξ cannot be more accurate in relative terms than the error in y, which again is sensitive to inaccuracies of Ir(t). We will discuss examples, in which such an error is critical, in Results.
Physiological recordings. Presynaptic and postsynaptic recordings at the calyx of Held were performed in the slice preparation of the rat brainstem following the procedures described by Borst et al. (1995) and Schneggenburger et al. (1999). Briefly, 8- to 10-d-old Wistar rats were decapitated without anesthesia according to local guidelines. The brainstem was immersed in ice-cold, low-calcium saline that contained (in mm): NaCl 125, KCl 2.5, CaCl2 0.1, MgCl2 3, glucose 25, NaHCO3 1.25, ascorbic acid 0.4, myo-inositol 3, and Na-pyruvate 2, pH 7.3–7.4, 320 mOsm, and was bubbled with 95% O2 and 5% CO2. Transverse slices of the brainstem (150–200 μm thick) were cut using a vibratome. Slices were incubated in the chamber for at least 30 min at 36°C in normal extracellular solution while being continuously bubbled with 95% O2 and 5% CO2. Normal extracellular solution was the same as the low-Ca2+ saline except that 2.0 mm CaCl2 and 1.0 mmMgCl2 were used. Experiments were performed within 5 h after preparation of the slices.
All recordings were done at room temperature (∼21–24°C). The slice was transferred to the recording chamber and perfused continuously with the normal saline at a rate of ∼1 ml/min. Slices were visualized by IR-DIC microscopy through a 40× water immersion objective on an upright microscope (Axoscope, Zeiss, Oberkochen, Germany). A single, large, calyx-type terminal and a postsynaptic principal neuron of the medial nucleus of the trapezoid body were identified visually.
A presynaptic terminal and a postsynaptic target were simultaneously clamped with patch pipettes. Both holding potentials were −80 mV. No correction for liquid junction potentials was applied. EPSCs reversed close to +10 mV (nominally), and the driving force for the postsynaptic current was 90 mV. The presynaptic pipette (4–7 MΩ) was filled with a solution containing (in mm): Cs-gluconate 125–130, TEACl 20, HEPES 10, Na2 phosphocreatine 5, MgATP 4, GTP 0.3, EGTA 0.5, pH 7.2 with CsOH, 310 mOsm. The postsynaptic pipette (2–4 MΩ) was filled with the same solution as the presynaptic pipette except that the concentration of EGTA was increased to 5 mm.
During recordings, 0.5–1 μm TTX, 10 mmTEACl, and 50 μm D-AP5 were added to the normal extracellular solution to isolate the presynaptic calcium current and block NMDA receptors. AMPA receptor-mediated EPSCs were used to monitor quantal release. Bicuculline (10 μm) and strychnine (2 μm) were also added in some recordings to block the possible inhibitory input. In some experiments, 1 mm Kyn was also added. TTX was purchased from Alamone Labs (Jerusalem, Israel). D-AP5, NBQX, CTZ, and Kyn were from Tocris (Köln, Germany). Other drugs were from Sigma (Deisenhofen, Germany).
Both presynaptic and postsynaptic cells were whole-cell-clamped with an EPC9/2 amplifier controlled by the Pulse program (HEKA-Electronik, Lambrecht, Germany). Thirty to seventy percent of the presynaptic series resistance (Rs; 8–35 MΩ, typically 15 MΩ) was compensated. Presynaptic leak currents of >200 pA typically caused run-down of the postsynaptic response, and cells showing such leak were excluded from analysis. The postsynaptic series resistance (3–10 MΩ, typically 5 MΩ) was compensated so that the uncompensated series resistance was ∼2–3 MΩ. The remaining deviation from holding potential (= Rs × IEPSC) was calculated off-line, and EPSC amplitudes were corrected by multiplying by V/(V − Rs· IEPSC). Postsynaptic leak currents were typically between 50 and 100 pA. Currents were low-pass-filtered at 2.9 or 6 kHz and stored at 10 or 20 kHz. Recordings were discontinued once the uncompensated postsynaptic Rs became >10 MΩ or the postsynaptic leak current became >300 pA. Most of the data that had uncompensated postsynaptic series resistances of >8 MΩ were rejected from analysis because such traces had reduced noise power density at higher frequencies.
RESULTS
Calibration of the mEPSC size estimate of noise analysis (simulation)
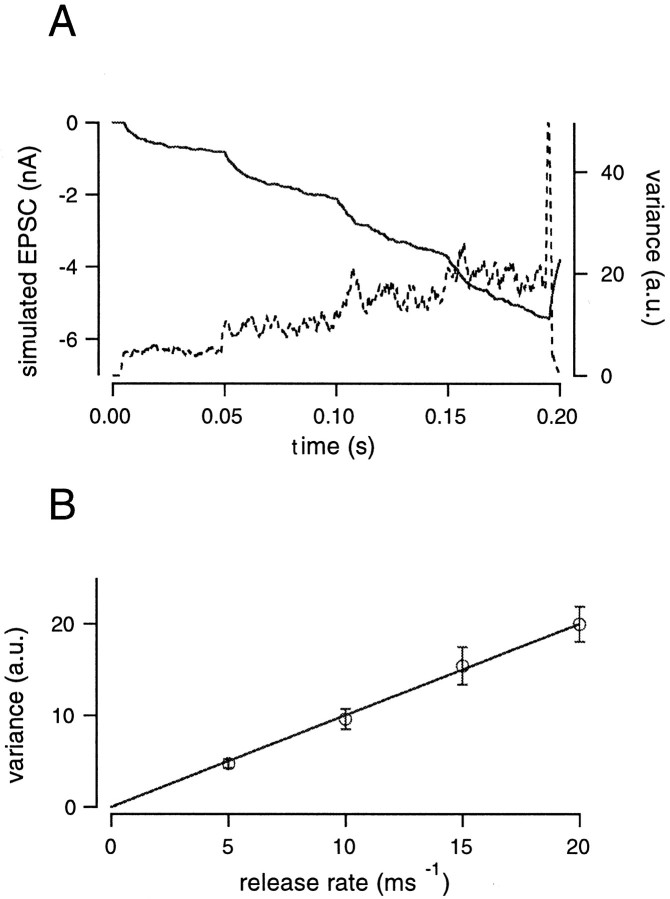
Our method assumes that the variance of the filtered records is proportional to the release rate and insignificantly affected by the residual current (apart from channel variance Vc). As described in Materials and Methods, h′, our estimate for mEPSC amplitude, should be independent of the release rate, provided that adequate filters are used to remove nonstationarities. However, h′ does not directly correspond to h. Therefore, we established the relationship between h′ and h using a set of simulations described in Figure 2. Specifically, the release rate was changed from 0 to 5 msec−1, then to 10, 15, and finally to 20 msec−1. EPSCs were simulated by convolving this release rate with the mEPSC using the Monte-Carlo method. The mEPSC used for the simulation had a rise time of 200 μsec and decayed monoexponentially with a time constant of 3 msec. The amplitude distribution of mEPSCs (with a mean amplitude of 30 pA) was obtained from postsynaptic recordings (see Materials and Methods). During simulations, mEPSC amplitudes were randomly selected according to the experimental amplitude distribution. After the EPSC was generated, the residual current caused by the delayed clearance of glutamate from the synaptic cleft was added. This residual current was generated using the glutamate diffusion model according to Equations 2-5. To mimic experimental data, we used parameters of the glutamate diffusion model, which were similar to those used for fitting the experimental data. The proportion of the residual current relative to the total EPSC was adjusted so that it was similar to that observed in experiments. Twenty-five traces were simulated and filtered, and the variance was calculated for each record and then averaged (Fig.2A). The relationship between the variance and release rates was plotted (Fig. 2B) and could be fit with a straight line passing through the origin. A linear relationship is expected according to Equation 9. We scaled the variance, such that the slope of the fit, or else the variance at a rate of one event per millisecond, was equal to 1, and we designate this value as the arbitrary unit (a.u.) of variance. All plots of variance in this study are given in these units. It should be noted that this simulation did not include channel variance. Therefore, no correction regarding channel variance was performed in the simulations, contrary to the case of actual recordings.
Fig. 2.
Relationship between variance and release rate derived from simulations. A, The release rate was changed from 0 to 5, 10, 15, and finally 20 msec−1. For simulations, mEPSCs amplitudes were randomly chosen from an amplitude distribution of mEPSCs, obtained experimentally, and superimposed. The residual current caused by the delayed clearance of glutamate was added to the simulated EPSCs. The resulting current is shown as a solid line. Parameters of the diffusion model used to calculate the residual current were n = 1.2, rd = 0.8 μm, nD = 0.8, D = 30 μm2/sec. Variance (dotted line) was smoothed by a gliding window (3 msec) in each simulated trace and was then averaged over 25 traces. The large spike of variance observed at the end of the record was caused by a rapid drop in the release rate from 20 to 0 msec−1. B, The relationship between variance and the release rate was plotted (error bars indicate SD obtained from 25 repetitions of the protocol). Variance was scaled such that the regression line in this plot has a slope of 1 a.u. per one event per millisecond. All variance values of this study were normalized with this same scaling factor (see Results).
Robustness of nonstationary noise analysis under various conditions
Next we examined whether the noise analysis performed after optimal filtering of the signal is robust to various kinds of perturbations that potentially introduce nonstationarities. In these simulations, the release rate was stepped from 0 to 5 msec−1 then 15 and 5, and finally back to 0 msec−1 (Fig.3A). The parameters of the glutamate diffusion model were set as described in Figure 2. Twenty traces were simulated, and the variance was calculated for each record over segments of 3 msec length and then averaged. Even when the release rate was constant, the simulated EPSC traces changed gradually, because a residual current was present as a result of previous exocytosis. EPSCs changed more abruptly during sudden changes of the release rate (Fig. 3A). Mean variance of filtered records, however, stayed constant during episodes of constant release; its fluctuations were ∼10% of the mean value. Variance fluctuations remained fairly low even when the release rate changed abruptly by 5 msec−1 (Fig. 3A). When the release rate was increased from 5 to 15 msec−1 (or the reverse), a spike in the variance fluctuation occurred. However, the amplitude of the spike was only 20–30% of the mean value. More importantly, when the release rate was 5 msec−1, variance was 5.2 a.u. (corresponding to h′ = 1.04 rel.u.). When release rate was 20 msec−1, variance was 19.4 a.u. (corresponding to h′ = 0.97 rel.u.). Thus, h′ was relatively independent of quantal release rates, which suggests that bandpass filtering and subsequent averaging effectively eliminated nonstationarities.
Fig. 3.
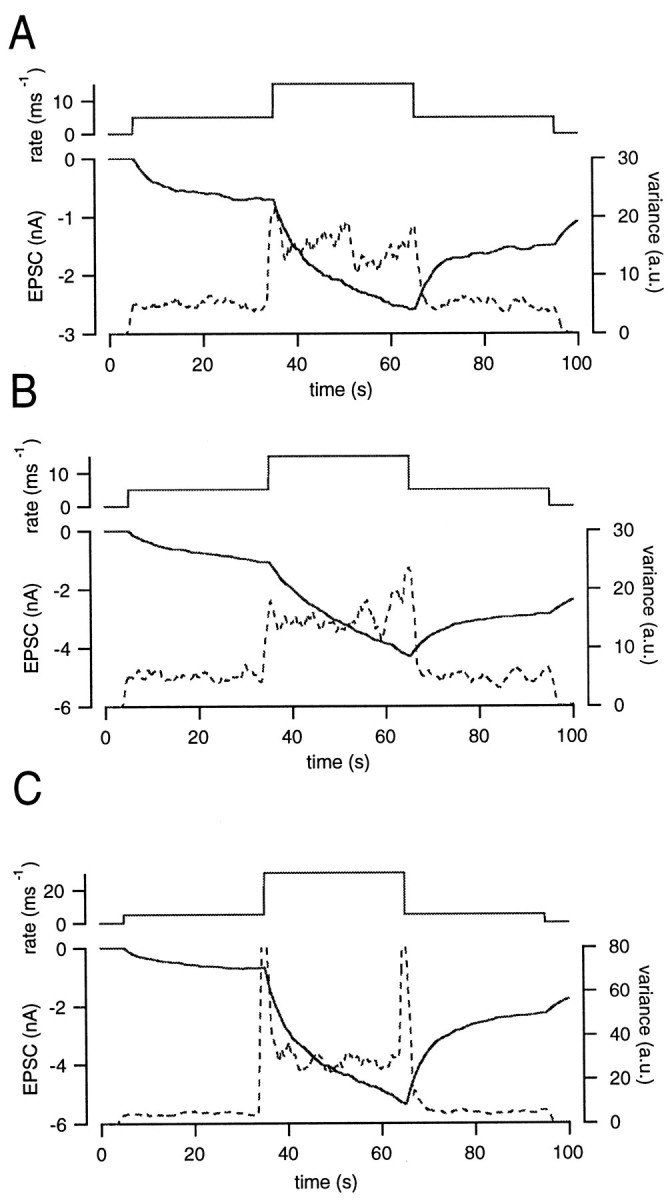
Robustness of variance to nonstationary conditions. A, EPSCs (solid line) were simulated by convolving the release rate (top) with mEPSCs. The release rate was changed from 0 to 5, 15, 5, and finally 0 msec−1. The parameters of simulation were the same as those described in Figure 2. B, The same protocol as in A, except that the proportion of the residual current to the total current has been doubled. Note that the scale of the left axis (EPSC) is different from that in A. C, The release rate was changed from the 0 to 5, 30, 5, and finally returned to 0 msec−1. Other settings were the same as described in A.
We also changed various parameters of the glutamate diffusion model to examine the robustness of noise analysis. In the case of Figure3B, the ratio of the residual current to the total EPSC (ß of Eq. 2) was double the value used in Figure 3A. Other parameters remained unchanged. By increasing ß, the total size of EPSCs was twice that observed in Figure 3A. Also, the slope of the EPSC became steeper. Although the signal became more nonstationary, variance did not fluctuate by >10% of the mean, and the estimate was not distorted by the trend as long as the release rate was constant. The amplitude of the spike observed during an abrupt change in the release rate was similar to that seen in Figure3A. When the release rate was 5 msec−1, we calculated an h′ value of 1.02 rel.u. When the release rate was 20 msec−1, h′ was 0.97 rel.u. We also changed other parameters of the glutamate diffusion model (for example, rD) as well as the decay time constant of the mEPSCs. However, estimates of h′ were not affected by these manipulations (data not shown). Again, these results suggest that bandpass filtering and subsequent subtraction of consecutive traces effectively eliminated nonstationarities.
Despite the effectiveness of high-pass filtering in handling nonstationarities, variance estimates may be distorted if changes of the release rate are too rapid or too large. For example, changes of the release rate from 5 to 30 msec−1 and the reverse (step sizes that were twice as large as in the case of Fig.3A) resulted in large spikes in the variance (Fig.3C). Nevertheless, variance was still stable except for the short segments exactly before and after these rapid changes in the release rate. Therefore, we analyzed only the regions outside the transition zones, where h′ was 0.96 rel.u. when the release rate was 5 msec−1 and 0.92 rel.u. when the release rate was 30 msec−1. This simulation suggests that abrupt changes of release rate should be avoided to obtain reliable estimates of the mEPSC size from noise analysis. In our experiments, we achieved this by adjusting the Ca2+ influx so that release rates and EPSCs did not change rapidly within certain regions of interest (see below).
Accuracy of variance analysis
Because the coefficient of variation (CV) of the variance estimate is quite large because of the random nature of the release process and the non-uniformity of the mEPSC amplitudes (Katz and Miledei, 1972), it is important to obtain multiple records to reduce the CV. At the calyx of Held, mEPSC amplitudes are variable (see Materials and Methods); thus, sampling over sufficient lengths and averaging the signal are essential to reduce the CV. The effect of averaging is demonstrated in Figure 4. In all cases, the release rate was changed from 0 to 5, 20, and 5 msec−1, and finally back to 0 msec−1. EPSCs were simulated by convolution using these release rates. Variance was smoothed by a gliding window and averaged over an increasing number of traces (n = 1, 3, 5, 10) (Fig. 4). Averaging reduced variance fluctuations that were observed while the release rate was kept constant. Therefore, averaging records reduces the CV of variance substantially.
Fig. 4.
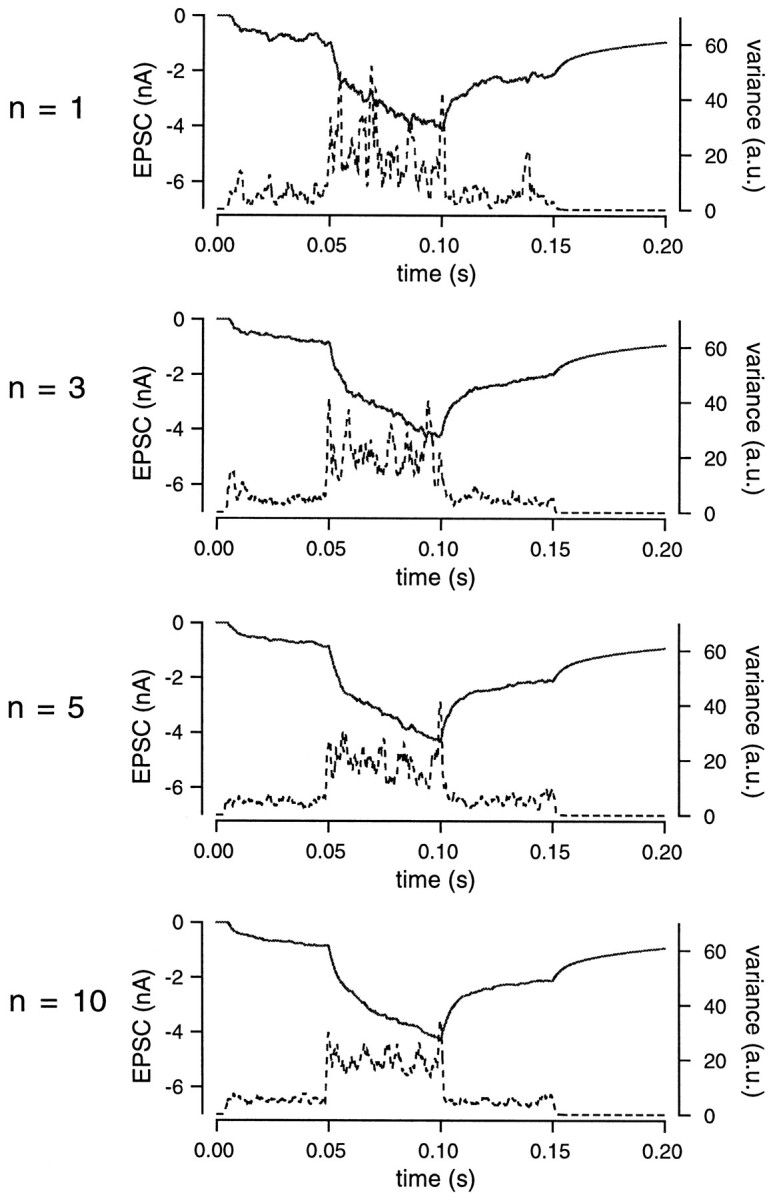
Effect of averaging on variance fluctuations. The release rate was changed from 0 to 5, 20, 5, and finally 0 msec−1. EPSCs (solid line) were simulated using the same parameters as described in Figure 2. The EPSC and variance (dotted line) were averaged over 1, 3, 5, or 10 traces. As the number of averages increased, the CV of variance decreased.
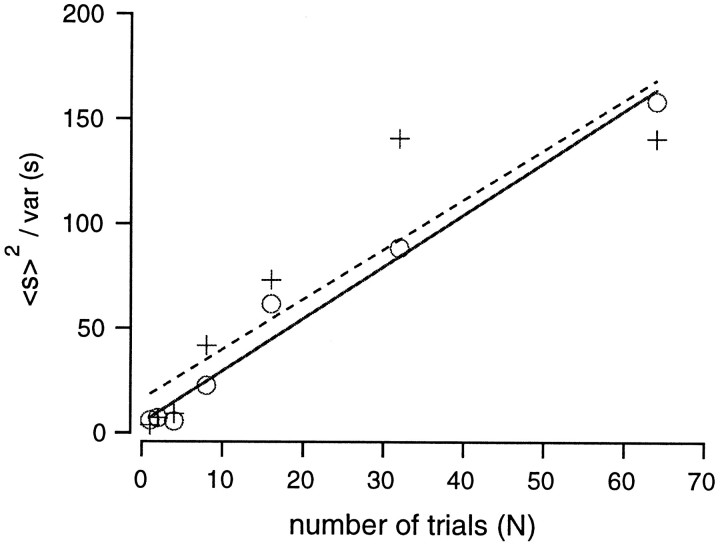
To establish the relationship between the CV of variance and the total recording time, we performed a “thought experiment” in which we subdivided the observation interval, T, into n intervals of length T/n. During these subintervals, we assumed that the transmitter release process was stationary and that the subintervals would be long enough to ensure that the requirements for Campbell's theorem were satisfied (that is, T/n must be longer than the duration of the individual event). We considered the n estimates of variance from these subintervals as a sample with a sample mean of 〈s〉, which for large n has a SD of 〈s〉 [in the case that the frequency of elementary events is high enough such that the sample mean is normally distributed (Spiegel, 1975)]. Then, the coefficient of variation is , and therefore we expected that the relative accuracy of our estimate does not depend on the amplitude of the signal. This finding implies that the relative accuracy of our estimate does not depend on the frequency of the mEPSC or the mEPSC amplitude. Instead, the relative accuracy is determined by the number of independent samples that can be taken. This in turn depends on the duration of the filtered mEPSCs, which becomes smaller as more high-pass filtering is applied. A plot of 1/CV2 against the number of averages, N, should be linear. From such a plot, we obtained the number of averages necessary for a desired CV. Simulations were used to clarify this relationship. Specifically, we considered two different release rates (5 and 20 msec−1). For both cases, the variance was calculated using the procedures described in Figure2A while changing the number of averages (N) from 1 to 64. Then, 〈s〉2/ variance (s) was plotted against N (Fig.5). The relationship was fitted by linear regression, and the slope was 2.4 (Fig. 5) regardless of the release rate (5 or 20 msec−1). Thus, to obtain an accuracy of 10%, which means that 〈s〉2/ variance (s) equals 100, it is necessary to take 100/2.4 or 42 averages. Given that in the above analysis one measurement consists of an average over 3 msec (the length of the smoothing window), a similar accuracy can be obtained by averaging one record over 3 × 42 or 126 msec. In our experiment, we used protocols that were 40–50 msec long and repeated these protocols 5–10 times (for a total of 200–500 msec). Therefore, the expected accuracy is somewhat better than 10%.
Fig. 5.
Relationship between variance fluctuations and the number of averages. Variance was calculated for each simulated EPSC and was averaged over various numbers (1, 2, 4, 8, 16, 32, or 64) of EPSCs. In simulations, the release rate was either 5 msec−1 (○) or 20 msec−1 (+). Variance fluctuations were calculated from 〈s〉2/var (s), where s denotes sample variance. This value was then plotted against the number of averages. The slope of this relationship was 2.4 regardless of the release rate.
Deconvolution of postsynaptic currents and determination of the contribution of residual current
The presynaptic terminal and the postsynaptic target were simultaneously voltage-clamped to a holding potential of −80 mV, as described in Materials and Methods. The extracellular solution contained TTX (0.5 μm) and TEA (10 mm) to block presynaptic Na+ and K+currents. D-AP5 (50 μm) was also added to block NMDA receptors and to isolate AMPA receptor-mediated EPSCs. To record traces suitable for estimation of the model parameters, the fitting protocol that was described in Materials and Methods was applied. This protocol started with a short depolarization of +80 mV. The Ca2+ influx was minimal as long as the terminal was held at +80 mV, and hence no EPSC was evoked by this depolarization (Fig. 6a). The terminal was then repolarized to 0 mV several times for episodes of increasing duration (1–5 msec). This evoked Ca2+ influx and the duration of these episodes were adjusted so that various sizes of EPSCs were obtained (Fig. 6b), which allowed the fitting of the diffusion model at several levels of residual current, as described in Materials and Methods. The residual current in this recording was very small, unlike the cases with CTZ, as shown below. The time course of the fit to the residual current is indicated in Fig. 6b (broken line). Each trace was concluded by a stimulation episode of 10 msec to completely deplete the readily releasable pool (RRP) of synaptic vesicles (Schneggenburger et al., 1999; Wu and Borst, 1999). Subsequently, the holding potential was returned to −80 mV. We apply the depleting pulse routinely to be able to measure the size of the RRP of synaptic vesicles, as described in the companion paper (Sakaba and Neher, 2001).
It is likely that the small current between stimulation episodes is attributed mainly to residual current based on the following observations. This small current was not mediated by NMDA receptors, because the extracellular solution contained 1 mmMg2+ and 50 μm D-AP5. Furthermore, 7-chloro-kynurenic acid (30 μm), a noncompetitive blocker of NMDA receptors, did not eliminate this current (data not shown). Therefore, this current must arise either from residual glutamate or from asynchronous vesicular release.
To distinguish between these two cases, noise analysis was used as described in Materials and Methods. The current trace was bandpass-filtered, and variance was calculated. Between stimulation episodes, the EPSC approached a sufficiently stationary state (Fig.6b), and bandpass filtering was able to eliminate efficiently the influence of slow trends. Variance measured between individual stimuli was very low. Values were typical for glutamate-induced current fluctuations that represent opening and closing of channels. The channel noise was estimated as explained above (Fig. 1) and subtracted from total variance, and then estimate for the release rate during episodes between stimulations was determined by dividing the remaining variance by the a.u. as determined by simulations (see Materials and Methods). In Figure 6d, variance observed between the individual stimuli was <2 a.u. (with channel variance contributing <10%). Because the unit in this calculation was mEPSC size (see above), the release rate during this period should be <2 events msec−1. We adjusted the model parameters such that the estimated release rate stayed within these limits. It should be pointed out that the influence of 0.5 mm EGTA in the presynaptic pipette filling solution (as routinely used in this study) is very helpful in limiting asynchronous release, even after relatively strong stimuli. Because the release rate is so small, postsynaptic current attributable to asynchronous release is on the order of magnitude of <50 pA. Therefore, most postsynaptic current between the stimuli (typically 100–300 pA) arises from the residual current, which is caused by delayed clearance of glutamate. Consequently, the release rate, as returned from the deconvolution routine, gave correct results (i.e., rates low enough to agree with variance measurement) only, if the residual current was modeled correctly. In practice, we adjusted the parameters of the diffusion model by trial and error to achieve this situation. Figure 6d shows an example of a fit that we consider appropriate. Here, the release rate (solid line, as returned by deconvolution), is superimposed onto variance. Variance is scaled such that the two curves should agree for h′ = 1 rel.u. It is seen that our choice of parameters fulfills this postulate for all sections, during which a valid variance estimate is available (i.e., when variance is not compromised by rapid transients in EPSC). On the other hand, the results below will show that h′ is most likely <1 rel.u. late in the record, such that the correction for asynchronous release is not accurate in this particular case. Figure 6c shows the same deconvolution result at lower gain, demonstrating that peak release rates in this record are orders of magnitude larger than the inaccuracies in the comparison between deconvolution- and variance-based estimates. The parameters obtained from this modeling were used for deconvolution of other traces within the same cell pair. Typical model parameters were n = 0.7, rD = 0.8 μm, and nD = 0.9.
Noise analysis used to examine the constancy of mEPSC size
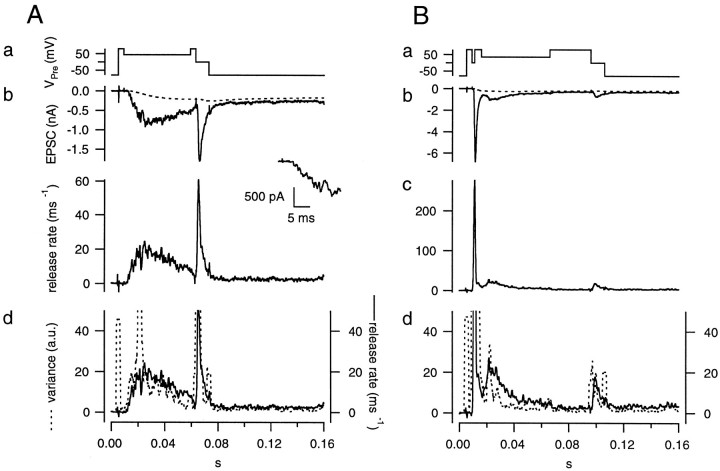
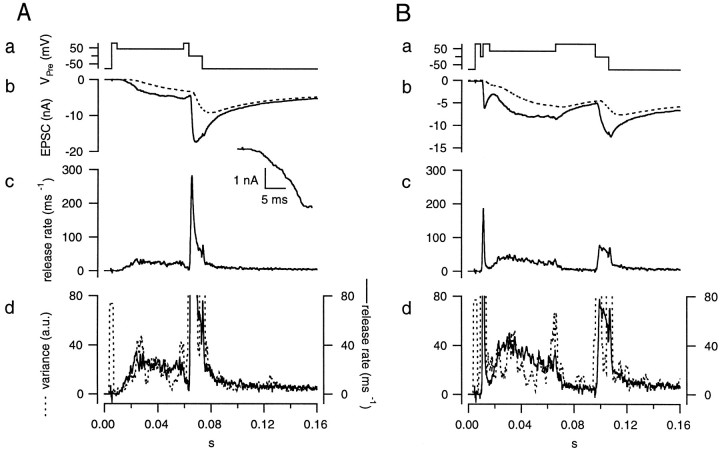
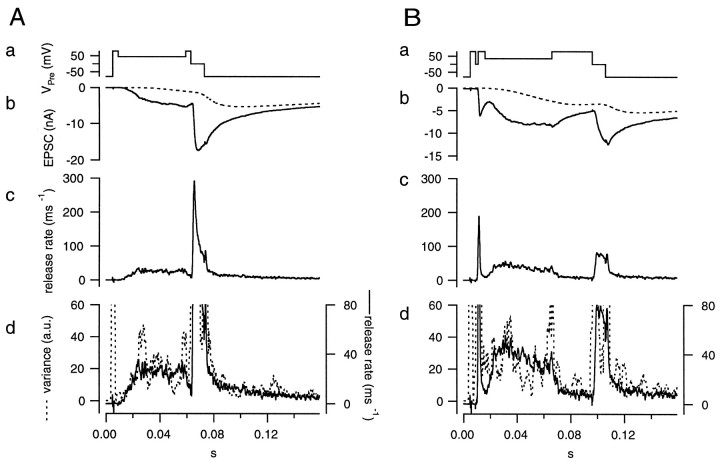
Importantly, our deconvolution method assumes that the mEPSC amplitude is constant. Therefore, after fixing the parameters of the glutamate diffusion model, we once more invoked noise analysis to verify that the amplitudes of the mEPSCs were indeed constant. For noise analysis, it is best to avoid nonstationarities (see above), and thus records with only small changes in the release rate are preferred. However, using release rates that are too small is also problematic, because subtle over- or underestimation of the residual current component will introduce serious errors during calculations. We found that release rates between 20 and 40 msec−1 were an optimal compromise. To obtain such release rates, the presynaptic terminal was held at +30–+50 mV for 50 msec (the voltage protocol for “early noise” analysis) (Fig.7Aa). During this episode, Ca2+ influx was relatively small, and the evoked EPSC increased slowly (Fig. 7A, section between 0.009 and 0.059 sec). The release rate usually rose to values between 20 and 40 msec−1. Variance was calculated for the whole record but should be considered reliable only during the episode intended for noise analysis. We repeated the same protocol 5–10 times to get a sampling length long enough to obtain sufficiently low CVs of variance.
Fig. 7.
Noise analysis for testing the constancy of mEPSCs amplitudes. A, The early noise protocol. The presynaptic terminal was depolarized to +80 mV, held at +45 mV for 50 msec, and then held at 0 mV for 10 msec (a). A single trace of the EPSC (b, solid line) is shown with residual current (b, dotted line) superimposed. The release rate (c) was estimated from deconvolution. Plots of the release rate (d, solid line) and variance (d,dotted line) calculated from the postsynaptic current of a single trace were superimposed and scaled (as in Fig. 6) to allow comparison of the relative time courses. B, The late noise protocol. The presynaptic terminal was depolarized to +80 mV, held at 0 mV for 2 msec to evoke a strong bout of exocytosis, and then held at +35 mV for 50 msec. The holding potential (+35 mV) was lower than used in the control protocol (+45 mV) to obtain comparable release rates. The terminal was then held at +80 mV for 30 msec, during which time release rate decreased, to verify the correctness of the glutamate diffusion model. Both protocols were concluded by holding the terminal at 0 mV for 10 msec to completely deplete the RRP of synaptic vesicles. The insets show the EPSC at the beginning of the episode used for noise analysis. Data were obtained from the cell pair shown in Figure 6.
mEPSC amplitudes are expected to decrease when postsynaptic receptors saturate (Clements et al., 1992; Jonas et al., 1993; Tang et al., 1994; Tong and Jahr, 1994) or desensitize (Trussell et al., 1993;Geiger et al., 1995; Otis et al., 1996b). This may occur during synaptic activity or as a result of previous bouts of exocytosis. Studies from other synapses that seem to share properties with the calyx of Held have shown that postsynaptic AMPA receptors desensitize during synaptic transmission (Trussell et al., 1993; Otis et al., 1996b). To examine the possibilities of receptor saturation and desensitization as well as the effects of previous release events, we used another test protocol (Fig. 7B) (termed “late noise” protocol) in which noise was analyzed after a strong bout of exocytosis. During this stimulation protocol, a large influx of Ca2+ was elicited by depolarizing the presynaptic terminal to 0 mV for 1–3 msec. An episode appropriate for noise analysis (similar to that of Fig. 7A) followed directly after the stimulation. The amplitude of the strong EPSC elicited by large stimulation was adjusted to be similar to or slightly larger than that of an action potential evoked EPSC by selecting an appropriate level of polarization. Both the early noise protocol (Fig. 7A) and the late noise protocol (Fig. 7B) were concluded by holding the presynaptic terminal at 0 mV for 10 msec to deplete the RRP completely. We repeated each protocol 5–10 times with pauses of 10–15 sec between individual runs.
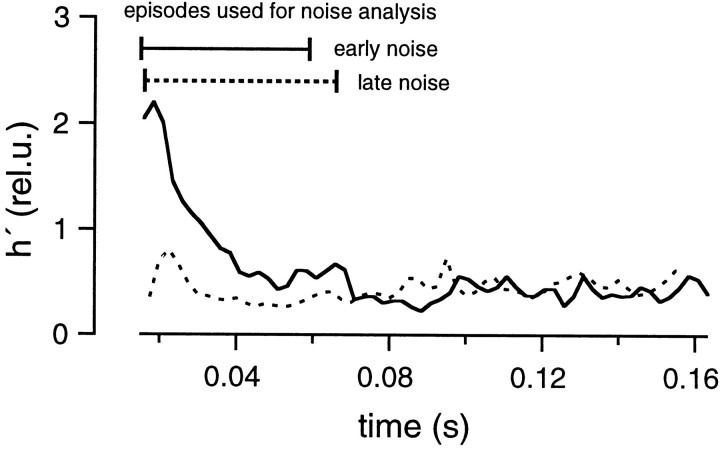
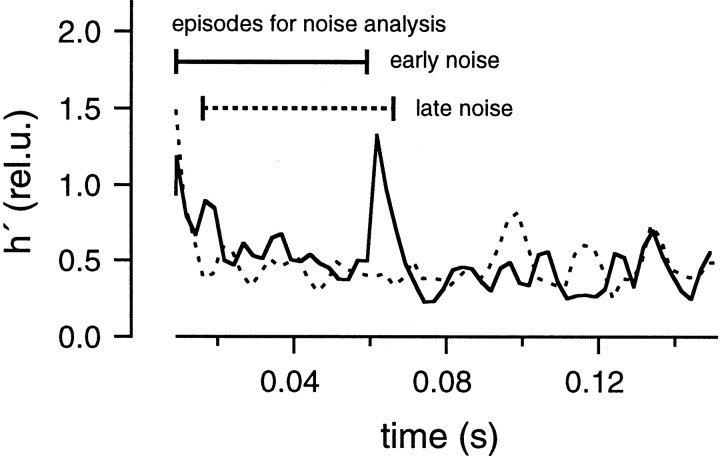
For both protocols, the residual current component was estimated using the glutamate diffusion model after the parameters had been determined as shown in Figure 6. The residual current component was subtracted from the total EPSC, and the release rate was estimated by deconvolving the remaining current with the mEPSC, as described in Materials and Methods. Then, the release rate was averaged over the whole group of traces obtained with the same protocol. Variance was calculated as described in Materials and Methods. Finally, h′ was calculated in rel.u. as explained in the context of Equation 11 and plotted against time (Fig. 8). These h′ values should be reliable during the episodes intended for noise analysis (0.015–0.059 sec in the early noise protocol and 0.016–0.066 sec in the late noise protocol) (Fig. 7A,B). They should be constant and close to 1, if all the underlying assumptions hold. In contrast to our expectations, h′ was found to decrease in the early noise protocol from >2.0 to 0.3 rel.u. During the late noise protocol, h′ was lower than expected but stayed constant (∼0.3 rel.u.); (Fig. 8). The change in h′ was also apparent in a single trace when variance and release rate traces were superimposed (Fig. 7, bottom). In this Figure, variance and release rate were scaled so that both traces should match if h′ was 1 rel.u. In the early noise protocol, h′ was >1 rel.u. at the very beginning of the stimulation episode. This was observed frequently and may represent an inaccuracy caused by the fact that release rates are very small initially. Alternatively, the large values of h′ at the beginning of the stimulation may actually represent the release of extra large quanta, or synchronized multiple release. This might occur in case there is some correlation between release probability and quantal size or if a small number of quanta can be pairwise-triggered by the opening of a single Ca2+ channel. h′ was close to 1 rel.u. (Fig. 7A) when the release rate first approached a value of 20 msec−1 but became smaller by the end of the protocol. In the late noise protocol (Fig. 7B), h′ was significantly <1 rel.u. throughout the episode used for noise analysis. Thus, Figures 7 and 8 demonstrate that mEPSC amplitudes decrease during continuous release and are very small after a strong bout of exocytosis.
Fig. 8.
mEPSC size estimated from fluctuation analysis. Data were obtained from the same cell pair as shown in Figures 6 and 7. The early noise and late noise protocols were repeated five times. h′ values estimated from average traces of the early noise protocol (solid line) and the late noise protocol (dotted line) were plotted against time. The regions of interest, during which the analysis is most reliable, are marked bybars (0.015–0.059 sec for the early noise protocol and 0.016–0.066 sec for the late noise protocol). In the early noise protocol, release rates are low during the first 5–10 msec of the episode used for noise analysis, and these regions were excluded from analysis.
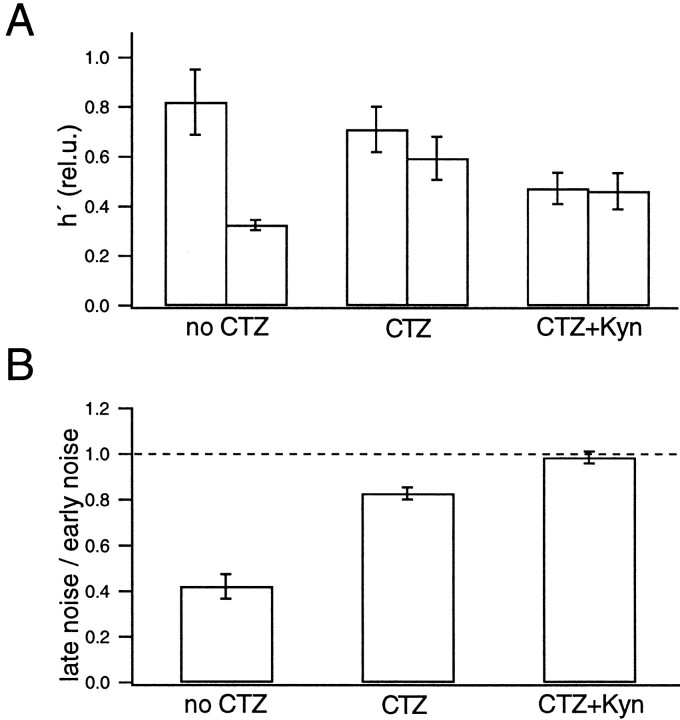
It is interesting to note that h′ seems to be stable during the depleting pulse (at t > 0.07 sec in the early noise protocol and t = 0.1 sec in the late noise protocol) and does not change abruptly, despite rapid changes in the release rate that occur at the onset of the depleting pulse (Fig. 8). Such findings indicate that subtraction of consecutive records and the filtering protocol used in our study efficiently remove nonstationarities that can distort the variance. Even so, we did not use episodes with serious nonstationarities for later analysis (Fig.3), and we restricted the analysis to the episodes designed for noise analysis (Fig. 8, bars). The estimates of h′ were pooled among different cell pairs. h′ was 0.82 ± 0.13 rel.u. in the early noise protocol and 0.32 ± 0.02 rel.u. in the late noise protocols (four cell pairs; see Fig. 18). h′ in the late noise protocol was 0.42 ± 0.05 of the early noise protocol, indicating that peak mEPSC amplitude in the late episode was 42% of that in the early episode. From deconvolution, we estimated that 207 ± 59 vesicles were released during the strong release period in the test condition. This value is slightly larger than the number of vesicles that are evoked by an action potential (∼150) (Borst and Sakmann, 1996; von Gersdorff et al., 1997; Schneggenburger et al., 1999).
Fig. 18.
Summary of the noise analysis. A, Comparison of the h′ estimates determined from the early noise protocol (left) and the late noise protocol (right) under three conditions: without CTZ or Kyn (4 cell pairs), in the presence of CTZ (6 cell pairs), and in the presence of CTZ and Kyn (5 cell pairs). The data were averaged among all cell pairs for each condition. Error bars indicate SEM. B, Ratios of h′ determined from the late noise protocol to h′ determined from the early noise protocol under the corresponding condition. Although the value of h′ varied among different cell pairs (A), the ratio of h′ was less variable (B).
The residual current was quite small throughout the relevant parts of the records of Figure 7, such that neither the variance estimates nor the deconvolution rates should be compromised by systematic errors (see Results). Thus, our results indicate that the mEPSC amplitude was indeed affected by previous or ongoing release. Therefore, deconvolution will lead to incorrect results in conditions similar to those used in Figure 7. Indeed, the release rates given in Figure 7, A and B, should be divided by “the respective h′ values,” to provide self-consistent values. This in turn would influence the predictions of the residual current (which fortunately is only a small correction in the data of Fig. 7).
The reduction in mEPSC amplitude is most likely mediated by postsynaptic receptor desensitization. We therefore examine this possibility in the following experiments by adding CTZ, which blocks or at least minimizes desensitization of AMPA receptors (Trussell et al., 1993; Yamada and Tang, 1993).
Cyclothiazide stabilizes mEPSCs amplitudes
To prevent postsynaptic receptor desensitization that may cause a reduction in the mEPSC amplitudes, we performed deconvolution and nonstationary noise analyses in the presence of CTZ (100 μm). At the start of each experiment, a fitting protocol was applied to determine parameters of the glutamate diffusion model (Fig. 9) under the conditions of the given experiment. In the presence of CTZ, EPSCs decayed much more slowly than in the absence of CTZ (compare Figs. 6 and 9) (Trussell et al., 1993; Yamada and Tang, 1993; Barnes-Davis and Forsythe, 1995). Thus the decay phase of EPSCs might be regulated by desensitization of AMPA receptors. Alternatively, it is also possible that the apparent affinity of AMPA receptors for glutamate is increased by CTZ or that channel closure after removal of glutamate is slowed (Yamada and Tang, 1993; Partin et al., 1994) (but seeTrussell et al., 1993). We also observed that EPSCs decayed more slowly as the EPSC amplitudes got larger (Fig. 9). Such findings are consistent with observations from other synapses, which showed that delayed clearance of glutamate occurs during periods of high quantal output (Trussell et al., 1993;Barbour et al., 1994; Mennerick and Zorumski, 1995).
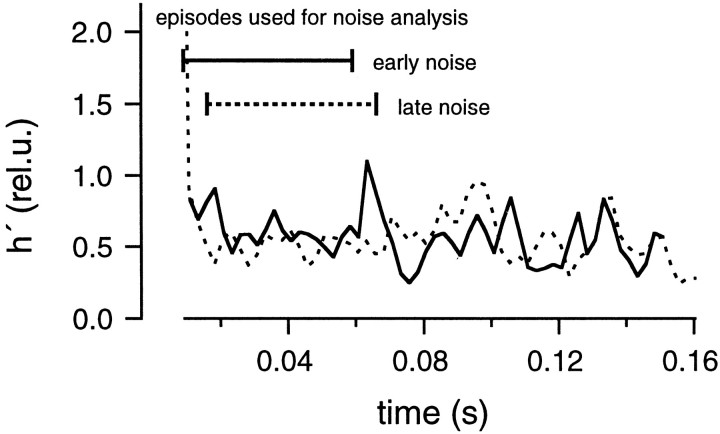
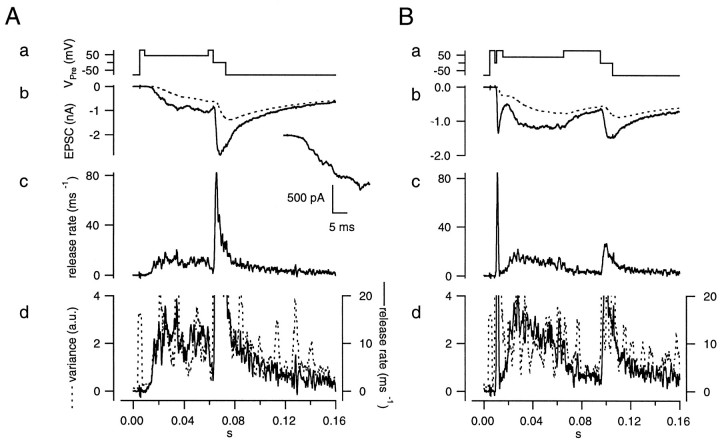
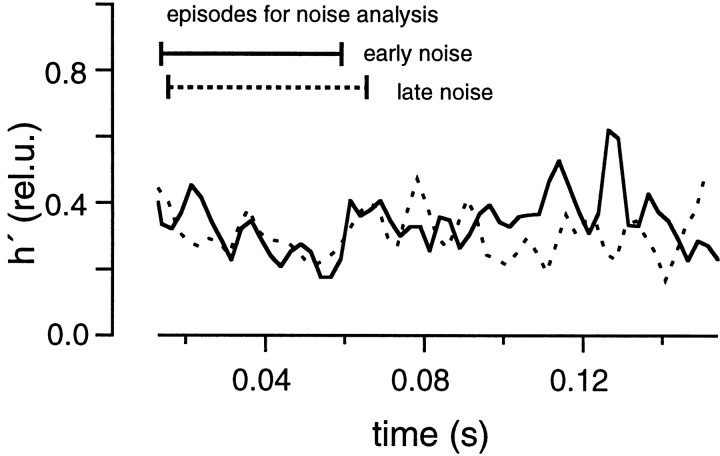
Once parameters of the diffusion model were established by using the fitting protocol (Fig. 9), which was described in Materials and Methods and Figure 6, the release rate was estimated by deconvolution. Then we performed noise analysis to test the constancy of the mEPSC amplitude in the presence of CTZ (Fig. 10, in analogy to Fig. 7) using the same protocols that were used previously. In both the early and late noise protocols, h′ remained constant (0.5–0.7 rel.u.) during the episodes intended for noise analysis (Fig. 11, 0.009–0.059 sec in A and 0.016–0.066 sec in B). When averaged over six cell pairs, h′ was 0.71 ± 0.09 rel.u. in the early noise protocol and 0.59 ± 0.09 rel.u. in the late noise protocol (six cell pairs). Thus h′ in the late noise protocol was 0.83 ± 0.03 of that during the early noise protocol (see Fig. 18), indicating that peak mEPSC amplitude in the late episode was 83% of that in the early episode. Before the episode for noise analysis, a strong Ca2+ influx as part of the test protocol evoked secretion of 295 ± 24 quanta. This release was twice that evoked by a single action potential (Borst and Sakmann, 1996).
Fig. 10.
Protocols for noise analysis in the presence of CTZ. The protocols and calculations were performed in the presence of 100 μm CTZ as described in Figure 7 using the cell pair and the parameters obtained in Figure 9.
Fig. 11.
The mEPSC size estimated from fluctuation analysis in the presence of CTZ. The protocols and calculations were performed as described in Figure 8 except for the presence of 100 μm CTZ. Same cell pair as in Figure 9.
In Figures 9-11, we assumed monoexponential decay (with a time constant of 2–3 msec) of the mEPSCs. In the presence of CTZ, many mEPSCs decayed biexponentially with a second time constant of ∼10 msec (Wu and Borst, 1999; our unpublished observations). As described in Materials and Methods, we can perform deconvolution analysis assuming either mono- or biexponential mEPSCs. In the former case, the slow component of mEPSC is considered to be part of the residual current. To validate this claim, we compared the two variants of analysis using the same data. We performed deconvolution and noise analysis of the records used in Figures 9-11 assuming a biexponential decay of mEPSCs (Figs.12-14). As expected, the proportion of the residual current to the total current decreased (Figs. 9b, 12b). However, the release rates estimated were not different between the two conditions (compare Figs. 10, 13). Also, the estimated h′ was almost the same: in the case of Fig. 14, h′ was only slightly smaller (∼10%) when biexponential decays were assumed as compared with the analysis using monoexponential decay (Fig. 11).
Fig. 13.
Protocols for noise analysis assuming a biexponential decay of the mEPSCs. The protocols and calculations were performed as described in Figure 10 using the cell pair shown in Figure9.
Fig. 14.
The mEPSC size estimated from fluctuation analysis assuming a biexponential decay of the mEPSC. The protocols and calculations were performed as described in Figure 11 using the cell pair shown in Figure 9.
In the presence of CTZ, the residual current is quite large, and therefore a discussion of possible systematic errors attributable to inaccuracies in this quantity is necessary. Taking the case of Figure10, we can see that Ir has approximately the same amplitude as y (according to the definition of Eq. 6). Because y(t) is quite stationary, this indicates that the relative systematic error of the rate estimate is approximately the same as the relative error in Ir (see Materials and Methods). Therefore, an accurate estimate of Ir is very important in this case. We consider our diffusion model prediction to be accurate at the 10–20% level. For the case of Figure 10B, this is confirmed by the episode immediately after the episode of noise analysis. Here (between 0.08 and 0.095 sec), the release rate drops to low values, and the residual current closely matches the total current. The error resulting from the inaccuracy of the channel variance should be small throughout traces in Figure 10, because it is in the order of 0.5 a.u. per nA. Thus, it should be ∼3 a.u., maximally, in episodes for noise analysis of Figure 10. Even if it was accurate to only 30%, the error would be <5%, given the fact that the total variance in the relevant sections is 20 a.u. or larger.
Comparison of the data of Figures 9-14 with those of Figures 6-8strongly suggests that the reduction of mEPSCs amplitudes during synaptic activity was mediated by postsynaptic AMPA receptor desensitization, because mEPSC amplitudes remained relatively constant in the presence of CTZ. Compared with the early noise protocol, mEPSCs amplitudes decreased by only 20% after a strong bout of exocytosis (corresponding to a release of ∼300 synaptic vesicles).
We also found that in some cells EPSC amplitudes were extremely large in the presence of CTZ (>10 nA) (Fig. 9). Under these conditions, the possibility of voltage clamp errors must be examined seriously. If postsynaptic series resistance is 2 MΩ and the EPSC amplitude is 15 nA, the voltage deviation from the holding potential will be 30 mV. We were forced to discard several cell pairs because EPSC amplitudes were >15 nA. This selection might cause some sampling bias of the data toward cells with smaller than average EPSCs. To circumvent potential problems of postsynaptic receptor saturation and clamp errors, we examined release rates in the presence of Kyn.
Effect of Kyn on the constancy of mEPSCs amplitudes
Kyn, a competitive antagonist in rapid equilibrium with the glutamate binding sites of the AMPA receptors (Diamond and Jahr, 1997), was used to prevent saturation of postsynaptic receptors. At the same time, clamp errors could be minimized by reducing the EPSC amplitudes. First, we examined the effects of Kyn (1 mm) on macroscopic EPSCs. CTZ was applied, and the EPSC were evoked by depolarizing the terminal from −80 mV to 0 mV. Kyn and CTZ were then both applied, and the same depolarization protocol was performed once more. The EPSC amplitude was reduced to 0.50 ± 0.01 by Kyn (four cell pairs), and the EPSC decayed slightly faster (data not shown). This acceleration might indicate that AMPA receptors were saturated in the presence of CTZ alone.
Noise analysis was performed on the data recorded in the presence of CTZ and Kyn to examine the constancy of the mEPSC amplitudes. As in the cases described so far, we determined parameters of the diffusion model using a fitting protocol (Fig. 15), and we performed deconvolution and noise analysis (Fig.16). h′ values estimated from the episode for noise analysis were compared between the early noise and the late noise protocols (Fig.17) and were found to be almost the same. Also, the estimated h′ values were constant during the episodes for noise analysis. The size of h′ (0.4 rel.u. in this particular experiment) was much smaller than in the absence of Kyn. From five similar experiments, the average value of h′ was found to be 0.47 ± 0.06 rel.u. in the early noise protocol and 0.46 ± 0.07 rel.u. in the late noise protocol (five cell pairs). Thus values are very close to what we expect (0.5 rel.u.) if Kyn reduces h by 50%. h′ in the late noise protocol was 0.98 ± 0.03 of the early noise protocol (Fig.18). We conclude that mEPSC amplitudes were constant in the presence of CTZ and Kyn. Regarding systematic errors in this analysis, similar arguments apply, as discussed in the context of Fig. 10. It should be noted that the 50% reduction of mEPSC amplitude, which we obtained here in the presence of Kyn, is expected to be the same as the macroscopic current reduction, only if there is negligible receptor saturation or the same degree of receptor saturation for macroscopic and miniature events. Because mEPSCs cannot be resolved adequately under Kyn, this point will need further investigation.
Fig. 16.
Protocols for noise analysis in the presence of CTZ and Kyn. The protocols and calculations were performed in the presence of 100 μm CTZ and 1 mm Kyn as described in Figure 7, using the cell pair shown in Figure 15. For the plots of release rates in Ac and Bc, we assumed that Kyn decreased mEPSCs amplitudes to 50% and therefore scaled the values by a factor of 2.
Fig. 17.
mEPSC size estimated from fluctuation analysis in the presence of CTZ and Kyn. The protocols and calculations were performed in the presence of 100 μm CTZ and 1 mm Kyn as described in Figure 8, using the cell pair shown in Figure 15.
DISCUSSION
In the present study, we extend the suitability of deconvolution methods to estimate the rate of quantal release at the calyx of Held. The simple form of the deconvolution method (Cohen et al., 1981; van der Kloot, 1988a; Aumann and Parnas, 1991) is not readily applicable to this synapse and possibly also not to other glutamatergic synapses, because of a residual current component caused by delayed clearance of glutamate from the synaptic cleft (Barbour et al., 1994; Mennerick and Zorumski, 1995; Otis et al., 1996a). Also, postsynaptic factors such as desensitization (Trussell et al., 1993; Otis et al., 1996b) and saturation (Clements et al., 1992; Jonas et al., 1993; Tang et al., 1994) of AMPA receptors complicate the analysis. To take into account the residual current component, we developed a simple model of glutamate diffusion and incorporated it into the deconvolution algorithm. To identify postsynaptic factors that shape the EPSCs, we combined deconvolution with a novel type of nonstationary variance analysis. We found that postsynaptic AMPA receptors were desensitized significantly by a strong bout of exocytosis. CTZ prevented this desensitization. The mEPSC amplitude was almost constant in the presence of CTZ and Kyn. Kyn seemed to prevent saturation of postsynaptic receptors and also reduced possible voltage clamp errors.
A contribution of desensitization to synaptic depression at the calyx of Held synapse
Trussell et al. (1993) showed that synaptic depression was reduced by CTZ, suggesting that postsynaptic receptor desensitization may play a role in the synaptic depression at calyx-type synapses (Otis et al., 1996b). In another set of experiments, the mEPSC amplitude was used to assay desensitization of postsynaptic receptors (Magleby and Pallotta, 1981; Otis et al., 1996b). Using a different approach, we now show that desensitization occurs during synaptic activity at the calyx of Held. We observed that the amplitude of mEPSCs decreased after a large EPSC, which was comparable in amplitude to an action potential-evoked EPSC. This reduction was eliminated by CTZ. Therefore, desensitization of postsynaptic receptors has an important role in shaping postsynaptic responses.
At the calyx of Held, postsynaptic responses showed pronounced paired-pulse depression when two stimuli were applied with a short interpulse interval and if the first stimulus released >100–200 quanta (Borst et al., 1995; von Gersdorff et al., 1997; Schneggenburger et al., 1999). Also, high-frequency stimulation caused strong synaptic depression (Borst et al., 1995). We show that release equivalent to that of a single action potential causes significant desensitization and affects subsequent EPSCs, although the EPSC evoked by a single action potential itself is shaped not by desensitization but rather by asynchronous release of synaptic vesicles (Issacson and Walmsley, 1995; Borst and Sakmann, 1996). Desensitization should build up during trains of action potentials, especially if intervals between successive stimuli is comparable or shorter than the time constant of desensitization. The latter was found to be 10–20 msec in another calyx-type synapse (Raman and Trussell, 1995). In addition, there may be desensitization between stimuli if residual glutamate accumulates. Thus desensitization will contribute to depression for frequencies above 50 Hz and possibly at lower frequencies, in the case that accumulation occurs. This conclusion is quite reasonable, considering that postsynaptic AMPA receptors at the calyx show rapid and strong desensitization when activated by application of glutamate (Geiger et al., 1995).
Validity of the use of deconvolution at the calyx of Held synapse
From noise analysis, we showed that the amplitude of mEPSCs was constant during synaptic activity in the presence of CTZ and Kyn. CTZ alone seemed to reduce receptor desensitization very effectively, because in its presence the mEPSC amplitude decreased only slightly (20%; maximally 40% in our data set) after large amounts of exocytosis. This reduction can be explained in several ways. Specifically, postsynaptic receptors may become partially saturated during synaptic activity, or clamp errors may become relevant because of large EPSCs. Unfortunately, we were not able to distinguish between the two possibilities, although both are equally possible. The possibility of receptor saturation is supported by the observation that the EPSC decayed slightly faster after additional application of Kyn (data not shown) [see Wu and Borst (1999), their Fig. 1]. Also, in some recordings, we saw a gradual decrease in the mEPSC amplitudes during prolonged stimulation. This decrease could be explained by saturation of postsynaptic receptors, because it was shown that postsynaptic receptors saturate during synaptic transmission in some synapses (Jonas et al., 1993; Tang et al., 1994). However, clamp errors may also be serious, because EPSC amplitudes are quite large under CTZ. Although we corrected for this off-line, the data should be considered unreliable if the correction factor exceeds 50%.
It is also possible that postsynaptic receptors are desensitized by transmitter even in the presence of CTZ. Partin et al. (1994) showed that CTZ slowed down but did not completely remove desensitization of the AMPA receptor flop variants. Because GluR-D flop variants are expressed in the postsynaptic principal neurons (Geiger et al., 1995), it might be possible that receptors still desensitize in the presence of CTZ. However, we think this scenario is unlikely, because mEPSCs amplitudes were constant in the presence of CTZ and Kyn.
The mEPSC size estimate derived from the ratio of variance and release rate was compared with the value expected from simulations. However, simulations depended critically on parameter settings, especially on the rise time of mEPSCs. If much slower rise times of mEPSCs (>200 μsec) were assumed for simulations, the mEPSC size expected from simulations became smaller because of decreased noise power in the bandpass chosen for analysis. The opposite happened if faster rise times were assumed, although such changes were limited by the low-pass filtering, which we applied to both experimental and simulated records. In the presence of CTZ and Kyn, the estimate from experimental results and the values obtained in simulations were exactly the same. This suggests that the parameter settings of simulations are most likely quite reasonable. Thus, discrepancies between the experimental results and simulations in other conditions are not caused by the settings of simulations, unless mEPSC rise times are different.
CTZ slowed the decay of EPSCs (Figs. 6, 9), making the estimates of release rates more robust. As shown in Equation 7, the estimates of the release rates will be proportional to the time derivative of the EPSCs, when the decay of mEPSCs is very slow. If this is the case, the deconvolution method becomes less sensitive to other factors, such as the exact time course of mEPSCs or slowly varying residual currents. In the study of Wu and Borst (1999), CTZ was added so that the EPSC amplitudes approximated the cumulative transmitter release, when the calyx of Held was stimulated with short current pulses.
Apart from these considerations, the deconvolution method described here may be compromised by inadequate estimation of the residual current. We show that the error under conditions of stationary release cannot be better than the error of the residual current. During rapid transients the same applies with respect to rates of change (i.e., the relative error is at least as large as that of dIr/ dt). The estimate of the residual current, on the other hand, depends on an appropriate choice of the fitting protocol. We attempted to cover a wide range of possible waveforms of the residual current in the fitting protocol of this study. In general, however, it is advisable to design fitting protocols that result in residual currents similar (in amplitude and time) to those expected during the most relevant sections of the test run. Ideally, the fitting protocol should be exactly the same as the test protocol, except that it does not elicit release in the interval of interest. Also, it should be noted that the estimate of the individual current is not accurate if the mEPSC amplitude changes, because it depends on the deconvolution rate, which is calculated assuming constant mEPSC amplitude.
Applicability of this method to other preparations
We have developed a novel type of deconvolution that, in combination with variance analysis, allows estimation of the kinetics of transmitter release. To apply this method to other synapses, the rate of quantal release must be precisely controlled to obtain EPSCs with low release rates that can be used for noise analysis. It is also essential to voltage-clamp the postsynaptic cell reliably. If the EPSC is distorted by voltage-clamp errors, the mean current and also variance will be distorted. In fact, the error of the variance will be significantly more distorted, because it is the square of the error of the mean current. Finally, the conditions under which the mEPSC amplitude is constant must be verified. Otherwise, correction factors must be introduced to compensate for changes in the mEPSC amplitude. The calyx of Held satisfied these criteria only in the presence of CTZ and Kyn. In other preparations, it is also possible to voltage-clamp the presynaptic and postsynaptic cells simultaneously (Yawo and Momiyama, 1993; Yazejian et al., 1997). It will be interesting to apply the method presented here to these synapses.
Furthermore, the nonstationary noise analysis presented here seems to be a potent method to identify presynaptic and postsynaptic factors shaping EPSCs. Specifically, we were able to separate the residual current component from that arising from the asynchronous release of synaptic vesicles, a task that has proven difficult in the past (Barbour and Häusser, 1997). If the trace is stationary for a long enough period, release rates and mEPSC amplitude can be estimated from a single trace. We hope that this analysis is helpful for studies at other synapses. An application of this type of analysis in which the dependence of release rate on calcium current is established is described in the companion article (Sakaba and Neher, 2001).
The point-by-point deconvolution algorithm, used here, can be derived by considering the general rule for differentiating an integral of the form of Equation 6 (Madelung, 1964), which is:
| Equation A1 |
We consider the case of an mEPSC starting from zero at time zero and rising to a value of h (its peak value) with a time constant of rise, τ0, from where it decays in a double exponential fashion according to:
| Equation A2 |
Here, α is the relative contribution of a second slow mEPSC component and τ1 and τ2 are the time constants of the rapid and the slow component, respectively. A0 is a normalization factor, which is the inverse of the peak amplitude of the expression within the parentheses of Equation EA2. This insures that the peak amplitude of F(t") is 1. For evaluation of Equation EA1, we note that the first term in the sum is zero, because F(0) = 0, and we split the integration into two time intervals:
| Equation A3 |
with Δt representing the time to peak of F(t").
For evaluating the second part we assume that the release rate ξ(t′) is relatively constant over the short time interval Δt and can be replaced by its value (t*) at an appropriately chosen time t* ∈ [t − Δt, t]. We consider (t*) as an average in the sense that small rapid fluctuations in ξ(t) are averaged over the integration interval. Then this term will be given by:
| Equation A4 |
where we make use of the normalization F(Δt) = 1.
A3 together with A2 and A4 results in the following equation:
| Equation A5 |
where:
| Equation A6 |
Calculation of (t*), therefore, requires the evaluation of the derivative dy/dt at time t and of three integrals, involving the function ξ(t) at values smaller than t. This, however, can be simplified by considering that (Eqs. 6, EA2, and EA6):
| Equation A7 |
The second term in this equation is given by:
| Equation A8 |
where t** is an appropriately chosen time t** ∈ [t − Δt, t]. Int0 can be simplified by considering that this integration is performed over a very rapidly decaying function, which is significantly different from zero in the integration interval only at time Δt and slightly larger. Therefore,Int0 can be evaluated to:
| Equation A9 |
Here, again, t*** denotes an appropriately chosen time t*** ∈ [t − Δt − τ0, t − Δt]. Combining Equations EA5 and EA6-EA9 and eliminatingInt1, we arrive at:
| Equation A10 |
When written in this form one can readily see that the deconvolution can be calculated according to the simple Equation 7(Cohen et al., 1981), if the mEPSC is monoexponential (α = 0) and the rise time (≈ τ0) is very short. The additional terms in Equation EA10 are corrections for biexponential decay (the term proportional to α) and finite rise time. For the actual calculation we evaluated:
| Equation A11 |
numerically, and chose t* to be at the half-point of the mEPSC rising phase. Numerical simulations showed that the deconvolution result was not very sensitive toward the exact choice of t** and t***. We therefore set t** = t* and t*** ≈ t−Δt and evaluated the quantity ξ"(t*), defined as the product of h and ξ(t*):
with
| Equation A12 |
"(t*) as well as all the terms within the curled brackets of Equation EA12 are in units of amperes per second, and the release rate in events per second is obtained by division through h. Note that this is a mean release rate, referred to the mean mEPSC amplitude h, and when evaluated at time t, it is an average over the interval [t − Δt, t]. The quantity "(t**), appearing on the right side of A12, is the same quantity as evaluated at an earlier time point. Therefore, A12 can be evaluated point by point, when starting values in the interval [0, Δt] are known. We take these as zero, because our experimental traces always start with episodes without stimulation. The mean current of the starting episode is subtracted from the whole trace before deconvolution, to correct for holding currents.
Footnotes
This work was supported in part by a grant of the Deutsche Forschungsgemeinschaft (SFB 406) to E.N. and by an Alexander von Humboldt fellowship (T.S.). We thank Ralf Schneggenburger for very helpful advice during the course of this study, and Alexander Meyer, Ralf Schneggenburger, and Henrique von Gersdorff for help with the initial part of the experiments. We also thank Ruth Heidelberger, Isabel Llano, Alain Marty, and Sonja Pyott for critical comments on this manuscript.
Correspondence should be addressed to Erwin Neher, Max-Planck-Institute for Biophysical Chemistry, Department of Membrane Biophysics, D-37077, Göttingen, Germany. E-mail:eneher@gwdg.de.
REFERENCES
- 1.Aumann Y, Parnas H. Evaluation of the time course of neurotransmitter release from the measured PSC and MPSC. Bull Math Biol. 1991;53:537–555. doi: 10.1007/BF02458628. [DOI] [PubMed] [Google Scholar]
- 2.Barbour B, Häusser M. Intersynaptic diffusion of neurotransmitter. Trends Neurosci. 1997;20:377–384. doi: 10.1016/s0166-2236(96)20050-5. [DOI] [PubMed] [Google Scholar]
- 3.Barbour B, Keller BU, Llano I, Marty A. Prolonged presence of glutamate during excitatory synaptic transmission to cerebellar Purkinje cells. Neuron. 1994;12:1331–1343. doi: 10.1016/0896-6273(94)90448-0. [DOI] [PubMed] [Google Scholar]
- 4.Barnes-Davies M, Forsythe ID. Pre- and postsynaptic glutamate receptors at a giant excitatory synapse in rat auditory brainstem slices. J Physiol (Lond) 1995;488:387–406. doi: 10.1113/jphysiol.1995.sp020974. [DOI] [PMC free article] [PubMed] [Google Scholar]
- 5.Barrett EF, Stevens CF. Quantal independence and uniformity of presynaptic release kinetics at the frog neuromuscular junction. J Physiol (Lond) 1972a;227:665–689. doi: 10.1113/jphysiol.1972.sp010053. [DOI] [PMC free article] [PubMed] [Google Scholar]
- 6.Barrett EF, Stevens CF. The kinetics of transmitter release at the frog neuromuscular junction. J Physiol (Lond) 1972b;227:691–708. doi: 10.1113/jphysiol.1972.sp010054. [DOI] [PMC free article] [PubMed] [Google Scholar]
- 7.Borges S, Gleason E, Turelli M, Wilson M. The kinetics of quantal transmitter release from retinal amacrine cells. Proc Natl Acad Sci USA. 1995;92:6896–6900. doi: 10.1073/pnas.92.15.6896. [DOI] [PMC free article] [PubMed] [Google Scholar]
- 8.Borst JG, Sakmann B. Calcium influx and transmitter release in a fast CNS synapse. Nature. 1996;383:431–434. doi: 10.1038/383431a0. [DOI] [PubMed] [Google Scholar]
- 9.Borst JG, Helmchen F, Sakmann B. Pre- and postsynaptic whole-cell recordings in the medial nucleus of the trapezoid body of the rat. J Physiol (Lond) 1995;489:825–840. doi: 10.1113/jphysiol.1995.sp021095. [DOI] [PMC free article] [PubMed] [Google Scholar]
- 10.Clements JD, Lester RAJ, Tong G, Jahr CE, Westbrook GL. The time course of glutamate in the synaptic cleft. Science. 1992;258:1498–1501. doi: 10.1126/science.1359647. [DOI] [PubMed] [Google Scholar]
- 11.Crank J. The mathematics of diffusion. Clarendon; Oxford: 1975. [Google Scholar]
- 12.Cohen I, van der Kloot W, Attwell D. The timing of channel opening during miniature end-plate currents. Brain Res. 1981;223:185–189. doi: 10.1016/0006-8993(81)90821-0. [DOI] [PubMed] [Google Scholar]
- 13.Diamond JS, Jahr CE. Asynchronous release of synaptic vesicles determines the time course of the AMPA receptor-mediated EPSC. Neuron. 1995;15:1097–1107. doi: 10.1016/0896-6273(95)90098-5. [DOI] [PubMed] [Google Scholar]
- 14.Diamond JS, Jahr CE. Transporters buffer synaptically released glutamate on a submillisecond scale. J Neurosci. 1997;17:4672–4687. doi: 10.1523/JNEUROSCI.17-12-04672.1997. [DOI] [PMC free article] [PubMed] [Google Scholar]
- 15.Forsythe I. Direct patch recording from identified presynaptic terminals mediating glutamatergic EPSCs in the CNS in vitro. J Physiol (Lond) 1994;479:381–387. doi: 10.1113/jphysiol.1994.sp020303. [DOI] [PMC free article] [PubMed] [Google Scholar]
- 16.Geiger JR, Melcher T, Koh DS, Sakmann B, Seeburg PH, Jonas P, Monyer H. Relative abundance of subunit mRNAs determines gating and Ca2+ permeability of AMPA receptors in principal neurons and interneurons in rat CNS. Neuron. 1995;15:193–204. doi: 10.1016/0896-6273(95)90076-4. [DOI] [PubMed] [Google Scholar]
- 17.Haller M, Heinemann C, Chow RH, Heidelberger R, Neher E. Comparison of secretory responses as measured by membrane capacitance and by amperometry. Biophys J. 1998;74:2100–2113. doi: 10.1016/S0006-3495(98)77917-2. [DOI] [PMC free article] [PubMed] [Google Scholar]
- 18.Hartzell HC, Kuffler SW, Yoshikami D. Post-synaptic potentiation: interaction between quanta of acetylcholine at the skeletal neuromuscular synapse. J Physiol (Lond) 1975;251:427–463. doi: 10.1113/jphysiol.1975.sp011102. [DOI] [PMC free article] [PubMed] [Google Scholar]
- 19.Issacson JS, Walmsley B. Counting quanta: direct measurements of transmitter release at a central synapse. Neuron. 1995;15:875–884. doi: 10.1016/0896-6273(95)90178-7. [DOI] [PubMed] [Google Scholar]
- 20.Jonas P, Major G, Sakmann B. Quantal components of unitary EPSCs at the mossy fibre synapse on CA3 pyramidal cells of rat hippocampus. J Physiol (Lond) 1993;472:615–663. doi: 10.1113/jphysiol.1993.sp019965. [DOI] [PMC free article] [PubMed] [Google Scholar]
- 21.Katz B, Miledi R. The measurement of synaptic delay, and the time course of acetylcholine release at the neuromuscular junction. Proc R Soc B Biol Sci. 1965;161:483–495. doi: 10.1098/rspb.1965.0016. [DOI] [PubMed] [Google Scholar]
- 22.Katz B, Miledi R. The statistical nature of the acetylcholine potential and its molecular components. J Physiol (Lond) 1972;224:665–700. doi: 10.1113/jphysiol.1972.sp009918. [DOI] [PMC free article] [PubMed] [Google Scholar]
- 23.Madelung E. Die mathematischen Hilfsmittel des Physikers. Springer; Berlin: 1964. [Google Scholar]
- 24.Magleby KL, Pallotta BS. A study of desensitization of acetylcholine receptors using nerve-released transmitter in the frog. J Physiol (Lond) 1981;316:225–250. doi: 10.1113/jphysiol.1981.sp013784. [DOI] [PMC free article] [PubMed] [Google Scholar]
- 25.Mennerick S, Zorumski CF. Presynaptic influence on the time course of fast excitatory synaptic currents in cultured hippocampal cells. J Neurosci. 1995;15:3178–3192. doi: 10.1523/JNEUROSCI.15-04-03178.1995. [DOI] [PMC free article] [PubMed] [Google Scholar]
- 26.Oleskevich S, Celements J, Walmsley B. Release probability modulates short-term plasticity at a giant terminal. J Physiol (Lond) 2000;524:512–523. doi: 10.1111/j.1469-7793.2000.00513.x. [DOI] [PMC free article] [PubMed] [Google Scholar]
- 27.Otis T, Wu YC, Trussell LO. Delayed clearance of transmitter and the role of glutamate transporters at synapses with multiple release sites. J Neurosci. 1996a;16:1634–1644. doi: 10.1523/JNEUROSCI.16-05-01634.1996. [DOI] [PMC free article] [PubMed] [Google Scholar]
- 28.Otis T, Zhang S, Trussell LO. Direct measurement of AMPA receptor desensitization induced by glutamatergic synaptic transmission. J Neurosci. 1996b;16:7496–7504. doi: 10.1523/JNEUROSCI.16-23-07496.1996. [DOI] [PMC free article] [PubMed] [Google Scholar]
- 29.Partin KL, Patneau DK, Mayer ML. Cyclothiazide differentially modulates desensitization of alpha-amino-3-hydroxy-5-methyl-4-isoxazolepropionic receptor splice variants. Mol Pharmacol. 1994;46:129–138. [PubMed] [Google Scholar]
- 30.Raman IM, Trussell LO. The mechanisms of α-amini-3-hydroxy-5-methyl-4-isoxazolepropionate receptor desensitization after removal of glutamate. Biophys J. 1995;68:137–146. doi: 10.1016/S0006-3495(95)80168-2. [DOI] [PMC free article] [PubMed] [Google Scholar]
- 31.Rice SO. Mathematical analysis of random noise. Bell Telephone System J. 1944;23:282–332. [Google Scholar]
- 32.Rosenmund C, Stern-Bach Y, Stevens CF. The tetrameric structure of a glutamate receptor channel. Science. 1998;280:1596–1599. doi: 10.1126/science.280.5369.1596. [DOI] [PubMed] [Google Scholar]
- 33.Sakaba T, Neher E. Quantitative relationship between transmitter release and calcium current at the calyx of Held synapse. J Neurosci. 2001;21:446–459. doi: 10.1523/JNEUROSCI.21-02-00462.2001. [DOI] [PMC free article] [PubMed] [Google Scholar]
- 34.Schneggenburger R, Meyer AC, Neher E. Released fraction and total size of a pool of immediately available transmitter quanta at a calyx synapse. Neuron. 1999;23:399–409. doi: 10.1016/s0896-6273(00)80789-8. [DOI] [PubMed] [Google Scholar]
- 35.Segal JR, Ceccarelli B, Fesce R, Hurlbut WP. Miniature endplate potential frequency and amplitude determined by an extension of Campbell's theorem. Biophys J. 1985;47:183–202. doi: 10.1016/s0006-3495(85)83891-1. [DOI] [PMC free article] [PubMed] [Google Scholar]
- 36.Sigworth F. The variance of sodium current fluctuations at the node of Ranvier. J Physiol (Lond) 1980;307:97–129. doi: 10.1113/jphysiol.1980.sp013426. [DOI] [PMC free article] [PubMed] [Google Scholar]
- 37.Sigworth FJ. Interpreting power spectra from nonstationary membrane current fluctuations. Biophys J. 1981;35:289–300. doi: 10.1016/S0006-3495(81)84790-X. [DOI] [PMC free article] [PubMed] [Google Scholar]
- 38.Silver RA, Momiyama A, Cull-Candy SG. Locus of frequency-dependent depression identified with multiple-probability fluctuation analysis at rat climbing fibre–Purkinje cell synapses. J Physiol (Lond) 1998;518:121–130. doi: 10.1111/j.1469-7793.1998.881bj.x. [DOI] [PMC free article] [PubMed] [Google Scholar]
- 39.Spiegel MR. Probability and statistics. Schumann's outline. Series in mathematics. McGraw-Hill; New York: 1975. [Google Scholar]
- 40.Stevens CF, Wang Y. Facilitation and depression at single central synapses. Neuron. 1995;14:795–802. doi: 10.1016/0896-6273(95)90223-6. [DOI] [PubMed] [Google Scholar]
- 41.Tang CM, Margulis M, Shi QY, Fielding A. Saturation of postsynaptic glutamate receptors after quantal release of transmitter. Neuron. 1994;13:1385–1393. doi: 10.1016/0896-6273(94)90423-5. [DOI] [PubMed] [Google Scholar]
- 42.Tong G, Jahr CE. Multivesicular release from excitatory synapses of cultured hippocampal neurons. Neuron. 1994;12:51–59. doi: 10.1016/0896-6273(94)90151-1. [DOI] [PubMed] [Google Scholar]
- 43.Trussell LO, Zhang S, Raman IM. Desensitization of AMPA receptors upon multiquantal neurotransmitter release. Neuron. 1993;10:1185–1196. doi: 10.1016/0896-6273(93)90066-z. [DOI] [PubMed] [Google Scholar]
- 44.van der Kloot W. Estimating the timing of quantal releases during end-plate currents at the frog neuromuscular junction. J Physiol (Lond) 1988a;402:595–603. doi: 10.1113/jphysiol.1988.sp017224. [DOI] [PMC free article] [PubMed] [Google Scholar]
- 45.van der Kloot W. The kinetics of quantal releases during end-plate currents at the frog neuromuscular junction. J Physiol (Lond) 1988b;402:605–626. doi: 10.1113/jphysiol.1988.sp017225. [DOI] [PMC free article] [PubMed] [Google Scholar]
- 46.von Gersdorff H, Schneggenburger R, Weis S, Neher E. Presynaptic depression at a calyx synapse: the small contribution of metabotropic glutamate receptors. J Neurosci. 1997;17:8134–8146. doi: 10.1523/JNEUROSCI.17-21-08137.1997. [DOI] [PMC free article] [PubMed] [Google Scholar]
- 47.Vorobieva ON, Hackett JT, Worden MK, Bykhovskaia MK. Evaluation of quantal neurosecretion from evoked and miniature postsynaptic responses by deconvolution method. J Neurosci Methods. 1999;92:91–99. doi: 10.1016/s0165-0270(99)00101-6. [DOI] [PubMed] [Google Scholar]
- 48.Walmsley B, Alvarez FJ, Fyffe RE. Diversity of structure and function at mammalian central synapses. Trends Neurosci. 1998;21:81–88. doi: 10.1016/s0166-2236(97)01170-3. [DOI] [PubMed] [Google Scholar]
- 49.Wu LG, Borst JG. The reduced release probability of releasable vesicles during recovery from short-term synaptic depression. Neuron. 1999;23:821–832. doi: 10.1016/s0896-6273(01)80039-8. [DOI] [PubMed] [Google Scholar]
- 50.Yamada KA, Tang CM. Benzothiazides inhibit rapid glutamate receptor desensitization and enhance glutamergic synaptic currents. J Neurosci. 1993;13:3904–3915. doi: 10.1523/JNEUROSCI.13-09-03904.1993. [DOI] [PMC free article] [PubMed] [Google Scholar]
- 51.Yawo H, Momiyama A. Re-evaluation of calcium currents in pre- and postsynaptic neurons of the chick ciliary ganglion. J Physiol (Lond) 1993;460:153–172. doi: 10.1113/jphysiol.1993.sp019464. [DOI] [PMC free article] [PubMed] [Google Scholar]
- 52.Yazejian B, DiGregorio DA, Vergara JL, Poage RE, Meriney SD, Grinnell AD. Direct measurements of presynaptic calcium and calcium-activated potassium currents regulating neurotransmitter release at cultured Xenopus nerve–muscle synapses. J Neurosci. 1997;17:2990–3001. doi: 10.1523/JNEUROSCI.17-09-02990.1997. [DOI] [PMC free article] [PubMed] [Google Scholar]


